Embed Size (px)
Citation preview

—
NOVEMBER 19, 2020
Capital Markets Day 2020Björn Rosengren, CEO Timo Ihamuotila, CFO
—

—Important notices
November 18, 2020 Slide 2
This presentation includes forward-looking information and statements including statements concerning the outlook for our businesses. These statements are based on current expectations, estimates and projections about the factors that may affect our future performance, including global economic conditions, and the economic conditions of the regions and industries that are major markets for ABB Ltd. These expectations, estimates and projections are generally identifiable by statements containing words such as “expects,” “believes,” “estimates,” “targets,” “plans,” “outlook,” “on track,” “framework” or similar expressions.
There are numerous risks and uncertainties, many of which are beyond our control, that could cause our actual results to differ materially from the forward-looking information and statements made in this presentation and which could affect our ability to achieve any or all of our stated targets. The important factors that could cause such differences include, among others:
– business risks associated with the volatile global economic environment and political conditions
– costs associated with compliance activities
– market acceptance of new products and services
– changes in governmental regulations and currency exchange rates, and
– such other factors as may be discussed from time to time in ABB Ltd’s filings with the U.S. Securities and Exchange Commission, including its Annual Reports on Form 20-F.
Although ABB Ltd believes that its expectations reflected in any such forward-looking statement are based upon reasonable assumptions, it can give
no assurance that those expectations will be achieved.
Some of the planned changes might be subject to any relevant I&C processes with the Employee Council Europe and/or local employee representatives/employees.
This presentation contains non-GAAP measures of performance. Definitions of these measures and reconciliations between these measures and their US GAAP counterparts can be found in the “Supplemental Reconciliations and Definitions” section of “Financial Information” under “Quarterly results and annual reports” on our website at www.abb.com/investorrelations. Reconciliations can be found on the website under “Capital Markets Day 2020”.
Slide 2

——
—Our world

—
Leading technologies
No. 1-2 in most of
our segments
Exposure to strong
long-term market trends
Slide 4
›
—A good foundation to build on

—
Exposure to strong long-
term market trends
FlexibilityReshoring, diversification,
regionalization at forefront due to new technologies and policy environment
Increased electricity
consumption1/3rd of world’s
electricity consumed by electric motors
SustainabilityESG in focus with
strong drivers from regulations, financials
and shareholder value
UrbanizationGlobally increasing
energy consumption drives development
of smart cities
Shift to electrification
Electricity demand grows 2x faster than other energy sources
Digitalization & e-commerce
Focus on solutions, data analytics (incl. AI),
connected factory data
Labor shortageAging population drives demand for automation.
25% of China’s population +60 years
in 2030
Automation & robotization
Maximum productivity, quality, flexibility and
simplicity
Slide 5
—Well aligned to supportive mega-trends

—
Slide 6 Source: McKinsey Global Business Executive Survey, July 2020 (n = 800)Slide 6
85% of companies have accelerated
digitalization
67% of companies
have accelerated automation and
artificial intelligence
—Pace of change accelerating
—[PPT Team:] Alternative version
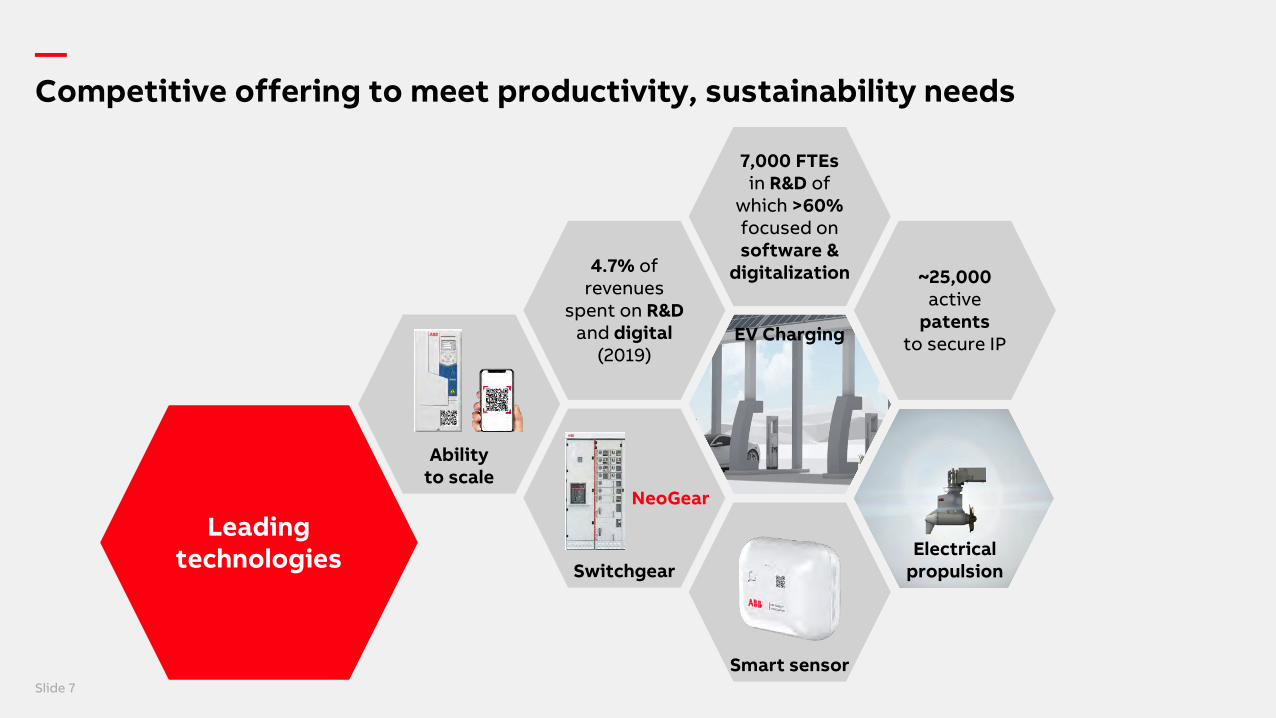
of the previous slide—Competitive offering to meet productivity, sustainability needs
Leadingtechnologies
4.7% of revenues
spent on R&D and digital
(2019)
~25,000 active
patentsto secure IP
Switchgear
7,000 FTEs in R&D of
which >60% focused on software &
digitalization
Ability to scale
Smart sensor
EV Charging
Slide 7
NeoGear
Electrical propulsion

—Investing for sustained technology leadershipFocused R&D spend by businesses throughout economic downturn, +3.6% yoy1
November 18, 2020 Slide 81. Non-order related R&D expenses across business areas only, 9M 2020
Right-sized according to need(ABB divisional R&D as % revenues1)
Advanced capability supported by extensive innovation ecosystem
Ranging from…1.1%
… to~10%
More digitally focused
~1,500 inventions in 2019
Non-exhaustive
>100 universities
Ventures
Partners
Northvolt
Covariant
Hailo
Ericsson
Slide 8

—
November 18, 2020Slide 9
~2/3rds
of revenuesfrom segments in
No. 1–2 position
Strong domain expertise
builds customer relationships
Electrification Global #2
#1 medium voltage #2 low voltage
#1 EV fast-charging #2 installation
products
Industrial Automation
Global #2#1 DCS & process
automation solutions #1 turbocharging
#1 process analytics #1 excitation
#1 marine
Robotics & Discrete Automation
Global #2#2 robotics
#5 automation
MotionGlobal #1
#1 motors#1 drives
—Trusted by customers
No. 1-2in most of our
segments

—No. 1–2, now and in the future
November 18, 2020 Slide 10
Divisions have the insightcustomer needs vs customer offering
Organic growth Acquired growth
– Innovation through customer collaboration
– Focused investments in R&D, sales and service
– Continuous improvements
– Go-to-market
– Selective portfolio bolt-ons
– Capabilities, know-how
– Increase speed
Mandate and accountability in the divisions→
Slide 10

—Stability, profitability before growth
November 18, 2020 Slide 11
Op.
EB
ITA
mar
gin
Divisional strategic mandate (from H2 20)
Size of bubble indicates $ mn revenues. 20 divisions illustrated, as per structure effective January 1, 2021
GrowthHigher margin/return
ProfitabilityImprove margin/return
StabilityFix the structure
Key
Industrial Automation
Robotics & Discrete Automation
Motion
Electrification
1. Under structure effective January 1, 2021 (20 divisions)2. Under 2020 structure (18 divisions)3. Management estimate on comparable basis (excl. GEIS)
Growth
12 divisions1, of which
37% of revenues 192 (7 divisions) with proven growth track record
of +5.0% revenue CAGR 16-193
Stability | Profitability
8 divisions1
52% of revenues 192
with 10.4% Op. EBITA margin 19
Slide 11

—
November 18, 2020 Slide 12
—
Leading technology and
positions to support long-term market
trends …
… near-term uncertainty
due to COVID-19
Slide 12

—Elevated uncertainty due to COVID-19
Slide 13
Manufacturing PMI Global PMIs by end-market Industrial production
30
35
40
45
50
55
60
65
USGlobal
JapanChinaEurozone
expansion
contraction
Jan-15
Food & Beverage
Machinery & Equipment
Forestry & PaperConstruction MaterialsTechnology Equipment
Chemicals
Auto incl. Parts
Metals & Mining
Oct-20
35
40
45
50
55
60
30Jan-17 Oct-20
70
80
90
100
110
Jan-19 Jul-19 Jan-20 Jul-20
US Euro Area China

—Long-term market fundamentals intactCOVID-19 recovery scenario: “swoosh”
November 18, 2020
Slide 14
Estimated addressable market(In $ bn)
326
361
325
377
2023E2019 20202016
~2.1%~5.1%
Unchanged near-term outlook
Q4 orders and revenue growth rate to remain challenged year-on-year, revenue growth rate to decline sequentially
Operating margins expected to be higher year-on-year
Resilient cash delivery for the full year
CAGR:
Slide 14 Source: Management estimates

—Strong momentum for changeActivities completed Q1 2019 – Q2 2020
November 18, 2020 Slide 15
Mandate and accountability for operating decisions to business areas and divisions
Dismantling of country organization and reduction of central costs
Ongoing business transformation
Operating decisions close to customers Net -10,000 FTE reductionfrom reducing corporate functions /
transfer to operations (incl. PG)
Successful remedial actions for ~$3bn revenues under review / transform
Slide 15
$500 mn p.a. net savings reached(ABB-OS simplification program, Q1 19-today)
$470 mn productivity savings(gross opex and supply chain management, Q1 19-Q2 20)
transparency • accountability • speed
45 sites closed across group

—The ABB Way – select number of common processesThe “glue” of the Group; who we are and how we act
November 18, 2020 Slide 16
ABB Purpose
Values
People
Leadership
Positioning
Reputation management
Code of conductInternal control & compliance
Risk management Regulations,
processes and policies
Decentralized setup – full Division accountability
Performance management
Portfolio management
Slide 16

—
We succeed by creating superior value.
We push the boundaries of technology to drive performance to new levels.
We energize the transformation of society and industry to achieve a more productive, sustainable future.
—Addressing the world’s energy challenges
—Creating success
—Transforming industries
—Embedding sustainability
—Leading with technologySlide 17
—ABB Way – performance with purpose
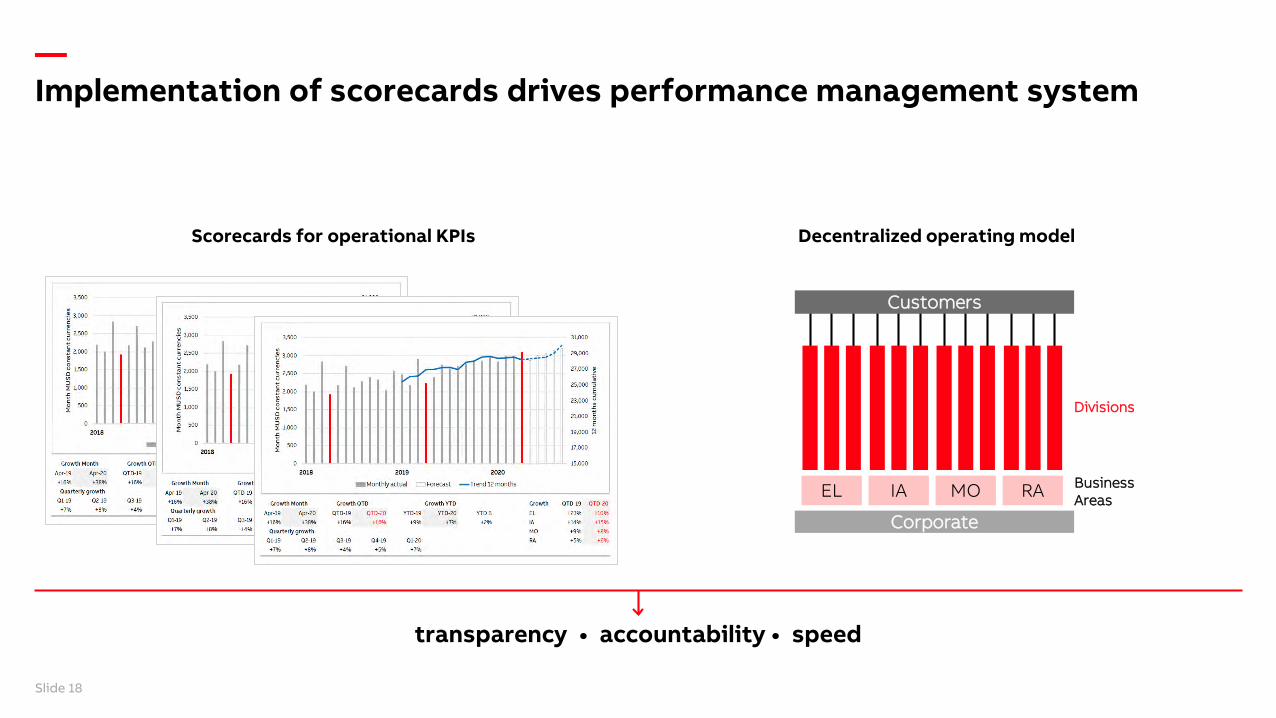
—Implementation of scorecards drives performance management system
November 18, 2020 Slide 18
Scorecards for operational KPIs Decentralized operating model
Business Areas
Divisions
EL IA MO RA
Corporate
Customers
Slide 18
transparency • accountability • speed
—
November 18, 2020 Slide 19
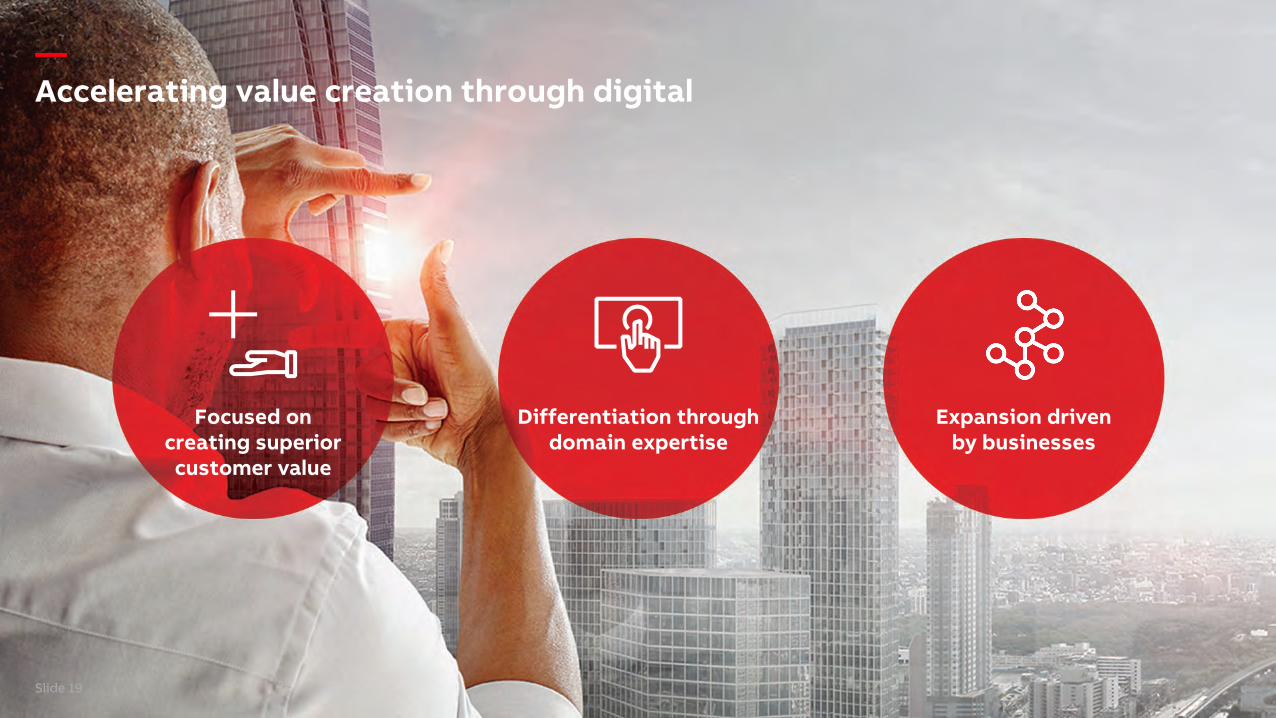
__—Accelerating value creation through digital
Slide 19
Expansion driven by businesses
Differentiation throughdomain expertise
Focused on creating superior
customer value

—Digital strategy focused on creating superior customer value
Traditional offering
Abi
lity™
pla
tfor
m
Software-enabled products & systems
Software &digital services
+
+
Slide 20
Comprehensive offering, modular infrastructure
↑↑↑
↑↑
↑
↑ Indicative growth rate
Tangible customer benefits

—
Slide 21
>30% 3yr organic CAGR insoftware & digital revenues in IA1
~2,300 customers in sector-specific Collaborative Operations™
>30% 2yr CAGR in connected robots96% of installations use RobotStudioGrowth strategy by target sectors and scalable, modular application cells
EL software-enabled products3 mn connected, 10 mn connectableSoftware configured to need (e.g. energy management)
>60% large drives sold are connected>30k smart sensor installed base in MOSoftware configured to specific customer use-cases
ABB’s differentiationthrough domain expertise
Positive value drivers
Business examples
Differentiation and value creation through domain expertise
All data management estimates. 1. Ability™ branded offering and software only, not including digitally enabled devices
Software & digital services scales by sector and drives new revenue streams
Higher embedded software content drives higher gross margin
Greater pull-through of traditional offering
Deep understanding of customers’ needs & operations through
– Large installed base(e.g. DCS, robots, drives)
– Global leadership position in many sectors
– Decades-long history in sector-focused approach to creating customer value with automation, electrification and motion

—Expansion driven by businessesAccelerated execution planned
November 18, 2020 Slide 22
Divisions and business areas in leadSpeed and closeness to customer paired with focused scaling of capabilities
ABB Ability™ solutions portfolioUnifying brand; lean and modular platform
Software and digital enable value-based pricing and sustainable productivity offering
Focus on accelerated commercialization and scaling of existing software and digital offering
E-commerce and digital customer interaction
Slide 22
Focused investment
Positive value drivers
Clear execution agenda
Higher quality revenues
Double-digit software & digital services growth ambition
Improved margins
↓Superior returns
R&D and digital spend ~5% of revenues p.a.
+
Strategic partnerships
+
Bolt-onacquisitions

—Review of business portfolioContinuous process through defined evaluation categories
November 18, 2020 Slide 23
How attractive is this division on its own?
What is its full value creation potential to ABB?
How does this division fit within ABB?
Strategic attractiveness
Value creation potential
Fit within ABB
Is ABB the best owner?
Slide 23

—Active portfolio management Three divisions to be exited, maximizing value
November 18, 2020 Slide 24
Combined revenues ~$1.75 bn p.a., ~6% of group
High quality divisions, Operational EBITA margins above group corridor
ABB is not the best owner to drive businesses to full potential
Full value and deal certainty more important than timing
Power Conversion, ~3% of Electrification BA~$375 mn revenues 2019
Top 5 position as supplier of power conversion products, >75% to telecoms and data centers; >75% in Americas
Mechanical Power Transmission, ~9% of Motion BA~$575 mn revenues 2019
Top 5 position as supplier of mounted bearings, enclosed gearing and other components to multiple end-markets; >90% in Americas
Turbocharging, ~12% of Industrial Automation BA~$800 mn revenues 2019
#1 position, providing turbochargers and services; ~50% to marine; ~75% services; ~50% in Europe
Slide 24
→

—
November 18, 2020Slide 25
Further optimization of operational structureEffective January 1, 2021
Divisions
Business areas
Energy Industries
Process Industries
Marine & Ports
Measurement & Analytics
Turbocharging
Process Automation Motion
Distribution Solutions
Smart Power
Smart Buildings
Installation Products
Power Conversion
Electrification
Robotics
Machine Automation
Robotics & Discrete Automation
Large Motors and Generators
IEC LV Motors
NEMA Motors
Drive Products
Systems Drives
Service
Traction
Mechanical Power Transmission
New business area name New divisional structure
Slide 25

—
NOVEMBER 19, 2020
Capital Markets Day 2020Timo Ihamuotila, CFO
—
—
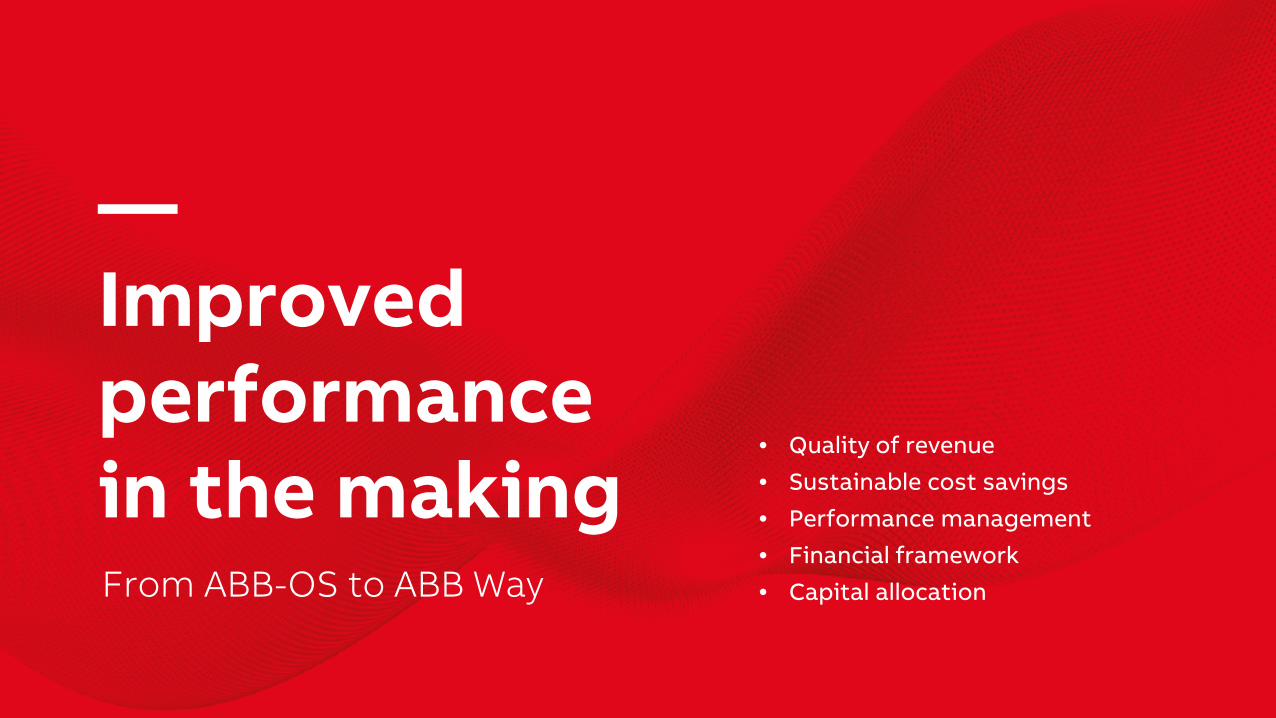
—Improved performance in the making
• Quality of revenue
• Sustainable cost savings
• Performance management
• Financial framework
• Capital allocationFrom ABB-OS to ABB Way

—Driving quality of revenue
Increased exposure to distributorsMore short-cycle
+9% revenue CAGR 2016–19 from all ABB distributor channels
ABB EL + GEIS doubled position in US distributors market to 40%
Expansion in digitalBetter differentiation
>60% R&D employees focused on digital and software innovations
>30% revenues CAGR 2016-19 in software & digital (IA only)
F&B WWW Datacenters
Buildings Marine
> Double digit revenue CAGR 2016–19
Focus on high-growth segmentsNotable successes
Slide 28
Less EPCContinued ramp down
Large orders ~5% of group, majority now <$50 mn
65% ABB content in large orders 2019 (min. 60% target)
Non-core revenues <$15 mnp.a. (~$650 mn 2017)
<10 non-core projects in execution (from >200)
EV charging
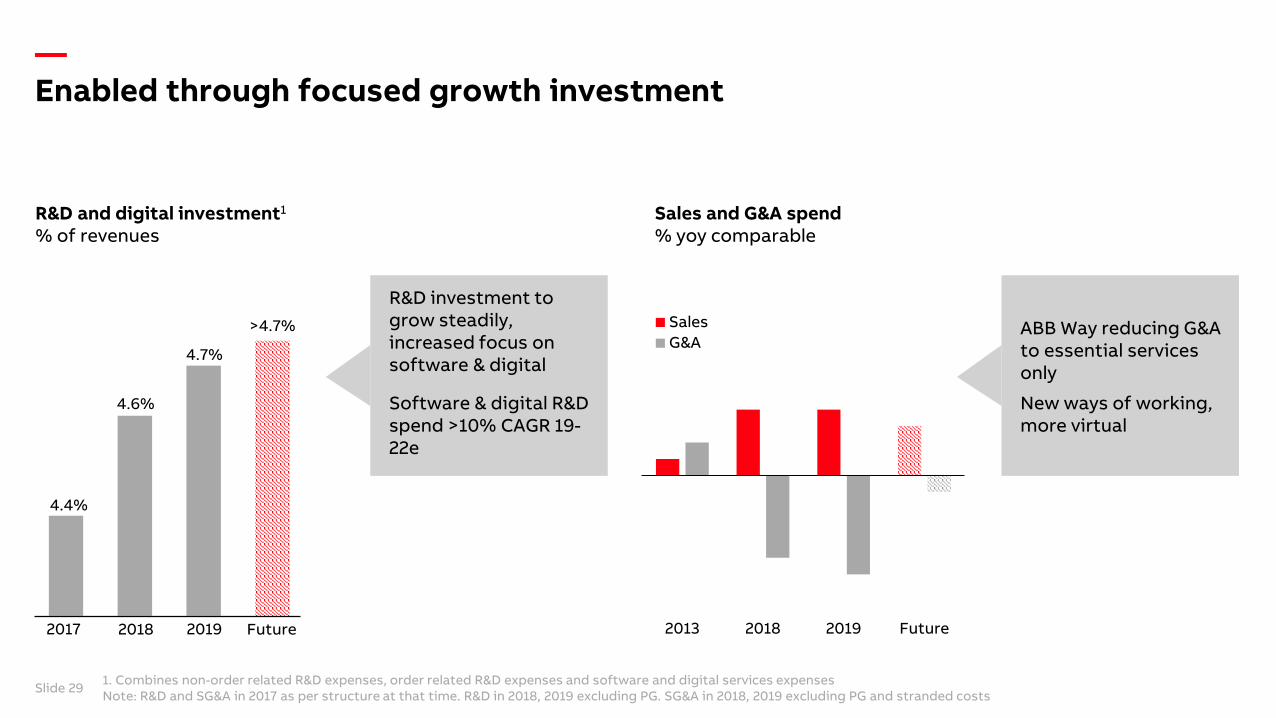
—Enabled through focused growth investment
November 18, 2020 Slide 29
R&D and digital investment1
% of revenuesSales and G&A spend% yoy comparable
2013 2018 2019 Future
SalesG&A
>4.7%
4.6%
4.4%
2017 2018 Future2019
4.7%
Slide 29 1. Combines non-order related R&D expenses, order related R&D expenses and software and digital services expensesNote: R&D and SG&A in 2017 as per structure at that time. R&D in 2018, 2019 excluding PG. SG&A in 2018, 2019 excluding PG and stranded costs
R&D investment to grow steadily, increased focus on software & digital
Software & digital R&D spend >10% CAGR 19-22e
ABB Way reducing G&A to essential services only
New ways of working, more virtual

—
Slide 30
Sustainable cost reduction$500 mn run-rate savings target achieved ahead of plan
ABB-OS savings target deliveredCost reductions breakdown
Corporate and other costs head toward ambitionLean corporate: Operational EBITA bridge
Sales20%
Other
Corporate /Functions
BusinessArea
G&A70%
Type Area
$0.8 bn
2018Corporateand other
2023ECorporate and other
Strandedcosts
ABB WayABB-OSsavings
~$0.3 bn
Ongoingcorporate
$0.4 bn
Ongoingcorporate
$0.5 bn
2019Corporateand other
$1.1 bn
Ongoingcorporate
Slide 30
Non-core
COVID-related costs mitigation efforts excluded
G&A reductions ~70%
R&D, digital investments safe-guarded
Restructuring and implementation costs of $450 mn
Ongoing corporate costs to ~$300 mnfrom 2021
Non-core ramp down

—Lean corporate
Decentralization with ABB-OSPast headcount development
Continued right-sizing with ABB WayProjected headcount development
Corporate /Functions1
~18 k employees
Pre ABB-OS End H1 20
Corporate ~1.3 k
To businessareas
Left ABB(incl. PG carve-out)
End H1 End 20E Future
~1.3 k
~0.9 k
Slide 31
<0.9 k
H2 20 step change reflects further transfers to businesses and reductions
Future status driven by right-sized corporate functions
Implementation led by business areas
Knowledge transfer ensured on local and global level
1. Pre-allocations

—
Slide 32 1. Assumes current MoUs executed
Minimizing legacy impactsNon-core ramp down largely complete
Until end 2020
Non-core business activities
<10 projects in execution, from >200
Operational EBITA charges ~$700 mnsince announced exit (Q4 17)
2021 onwards
Non-core business activities
2 main operational exposures ongoing, below ~$300 mn1
Timing of exits depends on legal proceedings; could be later than original plan for end 2021
Other obligations
Kusile project (IA): proposed settlement with Eskom in S. Africa
Divested assets: increased warranty provisions related to Steel Structures disposal, reflected in ~$150 mn charge
Other obligations
Kusile project: regulatory proceedings outside S. Africa not estimable
Divested assets: targeting Steel Structures settlement during 2021
Power Grids transaction related obligations covered by $300 mn escrow
Non-operational charges $75 mn Further non-operational charges possible
Systematic effort to exit as soon as practicable
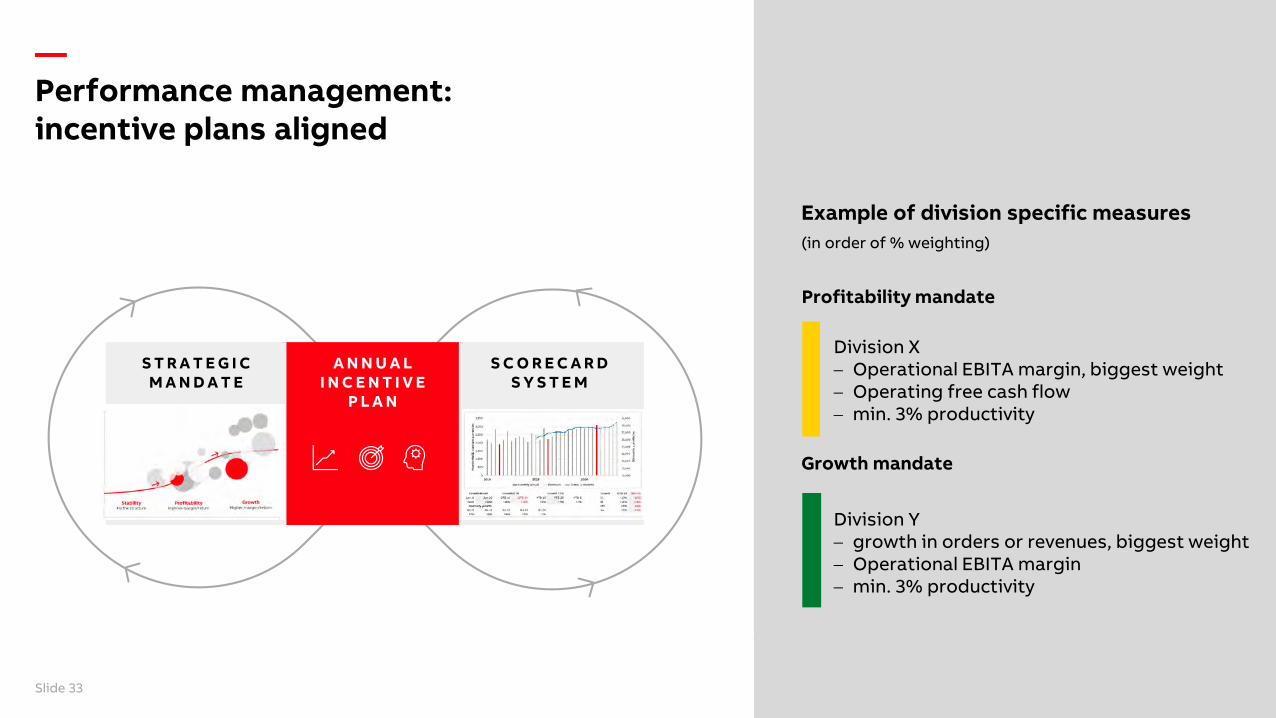
—Performance management: incentive plans aligned
FTE = Full time employee
Profitability mandate
Division X– Operational EBITA margin, biggest weight– Operating free cash flow– min. 3% productivity
Example of division specific measures(in order of % weighting)
Growth mandate
Division Y– growth in orders or revenues, biggest weight– Operational EBITA margin– min. 3% productivity
A N N U A LI N C E N T I V E
P L A N
S T R A T E G I CM A N D A T E
S C O R E C A R DS Y S T E M
Slide 33
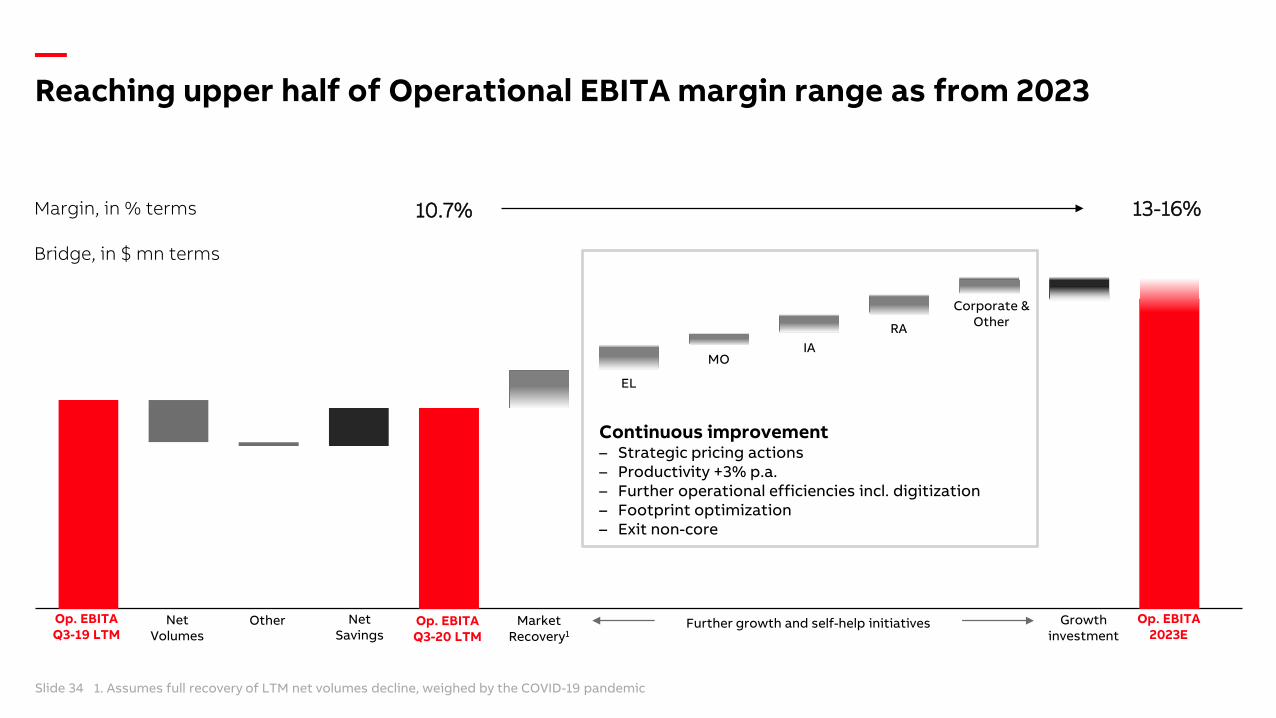
—Reaching upper half of Operational EBITA margin range as from 2023
Q2 2020 results Slide 34
Op. EBITAQ3-19 LTM
NetSavings
Op. EBITA2023E
Slide 34
10.7%
Bridge, in $ mn terms
13-16%
Other Further growth and self-help initiativesOp. EBITAQ3-20 LTM
MarketRecovery1
NetVolumes
Growthinvestment
Continuous improvement– Strategic pricing actions– Productivity +3% p.a.– Further operational efficiencies incl. digitization– Footprint optimization– Exit non-core
Margin, in % terms
1. Assumes full recovery of LTM net volumes decline, weighed by the COVID-19 pandemic
EL
MOIA
RA
Corporate &Other

—Improving cash generationTransformation burdens diminish
November 18, 2020 Slide 35Slide 35
Cash flow from operating activities
Improved profitability from businesses
Granular NWC management: DS0, DPO, DIH
Fewer one-time charges
Efficient tax management
Cash flow from investing activities
Steady capex, despite increasing top-line
Cash flow from financing activities
Interest expenses decline once optimization program completes
0 1000 2000
2018
2019
2020
($ mn)
Historic development in cash flow from operating activities
9M
9M
9M
Pension impact (FY20e)
Transformation impacts(e.g. ABB-OS, PG carve-out, 9M 20)
Future cash drivers
Q4
Q4
Cash flow from operating activities, continuing1
↑↑ ↑ ↑
Meaningful uplift 2021 onwards1. Excludes cash flow from operating activities in discontinued operations

—Enhanced systematic portfolio managementTransformation, acquisitions, divestments
November 18, 2020 Slide 36
→CO
RE
Strategic attractiveness
Value creation potential
Fit within ABB
LE
SS
CO
RE
→
Today’s announcements
5+ small to mid-size (bolt-on) acquisitions p.a.
Divisions with growth mandates to accelerate growth, fill portfolio gaps
→ Continuous improvement and/or portfolio management
Within division activities where a step-change in performance is required, or exit
Aim to exit 3 divisions with ~$1.75 bn revenues p.a.
EL Power Conversion, MO Mechanical Power Transmission, IA Turbocharging
Robotics
Division …
Drive Products
Power Conversion
Smart Power
Division …
Division …
Division …
Slide 36

—Financial framework
November 18, 2020 Slide 37Slide 37 1. Calculated to exclude FX impacts and transformational acquisition and divestments, includes bolt-on acquisitions and divestments within divisions
Guidance
3-5% annual average through economic cycle1
Group 13-16%
Electrification 15-19%
Industrial Automation 12-16%
Motion 15-19%
Robotics & Discrete Automation 13-17%
Medium term ambitions
~2/3 comparable, ~1/3 inorganic
Upper half of range as from 2023
Revenue growth
Operational EBITA margin corridor
New or revised guidance / ambition
ROCE
FCF conversion to net income
Basic EPS growth
15-20%
~100%
EPS growth > revenue growth
Steady improvement
Maintain solid track record
Effective tax rate ~25% as from 2023
EPS rising strongly due to capital structure optimization program

—Financial framework: 3-5% growth through cycleIncreased divisional mandate and accountability to drive growth
November 18, 2020 Slide 38
3-5%1 annual averageREVENUE GROWTH
through economic cycle
Excluding foreign exchange impacts and acquisitions and divestments
Clear acquisition criteria:– Synergistic with core– Return > WACC after year 3– EPS accretive after year 1
Comparable ~2/3 of totalE.g.
– Focus on high growth segments– Continued innovation, expansion in digital– Partnerships and channel optimization
Slide 38
Inorganic ~1/3 of total– Bolt-on acquisitions and divestments within
divisions
1. Calculated to exclude FX impacts and transformational acquisition and divestments, includes bolt-on acquisitions and divestments within divisions
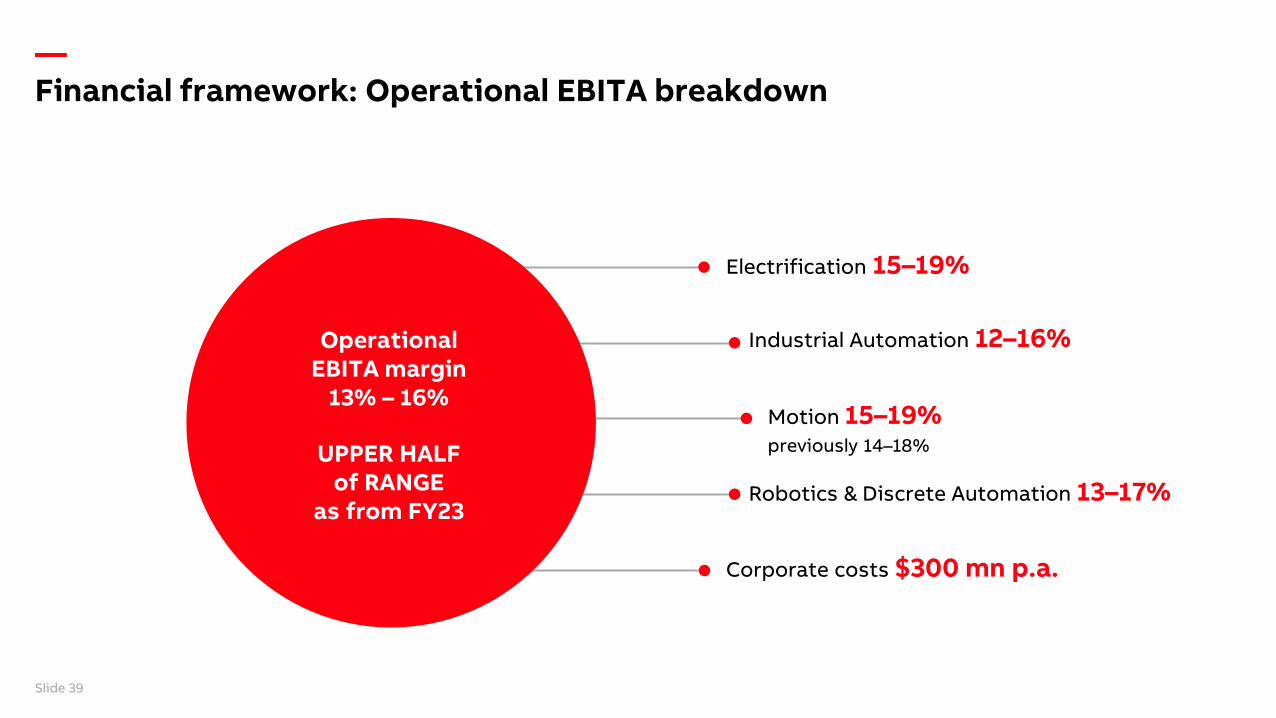
—Financial framework: Operational EBITA breakdown
November 18, 2020 Slide 39
Electrification 15–19%
Industrial Automation 12–16%
Robotics & Discrete Automation 13–17%
Corporate costs $300 mn p.a.
Motion 15–19%previously 14–18%
Slide 39
OperationalEBITA margin
13% – 16%
UPPER HALF of RANGE
as from FY23

—
Cash in Uses of cash
Capital allocation priorities
June 10, 2020 Slide 40
Proceeds from asset sales
Dividends
Capex
Additional cash
Operating cash
Incl. share buyback
2020–22 illustrative
Balancing sources and uses of cash medium-term Attractive returns to shareholders
Capital allocation priorities unchanged
Fund organic growth, R&D, capex at attractive returns
Rising sustainable dividend per share
Value-creating acquisitions
Returning additional cash to shareholders
Capital structure optimization program underway
$7.6-7.8 bn capital return, funded by PG sale proceeds
Efficient deleveraging via pension plan transfers
Significant repayments of debt, credit facilities(-$6.1 bn lower gross debt today vs end Q1 20)
Slide 40
Target to manage ABB long-term with an efficient balance sheet to retain “single A” credit rating

—Improved performance in the makingCFO summary
November 18, 2020 Slide 41Slide 41
PORTFOLIO MANAGEMENT CAPITAL ALLOCATIONOPERATIONAL PERFORMANCE
Quality of revenues to improvePrioritizing margin expansion, all BAs contributing, corporate costs to reach $300 mn run-rateIncentives aligned to strategy, performance, at divisional level
$500 mn net savings p.a. realized through ABB-OS
Systematic evaluation continues
Activity within divisions to step-up:– 5+ small to mid-size bolt-on
acquisitions per year– Continuous improvement and/or
portfolio management in the divisions
3 divisions, with ~$1.75 bn revenues p.a., to exit
ABB Way drives future value creation
Meaningful uplift in cash generation from 2021
Capital allocation priorities and planned return of PG proceeds unchangedSteady capex, ~$750 mn p.a., focused growth investment in R&D, salesBolt-ons, predominantly funded by businesses
Target “single A” credit rating long-term
Group Operational EBITA margin in upper half of range as from 2023

—
November 18, 2020 Slide 42
—Acknowledged history in sustainability, with a new level of ambition
We enable a low-carbon society
We preserve resources
We promote social progress
INTEGRITY AND TRANSPARENCY
Rooted in Purpose, embedding sustainability across all aspects of value chain
Slide 42

——Sustainability targets Contributing to 17 UN Sustainable Development Goals
Ambitious targets as key element in long-term value creation
Systematic, measurable approach based on topics of material importance to stakeholders
Accountability and incentive plans driving action
I N T E G R I T Y A N D T R A N S P A R E N C Y
We enable a low-carbon society
We preserveresources
We promotesocialprogress
Slide 42a

——Main sustainability targets Striving to achieve all targets by 2030
We enable alow-carbon society
– Carbon neutrality in own operations
– Support our customers in reducing annual CO2 emissions by >100 Mt1
– Supply chain emission reduction
We promotesocial progress
– Zero harm to our people and contractors
– Comprehensive D&I framework3; 25% women among ABB leaders
– Top-tier employee engagement score in our industry
– Impactful support for community-building initiatives
We preserveresources
– 80% of ABB products & solutions covered by circularity approach
– Zero waste to landfill2
– Supplier Sustainability Framework
INTEGRITY AND TRANSPARENCY ACROSS OUR VALUE CHAIN
SOCIETY
ABB
CUSTOMER
SUPPLIER
Sustainable Value Chain
1. Savings in the year 2030 from solutions provided to customers 2021-302. Wherever local conditions allow
3. Diversity & Inclusion frameworkSlide 44
—
Clear profitability focus for underperforming divisionsStability and profitability before growth
Active portfolio management3 divisions to be exited, maximizing value
Improved performance in the makingCEO summary
Slide 45
Domain expertise remains key to digital differentiationAccelerated expansion of software and digital solutions, driven by businesses
Clear, ambitious financial framework and sustainability targetsSustainable value creation embedded
Slide 45