Embed Size (px)
Citation preview

Bit-Length Expansion for Digital Images
TOMOAKI KIMURA1 and AKIRA TAGUCHI21Kanagawa Institute of Technology, Japan2Musashi Institute of Technology, Japan
SUMMARY
Bit-length of digital images is decided by the Analog-to-Digital (AD) converter. The bit-length expansion tech-nique is necessary for high-quality displays such as theliquid crystal display (LCD) and the plasma display. Bit-length expansion is also necessary for low-bit length im-ages, which are degraded by the pseudo-contour. In thispaper, we propose a bit-length expansion method fromM-level to N-level [N = 3(M – 1) + 1]. This operation meansthat two quantization levels are introduced between exist-ing levels. The bit-length expansion method results in theestimation problem of an error image between an M-level’simage and an N-level’s image. The error image is the patternimage which consists of three values. We show the estima-tion method of the three values pattern image and that theproposed method can remove the pseudo-contour of digitalimages through several application results. © 2009 WileyPeriodicals, Inc. Electron Comm Jpn, 92(10): 32–40, 2009;Published online in Wiley InterScience (www.interscience.wiley.com). DOI 10.1002/ecj.10105
Key words: quantization; pseudo-contour; analog-to-digital conversion; bit-length.
1. Introduction
Conversion of analog signals into digital signals in-volves two operations, sampling and quantization [1]. Sam-pling is the discretization of signals in time or space, whilequantization is the discretization of the signal amplitude. Ifthe sampling interval is set so as to satisfy the samplingtheorem, the information carried by a band-limited analogsignal is fully guaranteed. On the other hand, althoughKoshimizu and colleagues have investigated a quantizationtheorem [2, 3], no clear theory has been established yet.
When the quantization level is set too high in imagesignal processing, pseudo-contours are known to occur. Invarious image-coding schemes such as JPEG and MPEG,too, pseudo-contours occur if the compression rate is set toohigh because data compression is achieved by increasingthe quantization level. It is desirable to eliminate suchpseudo-contours by expanding the bit length (grayscale)when storing, transmitting, and displaying image data.
The increasingly popular liquid crystal and plasmadisplays offer resolutions of 10 bits or higher, resulting ina need to expand 8-bit images to 10 or more bits. Bit-lengthexpansion is now implemented by simply padding the leastsignificant bits with zeros [4], or with copies of the mostsignificant bits [5]. However, such an approach does notallow the high display capability to be fully utilized. Thus,bit-length expansion should provide results close to thoseobtained by 10-bit or higher quantization of continuous-amplitude signals in the initial stage. This necessity is alsomade clear in Ref. 6.
In the present study, we propose a method of bit-length expansion processing: specifically, a method of ex-panding image signals with M gray levels to N [= 3(M – 1)+ 1] levels. This involves inserting two new quantizationlevels between the existing ones.
The signals at the existing M levels are to be dividedappropriately between the newly inserted upper and lowerlevels. That is, with ∆ denoting the difference between anexisting level and a newly inserted level, N-level imagesignals are obtained by adding +∆, 0, or –∆ to M-level imagesignals. Therefore, the problem reduces to an algorithm forestimation of a ternary image (error image), consisting ofthe difference between the N-level image and the M-levelimage. Assuming bit-length expansion from 8 bits to 10bits, the existing quantization levels cannot be kept, and thesignals must be converted to all new levels, which is adifficult problem.
In the proposed method, M-level image signals areprocessed by the ε-filter [5] to expand the grayscale aboveN levels (creation of pseudo-analog signals). When the filter
© 2009 Wiley Periodicals, Inc.
Electronics and Communications in Japan, Vol. 92, No. 10, 2009Translated from Denki Gakkai Ronbunshi, Vol. 128-C, No. 3, March 2008, pp. 484–492
Contract grant sponsor: MEXT Grant-in-Aid (C-18500140).
32

window involves abrupt variations, pseudo-analog signalsdepart considerably from the original analog signals withmean filters or other filters of this sort, and therefore, theε-filter is employed to avoid this problem. Then an N-levelimage is obtained by N-level requantization of the pseudo-analog signals; however, pixel values are changed in filterprocessing, and there are pixels that are different from theoriginal M-level image pixels by more than ∆. Since thisresults in blurring, the error with respect to the originalM-level image must be kept within ∆.
In addition, the appropriate length of filter window toprovide correct bit-length expansion is location-dependent.That is, the filter window should be made narrow near edgesso as to preserve the signal shape. On the other hand, in thecase of the background and other slowly changing portions,the original quantization levels remain unaltered, andpseudo-contours may occur unless the filter window is setwide. Thus, we set the filter window narrow near edges andfine details, but wide in a monotonic background. In addi-tion, we propose a method of determining the appropriatewindow length.
2. Bit-Length Expansion of Digital Image
2.1 Quantization and quantization noise
When analog signals are converted into digital sig-nals, one must perform sampling (time or space discretiza-tion) and quantization (amplitude discretization). Here wegive explanations of quantization.
Quantization is a procedure to represent the analogsignal amplitude by a finite predefined number (M) ofquantization levels. Either truncation or round-off can beapplied in this process. As regards the quantization interval,linear quantization assumes equal intervals, while non-linear quantization employs unequal intervals so as to mini-mize quantization effects (distortion). In this study, weconsider only round-off and linear quantization.
Let s(i) denote the discrete-time signal obtained bysampling of an original analog signal, and let x(i) denotesits maximum-normalized value. Since we assume imagesignals, the amplitude is a nonnegative integer value. WithQM[⋅] denoting the M-level quantization operator, the quan-tization of s(i) at M levels can be expressed as follows:
The quantization step-width ∆M is
Therefore, the quantization noise e(i) is
The noise is distributed uniformly across the variance range[–∆M/2, ∆M/2] [7].
2.2 Bit-length expansion
According to the procedure explained in Section 2.1,let us consider increasing the number of quantization levelsfor the signal xM(i) = QM[x(i)]. Suppose that the existingquantization levels are preserved, while two new levels areadded between existing levels, as shown in Fig. 1. As aresult, the number of quantization levels (gray levels) isincreased from M to N [= 3(M – 1) + 1]. The objective ofthis study is to propose a method of estimating the signalxN(i) obtained by N-level quantization of an original analogsignal from a signal xM(i) having fewer quantization levels.Estimation of xN(i) from xM(i) reduces to estimation of theerror between the two signals. The error between twosignals can be +∆M/3, 0, or –∆M/3, which must be deter-mined for each pixel. The basic procedure of bit-lengthexpansion is shown below. For simplicity of explanations,we deal with a one-dimensional signal representation; how-ever, the present study assumes application to image sig-nals.
(Step 1)Filtering is applied to the signal xM(i) quantized at M
levels:
Here F[⋅] denotes filter processing.(Step 2)The signal x
_(i) obtained by filtering has a pseudo-
continuous amplitude. Thus, the signal x_
N(i) is obtained byquantization at N levels.
(Step 3)The signal x
_N(i) quantized at N levels is transformed
into x_
M(i) by reducing the number of levels to M.
(2)
(3)
(1)
(4)
Fig. 1. Bit-length expansion.
33

(Step 4)From the signal xM(i) quantized at M levels, the
estimate of the N-level expanded signal x̂N(i) is found asfollows:
In the above procedure, the filtering at Step 1 requiressome elaboration, which is explained in Section 2.3 andlater. Here we explain why we add just two levels to theexisting ones, and elucidate the meaning of Step 4.
Let us compare the insertion of one new level and twonew levels between existing quantization levels. The quan-tization levels of xM(i) are shown in Fig. 2(a), and Fig. 2(b)shows the quantization levels of x
_N(i) obtained in Step 2.
Figure 2(c) shows the quantization levels of the M-levelsignal x
_M(i) obtained at Step 3 by bit-length reduction.
In round-off quantization, we assume that the signallocated just in the middle between two quantization levelsis quantized at the higher level. When one level is added,this new level is placed exactly between two existing levels.Therefore, when signals located in the hatched zone in Fig.2(a) are requantized at M levels after filtering, the quanti-zation levels become different from the original ones andappropriate error derivation by Eq. (5) becomes impossible.That is, when the number of additional levels is odd, one ofthe additional levels falls exactly between two existinglevels, and the situation shown in Fig. 2 is unavoidable. Onthe other hand, this problem does not occur when two levelsare inserted, as shown in Fig. 3. Thus, we may conclude thatan even number of new levels should be inserted.
Now let us explain the meaning of Step 4. Dependingon the filtering results in Step 2, x
_M(i) obtained in Step 3
can be equal or unequal to xM(i). The latter case is illustratedin Fig. 4, which corresponds to a large change produced byfiltering at edges or fine details. The signal xN(i) is theoriginal xM(i) altered by +∆M/3, 0, or –∆M/3; however, in the
case of a large change produced by filtering in Step 2, theerror of x
_N(i) obtained in Step 2 with respect to xM(i)
exceeds ∆M, as shown in Fig. 4. Such a value cannot beaccepted as an estimate of xN(i). On the other hand, if xM(i)= x
_M(i), then x
_N(i) obtained in Step 2 may well be accepted
as the estimate of xN(i). When x_
M(i) is not equal to xM(i), thevalue to be added to xM(i) is determined with regard to thedirection of change produced by filtering in Step 2. Namely,∆M/3 is added in the case of positive change, and –∆M/3 isadded in the case of negative change.
2.3 Filter processing
The objective of Step 1 in the bit-length expansionprocedure is to return a signal quantized at M levels to thepseudo-continuous amplitude format. Since only two levelsare inserted between existing quantization levels, we maythink that the filter window must not be set too wideconsidering preservation of image details. However, a largewindow is required in order to eliminate pseudo-contoursin backgrounds and other monotonic portions. That is, thewindow length must be adjusted locally rather than beingfixed for the whole image.
Below we consider an example to explain the prob-lem of pseudo-contours, which present a problem in bit-length expansion. Figure 5(a) shows a 16-level imagePepper with pseudo-contours. Panels (b), (c), (d), and (e)show results of bit-length expansion to 46 levels, obtainedby using four ε-filters with window lengths of 3 × 3, 5 × 5,7 × 7, and 9 × 9, respectively. In addition, panel (f) showsthe results obtained by using a mean filter with a windowlength of 9 × 9. Aiming at estimation of these results, panel(g) shows the ideal (original) 46-level image, and panel (h)shows the best image (having the smallest error with respectto the original image) obtained by appropriate adjustmentof the filter window.
Comparing Figs. 5(e) and 5(f), ghost noise can beseen in the edge portions of the bit-length expanded image
(5)
Fig. 2. Insertion of one level.
Fig. 3. Insertion of two levels.
34

obtained by using the mean filter in panel (f). When thefilter window is large, areas with significantly differentpixel values can be involved, which degrades filtering. Thuswe use the ε-filter [8] in Step 1. The output y(m, n) of theε-filter is defined as follows: For the filter coefficients, we apply the same settings to the
ε-filter and mean filter.As is evident from Fig. 5(h), due to appropriate
control of the ε-filter window, pseudo-contours are elimi-nated almost completely, while the image approaches the
Fig. 5. Bit-length expansion using fixed-window filter (ε-filter and mean filter).
Fig. 4. Difference between procedures involving Steps 1 to 2, and Steps 1 to 4.
(6)
35

ideal one in Fig. 5(g). On the other hand, while Figs. 5(b)and 5(c) have better image quality than Fig. 5(a), they areobviously inferior to Fig. 5(g), which confirms the impor-tance of appropriate adjustment of the window length.
An N-level image is obtained from an M-level imageby adding +∆M/3, 0, or –∆M/3 to every pixel. Figure 6(a)presents the error between the 16-level and 46-level Pepperimages. The ideal 46-level image is obtained by adding+∆M/3, 0, and –∆M/3 to the red, black, and blue pixels of the16-level image, respectively. Panels (b), (c), (d), and (e)show the error e(i) [with respect to xM(i)] of the estimatedimage x̂N(i) obtained in Steps 1 to 4 as explained in Section2.2, using the ε-filter with window sizes of 3 × 3, 5 × 5, 7× 7, and 9 × 9, respectively. In the case of the 3 × 3 window,the black portions increase with the distance from the edges,which means that the error has not been estimated properly.In the case of a filter with a narrow window, the errorcalculation area is small, and pseudo-contours cannot besuppressed properly at locations away from the edges. Onthe other hand, when the error e(i) is estimated using anε-filter with 9 × 9 window [Fig. 6(e)], the red and blueportions extend far from the edges; however, the estimationresults near edges are not good, as is evident from compari-son with Fig. 6(a). Thus, we combine the error signalscalculated by every window.
2.4 Error combining
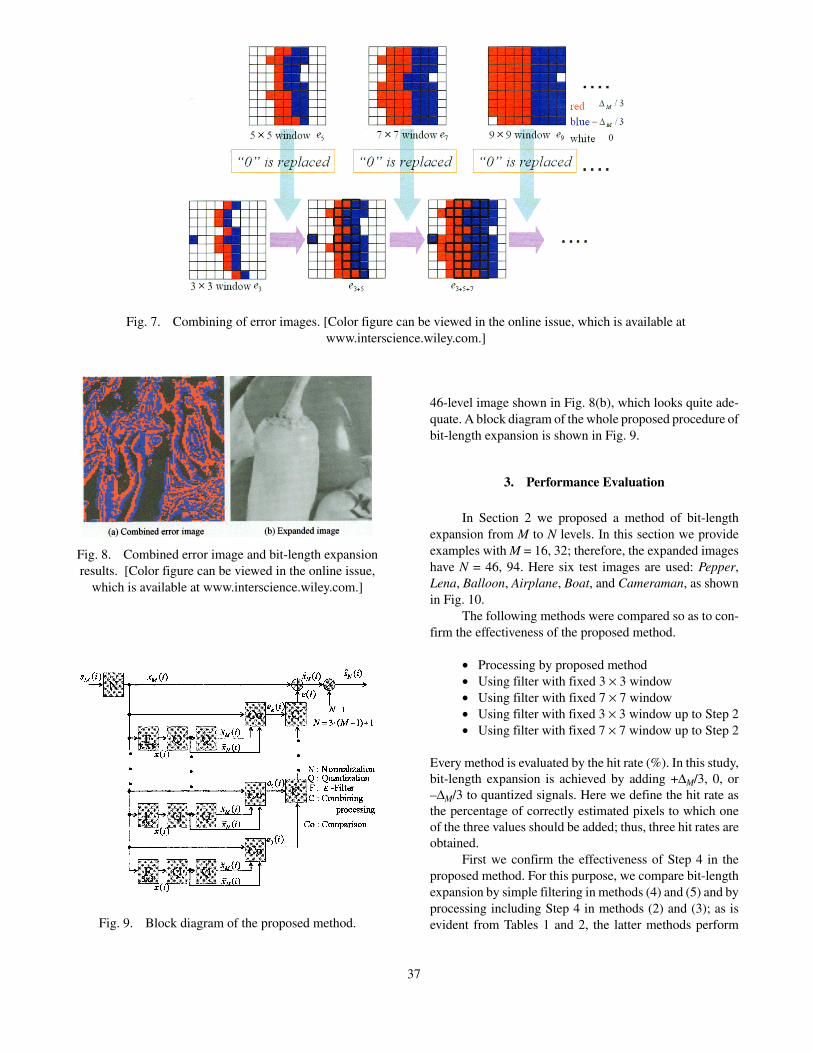
As indicated by Fig. 6, the red and blue portionsproduced by the 3 × 3 filter are the closest to ideal in termsof signal preservation (edges, fine details, etc.). Thus, wefirst calculate the error e3(i) between the estimated N-levelimage and the original M-level image using a filter with a3 × 3 window. On the other hand, a 5 × 5 filter allows bettererror estimation for the image portions at some distancefrom the edges. Therefore, we replace the zero-valuedpixels of e3(i) with the corresponding pixels of e5(i) toobtain the new error image e3+5(i), as shown in Fig. 7. Thenwe replace the zero-valued pixels of e3+5(i) with the corre-sponding pixels of e7(i) to obtain the new error imagee3+5+7(i). By repeating this procedure K – 1 times, thecombined error e3+5+⋅⋅⋅+(2K+1)(i) for K filters is calculated.
However, when too many filters are combined, zero-valued pixels disappear from the entire error image. We mayassume that the quantization noise is distributed almostuniformly, and therefore the three values +∆M/3, 0, or –∆M/3are added to the M-level images with uniform frequency,while local differences occur. Thus, error combining isstopped when the zero-value frequency in the whole errorimage drops below 1/3. The combined error image shownin Fig. 8(a) was obtained for the 16-level image Pepper atK = 4 when the frequency of zero pixels first dropped below1/3; this was used to generate the bit-length expanded
Fig. 6. Ideal error image and estimated error image derived by filtering with fixed window length. [Color figure can beviewed in the online issue, which is available at www.interscience.wiley.com.]
36
46-level image shown in Fig. 8(b), which looks quite ade-quate. A block diagram of the whole proposed procedure ofbit-length expansion is shown in Fig. 9.
3. Performance Evaluation
In Section 2 we proposed a method of bit-lengthexpansion from M to N levels. In this section we provideexamples with M = 16, 32; therefore, the expanded imageshave N = 46, 94. Here six test images are used: Pepper,Lena, Balloon, Airplane, Boat, and Cameraman, as shownin Fig. 10.
The following methods were compared so as to con-firm the effectiveness of the proposed method.
• Processing by proposed method• Using filter with fixed 3 × 3 window• Using filter with fixed 7 × 7 window• Using filter with fixed 3 × 3 window up to Step 2• Using filter with fixed 7 × 7 window up to Step 2
Every method is evaluated by the hit rate (%). In this study,bit-length expansion is achieved by adding +∆M/3, 0, or–∆M/3 to quantized signals. Here we define the hit rate asthe percentage of correctly estimated pixels to which oneof the three values should be added; thus, three hit rates areobtained.
First we confirm the effectiveness of Step 4 in theproposed method. For this purpose, we compare bit-lengthexpansion by simple filtering in methods (4) and (5) and byprocessing including Step 4 in methods (2) and (3); as isevident from Tables 1 and 2, the latter methods perform
Fig. 8. Combined error image and bit-length expansionresults. [Color figure can be viewed in the online issue,
which is available at www.interscience.wiley.com.]
Fig. 9. Block diagram of the proposed method.
Fig. 7. Combining of error images. [Color figure can be viewed in the online issue, which is available atwww.interscience.wiley.com.]
37

better for all images with M = 16, 32. The difference isparticularly great for Boat; here the introduction of Step 4improves the hit rate for +∆M/3, 0, or –∆M/3 by more than15 points. In addition the effect of Step 4 increases with thewindow length.
As indicated by Tables 1 and 2, the proposed method(1) offers the best hit rate for +∆M/3, –∆M/3 with all siximages at M = 16, 32. On the other hand, fixed-windowfiltering methods (2) and (3) outperform the proposedmethod in terms of the hit rate for 0. However, adding 0 toevery pixel is equivalent to no processing; the hit rate is 0%for +∆M/3, –∆M/3 and 100% for 0. That is, the fidelity ofprocessing can hardly be estimated by the hit rate for a valueof 0, but giving priority to the hit rate for +∆M/3, –∆M/3seems reasonable.
Now consider the visual evaluation of the expandedimages obtained by the proposed method (1) and by fixed-window filtering. We use the color image Pepper for thispurpose; in particular, we apply bit-length expansion to thethree RGB components separately. The image quantized at16 levels is shown in Fig. 11(a); pseudo-contours are ob-served in the framed fragments. We apply the proposedmethod to all three components so as to expand the bit-length to 46 levels. The images (c) and (e) obtained byprocessing up to Step 2 are not much different from theimages (d) and (f) obtained by processing up to Step 4 interms of pseudo-contours; however, the former images arepoor in terms of edges and fine details. In addition, textureis lost in panel (e). The image (b) obtained by the proposedmethod offers faithful texture reproduction as well as elimi-nation of pseudo-contours.Fig. 10. Test images (grayscale).
Table 2. Hit rate (%) at M = 32
Table 1. Hit rate (%) at M = 16
38
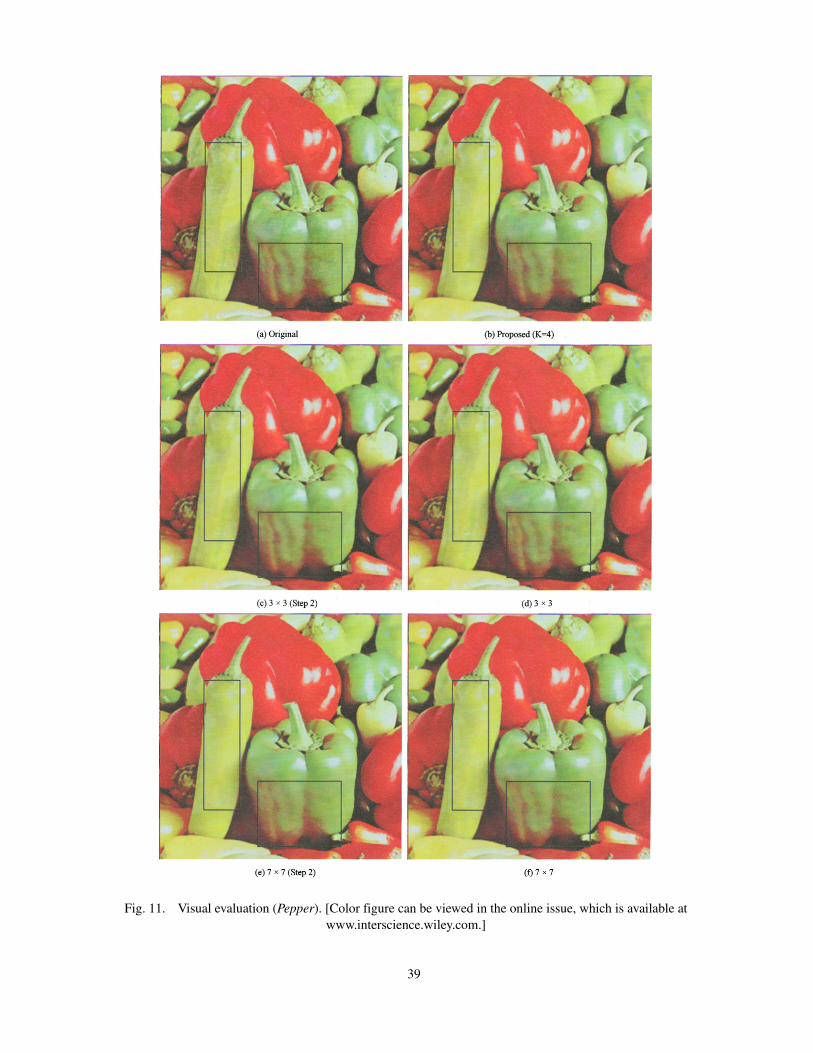
Fig. 11. Visual evaluation (Pepper). [Color figure can be viewed in the online issue, which is available atwww.interscience.wiley.com.]
39

4. Conclusions
We have proposed a method of bit-length expansionthat will be useful for images degraded by pseudo-contours,or for representation on high-resolution displays.
In the proposed method, M-level images are ex-panded to N [= 3(M – 1) + 1] levels, which means that twoquantization levels are added between existing levels.
Bit-length expansion is equivalent to estimation ofthe error image between the original and expanded images.When new quantization levels are inserted between existinglevels as proposed in this study, such an error image is foundas a ternary pattern. We showed that combining error im-ages obtained at different filter window lengths is effectivefor better estimation as well as for pseudo-contour removal,and proposed an algorithm to combine error images; inaddition, we showed how to find the maximum number offilters to be combined. The effectiveness of the proposedmethod was confirmed by various application examples.
Acknowledgment
This study was supported in part by an MEXT Grant-in-Aid (C-18500140).
REFERENCES
1. Gonzalez RG, Woods RE. Digital image processing.Prentice–Hall; 2002.
2. Koshimizu H et al. A mathematical study ongrayscale discretization—proposal of quantizationtheorem. VIEW2002, p 1–6, 2002.
3. Koshimizu H et al. A relationship between OK-quan-tization theory and sampling theorem. IEICE NatlConf, AP-6, p SS40–SS41, 2006.
4. Sugano M, Naito M. A method and apparatus forcolor signal expansion. Japan Patent Application2003-333348.
5. Segawa T. Grayscale extension apparatus. Japan Pat-ent Application 2000-175033.
6. Yoshida Y, Kikuchi Y, Daly S, Sugino M. Imagequality improvements in large-screen LC-TV. No.66-3, SID’05 Digest, 2005.
7. Proakis JG, Manolakis DG. Digital signal processing(Hamada et al., translator). Kagaku Gijutsu Shuppan.
8. Harashima H et al. The ε-separating nonlinear digitalfilter and its applications. Trans IEICE 1982;J65-A:297–304.
AUTHORS (from left to right)
Tomoaki Kimura (nonmember) graduated from Nihon University in 1985 and joined IBM Japan. He moved to YamatoDevelopment Laboratory in 1988, where he was engaged in the development of optical disks, industrial computers, and tapedrives. Since 2007 he has been a professor at Kanagawa Institute of Technology. His research interests are nonlinear digitalsignal processing, image processing, and embedded systems. His publications include Sensory and Quantitative Evaluation ofColor Representation of Digital Images (Technical Information Institute). He holds a D.Eng. degree, and is a member of JSAPand IEICE.
Akira Taguchi (member) graduated from Keio University in 1984, completed the doctoral program in 1989, and joinedthe faculty of Musashi Institute of Technology as a research associate. He has been a professor since 2001. He was a visitingresearcher at the Research Center for Signal Processing (Tampere, Finland) in 1993–94. He is the editor of IEICE Trans. A andIEICE ELEX. His publications include Nonlinear Digital Signal Processing (Asakura Shuppan). He is a member of IEEE,IEICE, and SICE.
40