Embed Size (px)
Citation preview
BioOne sees sustainable scholarly publishing as an inherently collaborative enterprise connecting authors, nonprofitpublishers, academic institutions, research libraries, and research funders in the common goal of maximizing access tocritical research.
Biotic and Abiotic Influences on Within-Plant Distribution ofSoybean Aphid (Hemiptera: Aphididae: Aphis glycines)Author(s): Tierney R. Brosius, Leon G. Higley, and Thomas E. HuntSource: Journal of the Kansas Entomological Society, 83(4):273-282. 2010.Published By: Kansas Entomological SocietyDOI: http://dx.doi.org/10.2317/JKES0911.23.1URL: http://www.bioone.org/doi/full/10.2317/JKES0911.23.1
BioOne (www.bioone.org) is a nonprofit, online aggregation of core research in thebiological, ecological, and environmental sciences. BioOne provides a sustainable onlineplatform for over 170 journals and books published by nonprofit societies, associations,museums, institutions, and presses.
Your use of this PDF, the BioOne Web site, and all posted and associated contentindicates your acceptance of BioOne’s Terms of Use, available at www.bioone.org/page/terms_of_use.
Usage of BioOne content is strictly limited to personal, educational, and non-commercialuse. Commercial inquiries or rights and permissions requests should be directed to theindividual publisher as copyright holder.
Biotic and Abiotic Influences on Within-Plant Distribution of SoybeanAphid (Hemiptera: Aphididae: Aphis glycines)
TIERNEY R. BROSIUS,1 LEON G. HIGLEY,1 AND THOMAS E. HUNT2
ABSTRACT: The within-plant distribution of soybean aphid, Aphis glycines Matsumura has
been attributed to various causes, yet it is unclear which factor or combination of factors most
influence aphid within-plant distribution. Understanding soybean aphid distribution within
the soybean canopy is important both in developing sampling programs and in evaluating
injury. Because natural enemies have the potential to alter aphid dispersion, we examined how
within-plant distribution of soybean aphid was influenced by different natural enemies. Field
cages of different mesh diameters were used to exclude different sizes of natural enemies from
aphid infested plots. Plots were surveyed and both natural enemy density and soybean aphid
density, by strata, were recorded twice weekly. Cages were found to have minimal effect on
temperature and soybean plant development. Aphid densities were significantly different each
year among dates, treatments, and strata. In 2004 aphid densities were concentrated on the top
part of the plant and in 2005 aphid densities were concentrated in the middle of the canopy.
Treatments had significant impacts on aphid density in both years of the study. The total
exclusion treatment had the highest aphid densities in both years. Treatment also had a
significant effect on which stratum aphids were most commonly found. The factor that was
found to best explain the differences in aphid distribution was the abundance of natural
enemies, primarily Orius insidosus (Say). In treatments left exposed to natural enemies the
percentage of the total aphid population was found lower in the canopy. It is clear that aphid
densities and distributions are being affected by the presence of natural enemies.
Understanding how natural enemies affect the distribution of this economically damaging
aphid species is an important component of its management, specifically the development of
accurate scouting protocols and pesticide efficiency.
KEY WORDS: aphid management, predator density, prey density, scouting protocols, soybean
canopy
The within-plant distribution of an insect species is not random. Insects may
disperse within a single plant to attain optimum nutrition (Leather and Dixon, 1981;
Gianoli, 1999), to avoid natural enemies (Kareiva and Sahakian, 1990; Grevstad and
Klepetka, 1992; Gonzales et al., 2001), and to avoid extreme temperatures in the
canopy (Dixon and McKay, 1970; Wiktelius, 1987). Understanding within-plant
distribution aids in the development of accurate scouting protocols, helps improve the
efficiency of pesticide treatments, and is useful in characterizing the impact of aphid
injury. Moreover, for arthropods that are relatively immobile while feeding, like mites,
scales, or aphids, within-plant distribution may be especially important. The soybean
aphid, Aphis glycines Matsumura, is a serious pest of soybean which was discovered in
the Great Lakes region in the summer of 2000. This aphid’s native range includes the
tropical, subtropical, and temperate regions of Asia (Venette and Ragsdale, 2004; Wu
et al., 2004). Currently, the soybean aphid is widely distributed across much of the
northern soybean growing region of the United States, including Nebraska.
1 School of Natural Resources, 706 Hardin Hall, University of Nebraska – Lincoln, Lincoln, Nebraska
68583-0987.2 Department of Entomology, 202 Entomology Hall, University of Nebraska – Lincoln, Lincoln,
Nebraska 68583-0816.
Accepted 2 June 2010; Revised 12 July 2010
E 2010 Kansas Entomological Society
JOURNAL OF THE KANSAS ENTOMOLOGICAL SOCIETY83(4), 2010, pp. 273–282

When soybean aphids first move into a field their distribution is often randomly
scattered small colonies. The small colonies seen early in the year are the result of
winged migrants that deposited nymphs (Ragsdale et al., 2004). This early
colonization progresses rapidly with populations appearing randomly in the field. In
contrast, colonization occurring later in the summer can show distinct edge effects
with large colonies occurring in areas near windbreaks (Ragsdale et al., 2004).
According to Ragsdale et al. (2004), soybeans are initially infested during the plant’s
vegetative growth and colonies are found at the tops of these plants. As plants begin to
flower and form pods soybean aphids become more widely dispersed within the plant.
The within-plant distribution of the soybean aphid on soybean is currently
believed to be connected to plant nutrition, plant growth, and temperature (Dixon
and McKay, 1970; Hu et al., 1992; Van de Burg, 1997; Meyers et al., 2005; Desneux
et al., 2006). Previous studies show that the distribution of aphids between and on
host plants is often determined by the quality of plant material, including potassium
(Meyers et al., 2005) and nitrogen (Hu et al., 1992). Hu et al. (1992) discovered a
positive correlation between nitrogen content and the concentration of soybean
aphids on the top leaves. Similarly, reproduction of aphids can depend upon the level
of soluble nitrogen in their host plants (Dixon and McKay, 1970). Actively growing
leaves serve as sinks for nitrogen and other nutrients in soybean plants (Staswick,
1994). Shusen et al. (1994) followed the distribution of soybean aphid on soybean
plants through time. The results of their work suggest that the within-plant
distribution of soybean aphid is the result of plant growth and weather.
It is clear that the nutrient quality of the plant can affect the distribution of
soybean aphid, but the possible role of natural enemies on within-plant distribution
of soybean aphid is still unclear. Natural enemies are capable of suppressing soybean
aphid populations (Fox et al., 2004; Costamagna and Landis, 2006; Desneux et al.,
2006; Brosius et al., 2007). The presence of natural enemies influences the within-
plant distribution of many aphid species (Roitberg et al., 1979; Gonzales et al.,
2001), and potentially soybean aphid (Rutledge and O’Neil, 2005). Therefore, it is
reasonable to assume that the presence of natural enemies may have an effect on the
distribution of soybean aphids found within the canopy.
As part of our examination of soybean aphid population dynamics, we
directly considered the possible impact of biotic and abiotic factors on soybean
aphid distribution in the soybean canopy. We examined distribution through
time because canopy temperatures, nutritional quality of soybean leaves, natural
enemy populations, and soybean aphid densities all vary through time. Given
the complexity of potential interacting factors in altering soybean aphid distri-
bution, we focused our examination on the role of natural enemies because we could
directly manipulate natural enemy levels through our experimental design. Here,
we report how natural enemies can alter soybean aphid within-plant distribution
and identify potential interactions with other factors influencing within-plant
distribution.
Materials and Methods
Most information on experimental design and methods is described in Brosius et
al. (2007), which addresses the role of natural enemies on soybean aphid population
dynamics. We have repeated much of that information below for clarity in reading
274 JOURNAL OF THE KANSAS ENTOMOLOGICAL SOCIETY
and we offer some additional details relative to the objectives of this aspect of the
overall experiment.
Field Site
Experiments were conducted at the University of Nebraska Haskell Agricultural
Laboratory, Concord, Neb. Research plots were located in soybean fields under a
two-year corn-soybean rotation with conventional tillage practices (2004 Colo silty
clay loam, 0–2% slope and in 2005 Baltic silty clay, 0% slope). On 29 May 2004 and
23 May 2005, after double disking for seed bed preparation, fields were planted with
soybean (Asgrow 2730) at 176,000 seeds/ha in 0.762 m rows. Experiments were
conducted in these fields in individual plots, which were located at least 5 m from
field borders to minimize edge effects. Glyphosate at 1.14 liter formulation/0.4 ha
was applied twice each year. on 9 June and 28 June 2004, and on 27 May and 24 June
2005. Different fields were used each year of the study but they were within 1 km of
each other.
Study Design
The experimental design was a randomized complete block, with treatments
located in cages with different sized mesh coverings or uncaged soybeans of equal
dimensions as cages (for the uncaged control treatment). Each cage represented one
experimental unit, and there were four blocks of four treatments for a total of 16
experimental units. Each cage covered 1.8 3 3.7 m ground area (centered over two
rows), and cage supports (2.5 cm diameter aluminum poles) were 2.5 m tall and
extended into the ground 0.5 m.
Custom field cages were placed over the aluminum supports, and consisted of
nylon mesh of 1 or 2 mm squares and a full length zipper opening on one side.
Specific treatments were: (1) uncaged control, staked 1.8 3 3.7 m ground area; (2)
caged (open) control, 2 mm mesh rolled up to allow complete access to canopy by all
types of natural enemies; (3) partial exclusion cage – 2 mm mesh, intended to exclude
large natural enemies (primarily predators great than 2 mm long; e.g., coccindelids,
neuroptera larva, syrphid larvae); and (4) total exclusion cage – 1 mm mesh,
intended to exclude all natural enemies, and if natural enemies were found in these
cages they were manually removed.
In 2004 temperatures were recorded at ground level, mid-canopy, and immediately
above the canopy with thermocouples (TMC6-HB, with 0u–44uC range, 60.4uCaccuracy at 20uC, and 0.2uC resolution) attached to a HoboH H8 Outdoor/Industrial
4-Channel External Logger (Onset Computer Corp., Pocasset, MA). Probes were
moved weekly to adjust for the growth of the soybean plant. Data were recorded
from all treatments in all replications. however, one thermocouple failed in one
replication of the caged (open) control treatment. Measurements were recorded at
hourly. Temperatures were also recorded in 2005. however, an instrument failure at
the end of the season resulted in loss of all 2005 temperature data.
Dates of all activities involving treatment establishment and assessment are listed
in Brosius et al. 2007. Exclusion treatments (those with 1 or 2 mm mesh cages) were
treated to remove pre-existing predators with the 0.052 liters ai/ha of malathion
(which has a short half life of 1.5 day in sunlight [EPA 1991]). One week later, aphid
treatments were artificially infested with healthy adult apterous aphids from a
VOLUME 83, ISSUE 4 275
nearby field at 3 adult aphids/plant to simulate initial infestation rates observed
locally. Natural aphid infestations were similar, but variable by field, in both years.
Aphid and natural enemy counts were made 2 to 3 times weekly on six plants
chosen at random within each plot (in 2004, only four plants were sampled after
August 11). Counts included nymphs, apterous adults, and pterous adults, and
natural enemies identified to the lowest possible taxon .. Aphid number, and natural
enemy type and number were recorded for individual leaves starting from the base of
the plant. Each leaf was designated by counting the nodes from the base of the plant
(the cotyledonary node 5 node 0) in the same method used to determine the
vegetative stage of the plant. Aphids were counted individually until their numbers
became too large (.100/leaf), and then were counted by tens or hundreds. Accuracy
of counts by tens or hundreds was tested on each sampling date by directly
comparing counts of all individuals on at least one leaf in each plot (16 total), until
counts by tens or hundreds were within 10% of counts of all individuals. .Vegetative
and reproductive stages (Ritchie et al., 1995) of the soybean plants . were recorded
on each sampling date.
Data Analysis
Main effects consisted of strata (different groups of nodes in the soybean
canopy) and treatment (cages used to exclude different types of natural enemies).
For strata, data were collected for each node and combined by plant into 3 strata
with equal numbers of nodes: bottom, middle, and top., For treatments, our a
priori comparisons of interest were: (1) uncaged control versus caged (open)
control, to identify potential cage effects; and (2) uncaged control (all natural
enemies) versus partial exclusion cage versus total exclusion cage. Data were
analyzed by analysis of variance through PROC MIXED (SAS Institute 9.1, 2002),
with treatment comparisons by protected LSD at the 0.05 level, unless otherwise
indicated.
For analysis across dates, a repeated measures analysis was conducted with PROC
MIXED, using sampling date as the whole plot. Because appropriate use of PROC
MIXED for repeated measures analysis requires estimation of the covariance
structure (variance components), we iteratively tested different covariance structures
to identify the structure with the lowest fit statistics (Akaike’s Information Criterion
or AIC). The lowest AIC was achieved with an antedependent structure, which we
used in subsequent repeated measures analysis under PROC MIXED (Littell et al.,
1996). To determine if the treatment effect was independent of density we ran an
analysis of covariance following the procedure outlined in SAS Systems for Mixed
Models (Littell et al., 1996).
Degree days were calculated by hourly intervals and accumulations determined by
summing across hours and days. Calculations were based on a minimum
developmental threshold for A. glycines of 8.6uC (McCornack et al., 2004), and
hourly degree days were calculated as the area of a trapezoid, specifically:
HourlyTemperature1zHourlyTemperature2ð Þ2
� �{8:60C
� �� 1 hourð Þ ð1Þ
Accumulated degree days were determined from 27 August 2004 to 16 September
2004, and no temperatures spanned the developmental minimum over these dates.
276 JOURNAL OF THE KANSAS ENTOMOLOGICAL SOCIETY
Where recording thermocouples failed during this period, accumulated degree days
were treated as missing data points.
Results and Discussion
Cage Effects
No significant differences in aphid density were observed between caged and
uncaged controls. As indicated in the methods, the caged (open) control treatments
were open and did not exclude aphids or predators; obviously closed cage treatments
(which excluded natural enemies) did influence aphid densities. Temperatures across
strata did not significantly differ between treatments in 2004 (2004: F3,11 5 0.76,
P.F 5 0.5391)) nor was there a significant treatments by stratum interaction (2004:
F6,17 5 1. 69, P.F 5 0.1830); therefore, cages had no significant impact on
temperatures. We found no significant treatment differences in soybean reproductive
stages (2004: F3,9 5 0.15, P.F 5 0.9263; 2005: F3,9 5 2.30, P.F 5 0.1455) or
vegetative stages (2004: F3,9 5 1.66, P.F 5 0.2436; 2005: F3,9 5 2.64, P.F 5
0.1130). Because no significant cage effects were observed the uncaged control was
not further considered.
Strata Effects
The total number of nodes on plants ranged between 12 and 17 across dates and
years, so each stratum (top, middle, and bottom) represents a combination of 4 to 6
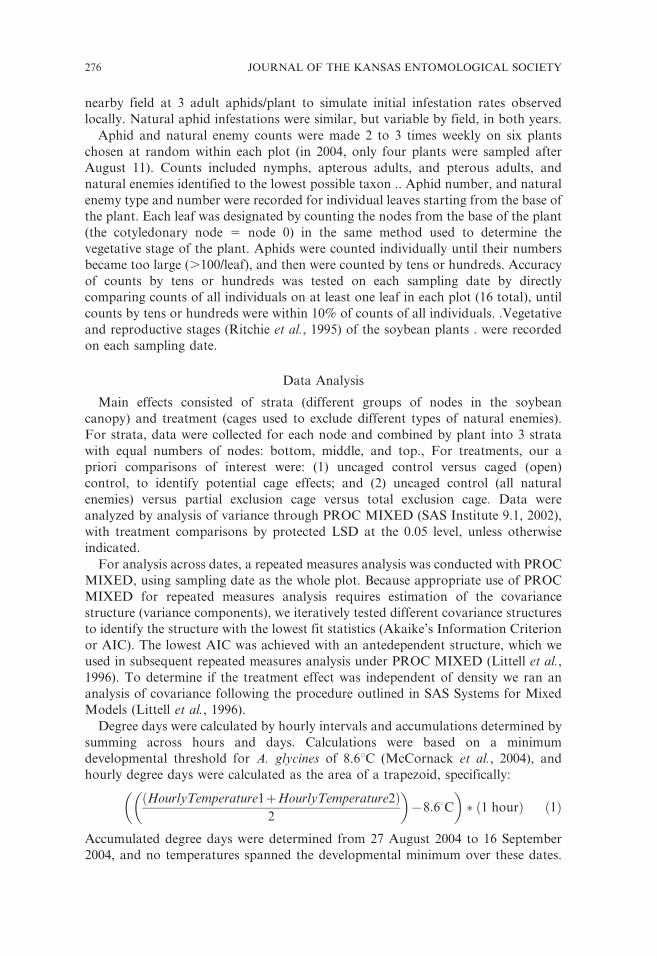
nodes. Aphid densities were significantly different each year among dates, treatments,
and strata (Table 1). In 2004 the largest aphid density was found in the top stratum of
the plant on almost every date surveyed across treatments (Fig. 1). In 2005, however, a
different pattern of aphid distribution was observed (Fig. 1), with a greater proportion
Table 1. Repeated measures analysis of variance for soybean canopy stratum and treatment effects on
soybean aphid density (#/stratum, with an equal number of nodes per stratum) in 2004 and 2005.
2004 2005
Stratum
Treatment Means (SE in parentheses)
Stratum
Treatment Means (SE in parentheses)
Caged (Open)
Control
Partial
Exclusion Total Exclusion
Caged (Open)
Control
Partial
Exclusion Total Exclusion
Top 42.68 (2.64) 119.89 (8.27) 145.52 (8.63) Top 0.72 (0.11) 1.59 (0.14) 73.62 (4.1)
Middle 30.36 (2.26) 89.78 (7.89) 68.52 (6.04) Middle 1.26 (0.11) 3.38 (0.29) 96.92 (5.34)
Bottom 0.36 (0.08) 1.35 (7.89) 1.21 (0.48) Bottom 0.09 (0.02) 0.15 (0.03) 2.8 (0.082)
ANOVA
Effect F Value d.f. Pr.F Effect F Value d.f. Pr.F
Trt 46.32 2, 6 ,0.0001 Trt 250.16 2, 6 ,0.0001
Stratum 164.49 2, 18 ,0.0001 Stratum 67.58 2, 18 ,0.0001
Trt*Stratum 17.01 4, 18 ,0.0001 Trt*Stratum 59.54 4, 18 ,0.0001
Days 50.81 11, 297 ,0.0001 Days 37.38 9, 261 ,0.0001
Days*Trt 4.87 22, 297 ,0.0001 Days*Trt 36.23 18, 261 ,0.0001
Days*Stratum 15.27 22, 297 ,0.0001
Days*Stratum 9.07 18, 261 ,0.0001
Days*Trt*Stratum 1.72 44, 297 ,0.0001
Days*Trt*Stratum 8.76 36, 261 ,0.0001
VOLUME 83, ISSUE 4 277
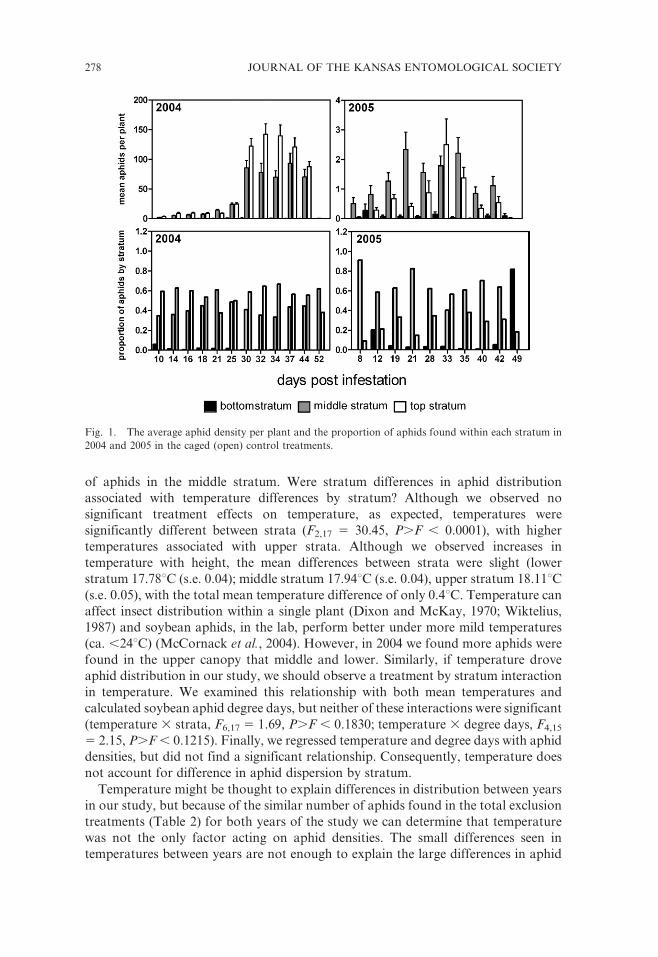
of aphids in the middle stratum. Were stratum differences in aphid distribution
associated with temperature differences by stratum? Although we observed no
significant treatment effects on temperature, as expected, temperatures were
significantly different between strata (F2,17 5 30.45, P.F , 0.0001), with higher
temperatures associated with upper strata. Although we observed increases in
temperature with height, the mean differences between strata were slight (lower
stratum 17.78uC (s.e. 0.04); middle stratum 17.94uC (s.e. 0.04), upper stratum 18.11uC(s.e. 0.05), with the total mean temperature difference of only 0.4uC. Temperature can
affect insect distribution within a single plant (Dixon and McKay, 1970; Wiktelius,
1987) and soybean aphids, in the lab, perform better under more mild temperatures
(ca. ,24uC) (McCornack et al., 2004). However, in 2004 we found more aphids were
found in the upper canopy that middle and lower. Similarly, if temperature drove
aphid distribution in our study, we should observe a treatment by stratum interaction
in temperature. We examined this relationship with both mean temperatures and
calculated soybean aphid degree days, but neither of these interactions were significant
(temperature 3 strata, F6,17 5 1.69, P.F , 0.1830; temperature 3 degree days, F4,15
5 2.15, P.F , 0.1215). Finally, we regressed temperature and degree days with aphid
densities, but did not find a significant relationship. Consequently, temperature does
not account for difference in aphid dispersion by stratum.
Temperature might be thought to explain differences in distribution between years
in our study, but because of the similar number of aphids found in the total exclusion
treatments (Table 2) for both years of the study we can determine that temperature
was not the only factor acting on aphid densities. The small differences seen in
temperatures between years are not enough to explain the large differences in aphid
Fig. 1. The average aphid density per plant and the proportion of aphids found within each stratum in
2004 and 2005 in the caged (open) control treatments.
278 JOURNAL OF THE KANSAS ENTOMOLOGICAL SOCIETY
densities among caged and control treatments between years. By the lack of
differences seen in plant quality and aphid abundance between the caged (open) and
un-caged control, we were able to determine that light and relative humidity did not
significantly affect the treatments.
The factor that best explains differences in aphid distribution between years is the
presence of natural enemies, primarily O. insidiosus. In the absence of natural
enemies in 2004, aphids were found in high abundance in the top of the soybean
canopy. In treatments left exposed to natural enemies, the percentage of the total
aphid population was lower in the top of the canopy. Higher levels of natural
enemies found in 2005 may have contributed to the difference in distribution
between years. Mean numbers of O. insidiosus in the open treatments in 2004 were
0.15/plant, in contrast to 2005 where the average number of O. insidiosus was 0.46/
plant.
Orius insidiosus may have worked in conjunction with the higher temperatures in
2005 to prevent soybean aphid colonization. Although higher temperatures did not
suppress the population growth of the aphids in the total exclusion cage in 2005, we
can not disregard the potential interaction between natural enemies and
temperatures in preventing successful aphid colonization.
Stratum by Time
A significant interaction was found between stratum and day (Table 1). This
interaction . is likely to be caused by the establishment of the aphid on the host plant
and redistribution because of host plant conditions linked to phenological events
(specifically, changes in the nutritional quality of soybean leaves). Aphid densities
are highly dependent on nutrient availability of the plant (Kennedy et al., 1950;
Leather and Dixon, 1981; Gianoli, 1999).
Shusen et al. (1994) found that soybean aphid concentrated on the new leaves
when they initially migrated to the soybean field then moved to the lower parts of the
plant as temperatures rose, indicating that the movement is a combination of
temperature and plant quality. Additional evidence suggests that nutrient
availability is responsible for high densities of aphids in the top of the plant. Each
year, at the start of our study, soybean plants were at reproductive stage R3, or
beginning pod formation. At R3, the concentration of nitrogen moves from the
leaves to the developing pods (Harper, 1987). The highest concentration of nitrogen,
which has been linked to increases in aphid density (Han, 1997), is not found in the
leaves during this stage of development. Thus, leaf nitrogen levels were decreasing
during our study as leaf nitrogen was mobilized into pods and seeds. Because pod
Table 2. Average number of aphids and natural enemies/ plant by year and by treatment (standard
error in parentheses).
Mean #/plant
2004 2005
Total
Exclusion
Partial
Exclusion
Caged (Open)
Control
Total
Exclusion
Partial
Exclusion
Caged (Open)
Control
Soybean Aphid 973.31 (98.71) 925.9 (105.75) 523.57 (56.5) 818.17 (75.2) 22.86 (2.8) 7.17 (0.65)
Predators 0.04 (0.01) 0.8 (0.4) 0.79 (0.29) 0.04 (0.02) 0.03 (0.01) 0.12 (0.03)
Parasitoids 0.85 (0.23) 2.25 (0.49) 0.28 (0.07) 0.0 (0.0) 0.05 (0.02) 0.0 (0.0)
O. insidiosus 0.01 (0.01) 0.18 (0.03) 0.36 (0.05) 0.2 (0.04) 0.56 (0.07) 0.47 (0.06)
VOLUME 83, ISSUE 4 279
formation and seed fill proceeds from the bottom of the plant upwards, higher
nitrogen levels would be associated with more apical leaves.
Treatment Effects
Treatment effects represent the differences between control, partial exclusion, and
total exclusion cages on aphid densities. This design uses cages to exclude different
natural enemies, so treatments can be regarded as reflective of conditions
approximating all natural enemies (control), primarily small predators and
parasitoids (partial exclusion (less than 2mm long; e.g., parasitic hymenopterans,
anthocorids, predacious thysanopterans), and no natural enemies (total exclusion).
There was a significant treatment effect in both years (2004 F3,9 5 11.14, P.F 5
0.0022, 2005 F3,9 5 181.65, P.F 5 0.0001). In 2004 the highest average number of
aphids per plant (3091) was found in the total exclusion treatments, next in the
partial exclusion treatments (2826), and least in the no exclusion treatment (932)
(Brosius et al., 2007). In 2005, the number of aphids found in the total exclusion
treatment (2608) was dramatically higher than the numbers the no exclusion (21) and
the partial exclusion treatments (55) (Brosius et al., 2007). These results
corresponded with differences in natural enemy densities among treatments
(Table 2).
Treatment by Stratum
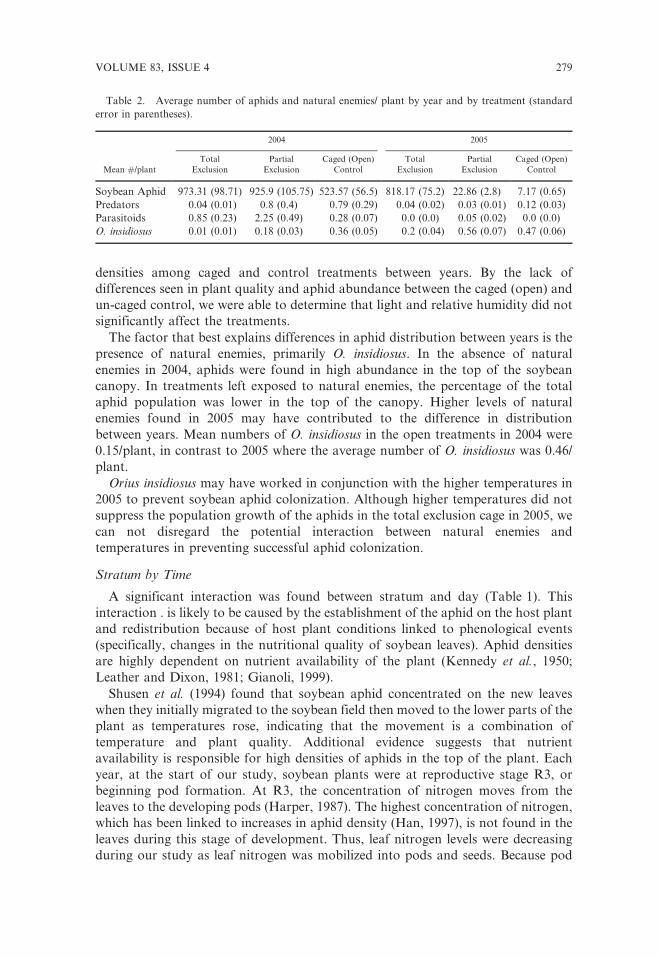
The treatment by stratum interaction on aphid density was significant in both
years (Table 1, Fig. 2). So few aphids occurred in the bottom stratum in either year
that no treatment differences were observed. However, in the middle and top strata,
aphid densities were higher in the partial and total exclusion treatments than in the
control. Moreover, proportionally fewer aphids occurred in the top stratum of the
partial exclusion treatment than in the total exclusion treatment. This result indicates
that the presence of natural enemies altered aphid distribution either by reducing
aphid numbers in the upper stratum or changing aphid behavior to avoid predators
and parasitoids by moving from upper to middle stratum of the soybean canopy. In
2005, the control and partial exclusion treatments were not significantly different
from each other in any strata but both were significantly lower than the total
exclusion in the same strata (Fig 1).
Fig. 2. The average aphid density across days within each stratum for each treatment in 2004 and 2005.
280 JOURNAL OF THE KANSAS ENTOMOLOGICAL SOCIETY

Stratum by Treatment by Time
The effect of natural enemies on aphid dispersion varies through time. The
complexity of the interactions between nutrition, natural enemies, temperatures, and
aphid biology make it difficult to clearly illustrate the three way interaction. A better
understanding of how aphids are following the availability of nitrogen and how they
are being affected by temperatures is necessary to fully comprehend how all of thesefactors are interacting. It is clear, however, that aphid densities and distributions are
being affected by the presence of natural enemies. If natural enemies are effective at
reducing aphid populations and if predation causes aphids to produce an alarm
pheromone as indicated by Butler and O’Neil (2006), it is logical to assume that
distribution is connected to the presence of natural enemies.
Implications for Aphid Management
Scouting recommendations currently suggest looking on the upper two or
three trifoliolate leaves and stems for aphids, suggesting that aphids are morelikely to concentrate in the plant terminal (Rice et al., 2005). Field observations
for both 2004 and 2005 showed that after the infestation of the top soybean
trifoliolate, aphid colonies were commonly found in the middle of the soybean
canopy. Not until populations began to increase did aphid densities concentrate at
the top of the plant. It remains unclear if these observations are related to the plant
stage, lateness of infestation, or the temperatures during infestation. Our research
supports the scouting recommendation that concentrates on the plant terminal.
These observations do show, however, that if the scouting objective is to detect thepresence of aphids in the field, looking at the top of the plant may not always be
effective.
Acknowledgments
We thank Gerald Echtenkamp and Stephen Spomer for their assistance with
experiment, and Dr. Erin Blankenship for statistical advice. This work was
supported by the Nebraska Agricultural Experiment Station (Projects NEB-17-078and NEB-17-080), and by 2 grants from the Nebraska Soybean Board.
Literature Cited
Brosius, T. R., L. G. Higley, and T. E. Hunt. 2007. Population dynamics of soybean aphid (Aphis glycines)
and biotic mortality at the edge of its range. Journal of Economic Entomology 100:1268–1275.
Butler, C. D., and R. J. O’Neil. 2006. Defensive response of soybean aphid (Hemiptera: Aphididae) to
predation by insidious flower bug (Hemiptera: Anthocoridae). Annals of the Entomological
Society of America 99:317–320.
Costamagna, A. C., and D. A. Landis. 2006. Predators exert top-down control of soybean aphid across a
gradient of agricultural management systems. Journal of Applied Ecology 16:1619–1628.
Desneux, N., R. J. O’Neil, and H. J. S. Yoo. 2006. Suppression of population growth of the soybean
aphid, Aphis glycines Matsumura, by predators: the identification of a key predator and the effects
of prey dispersion, predator abundance, and temperature. Environmental Entomology
35:1342–1349.
Dixon, A. F. G. 2000. Insect Predator-Prey Dynamics, Ladybird Beetles and Biological Control.
Cambridge University Press, Cambridge, England.
Dixon, A. F. G., and S. McKay. 1970. Aggregation in the sycamore aphid Drepanosiphum platanoides
(Schr.) (Hemiptera: Aphididae) and its relevance to the regulation of population growth. Journal of
Animal Ecology 39:439–454.
VOLUME 83, ISSUE 4 281

Fox, T. B., D. A. Landis, F. F. Cardoso, and C. D. DiFonzo. 2004. Predators suppress Aphis glycines
Matsumura population growth in soybean. Environmental Entomology 33:608–618.
Gianoli, E. 1999. Within-plant distribution of Rhopalosiphum padi on wheat seedlings is affected by
induced responses. Entomologia Expermentalis Applicata 93:220–230.
Gonzales, W. L., E. Gianoli, and H. M. Niemeyer. 2001. Plant quality vs. risk of parasitism: within-plant
distribution and performance of the corn leaf aphid, Rhopalosiphum maidis. Agricultural and
Forest Entomology 3:29–33.
Grevstad, F. S., and B. W. Klepetka. 1992. The influence of plant architecture on the foraging efficiencies
of a suite of ladybird beetles feeding on aphids. Oecologia 92:399–404.
Harper, J. E. 1987. Nitrogen metabolism. In J. R. Wilcox (ed.). Soybeans: Improvement, pp. 510–513.
Production, and Uses, Madison, WI.
Han, X. 1997. Population dynamics of soybean aphid Aphis glycines and its natural enemies in fields.
Hubei Agricultural Science 2:22–24.
Hu, Q., W. Q. Zhang, Y. X. Yao, and S. Q. Yan. 1992. Relationship between nitrogen content in soybean
leaves and occurrence of Aphis glycines. Journal of Jilin Agricultural University 14:103–104.
Kareiva, P., and R. Sahakian. 1990. Tritrophic effects of a simple architectural mutation in pea plants.
Nature 345:433–434.
Kennedy, J. S., A. Ibbotson, and C. O. Booth. 1950. The distribution of aphid infestation in relation to
leaf age. I. Myzus persicae (Sulz.) and Aphis fabae Scop. on spindle trees and sugar-beet plant.
Annals of Applied Biology 37:651–679.
Leather, S. R., and A. F. G. Dixon. 1981. The effect of cereal growth stage and feeding site on the
reproductive activity of the bird-cherry aphid, Rhopalosiphum padi. Annals of Applied Biology
97:135–141.
Littell, R. C., G. A. Milliken, W. W. Stroup, and R. D. Wolfinger. 1996. SAS Systems for Mixed Models.
SAS Institute Inc., Cary, NC.
Myers, S. W., C. Gratton, R. P. Wolkowski, D. B. Hogg, and J. L. Wedberg. 2005. Effect of soil potassium
availability on soybean aphid (Hemiptera: Aphididae) population dynamics and soybean yield.
Journal of Economic Entomology 98:113–120.
McCornack, B. P., D. W. Ragsdale, and R. C. Venette. 2004. Demography of soybean aphid (Homoptera:
Aphididae) at summer temperatures. Journal of Economic Entomology 97:857–861.
Ragsdale, D. W., D. J. Voegtlin, and R. J. O’Neil. 2004. Aphis glycines biology in North America. Annals
of the Entomological Society of America 97:204–208.
Rice, M. E., M. O’Neal, and P. Pedersen. 2005. Soybean aphids in Iowa. Iowa State University Extension.
(http://www.ent.iastate.edu/soybeanaphid/files/Aphids.SP247_0.pdf)
Roitberg, B. D., J. H. Myers, and B. D. Frazer. 1979. The influence of predators on the movement of
apterous pea aphid between plants. Journal of Animal Ecology 48:111–122.
Rutledge, C. E., and R. J. O’Neil. 2005. Orius insidiosus (Say) as a predator of the soybean aphid, Aphis
glycines Matsumura. Biological Control 33:56–64.
SAS Institute. 2002. PROC user’s manual, Version 9.1. SAS Institute, Cary, NC.
Shusen, S., Y. Boren, L. Dianshen, and Y. Yanjie. 1994. Study on space dynamics of a natural population
of Aphis glycines Matsumura. Journal of Jilin Agricultural University 16:75–79.
Staswick, P. E. 1994. Storage proteins of vegetative tissues. Annual Review of Plant Physiology and Plant
Molecular Biology 45:303–322.
Van den Berg, H., D. Ankasah, A. Muhammad, R. Rusli, H. A. Widayanto, H. B. Wirasto, and I. Yully.
1997. Evaluating the role of predation in population fluctuations of the soybean aphid Aphis
glycines in farmers’ fields in Indonesia. Journal of Applied Ecology 34:971–984.
Venette, R. C., and D. W. Ragsdale. 2004. Assessing the invasion by soybean aphid (Homoptera:
Aphididae) where will it end? Annals of the Entomological Society of America 97:219–226.
Wiktelius, S. 1987. Distribution of Rhopalosiphum padi (Homoptera: Aphididae) on spring barley plants.
Annals of Applied Biology 110:1–7.
Wu, Z., D. Schenk-Hamlin, W. Zhan, D. W. Ragsdale, and G. E. Heimpel. 2004. The soybean aphid in
China: A historical Review. Annals of the Entomological Society of America 87:209–218.
282 JOURNAL OF THE KANSAS ENTOMOLOGICAL SOCIETY