Embed Size (px)
Citation preview

Bioremediation of anExperimental Oil Spill on theShoreline of Delaware Bay
A L B E R T D . V E N O S A , * , †
M A K R A M T . S U I D A N , ‡
B R I A N A . W R E N N , ‡
K E V I N L . S T R O H M E I E R , ‡
J O H N R . H A I N E S , †
B . L O Y E E B E R H A R T , ‡
D E N N I S K I N G , § A N D E D I T H H O L D E R ‡
National Risk Management Research Laboratory,U.S. Environmental Protection Agency,Cincinnati, Ohio 45268, Department of Civil andEnvironmental Engineering, University of Cincinnati,Cincinnati, Ohio 45221, and STATKING Consulting,Fairfield, Ohio 45014
In the summer of 1994, a field study was undertakenin Delaware in which light crude oil wasintentionally released onto plots to evaluate bioreme-diation. The objectives were to obtain crediblestatistical evidence to determine if bioremediationwith inorganic mineral nutrients and/or microbialinoculation enhanced the removal of crude oilcontaminating a sandy beach and to compute intrinsicand enhanced biodegradation rates. Biodegradationwas tracked by GC/MS analysis of selectedcomponents, and the measured concentrations werecorrected for abiotic removal by hopane normaliza-tion. A randomized block design was used to assesstreatment effects. Three treatments were evalu-ated: a no-nutrient addition control, addition of water-soluble nutrients, and addition of water-solublenutrients supplemented with a natural microbial inoculumfrom the site. Although substantial hydrocarbonbiodegradation occurred in the untreated plots, statisti-cally significant differences between treated anduntreated plots were observed in the biodegradationrates of total alkane and total aromatic hydrocarbons.First-order rate constants for the disappearance ofindividual hopane-normalized alkanes and PAHswere computed, and the patterns of loss were typicalof biodegradation. Significant differences were notobserved between plots treated with nutrients aloneand plots treated with nutrients and the indigenousinoculum. The high rate of oil biodegradation that wasobserved in the untreated plots was attributed tothe background nitrogen that was measured at the site.Even though oil loss was enhanced by nutrient ad-dition, active bioremediation in the form ofexogenous nutrient addition might not be appropriatein cases where background nutrient levels are already
sufficiently high to support high intrinsic rates ofhydrocarbon biodegradation.
IntroductionA number of studies of oil spill bioremediation on marineshorelines have been conducted (1-13). These studies haveconcluded that bioremediation enhances the removal ofcrude oil several times more than the intrinsic rate. Muchskepticism remains in the field, however, because data fromall of these investigations have been equivocal to someextent. One reason for the uncertainty is a fundamentalflaw in the experimental design of many of these studies.That is, the studies usually used pseudoreplication to testfor treatment effects, in which either the treatments werenot replicated or replicates were not statistically indepen-dent (14). The pseudoreplicate designs usually resultedfrom intense subsampling of unreplicated plots (1, 2, 8-11,13). Without full replication and random interspersion oftreatments, it is impossible to ascribe statistically significantdifferences in the response variable(s) to the treatments(14). The reason is simply that unknown, uncontrollablevariables (unidirectional longshore currents, spatially dis-tinct underground flows, prevailing winds, etc.) may existin different parts of the same experimental area that mayimpart bias to one of the treatments. The only way tocontrol this is to replicate the treatments and to randomlylocate and interdisperse them on the experimental plane.Then, if systematic geomorphological or other physicalbiases exist in certain areas, the statistical analysis can easilyaccount for them. Two studies that used proper replicationand randomization to demonstrate significant treatmenteffects were conducted in terrestrial environments ratherthan on marine beaches (15, 16). Since the physical factorsaffecting oil and nutrient removal, as well as the persistenceof introduced microorganisms, are so different in terrestrialand beach ecosystems, it is not possible to extrapolate fromthese studies to conclude that bioremediation will also beeffective on oil-contaminated coasts.
Another problem common to many field studies is thedifferences in the way the treated and control plots aremanipulated (1, 2, 8-11, 13). It is important to keepexperimental manipulation of the treatments identicalexcept for the one variable being tested, otherwise differ-ences cannot be attributed unambiguously to the processbeing evaluated. For example, in one of the studies (8), thecontrol plot was unamended and untouched whereas thetreated plot was watered and tilled daily in addition to thenutrient and microbial amendments. This confoundsconclusions regarding the cause of any observed differences.
Two recent reports have pointed to the need for morecontrolled studies of bioremediation for cleanup of oil-contaminated beaches (17, 18) because the current databaseis inadequate to provide guidance to spill responders. Inparticular, the relative advantages of biostimulation (i.e.,
* To whom correspondence should be addressed; telephone: 513-569-7668; fax: 513-569-7105; e-mail address: [email protected].
† U.S. Environmental Protection Agency.‡ University of Cincinnati.§ STATKING Consulting.
Environ. Sci. Technol. 1996, 30, 1764-1775
1764 9 ENVIRONMENTAL SCIENCE & TECHNOLOGY / VOL. 30, NO. 5, 1996 0013-936X/96/0930-1764$12.00/0 1996 American Chemical Society

addition of nutrients alone) and/or bioaugmentation (ad-dition of nutrients plus hydrocarbon-degrading bacteria)need further study (17). The goals of this project were toquantify the effectiveness of intrinsic biodegradation dueto natural levels of background nutrients already presentin the Fowler Beach area of Delaware Bay, to demonstratethe effectiveness of biostimulation and/or bioaugmentation,to determine the extent of any resulting rate enhancement,and to provide guidelines that can be used by spillresponders and on-scene coordinators for the effectivebioremediation of oil-contaminated sandy shores. Othergoals were to quantify the biological effects of the oil andof the bioremediation treatments using various types oftoxicity bioassays. Preliminary results of the toxicology workhave been published elsewhere (19).
Since huge quantities of crude oil and refined petroleumproducts are transported through Delaware Bay each year,the State of Delaware is concerned about the ecologicalimpact of a large oil spill in the area. Large quantities ofmigratory birds feed on the eggs deposited by horseshoecrabs (Limulus polyphemus) in the intertidal sands of theDelaware and New Jersey shores. Thus, an oil spill thatoccurred during spawning season could have catastrophiceffects on these bird populations as well as future genera-tions of horseshoe crabs.
Experimental SectionApproach. The null hypothesis was that biostimulationand/or bioaugmentation will not increase the rate or extentof removal of measured oil components over background.A randomized complete block design with repeated mea-sures was used to assess treatment effects. Five areas ofbeach were selected based on the depth to a layer of peatbelow the surface of the sand that extended from a saltwatermarsh several hundred meters west of the beach area. Eacharea (“block”) was large enough to accommodate fourexperimental units or test plots. The blocks were situatedin a row on the beach parallel to the shoreline. Threetreatments were tested on oiled plots: a no-nutrientaddition control, addition of water-soluble nutrients, andaddition of water-soluble nutrients supplemented with anatural microbial inoculum from the site. A fourth treat-ment, an unoiled and untreated plot, served as a backgroundcontrol for the biological recovery studies. The fourtreatments were randomized in each of the five blocks.
Experience from previous studies (20-22) suggested that,to minimize edge effects in a small plot study such as this,oil should be applied near the spring high tide line. Aschematic diagram of the block layout is summarized inFigure 1. The five blocks of four treatments were locatedon one long beach as shown. Each treatment plot measured36 m2 in area (4 m × 9 m). The distance between plotswithin a block was 10 m. The minimum distance betweenblocks was 10 m, although 104 m separated blocks 1 and2 and 154 m separated blocks 4 and 5. The plots were laidout using standard surveying equipment. The top of eachplot was positioned at the same elevation, measured relativeto benchmarks (fence posts) placed on the high dune area,so that all plots would experience the same levels ofsubmersion and exposure. Three steel fence posts weredriven in the middle of each plot on a line bisecting thelongitudinal axis of the plot. These were used to monitorthe change in beach topography with time (by measuringthe distance from the tops of the posts to the sand surface)as tide and wave action caused erosion and accretion of
the sand within the plots. Such topographical alterationscould artificially affect oil concentrations measured.
Detailed Description of Blocks. Each block wasequipped with its own gasoline-powered generator tosupply power to four electric pumps, one for each of thefour plots. The pumps supplied seawater with or withoutbioremediation amendments to their respective plots.Adjacent to each pump was a polyethylene reservoir holding800 L of seawater containing the appropriate amendmentsfor daily application to the plots. Slickbar booms were usedto contain the oil and free-moving oiled sand within theplots. These booms were 30 m in length and contained 0.6m long plastic floats riveted into a Kevlar skirted sheetextending about 0.6 m below the water surface. The boomswere held in place between pairs of steel pipe drivenapproximately 1 m below the surface of the sand and spacedevery 2.3 m around the perimeter of each plot. The boomsfloated on the water during flooding tides to contain floatingoil and served as dams containing oiled sand when the tideebbed. A sorbent boom was placed around the Slickbarboom as an added safety precaution in the event of anaccidental release beyond the primary containment. Thesorbent boom was removed several days after applicationof the oil, when floating oil was no longer observed. Lengthmeasurements were taken from the tops of the inner steelposts retaining the booms to the sand surface to supplementthe beach topography data.
Application of Oil to Plots. The crude oil used wasBonny Light (Escravos), which is imported from Nigeria. Ithad a specific gravity of 0.848, API gravity of 35.3, Reedvapor pressure of 6.9, viscosity of 5.6 CST at 21 °C, a pourpoint of -3 °C, and a sulfur content of 0.11% by weight. Itwas weathered prior to application by placing about 3 m3
in a 3.6 m diameter plastic tank, connecting a pump andhose, and continuously spraying and recirculating the oilwithin the tank for 2 days to evaporate the light fraction.Following this, the weathered oil was placed into 210-Ldrums (136 L/drum) to await application. Oil was appliedmanually by two four-membered teams on July 1, 1994.Two persons held onto each end of a 4 m length of pipeconnecting a hose to a pump that led into the 210-L drumcontaining the oil. The oil was pumped through the hoseout of four atomizer nozzles attached to the pipe manifold.The persons applying the oil walked slowly up and downthe plot while a third person lifted the trailing hose over thesteel pipe holding the containment booms in place. The
FIGURE 1. Layout of the randomized complete block design showingactual random order of plots on Fowler Beach.
VOL. 30, NO. 5, 1996 / ENVIRONMENTAL SCIENCE & TECHNOLOGY 9 1765

fourth person held a stopwatch and timed the walking paceof the appliers. The 136 L of oil was applied uniformly in14 sweeps of the plot over a period of about 7 min. A totalof 2040 L of crude oil was released onto the 15 plots.
Nutrient Application. The minimum nitrate concen-tration needed to support the maximum growth rate ofalkane degraders under continuous flow conditions rangesbetween 0.5 and 2.5 mg of N/L (23). Since nitrate in theinterstitial pore water is quickly diluted to background levelswhenever the incoming tide completely submerges the plot(24), we applied nutrients every day. To achieve the target1.5 mg/L average interstitial pore water concentrations, weassumed a 100-fold safety factor to account for dilution.Thus, the nutrients added to each of the 10 designatedreservoirs consisted of 2 kg of technical grade sodium nitrate(330 g of nitrogen) and 128 g of sodium tripolyphosphate(Na5P3O10), which is more soluble in seawater than ortho-phosphate. The nutrients were added to seawater in theappropriate reservoirs and dissolved by recirculating im-mediately prior to application to the plots. Once a week,30 L of a suspended mixed population of hydrocarbon-degrading bacteria was also added to the inoculum plots(see below).
The sprinkler system used for supplying the nutrientsconsisted of Schedule-40 PVC pipe (3.8 cm i.d.) connectedto six Maxi-Bird impact sprinkler heads per plot (Rainbird,Inc., Glendora, CA), each rated at 6 L/min. Electric pumps(rated at 70 L/min) were connected to the PVC sprinklermanifold via 15 m × 1.9 cm diameter garden hoses.Seawater was applied to all plots regardless of whether theyreceived nutrients, inoculum, or no amendment at all.
Inoculum Preparation. The indigenous inoculum wasgrown for 2 weeks in two 210-L stainless steel drums. Toallow weekly inoculation with fresh 2-week cultures, eachdrum was offset in time from the other by 1 week. Thedrums contained 170 L of seawater from Delaware Bay, theweathered Bonny Light crude oil (600 mL) as the sole carbonsource, and the same nutrients used on the beach. Theoriginal culture consisted of a mixed consortium isolatedfrom the same beach several months prior to the experimentand grown on the same Bonny Light crude oil. Theorganisms were not characterized as to genus and species.The number of alkane and aromatic degraders measuredin the drums were 1.9 × 10⁵/mL and 2.5 × 10⁴/mL,respectively. The oil in the drums became emulsified within1 day following each inoculation, signifying actively me-tabolizing cultures.
Sample Size, Frequency, and Handling. Sand sampleswere collected every 14 days from the 15 oiled plots. Eachplot was divided into four equal sectors (labeled R, â, γ, andδ, landward to seaward, respectively). Subsamples werecollected from each sector to determine if differences existedin oil biodegradation according to the length of time underwater. Two subsamples from each sector were collectedaccording to a predetermined random number sequencethat disallowed subsequent resampling from the same hole,composited into one sample, frozen, and shipped toCincinnati for extraction and analysis by GC/MS. Thus, 60samples, stratified within plots according to location withinthe intertidal zone and spread among 15 independent plots,were collected at each sampling event.
The subsamples consisted of two cores, each 7 cm indiameter × 14 cm deep, from one hole and two identicalcores from another hole from the same plot sector. Thesamples were composited and mixed by a trowel in a
galvanized bucket and placed in a prelabeled 3.8-L paintcan. After the composited samples were thoroughly mixed,subsamples were taken from the mixture for other types ofanalyses (microbiological and toxicological). A portion ofeach composited sample was frozen and archived in theevent that a re-analysis was needed at a later time.
Microbiological Analysis. Subsamples from each sectorof each plot, including the five unoiled plots (80 samplesaltogether), were placed in Whirlpak bags, brought backunder ice to the on-site mobile laboratory trailer, andimmediately processed for most probable number (MPN)analysis of alkane- and PAH-degrading bacteria (25).Approximately 10 g wet weight (exact weight was recordedafter weighing on a top-loading balance) was placed in adilution bottle containing 90 mL of sterile detachmentsolution (1 g/L disodium pyrophosphate and 20 g/L NaCl)and shaken for 1 h at 300 rpm. The samples were thenplaced onto a Beckman Biomek 1000 Laboratory Worksta-tion for automated serial 10-fold dilutions in 96-wellmicrotiter MPN plates. The growth medium was Bushnell-Haas (26) supplemented with 2% sodium chloride.
Oil Chemistry. Frozen sand samples from the field wereshipped to Cincinnati for processing. Either 100 or 500 gof sand was mixed with an equal volume of anhydrousNa2SO4. This mixture was extracted by sonicating threetimes for 10 min each with 150 or 450 mL of dichlo-romethane (DCM), respectively. This extract was pouredthrough a funnel packed with anhydrous Na2SO4 into atared round-bottom flask. The extract was then concen-trated to dryness with a rotary evaporator. The flask wasreweighed to determine the total DCM-extractable organicmaterial (EOM). The residue was redissolved in DCM anddiluted to a volume based on the amount of oil present.The final DCM extract was then solvent-exchanged tohexane. A 1.0-µL aliquot of the hexane extract was injectedinto a Hewlett-Packard 5890 Series II gas chromatographequipped with an HP 5971A mass selective detector (MSD).The MSD was operated in the selected ion monitoring (SIM)mode for quantifying specific saturated hydrocarbons,polynuclear aromatic hydrocarbons (PAHs), and sulfurheterocyclic constituents.
The GC was equipped with a DB-5 open tubular column(30 m long, 0.25 mm i.d., and 0.25 µm film thickness) anda split/splitless injection port operating in the splitlessmode. Operating conditions for the GC were as follows:injection port, 290 °C; transfer line, 320 °C; initial GC oventemperature, 55 °C held for 3 min; first temperature ramprate, 5 °C/min to 280 °C, held for 5 min; second temperatureramp rate, 3 °C/min to 310 °C, held for 10 min. The totalrun time was 73 min. All analyte data were normalized tothe conservative, nonbiodegradable biomarker C30-17R-(H),21â(H)-hopane (27, 28).
Nutrient Analysis. Concentrations of nitrate-N in theinterstitial pore water of oiled plots were measured eachday by collecting a sand core from each of the four sectorsof a randomly selected test plot and the longitudinalmidpoint of a nonnutrient control plot [to prevent interfer-ence with samples for oil analysis, the nutrient sampleswere all collected at the edges of the plots (i.e., within 30cm of the boom)]. Each of the five samples was extractedwith 1.0 L of deionized water on a shaker (the water hadbeen previously acidified by adding 1.0 mL of concentratedH2SO4 to 500 mL of deionized water). Nitrate concentra-tions were quantified on an autoanalyzer after the pH wasneutralized to 7.0 with 10 N NaOH. The method used was
1766 9 ENVIRONMENTAL SCIENCE & TECHNOLOGY / VOL. 30, NO. 5, 1996

based on cadmium reduction of nitrate to nitrite (29).Results were reported as milligram of nitrate-N/liter ofinterstitial water after determining the water content of thesample gravimetrically.
Laboratory Analysis of Biodegradation. To determinethe rate of biodegradation of oil components in closedlaboratory flasks for comparison to field observations, 500-mL respirometer flasks (30) were partially filled with 250mL of artificial seawater, 5.0 g/L weathered crude oil wasadded to each flask, and the reactors were inoculated witha mixed culture of oil-degrading bacteria isolated previouslyfrom Slaughter Beach, DE, which is located about 1 minorth of the Fowler Beach area. The flasks were sacrificedperiodically, and the entire contents was extracted withDCM followed by solvent exchange into hexane for GC/MSanalysis of the PAH components of the oil.
Statistical Analysis and First-Order Hopane-Normal-ized Biodegradation Model. Oil constituents can be lostfrom a beach by physical washout, dissolution, volatiliza-tion, and biodegradation. An underlying assumption ofthis work is that a nonbiodegradable constituent of oil(namely, hopane) can be used to estimate the first threeloss rate mechanisms and that the actual biodegradationrate of an analyte can be estimated from the differencebetween its total loss rate and its physical loss rate asestimated from the hopane loss rate. For this assumptionto be true, the physical washout rate of the oil must bedominant, and the individual physical loss removal mech-anisms of dissolution and volatilization must be negligible.Furthermore, due to the lack of more information aboutthe mechanism of biodegradation of each analyte, the rateof biodegradation is assumed to be first order. Based onthe aforementioned assumptions, the total loss rate of ananalyte, ((dA/dt)t, the total loss rate of hopane, (dH/dt)t,and the biodegradation rate of the analyte, -kA, are relatedby the following equation:
where A is the concentration of an analyte, H is theconcentration of hopane, and k is the first-order biodeg-radation rate constant for an analyte. Using the definitionof the derivative of a quotient, eq 1 can be rewritten as
Integrating eq 2 yields the following first-order relationship:
where (A/H) is the time-varying hopane-normalized con-centration of an analyte, and (A/H)0 is the value of thatquantity at time0.
Nonlinear regression analysis was used to estimate thefirst order rate of oil biodegradation for each of the threetreatments and for comparison of the treatments. Thecoefficients of determination (r2), which were derived fromall the data (i.e., five replicates per sampling event × eightsampling events), were determined by the adjustmentmethod of Kvalseth (31). Rate coefficients and interceptsof the three treatments were compared for statisticaldifferences. Statistically valid variability estimates and
power curves were obtained to aid the design of futurebioremediation studies.
ResultsVisual Observations. The crude oil was applied at low tideon the morning of July 1, 1994. The application was quiteuniform, as the coarse sand absorbed the oil almost instantlyas it was applied. The waves were mildly rough during thefirst high tide several hours later as winds picked up fromthe southeast. Waves breaking on the plots caused someoil to be lifted over the containment booms, and visiblesheens were observed floating on the water. The sorbentbooms were slightly discolored by the escaped oil. Theamount of oil that actually escaped, however, was negligible.The mean concentration of total petroleum hydrocarbons(gravimetric residue weight) in samples collected from all15 plots 4 days after application was 4.74 g/kg, which iswithin 5% of the amount of oil (5.0 g/kg) originally calculatedto be applied.
During the course of the experiment, significant move-ment of sand took place within the plots due to tide andwave action. This was especially evident at the peripheryof the plots because of the damming effect caused by theskirted containment booms. The three steel fence postsdriven in the middle of each plot along with the steel postsretaining the boom that fell on the same transect served asa means of measuring the resultant change in topography.
Physical Loss of Oil. To distinguish physical loss frombiodegradative loss of oil, the concentration of hopane inthe sand was quantified in each sample. The measuredoverall means and standard deviations of the hopaneconcentrations at T0, (i.e., the day nutrients and inoculumwere first applied) according to position within the intertidalzone were R-sector, 3.58 ( 1.82 mg/kg; â-sector, 3.73 (1.56 mg/kg; γ-sector, 2.90 ( 1.05 mg/kg; and δ-sector, 1.38( 1.05 mg/kg. Knowing that the concentration of hopanein Bonny Light crude oil was 597 ng/mg oil (from GC/MSanalysis), we computed the theoretical hopane concentra-tion in the sand at T0 to be 2.83 mg/kg sand (assuming thatwe sampled the entire oiled depth). This agrees well withthe measured overall mean hopane concentration, whichwas 2.90 ( 1.07 mg/kg (averaged over all sectors). Notethat the hopane concentrations were higher in the R- andâ-sectors of the plots and lower in the δ-sector. This wascaused by the breaking waves churning the oiled beachmatrix and carrying it landward, which is typical of the oildeposition pattern in an actual spill event (20, 21).
Figure 2a summarizes the overall disappearance ofhopane with time from each of the three oiled treatments.The data, which were averaged over all intertidal sectors,represent plot mean hopane losses. First-order nonlinearregression curves for each treatment were fitted to the data,and no differences in rate coefficients or y-intercepts werefound. Thus, an overall first-order curve was plottedthrough the pooled data, and a hopane half-life of 28 dayswas calculated. This was interpreted to represent physicalloss of crude oil due to wave action and tidal inundation,since hopane was assumed to be nonbiodegradable in thetime period of this experiment (1, 27, 28, 32). Figure 2b isa similar plot showing the temporal loss of total extractableorganic material from the plots. The half-life was 20 days.The EOM first-order rate coefficient was significantly higherthan the hopane disappearance rate. The difference inloss rates (and half-lives) between hopane and EOM isattributed to biodegradation because EOM includes both
(dAdt )t
- AH(dH
dt )t) -kA (1)
d(AH)
dt) -k(A
H) (2)
(AH) ) (A
H)0e-kt (3)
VOL. 30, NO. 5, 1996 / ENVIRONMENTAL SCIENCE & TECHNOLOGY 9 1767
biodegradable and nonbiodegradable components. How-ever, EOM is not a sensitive enough indicator to discerntreatment differences.
Nutrient Persistence. Table 1 summarizes the dailynitrate data from the oiled plots by block. The control plotsreceiving only seawater with no nutrients had measurableconcentrations of nitrate (mean of 0.82 mg/L), which wereapproximately half the 1.5 mg/L target level desired formaximum biodegradation. The concentrations in thenutrient and inoculum treated plots were substantiallyhigher. The Fowler Beach area of Delaware Bay was closeto farm land, where runoff could easily account for thehigh background levels found. Samples along the shorelineof Delaware Bay were collected late in the project atconsiderable distances south and north of our experimentallocation and even in the Chesapeake Bay area, and thesame high nitrate levels were measured. High nutrientlevels are common in this coastal area (38).
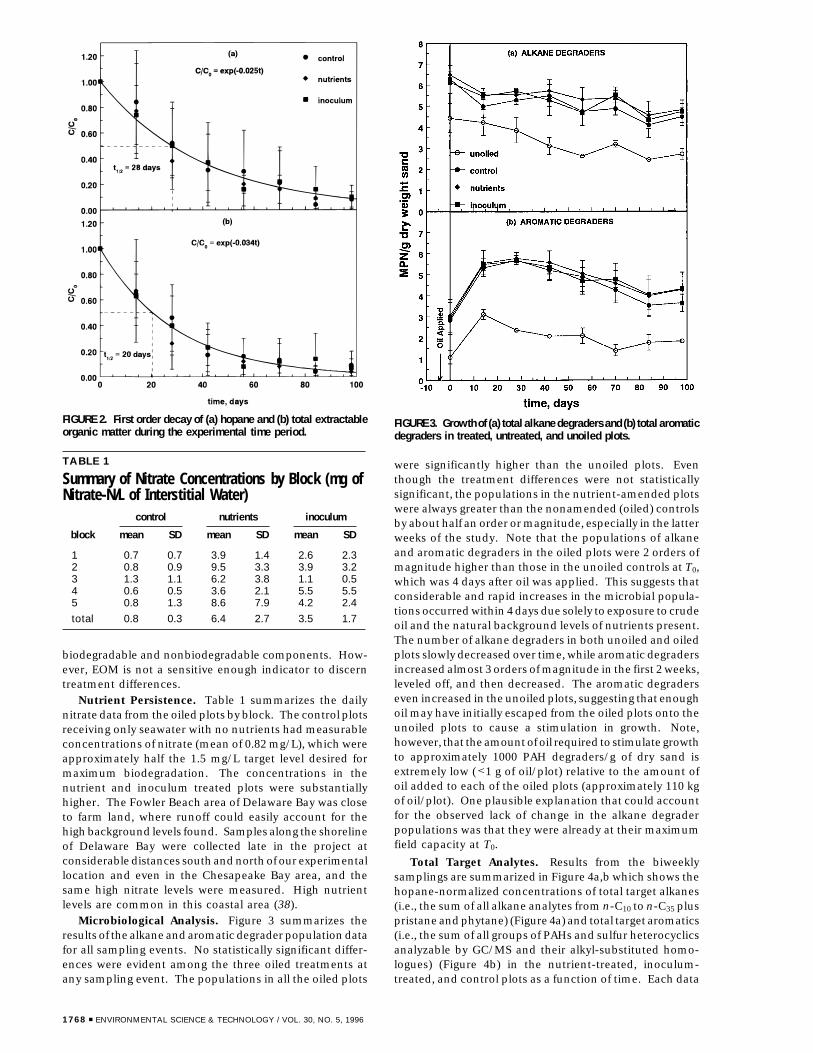
Microbiological Analysis. Figure 3 summarizes theresults of the alkane and aromatic degrader population datafor all sampling events. No statistically significant differ-ences were evident among the three oiled treatments atany sampling event. The populations in all the oiled plots
were significantly higher than the unoiled plots. Eventhough the treatment differences were not statisticallysignificant, the populations in the nutrient-amended plotswere always greater than the nonamended (oiled) controlsby about half an order or magnitude, especially in the latterweeks of the study. Note that the populations of alkaneand aromatic degraders in the oiled plots were 2 orders ofmagnitude higher than those in the unoiled controls at T0,which was 4 days after oil was applied. This suggests thatconsiderable and rapid increases in the microbial popula-tions occurred within 4 days due solely to exposure to crudeoil and the natural background levels of nutrients present.The number of alkane degraders in both unoiled and oiledplots slowly decreased over time, while aromatic degradersincreased almost 3 orders of magnitude in the first 2 weeks,leveled off, and then decreased. The aromatic degraderseven increased in the unoiled plots, suggesting that enoughoil may have initially escaped from the oiled plots onto theunoiled plots to cause a stimulation in growth. Note,however, that the amount of oil required to stimulate growthto approximately 1000 PAH degraders/g of dry sand isextremely low (<1 g of oil/plot) relative to the amount ofoil added to each of the oiled plots (approximately 110 kgof oil/plot). One plausible explanation that could accountfor the observed lack of change in the alkane degraderpopulations was that they were already at their maximumfield capacity at T0.
Total Target Analytes. Results from the biweeklysamplings are summarized in Figure 4a,b which shows thehopane-normalized concentrations of total target alkanes(i.e., the sum of all alkane analytes from n-C10 to n-C35 pluspristane and phytane) (Figure 4a) and total target aromatics(i.e., the sum of all groups of PAHs and sulfur heterocyclicsanalyzable by GC/MS and their alkyl-substituted homo-logues) (Figure 4b) in the nutrient-treated, inoculum-treated, and control plots as a function of time. Each data
FIGURE 2. First order decay of (a) hopane and (b) total extractableorganic matter during the experimental time period.
TABLE 1
Summary of Nitrate Concentrations by Block (mg ofNitrate-N/L of Interstitial Water)
control nutrients inoculum
block mean SD mean SD mean SD
1 0.7 0.7 3.9 1.4 2.6 2.32 0.8 0.9 9.5 3.3 3.9 3.23 1.3 1.1 6.2 3.8 1.1 0.54 0.6 0.5 3.6 2.1 5.5 5.55 0.8 1.3 8.6 7.9 4.2 2.4
total 0.8 0.3 6.4 2.7 3.5 1.7
FIGURE 3. Growth of (a) total alkane degraders and (b) total aromaticdegraders in treated, untreated, and unoiled plots.
1768 9 ENVIRONMENTAL SCIENCE & TECHNOLOGY / VOL. 30, NO. 5, 1996

point is the mean of five independent replicates, and theerror bars represent one standard deviation unit. They-intercepts of the three treatments were not significantlydifferent but the first-order rate coefficients were. Boththe alkane and the aromatic biodegradation rates in thenutrient- and inoculum-treated plots were significantlygreater than the control. Table 2 summarizes the intercepts,rate coefficients, and coefficients of determination (r2) forthe first-order relationships.
Individual Analytes. Figure 5 summarizes for each ofthe treatments the first-order biodegradation rate constantsof individual alkanes calculated by nonlinear regression.The estimated initial concentrations (y-intercepts) wereequivalent for all treatments, but the first-order ratecoefficients were significantly different among the treat-ments for all of the analytes. The hopane-normalized lossrates in the nutrient- and inoculum-treated plots weresignificantly greater than the unamended controls. Ho-pane-normalized rate constants for nutrient plots averagedapproximately 2.3-fold higher than control plots for normal
alkanes and about 1.6-fold higher for the isoprenoidhydrocarbons. The latter result was expected, sincebranched alkanes are known to be more resistant tobiodegradation than their straight-chain counterparts (33).Rate differences were somewhat lower for the inoculumand control plot comparisons, the inoculum plots yieldingabout 1.8-fold higher rate constants than the control plotsfor normal alkanes and 1.5-fold higher for the isoprenoids.
Figure 6 summarizes the comparative hopane-normal-ized first-order biodegradation rate constants of theindividual PAH groups. Figure 6a compares the nutrientplots to the controls, while Figure 6b compares the inoculumplots to the controls. The rate constants for the nutrient-treated plots were significantly higher than the control for16 of the 27 PAHs measured, whereas the rate constants forthe inoculum-treated plots were higher for only 4 of the 27compounds. The overall patterns of decay for all treatmentswere indicative of biologically mediated degradation reac-tions (34, 35), i.e., the rate constants were higher for allparent compounds except pyrene and chrysene andprogressively lower as more alkyl groups appeared on thering structure. Rate constants for the parent and mono-methylated naphthalene group were equal to or even greaterthan those of the lowest molecular weight alkanes in thenutrient-treated plots. Rate constants for the three-ringpolycyclics were approximately equivalent to those of theintermediate carbon number alkanes in the unamendedcontrol plots or the high carbon number alkanes of thenutrient-treated plots. The naphthobenzothiophenes hadthe highest rate constants among the four-ring PAH groups.Concentrations of the pyrene and chrysene groups in thisparticular crude oil were close to the detection limit of theinstrument, so calculated biodegradation rate constantsare less accurate than for other compounds.
Table 3 compares the first-order biodegradation rateconstants of the hopane-normalized two- and three-ringPAH compounds measured in the field to the rate constantsmeasured in sealed laboratory respirometer flasks. Alsoshown in Table 3 are the rates of the hopane-normalized
FIGURE 4. First-order declines in (a) total target alkanes (nC10-nC35
plus pristane and phytane) and (b) total target aromatics, includingalky-substituted homologues (error bars represent ( one standarddeviation unit).
TABLE 2
Summary of Rate Coefficients, Y-Intercepts, andCoefficients of Determination for the Total AnalyteBiodegradation Data
alkanes aromatics
treatment intercept k, day-1 r 2 intercept k, day-1 r 2
control 171.1 -0.026 0.879 17.4 -0.021 0.839nutrients 161.8 -0.056a 0.901 17.3 -0.031a 0.886inoculum 163.0 -0.045a 0.911 17.9 -0.026a 0.829
a Rate coefficient significantly different from control (p < 0.05).
TABLE 3
Comparison of First-Order Rate Constants ofHomologous PAHs Determined in the Laboratoryand the Field
field laboratory
PAH k, day-1
k relativeto highestsubstitutedhomologue k, day-1
k relativeto highestsubstitutedhomologue
ratio,kField/kLab
nap 0.302 13.727 0.734 4.170 3.29C1-nap 0.108 4.909 0.603 3.426 1.43C2-nap 0.045 2.045 0.340 1.932 1.06C3-nap 0.031 1.409 0.227 1.290 1.09C4-nap 0.022 1.000 0.176 1.000phe 0.046 3.067 0.365 3.614 0.85C1-phe 0.030 2.000 0.212 2.099 0.95C2-phe 0.020 1.333 0.162 1.604 0.83C3-phe 0.015 1.000 0.101 1.000flu 0.049 2.722 0.367 2.603 1.05C1-flu 0.029 1.611 0.246 1.745 0.92C2-flu 0.022 1.222 0.171 1.213 1.01C3-flu 0.018 1.000 0.141 1.000dbt 0.043 3.308 0.322 3.320 1.00C1-dbt 0.023 1.769 0.196 2.021 0.88C2-dbt 0.019 1.462 0.147 1.515 0.97C3-dbt 0.013 1.000 0.097 1.000
VOL. 30, NO. 5, 1996 / ENVIRONMENTAL SCIENCE & TECHNOLOGY 9 1769

parent and substituted homologous PAHs relative to theirrespective highest and least volatile substituted homologue.For all compounds except naphthalene and C1-naphtha-lene, the agreement in biodegradation rates of the sub-stituted homologues relative to their respective highestsubstituted homologue was nearly identical betweenlaboratory and field, i.e., ratios ranged from 0.83 to 1.09(last column, Table 3). The reason why the agreement brokedown for naphthalene and C1-naphthalene was that thelatter compounds are significantly more volatile than theothers; consequently, rate constants of these two com-pounds were greater in the field. These results verify ourinterpretation that the pattern of loss of homologous PAHsmeasured in this field study are indicative of biodegradationas opposed to mere physical loss or solubility differences.Losses measured in the field represent losses due towashout, dissolution, volatilization, and biodegradation,whereas losses measured in a sealed flask can only bebiodegradative. Since the relative rates measured in thefield closely approximated those measured in the laboratory,differences in the dissolution and volatilization rates amonghomologues were negligible relative to differences in thebiodegradation rates. Hopane normalization, which ac-counts for losses due primarily to washout, eliminates theuncertainty caused by all the physical factors acting on theoil components.
Positional Effects within the Intertidal Zone. Figure7 summarizes the hopane-normalized first-order rateconstants of the three treatments as a function of the plotsectors (i.e., R, â, γ, and δ) from which the samples weretaken. The greatest differences between treated and controlplots for both the saturate and the aromatic fractions of theoil were evident in the R-sector of the plots, i.e., the locationclosest to the high dune area of the beach. Somewhat lowerrates occurred in the â-, γ-, and δ-sectors. These datasuggest that more biodegradation occurred in the upperintertidal zone than in the lower intertidal area. This upperarea of the beach is submerged the least and is thus likely
to be exposed to higher aerobic conditions for a longertime period. It is also less subject to churning action ofbreaking waves, which occurs more on the lower portionof the beach. Thus, nutrients added for bioremediationpurposes would persist longer in the higher intertidal zoneand would be more available for continued biostimulation.To provide further support for this conclusion, we estimatedthe average time of submersion for each sector fromavailable tide tables. The R-sector was under water forapproximately 0.5 h/day, the â-sector for 2.5 h/day, theγ-sector for 6.5 h/day, and the δ-sector for 11 h/day.Submersion times were estimated independently for eachtidal cycle. These time estimates begin when the tidereached the midpoint of each sector on the rising tide andwhen it reached the same point on the subsequent fallingtide. These submersion times are based on average tidalelevations to the midpoints of the four sectors and representthe average time of submersion from rising tide to fallingtide.
Statistical Power Analysis. A statistical power test wasperformed to determine the number of replicates that wouldbe needed in future studies where the investigator wishedto determine differences among treatments, given similarexperimental conditions and variability as experienced inthis study. Figure 8a presents power curves for the saturatefraction (similar power curves, not shown due to spacelimitations, were generated for the aromatic fraction) fora varying sample size (number of replicate plots) and aconstant variance (σ). Figure 8b presents similar powercurves for a constant sample size but varying σ. For a powerof 80% (i.e., the probability that significant differencesbetween two or more treatments are detected when indeedthey exist), the difference in hopane-normalized alkanesbetween treated and untreated plots at any sampling timewould have to be >120 at two replicates, 63 at threereplicates, 47 at four replicates, 39 at five replicates, 31 atseven replicates, and 25 at 10 replicates to be statisticallydetectable at the variance experienced (Figure 8a). Actual
FIGURE 5. First-order biodegradation rates of all individual normal and branched alkanes computed by nonlinear regression of the dataover the entire 14-week experimental time period [error bars represent ( one standard deviation unit, and asterisks identify significantdifferences from untreated control plots (p < 0.05)].
1770 9 ENVIRONMENTAL SCIENCE & TECHNOLOGY / VOL. 30, NO. 5, 1996

observed differences averaged over weeks 4, 6, and 8 were41 ng of alkanes/ng of hopane. Had only four replicateplots been used, the difference of 41 ng of alkanes/ng ofhopane between the nutrient-treated plots and the controlplots would not have been detectable. If the differencehad been greater than 63 at any of those sampling events(i.e., due to a lower intrinsic biodegradation rate), we wouldhave been able to detect such a treatment difference withas little as three replicates of each treatment.
For a power of 80% with a constant number of replicateplots (five), the difference in hopane-normalized alkanesbetween treated and untreated plots would have to be 20at a variance of 8.3, 39 at a variance of 16.3 (the actualvariance encountered in this study), 61 at a variance of25.3, and 85 at a variance of 35.3 to be statistically detectable.Thus, if the expected variance in a future field study is 50%higher than that encountered in Delaware, a difference of61 ng of alkanes/ng of hopane would have to exist to bestatistically detectable with five replicates.
Topographical Changes. The plot-averaged change inelevation of beach sand relative to initial sand elevationsdetermined at the time of the initiation of the experimentwas computed for every sampling event. This calculationwas performed along a transect bisecting the plot perpen-
dicular to the water edge. Each plot had three internalposts and two edge posts along the transect. Depthmeasurements from the top of a post to the surface sandelevation were used for the calculations. The plot-averagedchange in elevation was calculated from the changes inelevations measured along the posts using the trapezoidalrule according to the equation:
where ∆h is the plot-averaged change in elevation (cm);∆hi is the change in elevation at posti (cm); and ∆xi is thedistance between posti and posti+1 (cm).
These ∆h data computed by the above procedureindicate very little change in average plot elevation overtime: the average change was 1.1 ( 2.9 cm for the oiledcontrol plots, 0.4 ( 2.5 cm for the nutrient plots, -2.4 (2.3 cm for the plots receiving both nutrients and inoculum,and -3.4 ( 4.6 cm for the unoiled control plots. It is clearfrom these data that little net sand movement occurredbetween the plots and the surrounding beach. Further-
FIGURE 6. First-order biodegradation rates of all aromatics and their alkyl-substituted homologues. (a) Comparison of nutrient and controlplots; (b) comparison of inoculum and control plots [error bars represent ( one standard deviation unit, and asterisks identify significantdifferences from untreated control plots (p < 0.05)].
∆h )1
∑i)1
4
∆xi
∑i)1
4
(∆hi + ∆hi+1)∆xi
2
VOL. 30, NO. 5, 1996 / ENVIRONMENTAL SCIENCE & TECHNOLOGY 9 1771

more, no meaningful difference existed between theboomed plots and the unboomed, unoiled plots relative tonet changes in sand elevation. Although no net change inelevation occurred in the unboomed portions of the beach,we observed considerable movement of sand with risingand falling tides throughout the experimental period. Thistype of dynamic sand movement is exactly what wouldhappen with oiled sand in a real spill where the whole beachis contaminated. However, in the latter instance, sandmovement will not result in a major change in oilconcentration in any one location because the whole beachis oiled. The fact that the boomed plots were able to retainthe oiled sand for the duration of the study implies thatresults observed from this bioremediation study shouldclosely simulate results expected from a study where theentire beach is oiled.
DiscussionIn designing bioremediation experiments on a sandy beach,one has to contend with the fact that sand is transportedinto, out of, and along a beach by several mechanisms.Some of the mechanisms responsible for the movement ofsand are tidal action, wind action, long-shore currents,animal and human activity, and storms. Since our permitlimited the application of oil to 4×9 m plots, any movementof sand might have resulted in oiled sand leaving and freshsand entering the plot. If the whole beach were contami-nated, this movement of sand would not result in any majorexperimental problems since both the sand entering and
leaving the plot would be contaminated; however, whenonly the plots are contaminated, any movement of sandwill result in artificially accelerated dilution of the oiledsand. The use of hopane as a biomarker provides aprocedure for overcoming this problem so that losses dueto biodegradation can be isolated. However, dilution mayresult in toxicity reduction for which hopane normalizationcannot account.
The two previously reported studies, which used rep-lication and randomization to support the demonstrationthat significant treatment effects occurred, were conductedin terrestrial environments rather than on marine beaches(15, 16). However, the abiotic loss mechanisms that actupon both the petroleum substrate and the nutrientamendments are substantially different in a beach envi-ronment as compared to a soil environment. The intertidalzones of beaches have much higher inputs of energy andflow-through of materials. The huge influx of seawater fromtidal inundation can bring about substantial losses ofhydrocarbons due to dilution. Surface waves as well as theinteraction of tides and underground water flow areextremely important transport mechanisms for nutrientsand bacteria and will affect the ability of exogenouslyintroduced microorganisms to survive and colonize suc-cessfully. Consequently, the experimental design in a beachremediation field study is critical for providing the infor-mation needed to support objective conclusions on treat-ment effects. A randomized complete block design is ideallysuited to test the biostimulation/bioaugmentation hypoth-esis.
Results presented in this paper were derived from fiveindependent replicates of three separate and distinct oiledtreatments. The reason why randomization was so im-
FIGURE 7. First-order biodegradation rates of (a) total target alkanesand (b) total target aromatics according to location within theintertidal zone (r-sector is closest to the high dune area; δ-sectoris closest to the water) (error bars represent ( one standard deviationunit).
FIGURE 8. Statistical power curves for hopane-normalized totalalkanes (a) for varying n and constant σ of 16.3 and (b) for varyingσ and constant n of 5.
1772 9 ENVIRONMENTAL SCIENCE & TECHNOLOGY / VOL. 30, NO. 5, 1996

portant was to enable inferences on treatment effects overthe whole experimental plane, not just the plots of interest.If a researcher has conducted a pseudoreplicate experimentand has assumed that no other effects except a treatmenteffect are present, then the inference will be limited to justthe two plots of beach used in the experiment rather thanthe whole beach area, since a random sample of the plots,not the whole beach, was used. This has been the case inthe vast majority of field studies reported (1, 2, 8-11, 13).In this study, we did not want to limit our conclusions tothe experimental plots; rather, we wanted to be able toinfer treatment effects over the entire beach. The only wayto accomplish this objectively was to sample randomly overthe whole beach or a representative section of it.
The information from the statistical power analyses isuseful for designing future research experiments involvingthree treatments in a randomized block design. If anexperimenter has good reason to assume a certain varianceand an expected treatment difference after a specified timeperiod, the power curves from Figure 8 can be used as anaid in designing the experiment.
Clearly, bioremediation of crude oil spilled on a sandybeach in the temperate climate of the east coast can takeplace extremely rapidly. The nitrogen concentrationsnaturally present along the coast of Delaware Bay werehigh enough to sustain rapid intrinsic rates of biodegrada-tion without human intervention. Although biostimulationwith an exogenous source of inorganic mineral nutrientsdid indeed significantly accelerate the rate of hydrocarbonbiodegradation, the incremental increase in biodegradationrate over the intrinsic rate (i.e., slightly greater than 2-foldfor the alkanes and 50% for the PAHs) (Table 2) might nothave been high enough to warrant a recommendation toactively initiate a major, perhaps costly bioremediationaction in the event of a large crude oil spill in that area. Thisfinding suggests that, in the event of a catastrophic oil spillimpacting a shoreline, the first task is to measure the naturalnutrient concentrations in that environment to determineif they are already high enough to sustain significant intrinsicbiodegradation. If they are high enough, the next task isto determine if such a nutrient loading is typical for thatarea and season (i.e., determine the impact of chronic runofffrom nearby agricultural practices or pollution from anupstream wastewater treatment plant or industrial dis-charge). Continuously renewable concentrations ap-proaching 1-2 mg of nitrogen/L of interstitial pore watershould support near optimum hydrocarbon biodegradationactivity. The decision to supplement natural nutrient levelswith an exogenous source should be based on how highthe natural levels are relative to this threshold. If we hadconducted this study on a beach with a similar temperatureregime but subtantially lower background levels of nitrogenand had encountered the same biodegradation rates in thenutrient-treated plots, the rate enhancement factor wouldhave been considerable because the background rate wouldlikely have been substantially lower than that observed. Insuch a case, the decision to implement bioremediationwould be unambiguous.
With respect to bioaugmentation as a means of en-hancing cleanup of an oil spill, results from this studysuggest that supplementation of natural populations withindigenous cultures from the same site may not result infurther enhancement over and above simple nutrientaddition. This conclusion could be extended to includeallochthonous sources of microorganisms because if in-
digenous cultures that are adapted to the environmentalconditions of the site do not accelerate the degradationrates, organisms enriched from different environments,grown in the laboratory, and not acclimated to a particularclimatic or geographical location should be even less ableto compete with the natural populations. The reason forthis is that hydrocarbon degraders are ubiquitous in nature(36), and when an oil spill occurs at a given site, the largeinflux of biodegradable carbon will cause an immediateresponse in the abundance of hydrocarbon-degradingpopulations (37). If nutrients are limiting, however, therate of oil biodegradation will be less than optimal.Supplying nutrients will enhance the succession initiatedby the spill, but supplying added microorganisms will notbecause they still lack the necessary nitrogen and phos-phorus to support growth on the oil carbon.
Perhaps of even more importance are the factors thatdetermine the carrying capacity for hydrocarbon degradersin a marine beach environment. The most importantinfluence is likely the physical removal rate caused byscouring of biomass when breaking waves tumble sandgrains. If that is the case and indigenous bacteria arepresent, then they can grow to the carrying capacity rapidlyif sufficient nutrients are present. Adding exogenoushydrocarbon degraders cannot increase the populationdensity because physical removal will control it. In thepresent study, if nutrient supplementation was sufficientto bring the background biodegradation rate to near itsmaximum, bioaugmenting the natural populations isunlikely to stimulate the rate further. Of course, thisassumes that what we observed was very near the maximumbiodegradation rate and that such a rate was determinedby something other than the growth rate of hydrocarbondegraders (e.g., oxygen concentration, maximum bacterialpopulation density, surface area available for attachment).If this is the case, then we cannot assume that bioaug-mentation is always unnecessary. This study suggests that,in addition to surveying the background nutrient levels ata spill site, the background hydrocarbon-degrading popu-lations should also be determined as part of the siteassessment. These levels should then be compared to somestandard to determine if bioaugmentation is necessary. Sucha standard does not exist at this time, but future researchthat would define the carrying capacities of variousenvironments and the mechanisms that control them couldbe fruitful in this regard.
The differences that we observed in the rates ofdisappearance of homologous PAHs cannot be explainedby differences in solubility or volatility. The biodegradationrates observed in sealed respirometer flasks showed nearlyidentical relative disappearance rates to those observed inthe field. This lends credence to our conclusion that thepatterns that we observed in the field were indicative ofbiodegradation, because losses due to volatilization anddissolution cannot occur in a closed system. Normalizingall measured analyte concentrations to hopane markedlyfacilitates conclusions regarding analyte biodegradabilityin the field. One must assume that hopane does notbiodegrade at rates approaching the other analytes andthat hopane is subject to the same physical loss factors towhich all other oil components are subject. Based on theexperience of this and other studies (1, 27, 28, 32), the firstassumption is well justified. The second assumption,however, is less certain. Hopane, which is a saturated, highmolecular weight alkane, behaves like one with respect to
VOL. 30, NO. 5, 1996 / ENVIRONMENTAL SCIENCE & TECHNOLOGY 9 1773

physical/chemical loss mechanisms. Despite this weak-ness, hopane normalization is useful as a first approximationfor monitoring the progress of biodegradation in the field.No truly universal surrogates are available, and the extremebiological recalcitrance of hopane places it among the mostreliable of available biomarkers. Used in combination withbiodegradability differences within homologous series,hopane normalization can provide strong evidence insupport of a biological removal mechanism during remedialoperations.
In summary, we have shown that significant intrinsicbiodegradation of petroleum hydrocarbons can take placenaturally if sufficient nutrients already exist in the impactedarea. We have also demonstrated statistically significantrate enhancement even in the presence of an already highintrinsic rate by supplementing natural nutrient levels withinorganic mineral nutrients. We affirmed that the decisionto apply nutrients and microorganisms should depend onthe background concentrations available at the contami-nated site. We have shown that bioaugmentation will likelynot significantly contribute to cleanup of an oil spill. Wehave developed for the first time from field data first-orderbiodegradation rate constants for the resolvable normaland branched alkanes and the important two- and three-ring PAH groups (and at least one four-ring PAH group)present in light crude oil. We have shown that the relativebiodegradation rates of homologous PAHs measured in thefield are close to those measured in the laboratory, thuscorroborating the rates as being due to biodegradation andnot physical washout or solubility differences. We haveconfirmed the importance of hopane as a useful biomarkerfor tracking biodegradation success in the field. We havedemonstrated that maintenance of a threshold concentra-tion of about 1-2 mg of nitrate-N/L of interstitial porewater will permit close to maximum hydrocarbon biore-mediation. We have shown that better hydrocarbonbiodegradation takes place in the upper intertidal zone thanin the lower intertidal zone. And, finally, we demonstratedthat the experimental conditions imposed by the boomssurrounding the plots did not diminish our ability tosimulate the sand movement that takes place naturally ona beach from long-shore currents and tidal inundations.
AcknowledgmentsWe wish to acknowledge the support and cooperation ofMr. Bennett Anderson of the Delaware Department ofNatural Resources and Environmental Control. We aregrateful to the hard-working field crew for their efforts inconducting the daily operations of the study. They wereMessrs. Martin De La Garza and John Knopp, New MexicoState University; Frank Vilar, Florida International Uni-versity; Jonathon O. Sharpe, Princeton University; JohnDarcy, Pennsylvania State University; and Gregory Wilson,University of Cincinnati. We thank the Marine SpillResponse Corporation for providing the containmentbooms for the beach plots and the Sun Oil Company forcontributing the crude oil. We acknowledge the ableassistance of Ms. Gail Thomas of the EPA’s Office of SolidWaste and Emergency Response in facilitating the permitapplication. We are also deeply grateful for the cooperationand generosity of Mr. and Mrs. Frank Draper, who ownedand contributed the parcel of land on Fowler Beach wherethe study was conducted; Mr. and Mrs. Bruce Blessing upon
whose property we set up our research trailers; and Mr.Joseph O. Penuel, who owned the parcel of beach propertyproviding access to the Draper site.
Literature Cited(1) Bragg, J. R.; Prince, R. C.; Harner, E. J.; Atlas, R. M. Nature 1994,
368, 413-418.(2) Halmo, G. In 1985 International Oil Spill Conference; American
Petroleum Institute: Washington, DC, 1985.(3) Lee, K.; Levy, E. M. In Proceedings of the 1987 International Oil
Spill Conference; American Petroleum Institute: Washington,DC, 1987.
(4) Lee, K.; Levy, E. M. In Aquatic Toxicology and Water QualityManagement; Nriagu, J. A., Ed.; John Wiley and Sons, Inc.: NewYork, 1989.
(5) Lee, K.; Levy, E. M. In Proceedings of the 1989 International OilSpill Conference; American Petroleum Institute: Washington,DC, 1989.
(6) Lee, K.; Levy, E. M. In Proceedings of the 1991 International OilSpill Conference; American Petroleum Institute: Washington,DC, 1991.
(7) Lee, K.; Tremblay, G. H.; Levy, E. M. In Proceedings of the 1993International Oil Spill Conference; American Petroleum Insti-tute: Washington, DC, 1993.
(8) Rosenburg, E.; Legmann, R.; Kushmaro, A.; Taube, R.; Adler, R.;Ron, E. Z. Biodegradation 1992, 3, 337-350.
(9) Sendstad, E. In Proceedings of the 3rd Arctic and Marine Oil SpillProgram; Environment Canada: Ottawa, 1980.
(10) Sveum, P. In Proceedings of the 10th Arctic and Marine OilspillProgram; Environment Canada: Ottawa, 1987.
(11) Sveum, P.; Ladousse, A. In Proceedings of the 1989 InternationalOil Spill Conference; American Petroleum Institute: Washington,DC, 1989.
(12) Pritchard, P. H.; Costa, C. F. Environ. Sci. Technol. 1991, 25,372-379.
(13) Pritchard, P. H.; Mueller, J. G.; Rogers, J. C.; Kremer, F. V.; Glaser,J. A. Biodegradation 1992, 3, 315-335.
(14) Hurlbert, S. H. Ecol. Monogr. 1984, 54 (2), 187-211.(15) Westlake, D. W. S.; Jobson, A. M.; Cook, F. D. Car. J. Microbiol.
1978, 24, 245-260.(16) Jobson, A. M.; McLaughlin, M.; Cook, F. D.; Westlake, D. W. S.
Appl. Microbiol. 1974, 27, 166-171.(17) Office of Technology Assessment. Bioremediation for Marine
Oil Spills; U.S. Government Printing Office: Washington, DC,1991.
(18) Science Advisory Board. SAB Review of the Alaskan Bioreme-diation Oil Spill Project; U.S. Environmental Protection Agency:Washington, DC, 1992; EPA-SAB-EPEC-LTR-92-015.
(19) Mearns, A.; Doe, K.; Fisher, W.; Hoff, R.; Lee, K.; Siron, R.; Mueller,C.; Venosa, A. D. Proceedings of the 18th Arctic and Marine OilspillProgram Technical Seminar; Environment Canada: Ottawa,1995; Vol. 2, pp 1133-1144.
(20) Owens, E. H.; Robson, W. Arctic 1987, 40 (Suppl. 1), 230-243.(21) Owens, E. H.; Harper, J. R.; Robson, W.; Boehm, P. D. Arctic
1987, 40 (Suppl. 1), 109-123.(22) Hayes, M. O.; et al. In Proceedings of the 1979 Oil Spill Conference;
American Petroleum Institute: Washington, DC, 1979; pp 192-198; API Publication 4308.
(23) Venosa, A. D.; Haines, J. R.; Suidan, M. T.; Wrenn, B. A.;Strohmeier, K. L.; Eberhart, B. L.; Holder, E. L.; Wang, X. InSymposium on Bioremediation of Hazardous Wastes: Research,Development, and Field Evaluations; U.S. Environmental Pro-tection Agency, Office of Research and Development: Wash-ington, DC, 1994; EPA/600/R-94/075; pp 103-108.
(24) Venosa, A. D.; Suidan, M. T.; Wrenn, B. A.; Haines, J. R.;Strohmeier, K. L.; Holder, E. L.; Eberhart, B. L. In TwentiethAnnual RREL Research Symposium, U.S. Environmental Protec-tion Agency: Cincinnati, OH, 1994; EPA/600/R-94/011; pp 139-143.
(25) Wrenn, B. A.; Venosa, A. D. Can. J. Microbiol., in press.(26) Bushnell, L. D.; Haas, F. F. J. Bacteriol. 1941, 41, 653-673.(27) Peters, K. E.; Moldowan, J. M. The Biomarker Guide; Prentice
Hall: Englewood Cliffs, NJ, 1993; 363 pp.(28) Seifert, W. K.; Moldowan, J. M. Geochim. Cosmochim. Acta 1979,
43, 111-126.(29) Technicon Industrial Systems. Industrial Method No. 158-71W;
Technicon Industrial Systems: Tarrytown, NY, 1972; 3 pp.
1774 9 ENVIRONMENTAL SCIENCE & TECHNOLOGY / VOL. 30, NO. 5, 1996

(30) Venosa, A. D.; Haines, J. R.; Nisamaneepong, W.; Govind, R.;Pradhan, S.; Siddique, B. J. Ind. Microbiol. 1992, 10, 13-23.
(31) Kvalseth, T. O. Am. Stat. 1985, 39, 279-285.(32) Butler, E. L.; Douglas, G. S.; Steinhauer, S.; Prince, R. C.; Aczel,
T.; Hsu, C. S.; Bronson, M. T.; Clark, J. R.; Lindstrom, J. E. InOn-Site Bioreclamation: Processes for Xenobiotic and Hydrocar-bon Treatment; Hinchee, R. E., Offenbuttel, R. F., Eds.; Butter-worth-Heinemann: Boston, 1994; p 515.
(33) Pirnik, M. P.; Atlas, R. M.; Barth, R. J. Bacteriol. 1974, 119, 868.(34) Cerniglia, C. E. Biodegradation 1992, 3, 351.(35) Bayona, J. M.; Albaiges, J.; Solonas, A. M.; Pares, R.; Garrigues,
P.; Ewald, M. Int. J. Environ. Anal. Chem. 1986, 23, 289.
(36) Prince, R. C. Crit. Rev. Microbiol. 1993, 19 (4), 217-242.(37) Pierce, R. H.; Cundell, A. M.; Traxler, R. W. Appl. Microbiol. 1975,
29 (5), 646-652.(38) Sharp, J. H. University of Delaware, personal communication,
1995.
Received for review October 17, 1995. Revised manuscriptreceived January 4, 1996. Accepted January 8, 1996.X
ES950754R
X Abstract published in Advance ACS Abstracts, March 15, 1996.
VOL. 30, NO. 5, 1996 / ENVIRONMENTAL SCIENCE & TECHNOLOGY 9 1775