Embed Size (px)
Citation preview

University of Central Florida University of Central Florida
STARS STARS
Electronic Theses and Dissertations, 2020-
2021
Biophysical Analysis of the Structure and Aggregation of Amyloid Biophysical Analysis of the Structure and Aggregation of Amyloid
beta Peptide beta Peptide
Faisal Abedin University of Central Florida
Part of the Biological and Chemical Physics Commons
Find similar works at: https://stars.library.ucf.edu/etd2020
University of Central Florida Libraries http://library.ucf.edu
This Doctoral Dissertation (Open Access) is brought to you for free and open access by STARS. It has been accepted
for inclusion in Electronic Theses and Dissertations, 2020- by an authorized administrator of STARS. For more
information, please contact [email protected].
STARS Citation STARS Citation Abedin, Faisal, "Biophysical Analysis of the Structure and Aggregation of Amyloid beta Peptide" (2021). Electronic Theses and Dissertations, 2020-. 630. https://stars.library.ucf.edu/etd2020/630

BIOPHYSICAL ANALYSIS OF THE STRUCTURE AND AGGREGATION
OF AMYLOID PEPTIDE
By
FAISAL ABEDIN
BS: Physics (University of Dhaka, 2012)
MS: Physics (University of Texas at El Paso, 2016)
A dissertation submitted in partial fulfilment of the requirements
for the degree of Doctor of Philosophy
in the Department of Physics
in the College of Sciences
at the University of Central Florida
Orlando, Florida.
Summer Term
2021
Major Professor: Suren Tatulian

ii
©2021Faisal Abedin

iii
ABSTRACT
Alzheimer’s disease (AD) is the major cause of dementia and is characterized by neuronal death
and brain atrophy. The amyloid β (Aβ) peptide is tightly associated with neuronal dysfunction
during AD, but the molecular mechanism underlying the neurotoxic effect of Aβ is poorly
understood. Extracellular fibrillar deposits (plaques) of Aβ were initially believed to be the cause
of AD, but currently there is overwhelming evidence that the prefibrillar Aβ oligomers are the
major toxic entities. Structural characterization of Aβ oligomers and fibrils is important for
understanding the structural features determining the toxic potency of the peptide. This project
has studied the aggregation and accompanying structural transitions of Aβ, a naturally occurring
hypertoxic species, i.e. pyroglutamylated Aβ, and their combination, using biophysical
approaches (circular dichroism, fluorescence, infrared spectroscopy). In addition, aggregation
and structure of overlapping peptide fragments have been studied to identify the specific stretch
of Aβ that serves as seeding region initiating the aggregation and fibril formation by the full-
length Aβ peptide. These studies elucidate the structural features of Aβ responsible for the
peptide’s neurotoxic action.

iv
Dedicated to my parents
A.B.M. Zainal Abedin
Morsheda Begum

v
ACKONWLEDGEMENT
I would like to acknowledge and give my warmest thanks to my supervisor (Dr. Suren Tatulian)
who has the attitude and the substance of a genius; he continuously and convincingly conveyed a
spirit of adventure in regard to research and made this work possible. His guidance and advice
carried me through all the stages of writing my project. I would also like to thank my committee
members for their continued support and encouragement: Dr. Talat Rahman, Dr. Aniket
Bhattacharya, Dr. Ellen Kang and Dr. Kenneth Teter. I offer my sincere appreciation for the
learning opportunities provided by my committee.
I would also like to give special thanks to and my family and very close friends for their continuous
support and understanding when undertaking my research and writing my project. Your prayer for
me was what sustained me this far.
Finally, I would like to thank God, for letting me through all the difficulties. I have experienced
your guidance day by day.

vi
TABEL OF CONTENTS LIST OF FIGURES ...................................................................................................................... vii
LIST OF TABLES .......................................................................................................................... x
CHAPTER 1: INTRODUCTION ................................................................................................... 1
1.1 Amyloid β Peptide Structure and Toxicity ........................................................................... 1
1.2 Different Forms of Aβ .......................................................................................................... 3
1.3 Protein Structure ................................................................................................................. 10
1.4 Protein-Protein Interaction .................................................................................................. 13
1.5 Protein Solubility ................................................................................................................ 15
1.6 Basic Aspects in Protein Stability ....................................................................................... 16
CHAPTER 2: RESEARCH STRATEGY .................................................................................... 18
2.1 Fourier Transform Infrared (FTIR) Spectroscopy .............................................................. 18
2.2 Circular Dichroism (CD) Spectroscopy .............................................................................. 24
2.3 Fluorescence Spectroscopy (FS) ......................................................................................... 30
2.4 Peptide Preparation ............................................................................................................. 31
2.4.1 Preparation for Structure and Aggregation of Aβ1-40 and Pyroglutamylated pEAβ3-
40 Separately and Combined. ............................................................................................... 31
2.4.2 Preparation for Segmental Aggregation and Structural Propensities of Amyloid beta
(Aβ) Peptide .......................................................................................................................... 34
CHAPTER 3: RESULTS AND DISCUSSION ............................................................................ 37
3.1 Structure and Aggregation of Aβ1-40 and Pyroglutamylated pEAβ3-40 Separately and
Combined. ................................................................................................................................. 37
3.1.1 Kinetics of Fibrillogenesis: .......................................................................................... 37
3.1.2 Peptide Structure from Circular Dichroism ................................................................. 40
3.1.3 Peptide Structure from FTIR Spectroscopy ................................................................. 45
3.1.4 Kinetics of Structural Transition upon Hydration from Gas Phase ............................. 46
3.2 Segmental Aggregation and Structural Propensities of Amyloid beta (Aβ) Peptide .......... 56
3.2.1 Peptide Secondary Structure from FTIR Spectroscopy ............................................... 57
3.2.2 Peptide Secondary Structure from Circular Dichroism (CD) Spectroscopy ............... 60
3.2.3 Aggregation and Fibrillogenesis .................................................................................. 63
3.2.4 Effects of Aβ Fragments on Aβ Fibrillogenesis .......................................................... 67
CHAPTER 4: CONCLUSION ..................................................................................................... 78
REFERENCE ................................................................................................................................ 80

vii
LIST OF FIGURES Figure 1. 1: The non-amyloidogenic and amyloidogenic pathways of APP processing. Cleavage
of APP by 𝛼-secretase produces sAPP𝛼 which is harmless, whereas cleavage of APP by β- and
γ-secretases produces the amyloidogenic Aβ peptide. Source: Petra E. Spies et al. [23]. .............. 2 Figure 1. 2: (Left) N- truncations can generate Aβ peptides with exposed glutamate at position 3
or 1. Aβ peptide sequence is shown for the first 20 residues. Glutaminyl cyclase (QC) converts
exposed glutamate residues to the more hydrophobic and aminopeptidase resistant pyroglutamate
residue. (Right) Schematic representation of pE-Aβ formation and the resulting biophysical and
biochemical effects. Multiple potential mechanisms for Aβ N-terminal truncation have been
proposed—the exact mechanism could involve one or more of these pathways or a yet
unidentified cleavage process. Source: Gunn et al. [46]. ................................................................ 6
Figure 2. 1: The regions of the electromagnetic spectrum. ........................................................... 18 Figure 2. 2: Visualization of all different molecular vibrations, arrows indicate movements
resulting from repulsion caused by electronegativity. Specific molecules move on a specific
frequency, which absorbs energy when it equals light frequencies (source: USDA) ................... 20 Figure 2. 3: Linearly (left) and circularly (right) polarized light. ................................................. 26 Figure 2. 4: Origin of the CD effect. (A) The left (L) and right (R) circularly polarized
components of plane polarized radiation: (I) the two components have the same amplitude and
when combined generate plane polarized radiation; (II) the components are of different
magnitude and the resultant (dashed line) is elliptically polarized. (B) The relationship between
absorption and CD spectra. Band 1 has a positive CD spectrum with L absorbed more than R;
band 2 has a negative CD spectrum with R absorbed more than L; band 3 is due to an achiral
chromophore. (C) Elliptical polarized light (violet) is composed of unequal contributions of right
(blue) and left (red) circular polarized light. ................................................................................. 28
Figure 3.1. 1: Th-T fluorescence spectra of 50 µM Aβ1-40 (a) pEAβ3-40 (b), and their equimolar
combination (c) incubated in aqueous buffer containing 25 mM NaCl, 20 µM Th-T, 25 mM
Na,K-phosphate (pH 7.2) at 25oC. All samples have been constantly mixed in a rotatory mixer
between measurements for 200 hours. Only spectra at selected time intervals, indicated in panel
a, are shown. Excitation was at 435 nm. Panels d, e, and f show the time courses of Th-T
fluorescence and the single-exponential fits of data in panels a, b, c, respectively. For each
peptide sample, data from a selected experiment are shown. The rate constants from these
particular experiments are as follows: k = 0.031 h-1 for Aβ1-40 (d), k1 = 0.300 h-1 and k2 = 0.012
h-1 for pEAβ3-40 (e), k = 0.095h-1 for the 1:1 mixture (f). .............................................................. 38 Figure 3.1. 2: Circular dichroism spectra of Aβ1-40, pEAβ3-40, and their 1:1 molar combination
dissolved in HFIP at 50 µM total peptide concentration and in dry state, as indicated. ............... 41 Figure 3.1. 3: Circular dichroism spectra of Aβ1-40 (a), pEAβ3-40 (b), and their 1:1 molar
combination (c) incubated in aqueous buffer (25 mM NaCl, 20 µM ThT, 25 mM Na,K-
phosphate, pH 7.2) at 50 µM total peptide concentration for time periods indicated in panel a
(color code is the same in panels a, b, c). Kinetics of transition from unordered structure to β-
sheet structure are presented in panel d as 𝜃205/ 𝜃217 for Aβ1-40 and the 1:1 combination and 𝜃205/
𝜃222 for pEAβ3-40. Lines are single-exponential fits with rate constants of 0.064 h-1 for Aβ1-40,
0.109 h-1 for pEAβ3-40, and 0.049 h-1 for the combined sample. For each peptide sample, data
from a selected experiment are shown. ......................................................................................... 42

viii
Figure 3.1. 4: FTIR spectra (a) and inverted second derivatives (b) of Aβ1-40, pEAβ3-40, and their
1:1 combination, as indicated in panel (a), incubated in aqueous buffer of 25 mM NaCl, 25 mM
Na,K-phosphate in D2O, pD 7.2, for 1.5 – 2.0 hours. ................................................................... 46 Figure 3.1. 5: (a): FTIR spectra of Aβ1-40 in dry state and after exposure to D2O vapor from 5 sec
to 5 min, as indicated. (b): Dependence of β-sheet/α-helix ratio on time of hydration from gas
phase is fitted with a single-exponential line with a rate constant of k =1.49 min-1. .................... 48 Figure 3.1. 6: FTIR spectra of 13C-Aβ1-40 (a), pEAβ3-40 (b), and their 1:1 combination (c) in dry
state (black) and exposed to D2O vapor from 5 s (dark blue) to 5 min (red). The color code is the
same as in Figure 5. Kinetics of α-helix to β- sheet transitions of 13C-Aβ1-40, pEAβ3-40 and the
combination are presented in panels d, e, f, respectively. Data are fitted with single-exponential
lines with rate constants k = 0.93 min-1 for 13C-Aβ1-40 and k = 1.29 min-1 for pEAβ3-40, measured
individually. For the combined peptide sample, structural transitions of 13C-Aβ1-40 and pEAβ3-40,
following the short lag period, are characterized with rate constants k = 1.84 min-1 and k = 1.88
min-1 (red and blue lines in panel f, respectively). ........................................................................ 50 Figure 3.1. 7: Inverted second derivatives of FTIR spectra of Aβ1-40 (a), 13C-Aβ1-40 (b), pEAβ3-40
(c), and the 1:1combination of 13C-Aβ1-40 and pEAβ3-40 (d) in dry state (black line) and exposed
to D2O vapor for 10 s, 20 s, 30 s, 1 min, 2 min, 3 min, 4 min, and 5 min (gray to red), derived
from spectra shown in Figures 5 and 6. The wavenumbers of most prominent spectral features
are indicated. ................................................................................................................................. 55
Figure 3.2. 1: Overlapping Aβ peptide fragments and the parent Aβ1-42 peptide, presented as
single single-letter sequences, along with the theoretical isoelectric point (pI) values. ............... 57 Figure 3.2. 2: FTIR spectrum of Aβ1-42 dried on a CaF2 disk from 50 𝜇M HFIP solution. Amide I
and amide II peaks are located around 1657 cm-1, amide II around 1537 cm-1, respectively. ...... 58 Figure 3.2. 3: FTIR spectra at indicated times of incubation in D2O-based buffer (25 mM NaCl,
25 mM Na,K-phosphate, pD 7.2) for Aβ1-42 (a) and peptides P1 (b), P2 (c), P3 (d), P4 (e), P5 (f),
P6 (g), and P7 (h) at 25oC. The concentrations of the peptides were 50 µM for Aβ1-42 and 100
µM for the fragments. Times of incubation in buffer of all fragments are indicated in panel b. . 58 Figure 3.2. 4: CD spectra of Aβ1-42 (a), P1 (b), P2 (c), P3 (d), P4 (e), P5 (f), P6 (g), and P7 (h)
dissolved in HFIP (solid) and in dry state (dotted). The concentration of Aβ1-42 in HFIP is 35 µM
and that of the fragments is 100 µM. The spectra of dry peptides are scaled up by a factor of 5
for better comparison. Averaged from three experiments. ........................................................... 60 Figure 3.2. 5: CD spectra of 50 µM Aβ1-42 (a) and 100 µM of peptides P1 (b), P2 (c), P3 (d), P4
(e), P5 (f), P6 (g), and P7 (h) constantly stirred by a tube rotator in buffer (25 mM NaCl, 25 mM
phosphate, pH 7.2) for time periods indicated in panel (a) for Aβ1-42 and in panel (b) for all
fragments. All measurement were conducted at 25oC. Average data from three independent
experiments. .................................................................................................................................. 62 Figure 3.2. 6: ThT fluorescence with excitation at 435 nm (a) and light scattering with incident
light at 550 nm (c) of 35 µM Aβ1-42 in buffer (25 mM NaCl, 25 mM Na,K-phosphate, pH 7.2)
stirred by a tube rotator for time periods indicated in panel (a). Time dependence of ThT
fluorescence averaged between 475 and 485 nm and of light scattering averaged between 550
and 555 nm are presented in panels (b) and (d), respectively. Average data from three
independent experiments. ............................................................................................................. 64 Figure 3.2. 7: ThT fluorescence spectra of P1, P2, P3, P4, P5, P6, and P7 (panels 1 through g,
respectively) with excitation at 435 nm, at 25oC. Time of incubation of peptide samples in buffer
(25 mM NaCl, 25 mM Na,K-phosphate, pH 7.2) at 100 µM concentration with constant stirring
ix
by a tube rotator is as follows: 0.1 h (dark blue), 2.0 h (light blue), 4.0 h (turquoise), 16.0 h
(green), 40.0 h (yellow), 64.0 h (orange), 104.0 h (red). Panel h shows the time dependence of
ThT fluorescence averaged between 475 and 485 nm for all seven peptides. Average data from
three independent experiments. Error bars are shown only for P1, P3, P4, P6, P7 to maintain
clarity. Error bars for P2 and P5 are of similar magnitude as for those of P1 and P4. ................. 65 Figure 3.2. 8: Time progression of light scattering spectra of peptides P1 (a), P2 (b), P3 (c), P4
(d), P5 (e), P6 (f), and P7 (g) at 100 µM. Color code in panels (a) through (g) is the same as in
Figure 3.2.7. Panel (h) shows time course of light scattering for all seven peptides. Standard
deviation bars from three experiments are only shown for selected peptides to maintain clarity.
Error bars for other peptides are of similar magnitude. ................................................................ 66 Figure 3.2. 9: Time progression of ThT fluorescence spectra (excitation= 435 nm) of Aβ1-42 in
aqueous buffer at 35 M (a), and with 70 M of P1 (b), P2 (c), P3 (d), P4 (e), P5 (f), P6 (g), and
P7 (h). Buffer: 25 mM NaCl + 25 mM phosphate (pH 7.2). ........................................................ 67 Figure 3.2. 10: Time dependence of ThT fluorescence at 480 nm (excitation= 435 nm) of Aβ1-42
alone and in the presence of 2-fold molar excess of peptides 1 to 7, as indicated. Buffer: 25 mM
NaCl + 25 mM phosphate, pH 7.2. ............................................................................................... 69 Figure 3.2. 11: Inhibition percentages for P1 through P7 calculated based on ThT fluorescence
data (Figures 3.2.6, 3.2.7, 3.2.10) averaged between 32 and 48 hours of incubation of Aβ1-42
alone and with each peptide fragment at 2-fold molar excess in buffer (25 mM NaCl, 25 mM
Na,K-phosphate, pH 7.2). See details in Materials and Methods. ................................................ 70 Figure 3.2. 12: Proposed mode of aggregation of P3. Red, blue, and green side chains are those
of Glu11, Lys16, and His 13 and 14. All other side chains are omitted for clarity. The monomer
𝛽- strand structure is shown as a gray ribbon. The fibril would grow by means of intermolecular
H-bonding perpendicular to the plane of the image...................................................................... 72

x
LIST OF TABLES Table 3.1. 1: Rate constants of the increase in Th-T fluorescence of Aβ1-40, pEAβ3-40, and their
equimolar combination upon incubation in aqueous buffer. ........................................................ 39 Table 3.1. 2: Rate constants of the transition from unordered to β-sheet structure of Aβ1–40,
pEAβ3–40, and their equimolar combination upon incubation in aqueous buffer. ......................... 43 Table 3.1. 3: Rate constants (k, min−1) and limiting β-sheet/α-helix ratios ((β/α)max) for α-helix
to β-sheet transitions of Aβ1–40, 13C-Aβ1–40, and pEAβ3–40 separately and in equimolar
combination upon exposure to D2O vapor of dry peptide samples. ............................................. 51

1
CHAPTER 1: INTRODUCTION
1.1 Amyloid β Peptide Structure and Toxicity
Alzheimer’s disease (AD) is a neurodegenerative pathology that mostly affects elderly
people and causes cognitive decline and dementia. The underlying pathology is brain atrophy,
synaptic loss and neuronal cell death [1]. At the molecular level, extracellular fibrillar deposits
(plaques) formed by the amyloid β (Aβ) peptide and intracellular accumulation of neurofibrillary
tangles of tau protein are the major histopathological traits of AD [2-4].
Aβ plaques were initially believed to cause the onset and progression of AD, but further
studies provided strong evidence that the prefibrillar oligomeric form of Aβ, rather than fibrillar
aggregates, constitutes the main cytotoxic entity [5]. The molecular mechanism by which Aβ
oligomers kill neuronal cells is yet to be identified, but the extensive research has delineated
several pathways. One of the prevalent mechanisms of Aβ neurotoxicity is formation of pores or
ion channels in cellular membranes, causing dysregulation of cellular homeostasis and neuronal
cell death [6-8]. For example, binding of Aβ to the endoplasmic reticulum (ER) and pore
formation results in Ca2+ release, followed by abnormal activation of certain cytosolic enzymes
and apoptotic cell death [9-13]. Recruitment of Aβ to mitochondria and altered mitochondrial
dynamics has been identified as another mechanism of apoptotic neuronal cell death during AD
[10,14-17]. Lastly, a variety of unrelated receptors bind Aβ, leading to disruption of cell
signaling pathways and cellular damage through apoptosis or necrosis [18-20].
Aβ is derived from a bitopic protein in neuronal membrane, amyloid precursor protein
(APP), by β- and γ-secretases, which cleave APP in the transmembrane and extracellular
juxtamembrane regions [21]. The pathogenicity of Aβ depends on many factors, specifically the
peptide species, their aggregation state, the composition of the assemblies, and the peptide's

2
secondary, tertiary, and quaternary structures. Due to poor sequence specificity of the secretases,
as well as because of further proteolytic processing, Aβ species of various lengths are produced
in human brain. The 40 and 42-amoino acid residue peptides (Aβ1-40 and Aβ1-42 are) are the
prevalent forms. APP can also be cleaved by -secretase, which does not produce A (Figure
1.1)
It has been reported that the Aβ oligomers undergo a conformational switch from random
coil or α-helix to highly toxic β-sheet structure [22]. Successful design of molecules capable of
interacting with
Figure 1. 1: The non-amyloidogenic and amyloidogenic pathways of APP processing. Cleavage
of APP by 𝛼-secretase produces sAPP𝛼 which is harmless, whereas cleavage of APP by β- and
γ-secretases produces the amyloidogenic Aβ peptide. Source: Petra E. Spies et al. [23].
Aβ as inhibitors of aggregation or as inhibitors of membrane pore formation may lead to
fundamental progress in the improvement of anti-Alzheimer therapies [24,25]. However, such
efforts will require a detailed knowledge of the structural features of various toxic forms of Aβ
peptides. The major objective of this project is to help accumulate such knowledge. Specifically,
the project is designed to achieve a mechanistic understanding of the conformational changes of

3
Aβ peptide in aqueous environment by using biophysical approaches, such as circular dichroism
(CD), Fourier transform infrared spectroscopy (FTIR) and fluorescence spectroscopy (FS).
1.2 Different Forms of Aβ
The full-length Aβ1-42 with sequence NH2-DAEFRHDSGYEVHH QKLVFFAEDVGSN
KGAIIGLMVGGVVIA-COOH is amphiphilic as its N-terminal half is hydrophilic and the C-
terminal half is mostly nonpolar. Interaction of Aβ1-42 with ER membrane has been shown to
activate the ryanodine receptor ion channel and dysregulate intracellular calcium homeostasis
[26, 27]. Lin et al. [28] have shown that Aβ1-42 has globular structure that forms multimeric
channel-like assemblies in a planar lipid bilayer. Alternatively, it has been reported that Aβ forms
fibrils consisting of antiparallel β-sheets and β-hairpins at residues 24 to 29, with intramolecular
hydrogen bonding between β-strands on either side of a β-turn and a bend in residues 23 to 26
[29].
Aβ1–40 is the most abundant Aβ species and possesses significant neurotoxicity. Coles et
al. [30] reported that the first 14 residues of Aβ1–40 are structurally disordered in the fibrils, the
rest of the protein adopts an α-helical conformation between residues 15 and 36 with a kink or
hinge at 25−27. Aβ1–40 contains central (residues 17-21) and C-terminal (residues 30-40)
hydrophobic segments. Formation of parallel β-sheet structure might be hampered by
electrostatic repulsions between similar charges.
Recently, Alomar et al have done an observational study of Aβ1–42 and Aβ1–40 in the
cerebrospinal fluid during pregnancy. There it has been documented the higher concentrations of
Aβ1-42 in cerebrospinal fluid of third trimester pregnancies and correlations between the beta-
amyloid ratio and the vascular endothelial growth factor support the hypothesis that beta-amyloid
peptides are involved in complex adaptive brain alterations during pregnancy.[31]

4
it has been reported that transition of Aβ1–40 from α-helical structure cytotoxic β-sheet structure
occurs due to the variation in the solvent polarity; additionally, change in pH and salt
concentration cause transition of oligomers into protofibrils, followed by amyloid fibril
formation [32]. There is evidence that amyloid fibrils of Aβ1–40 initiate amyloid formation in
different globular proteins and metabolites, converting native structures into β-sheet rich
assemblies [33]. Moreover, contacts between Aβ peptide’s cross β structure and the native folds
of proteins mediated through H-bonds and hydrophobic interactions, resulting in onset of
amyloid cross-seeding [33]. It has also been reported that the mixture of monomeric 13C-labeled
Aβ1–40 and unlabeled Aβ1–42 form mixed oligomers with largely random distribution of Aβ1–40
and Aβ1–42 [34]. A combination of nuclear magnetic resonance, thioflavin-T fluorescence,
transmission electron microscopy and dynamic light scattering was applied to characterize the
aggregation kinetics of Aβ1-40 peptide where it was reported that at 37 °C soluble Aβ1-40 remains
intrinsically disordered and mostly in monomeric form despite evidence of the presence of
dimers and/or other small oligomers.[35]
Okada et al. [36] reported that the fibril formation of Aβ1–40 on monosialoganglioside
GM1 clusters are more cytotoxic than those formed in aqueous solution and the structure of this
highly toxic fibril contains in register parallel and two-residue-shifted antiparallel β-sheet
however less toxic fibril contains only in register parallel β-sheet. The study of aggregation Aβ1–
40 was performed by using NMR spectroscopy which showed that the aggregation was initiated
by reversible transient oligomers, followed by formation of fibrils [37].

5
The brains of cognitively normal individuals may contain large amounts of Aβ peptides
[38]. During the onset and progression of AD, N-terminally truncated hypertoxic Aβ species
bearing the pyroglutamate modification accumulates and reaches 40-50% of total Aβ load [39-
46]. It has been reported that pyroglutamate-Aβ (pE-Aβ) has a higher proclivity for aggregation
than the unmodified full-length Aβ by a seeding mechanism and is resistant to degradation,
allowing these peptides to persist in biological fluids and tissues [38]. The formation of pE-Aβ is
a multi-step process (Figure 1.2). Naturally occurring enzymatic removal of the first two amino
acid residues of Aβ and pyroglutamylation of Glu3 produces Aβ species of elevated toxicity, i.e.,
pEAβ 3-40 [47,48].
pEAβ3-40 is more hydrophobic than Aβ1-40 due to the loss of negative charges from the
Asp1 and Glu3 residues, and formation of the lactam ring in the pE residue. AβpE3-40 aggregates
earlier and acts as a seed for Aβ aggregation by self-aggregation and co-aggregation with Aβ1-
40/42, playing a critical role in the early stage of amyloid formation in AD displaying an enhanced
cytotoxicity [49].

6
Figure 1. 2: (Left) N- truncations can generate Aβ peptides with exposed glutamate at position 3
or 1. Aβ peptide sequence is shown for the first 20 residues. Glutaminyl cyclase (QC) converts
exposed glutamate residues to the more hydrophobic and aminopeptidase resistant pyroglutamate
residue. (Right) Schematic representation of pE-Aβ formation and the resulting biophysical and
biochemical effects. Multiple potential mechanisms for Aβ N-terminal truncation have been
proposed—the exact mechanism could involve one or more of these pathways or a yet
unidentified cleavage process. Source: Gunn et al. [46].
Circular dichroism (CD) data showed that in trifluoroethanol (TFE)/water (1:5, v/v)
mixture, pEAβ3-40 displayed an increased β-sheet propensity while Aβ1-40 formed α-helical
structure [50]. In addition, thioflavin-T (ThT) fluorescence assay identified typical sigmoidal
aggregation kinetics for pEAβ3-40 whereas Aβ1-40 showed no ThT signal, indicating resistance to
fibrillogenesis. Transmission electron microscopy (TEM) identified β-sheet-rich fibrils for
pEAβ3-40. Finally, NMR data showed significant structural differences in the N-terminal regions

7
of Aβ1-40 and pEAβ3-40 , which decreases monomer stability of the latter peptide and promotes
cross β-sheet fibril formation.
By performing the analysis of senile plaques, the aggregated individual pEAβ and
unmodified Aβ as well as their heterogeneous intermixed were found.[51] further study had
shown that the immunohistochemical examination of postmortem brains of different ages
revealed that plaques in brains of younger subjects contained mostly pEAβ, and the ratio
Aβ/pEAβ increased with age, suggesting that deposition of pEAβ leads that of the Aβ.[51] The
pEAβ load in postmortem human brains correlated with hyperphosphorylated tau protein and
predicted AD better than unmodified Aβ.[52] Harigaya et al. had shown that even though the
pEAβ3-42 was a major component of senile plaques in AD brains (25% of total Aβ1–42),
pEAβ3-40 formed deposits mainly in the cerebral vasculature.[52]
Wulff et al. [53] demonstrated that AβpE has higher susceptibility to mechanical stress
and fragmentation of the fibrils. This report has been challenged by other studies, arguing that
pE-Aβ assemblies have similar content of β -sheet structure, are more resistant to fibrillogenesis
[55-57], and exert cytotoxic effect similar to unmodified Aβ [54,56,57].
The structure, aggregation and neurotoxicity of a peptide affected strongly by N-terminal
pyroglutamylation. In murine brains, pEAβ3-40 inhibited hippocampal long-term potentiation
[58]and utilized stronger cytotoxic effect on cultured rat hippocampal neurons than Aβ1-40, Aβ1-
42, and even pEAβ3-42.[59] The molecular basis of the greater toxicity of pEAβ remains obscure.
Whereas in some studies have shown that the aggregation into β-sheet-rich assemblies for
pEAβ3-40 more readily than Aβ1-40,[47,48,50] others have found similar toxicities[60] and
structural features of unmodified and pyroglutamylated Aβ peptides in fibrillar or oligomeric
states[61] and lengthier aggregation of pEAβ,[62] leaving the issue unclear.

8
The structural and aggregation properties of unmodified Aβ and pE-Aβ are important for
their respective cytotoxic effects. However, these biophysical characteristics have not been
firmly established. Therefore, the main focus of this project is on comparative characterization of
aggregation and accompanying structural changes of Aβ1-40 and pEAβ3-40 separately and in
combination.
In addition, smaller fragments of Aβ have studied in this project in order to identify the
specific regions of the peptide initiating -helix to β-sheet transition, aggregation, and fibril
formation. Several studies performed experiments use peptide fragments related or unrelated to
A sequence to inhibit A aggregation and hinder A-induced cytotoxicity. [63-75] The peptide
fragment’s inhibitory effect on A aggregation and toxicity originates from their capacities to
intercalate into A assemblies and prohibit the formation of toxic oligomers, which may or may
not be associated with their own self-aggregation propensities. Therefore, a mutated peptide,
KLVFWAK, imitating the A16-22 (KLVFFAE) which had minimal self-aggregation propensity
but favorably interrelated with oligomeric and fibrillar structures of A On the other hand,
the natural sequence of A16-22 has been known as a fibrillogenic segment that forms antiparallel
-sheet aggregates stabilized by ionic interactions between terminal side chains and nonpolar
interactions between internal hydrophobic residues. [77,78] Cheng et al. [69] had shown that
A16-22, among several A segments integrated in a full-length peptide, inhibited A1-40
aggregation and cytotoxicity. These effects were inferred in terms of binding of the fragment
peptide to A oligomers and inhibition of fibril nucleation. Simultaneously, the same A16-22
peptide, as well as the hydrophobic C-terminal stretch from Lys28 onward, were established to be
the most fibrillogenic regions in the perspective of several A species containing 38 to 43 amino
acids. [84] Coherent with these outcomes, the peptides A28-42 and A29-42 exhibited fast

9
aggregation and -sheet fibril formation propensities contrasting some other C-terminal A
peptide fragments. [83] Furthermore, midst twelve C-terminal A1-42 fragments A28-42 exerted
extreme toxic effect on cultured PC-12 cells [83] and insinuated correlation between
amyloidogenicity and toxic effects of the peptides. Additionally, by interfering with formation of
toxic oligomers two C-terminal fragments, A31-42 and A39-42, were capable to rescue neuronal
cells from A1-42 cytotoxicity [79].
Therefore, by direct interaction with full-length peptide A fragments of A appear to
affect the aggregation and toxicity of full-length one. Reports on the aspects of binding of
fragments to the full-length peptide exposed various modes of interaction. The study of A
fragment A33-37 (GLMVG) shown that it binds with C- terminus of A1-42, probably the
homologous sequence, and suppress its aggregation, neuronal membrane damage and
synaptotoxicity [70]. Surprisingly, another short C-terminal fragment, A39-42, favorably
interrelated with the N-terminus of A1-42 in oligomeric form [80-82]. The aforementioned
mutated peptide, KLVFWAK, also interacted in a non-homologous manner with the C-terminus
of A aggregates [76].
These outcomes suggest that A aggregation can be essentially modulated by A-derived
peptide fragments. Nevertheless, a comprehensive understanding of the variant effects of A
segments along the whole A1-42 sequence has not been attained. This work aimed at systematic
studies on 10 amino acid residue long overlapping fragments of A1-42 to understand their
intrinsic -sheet formation and fibrillogenesis properties and their effects on same properties of
the parent peptide. Here structural and aggregation properties of the parent Aβ1-42 peptide and

10
seven overlapping peptide fragments have been studied, i. e. Aβ1-10 (P1), Aβ6-15 (P2), Aβ11-20 (P3),
Aβ16-25 (P4), Aβ21-30 (P5), Aβ26-36 (P6), and Aβ31-42 (P7).
1.3 Protein Structure
The protein structure is the three-dimensional arrangement of atoms in the amino acid
chain molecule. Proteins are polymers, which are formed by amino acid sequences. A single
amino acid monomer can also be referred to as a residue implying a repeating unit of the
polymer. Proteins are formed by amino acids that undergo condensation reactions, where the
amino acids lose one water molecule each time they react and are connected to each other
through peptide bonds. By convention, chains of less than 30 amino acids are usually identified
as peptides, not proteins.
In order to perform its biological functions, proteins are driven by a series of non-
covalent interactions (such as hydrogen bonds, ionic interactions, van der Waals forces, and
hydrophobic packaging) to fold into one or more specific spatial conformations. To understand
the functions of proteins at the molecular level, it is often necessary to determine their three-
dimensional structure. This is the subject of structural biology science, which uses techniques
such as Fourier Transform Infrared (FTIR) spectroscopy, Circular dichroism (CD), X-ray
crystallography, nuclear magnetic resonance spectroscopy, cryo-electron microscopy (cryoEM),
and dual polarization interferometry to define the structure of proteins.
The size of the protein structure varies from dozens to thousands of amino acids.
According to their physical size, proteins are classified as nanoparticles, between 1 and 100 nm.
Very large protein complexes can be formed from protein subunits.
The primary structure of a protein indicates to the sequence of amino acids in the
polypeptide chain. The primary structure is held together by peptide bonds formed during protein

11
biosynthesis. According to the nature of the free groups at both ends, the ends of the polypeptide
chain are called carboxyl terminus (C-terminus) and the amino terminus (N-terminus)
respectively. The residue count always starts from the N-terminal end (NH2- group), which is the
end where the amino group does not participate in the peptide bond. The primary structure of a
protein is determined by the gene for the protein. A specific sequence of nucleotides in DNA is
transcribed into mRNA, which the ribosome reads in a process called translation. The sequence
of the protein is unique to the protein and defines the structure and function of the protein. The
sequence of the protein can be determined by methods such as tandem mass spectrometry.
However, it is usually read directly from the gene sequence using the genetic code. It is strictly
recommended to use the term "amino acid residues" when talking about proteins, because when a
peptide bond is formed, a water molecule is lost, so proteins are composed of amino acid
residues. Post-translational modifications such as phosphorylation and glycosylation are usually
considered part of the primary structure and cannot be read in genes.
The next level of protein structure, the secondary structure, indicates to the partially
folded structure formed in the polypeptide due to the interaction between the backbone atoms.
(The main chain refers only to the polypeptide chain other than the R group; the secondary
structure does not include the R group atoms.) The most common types of secondary structure
are α- helices and β-sheets. Both structures maintain their shape through hydrogen bonds, which
are formed between the carbonyl C=O of one amino acid and the amide NH of the other amino
acid.
In the α-helix, the carbonyl group (C = O) of the amino acid forms a hydrogen bond with
the amino group H (N-H) of the 4 amino acids in the chain. This bonding pattern draws the
polypeptide chain into a helical structure that resembles a curled ribbon, each turn of the spiral

12
containing 3.6 amino acids. acid. The R groups of amino acids protrude from the alpha helix,
where they can interact freely.
In β-sheets, two or more segments of the polypeptide chain are arranged next to each
other to form a sheet-like structure, which is held together by hydrogen bonds. A hydrogen bond
is formed between the carbonyl group and the amino group of the skeleton, and the R group
extends above and below the plane of the sheet. The strands of the folded sheet β can be parallel,
pointing in the same direction (meaning that its N- and C-termini coincide), or anti-parallel,
pointing in the opposite direction (meaning that the N-terminus of one strand is positioned next
to the C-terminus of the other). Some amino acids are more or less likely to appear in alpha
helices or beta sheets. For example, the amino acid proline is sometimes called a "helix breaker"
because its unusual R group (attached to an amino group to form a ring) creates a bend in the
chain and is incompatible with helix formation. Proline is generally found in curved,
unstructured regions between secondary structures. Similarly, amino acids with a large ring
structure in the R group, such as tryptophan, tyrosine, and phenylalanine, are often found in β
sheets, which may be because the β sheet structure provides sufficient side chains.
The general three-dimensional structure of a polypeptide is called the tertiary structure.
The tertiary structure is mainly due to the interaction between the R groups of the amino acids
that make up the protein. The R group interactions that contribute to the tertiary structure include
hydrogen bonds, ionic bonds, dipole-dipole interactions, and London dispersion forces -
basically the full range of non-covalent bonds. For example, R groups with the same charge repel
each other, while groups with opposite charges can form ionic bonds. Similarly, polar R groups
can form hydrogen bonds and other dipole-dipole interactions. Also important for tertiary
structure is hydrophobic interaction, in which amino acids with nonpolar hydrophobic R groups

13
are brought together inside the protein, while hydrophilic amino acids are left outside to interact
with surrounding water molecules. Ultimately, there is a special type of covalent bond that
promotes the tertiary structure: disulfide bonds. Disulfide bonds, the covalent bonds between the
side chains of sulfur-containing cysteine, are much stronger than other types of bonds that
contribute to the tertiary structure. They act as molecular "safety pins", making the various parts
of the polypeptide firmly connected to each other
Many proteins are composed of a single polypeptide chain and only have a tertiary
structure. However, some proteins are made up of multiple polypeptide chains, also called
subunits. When these subunits are grouped together, they give the protein a quaternary structure.
An example of a protein with a quaternary structure: hemoglobin. Hemoglobin carries
oxygen in the blood and is composed of four subunits, two for each type α and β. Another
example is DNA polymerase, an enzyme that synthesizes new DNA strands, composed of ten
subunits.
Generally speaking, the same types of interactions that contribute to the formation of
tertiary structures (mainly weak interactions, such as hydrogen bonds and London scattering
forces) also combine subunits to form quaternary structures.
1.4 Protein-Protein Interaction
Protein-protein interaction (PPI) deals with a wide range of biological processes,
including cell-cell interactions and developmental and metabolic control. Protein-protein
interaction is becoming one of the main objectives of systems biology. Non-covalent contact
between the side chains of the residues is the basis for protein folding, protein assembly, and
PPI. These contacts induce various interactions and associations between proteins. According to
its comparative structural and functional characteristics, PPI can be classified in a variety of

14
ways. Based on their interaction surface, they can be homologous or heterogeneous; from their
stability, they may or may not be obligated; in terms of their persistence, they can be temporary
or permanent. The given PPI can be a combination of these three specific pairs. Transient
interactions will form signal pathways, while permanent interactions will form stable protein
complexes.
Generally, proteins rarely act as isolated species when they perform their functions in
vivo. It has been found that more than 80% of proteins do not act alone but in the form of
complexes. An extensive analysis of validated proteins showed that proteins involved in the
same cellular process were repeatedly found to interact with each other. The study of PPI is also
important for inferring the function of proteins in cells. The function of unknown proteins can be
predicted from the evidence of their interaction with the protein, and the function of the protein
has been revealed. The detailed study of PPI has accelerated the modeling of functional
pathways to illustrate the molecular mechanisms of cellular processes. Characterizing the
interactions of proteins in a given proteome is very useful for revealing the biochemistry of cells.
There are many ways to determine the result of two or more proteins interacting with a defined
functional target. Phizicky and Fields have outlined the important characteristics of PPI. [151]
PPIs can change the kinetic properties of enzymes; as a general mechanism to allow the substrate
to pass through; it constructs new binding sites for small effector molecules; Inactivate or inhibit
proteins; Change the specificity of the protein to its substrate through interaction with different
binding partners; Play a regulatory role at the upstream or downstream level.
Revealing information about protein-protein interaction can help determine drug targets.
Studies have shown that proteins with a large number of interactions (centers) can include
families of enzymes, transcription factors, and inherently disordered proteins [152,153].

15
However, the PPI involves more heterogeneous processes, and its regulatory scope is greater. To
understand its importance in cells more precisely, it is necessary to identify various interactions
and determine the consequences of the interactions.
1.5 Protein Solubility
Protein solubility is a thermodynamic parameter defined as the concentration of protein in a
saturated solution that is in equilibrium with a solid phase, either crystalline or amorphous, under
a given set of conditions. Depending on pH conditions, proteins can be positively charged
(cations) or negatively charged (anions). When the positive and negative charges on the protein
are equal, the net charge is zero. The characteristic pH value of the solution when the net charge
of the protein is zero (the positive and negative charges are equal) is defined as the isoelectric
point (pI). Under conditions of pH below its isoelectric point, the protein will carry a net positive
charge and will behave as a cation. At a pH above its isoelectric point, the protein will have a net
negative charge. The isoelectric point of a protein is an important characteristic, because at this
point the solubility of the protein is lowest and therefore unstable. It should be noted that
proteins are soluble below and above the isoelectric point (pI).
Salt bridges are ionic bonds between positively charged and negatively charged amino acid side
chains. An example is the attraction between the -COO- ion of glutamic acid and the NH+3 ion of
lysine. Increasing the pH by adding a base will convert NH+3 ions into neutral NH2 groups.
Lowering the pH by adding acid will convert –COO- ions into neutral COOH groups. In each
case, the ionic attraction disappears, and the shape of the protein unfolds. Additionally, salt
concentration (ionic strength) is also very important for protein solubility. At low salt
concentrations protein solubility increases and at high salt concentration protein solubility
decreases.

16
1.6 Basic Aspects in Protein Stability
The influence of salt on the structure and function of non-halophilic proteins has been
well resolved. The presence of high salt content in the protein solution will have the following
effects: interference of the local water structure around the protein; reduction of the tendency of
intermolecular hydrogen bonds to affect the solubility, binding, stability and crystallization of the
protein; Increase the surface tension of water, striping off the essential water layer from the
protein surface and increase the hydrophobic interaction, which leads to the aggregation and
precipitation of proteins. However, a high concentration of salt can adversely affect the structure
of proteins and their subsequent function.
Protein denaturation refers to the loss of biological activity caused by changes in protein
structure caused by physical or chemical factors such as pH, temperature, salt, detergents,
organic solvents, or chaotropic agents. Secondary, tertiary, or quaternary structure is greatly
affected by denaturation. Some important mechanisms of protein denaturation are
(http://class.fst.ohio-state.edu/FST822/lectures/Denat.htm):
• High temperature weakens the inherent bonds in proteins. The additional heating will
destroy the hydrogen bonds in the protein and establish new hydrogen bonds with the
surrounding water molecules, thus destroying the helical structure.
• Water miscible solvent (less polar than water) reduce the dielectric constant of the
system, thus strengthening electrostatic interactions between molecules. The protein
unfolds to a great extent, exposing the hydrophobic group to the solvent, leading to
aggregation and precipitation.

17
• Proteins are usually more soluble in dilute salt solutions because the salts in their ionic
forms associate with opposite charges within the protein moiety, leading to increased
hydration of the surface. However, at very high salt concentration, the increased surface
tension of water generates a competition between protein and salt ions for hydration.
Salts strip off the essential layer of water molecules from the protein surface eventually
denaturing the protein.
• Protein denaturation caused by urea can occur through direct or indirect mechanisms.
Urea can directly interact with the protein through the hydrogen bond with the polarized
region of the protein surface, weakening the intermolecular bond and structure of the
protein. Guanidine hydrochloride (GdmCl) has a similar mechanism, but it is a more
effective denaturant than urea. In an indirect mechanism, urea can change the structure of
water and cause protein instability.

18
CHAPTER 2: RESEARCH STRATEGY
2.1 Fourier Transform Infrared (FTIR) Spectroscopy
For identification and analysis of structure of chemical compound, mid-infrared (IR)
spectroscopy is a well-establish technique. The excitation of vibrational modes of the molecules
in the sample and the association with other chemical bonds and functional groups in the
molecules are represented the various peaks in the IR spectrum. Therefore, the infrared spectrum
of a compound is one of its most characteristic physical properties and can be regarded as its
"fingerprint".
The molecular absorption of electromagnetic radiation in the infrared region of the spectrum
(Figure 2.1) promotes the transition between the rotational energy level and the vibratory energy
level of the electronic energy state of the ground (lower). This is in contrast to the more energetic
absorption of visible and ultraviolet radiation, which causes the transition between the energy
levels of vibration and rotation of different electronic energy state. Infrared spectroscopy mainly
involves molecular vibrations, because the transition between individual rotational states can
only be measured in the infrared spectra of small molecules in the gas phase.
Figure 2. 1: The regions of the electromagnetic spectrum.

19
A nonlinear molecule composed of N atoms is said to have 3N degrees of freedom, because if
the position of each atom is described by three coordinates (for example, x, y, z in the Cartesian
coordinate system), then the position, shape and the orientation of the molecules in three-
dimensional space will be completely defined. Since a total of three coordinates are required to
describe the translation of the molecule (for example, along the x, y, and z axes), the molecule
has three translational degrees of freedom. The other three degrees of freedom represent the
rotation of the molecule around three axes. The remaining 3N-6 degrees of freedom correspond
to vibratory motion, and the molecule is said to have normal 3N-6 modes of vibration. These
vibration modes can be described by bond stretching and various types of bending vibrations (see
Figure 2X). In the case of linear molecules, there are only two rotational degrees of freedom,
because rotation around the bond axis is impossible. Therefore, linear molecules have a normal
vibration mode of 3N-5.

20
Figure 2. 2: Visualization of all different molecular vibrations, arrows indicate movements
resulting from repulsion caused by electronegativity. Specific molecules move on a specific
frequency, which absorbs energy when it equals light frequencies (source: USDA)
Therefore, a simple diatomic molecule A-B has (3 x 2) − 5 = 1 vibration mode, which
corresponds to stretching with the A-B bond. This stretching vibration is similar to the vibration
of two objects connected by a spring. Hence, in the first approximation, the harmonic oscillator
model can be used to describe this vibration, and then the restoring force (F) on the bond is given
by Hooke's law:
F = −kx … … … … … … … … … … … … . . … … … … … … … … … . . … … … … . . (1)
where k is the force constant of the bond, and x is the displacement.
In this approximation, the vibrational frequency ν is given by:
ν = (1
2π) (
k
μ)
1/2
… … … … … … … … … … … … … … … … … … … . . … … … … … (2)

21
with μ is the reduced mass of the system,
μ = mA. mB
mA + mB… … … … … … … … . . … … … … … … … … … … … … … … . . … … (3)
where mA and mB are the individual atomic masses of A and B.
The unit of frequency (ν) is reciprocal seconds (sec-l). However, by convention, band positions in
infrared spectra are given in wavenumbers (𝑣), expressed in units of reciprocal centimeters
(cm-l), and are often termed "band frequencies." In older literature, band positions are often
reported in units of wavelength (𝜆), The relation between these units is given by equations (4)
and (5):
v = 1
𝜆… … … … … … … … … … … … … … … … … … … … … … … … . . … . . . (4)
ν = 𝑐
𝜆… … … … … … … … … … … . . . . … … … … … … … … … … … . . … … … (5)
where c = velocity of light.
The situation for a many-atom molecule is more complicated than equation (2) because the
measured vibrational frequencies do in general, correspond to mixtures of different vibrations
rather than pure vibrations. Additionally, electrical effects, steric effects, the nature, size and
electronegativity of neighboring atoms, phase changes and hydrogen bonding may all cause
shifts in frequency. Instead, the above process is the basis of the group frequency concept.
According to this concept, it is expected to show a characteristic absorption frequency that can
establish from the IR spectrum that various functional groups are present in the compound.

22
The quantum mechanical treatment of molecular vibration leads to the modification of the
harmonic oscillator model. Although the above treatment of Hooke's law shows the continuity of
the vibrational states, the molecular vibrational energy levels are quantized:
E = (n +1
2) hν … … … … … … … … . … … … … … … … … … … … … … … … (6)
where h is Planck's constant, n is the vibrational quantum number, and ν is
the fundamental vibrational frequency.
Therefore, only when the frequency is consistent with the frequency of one of the basic vibration
modes of the molecule, the molecule will absorb infrared radiation of a specific frequency. It can
be seen from equation (6) that in the harmonic oscillator approximation, quantum mechanical
processing predicts equidistant vibration energy levels. It also predicts that at room temperature,
only the transition from the ground state vibrational energy level (n = 0) to the first excited
vibrational energy level (n = 1) will occur. However, through experiments, harmonic bands are
observed, corresponding to the transition to higher vibration levels, and their frequencies are
slightly lower than integer multiples of the fundamental vibration frequency. These effects are
due to the anharmonic nature of molecular vibrations. Anharmonicity also produces a combining
band, which represents the simultaneous excitation of two fundamental vibration modes. The
harmonic and combined bands, which are "forbidden" bands, are about an order of magnitude
weaker than the basic mode. Near infrared (NIR) spectroscopy involves the study of such bands
in the near infrared region of the spectrum (12800-4000 cm-1).
Lastly, it is significant to note that all molecular vibrations will not produce infrared absorption
bands. Only when the excitation of this vibration causes the dipole moment of the molecule to
change, the fundamental vibration mode will be "active IR". Therefore, N2, O2, and other
homonuclear diatoms will not produce IR absorption bands. Correspondingly, the symmetric

23
stretching of linear X-Z-X molecules (see Figure 2) (like CO2) will not be an active infrared
vibration. Additionally, the symmetry of the molecule influences the number of absorption bands
that will appear in its infrared spectrum. For example, due to molecular symmetry, when two
vibrations have the same energy (degenerate vibration), they will produce a single IR absorption
band. The expectation of the number of bands observed in the infrared spectrum of molecules
based on molecular structure and symmetry is the domain of group theory.
FTIR is widely used in biophysical/structural characterization of biomolecules. Specific spatial
arrangements of atoms in defined secondary structural geometries, which are stabilized by
hydrogen bonding of certain strength that is inversely proportional to covalent bond strength,
produce absorption bands at characteristic frequencies. This allows one to evaluate the
molecule’s overall secondary structure by analysis of the spectrum. Proteins generate a number
of “amide” bands, of which the amide I band, a composite vibrational mode involving mostly the
C=O stretching vibration, is the most conformation-sensitive feature. For example, 𝛼-helix and
𝛽-sheet structures generate absorption bands around 1655 cm-1 and 1630 cm-1 [85], so an 𝛼 / 𝛽
protein will produce an amide I band with two major components at these wavenumbers, and its
structure can be determined from the relative weights of these components, with correction for
respective extinction coefficients. FTIR spectroscopy, along with some other spectroscopic
methods such as circular dichroism, are considered “low resolution” techniques. These
techniques provide the global structure of proteins bot not the precise 3-dimensional structure at
an atomic level, unlike some other methods such as X-ray crystallography and NMR. The
advantage of these “low resolution” methods is their accessibility, which allows collection of
valuable structural information in a short time (~1 hour), using tiny amounts (~0.01-0.1 mg) of
sample. In addition, proteins are studied in their natural milieu, i.e. an aqueous environment,

24
rather than crystals or organic solvents. FTIR is practically free of light scattering problems
because of the long wavelengths, and is not restricted by the protein size, like NMR [86]. In
addition, membrane proteins, which are very difficult to crystallize, are being easily studied by
FTIR, using either lipid vesicle-reconstituted proteins or by attenuated total reflection FTIR on
proteins embedded in supported membranes. Sine FTIR measurements are conducted in D2O-
based buffers (H2O absorbs in the amide I region), solvent exposure of the protein interior upon
structural changes or unfolding results in amide hydrogen exchange (NH to ND), which
downshifts the amide II band by ~100 cm-1, from 1540 cm-1 to 1440 cm-1. This allows evaluation
of the tertiary structural changes in proteins by following the kinetics of amide hydrogen
exchange.
2.2 Circular Dichroism (CD) Spectroscopy
CD is electronic spectroscopy based on chirality of molecules. Since amino acids contain a 𝐶𝛼
chiral atom (except for glycine), CD is widely used in structural studies of proteins [65-67]. CD
spectroscopy is used extensively to study chiral molecules of all types and sizes, but it is in the
study of large biological molecules where it finds its most important applications.
A chromophore that is asymmetric in nature or a symmetrical chromophore in an asymmetric
environment will interact differently with left and right circularly polarized light, resulting in two
related phenomena. Since the refractive index of right circularly polarized light and left
circularly polarized light are different, circularly polarized light will pass through the optically
active medium at different speeds, which is called optical rotation or circular birefringence. The
change in optical rotation as a function of wavelength is called optical rotation dispersion
(ORD). Due to the different extinction coefficients of the two polarized light called circular

25
dichroism (CD), left and right circularly polarized light will also be absorbed to different degrees
at certain wavelengths. Optical rotating scattering allows chiral molecules to rotate the plane of
polarized light. The ORD spectrum is dispersive (called the single band’s cotton effect), while
the circular dichroic spectrum is absorbent. These two phenomena are related to the so-called
König -Kramers transformation.
It can be exhibited that if right- and left-handed circularly polarized light is absorbed to different
degrees at any wavelength, there will be a difference in refractive index at almost all
wavelengths. ORD scattering is also the reason why CD is a more sensitive analytical technique.
Unlike the dispersive ORD phenomenon, circular dichroism can only occur in the normal
absorption band and therefore requires inherent asymmetric chromophores (uncommon) or
symmetric chromophores in asymmetric environments.
Electromagnetic radiation consists of an electric (E) and magnetic (B) field that oscillate
perpendicular to one another and to the propagating direction, a transverse wave. While linearly
polarized light occurs when the electric field vector oscillates only in one plane, circularly
polarized light occurs when the direction of the electric field vector rotates about its propagation
direction while the vector retains constant magnitude. At a single point in space, the circularly
polarized vector will trace out a circle over one period of the wave frequency, hence the name.
The two diagrams below (Figure 2.3) show the electric field vectors of linearly and circularly
polarized light, at one moment of time, for a range of positions; the plot of the circularly
polarized electric vector forms a helix along the direction of propagation (k). For left circularly
polarized light (LCP) with propagation towards the observer, the electric vector rotates

26
counterclockwise. For right circularly polarized light (RCP), the electric vector rotates
clockwise.
Figure 2. 3: Linearly (left) and circularly (right) polarized light.
The different absorption of radiation polarized in two directions as a function of frequency is
called dichroism. When applied to plane polarized light, this is called linear dichroism; for
circularly polarized light, circular dichroism. The linearly polarized light is the result of two of
equal amplitude opposite circular polarizations. After passing the optically active sample, the
circularly polarized light will change in two ways. These two components are still circularly
polarized, but the size of the E component that rotates in the opposite direction will no longer be
the same, because the molar extinction coefficients of the left polarized light and the right
polarized light are not equal. The E-vector direction no longer draws a circle but an ellipse
(actually an elliptical spiral, if not limited to projection) due to the difference in refractive index,
the major axis of the ellipse will also rotate.
Generally, ellipticity is a unit of circular dichroism, defined as the tangent of the ratio of the
minor axis to the major axis of the ellipse axis. An axial ratio of 1:100 will result in an ellipticity
of 0.57 degrees. Modern CD instruments have millisecond accuracy. Although CD is now

27
measured as the difference in absorbance of left and right circularly polarized light as a function
of wavelength, the unit ellipticity still exists. Each type follows Lambert Beer's law, so the
difference in extinction coefficient (left and right) at a given wavelength is equal to the
difference in absorbance divided by the product of optical path length and concentration.
CD instruments (known as spectropolarimeters) measure the difference in absorbance between
the L and R circularly polarized components (∆𝐴 = 𝐴𝐿 − 𝐴𝑅 = (𝜖𝐿 − 𝜖𝑅)𝑙𝑐 ), where the
subscripts R and L signify right and left polarization, l is the optical pathlength (thickness) of the
sample, and c the solute concentration. Differential absorption of right- and left- polarized lights
results in conversion of a plane-polarized light into elliptically polarized light (note that the
plane-polarized light can be presented as a sum of right- and left-polarized components of equal
amplitudes). The ellipticity (𝜃), is simply the ratio of the minor and major semiaxes of the ellipse
(Figure 2.4).
tan 𝜃 = 𝑟𝑚𝑖𝑛𝑜𝑟
𝑟𝑚𝑎𝑗𝑜𝑟=
𝐸𝐿 − 𝐸𝑅
𝐸𝐿 + 𝐸𝑅
For small 𝜃, tan 𝜃 = 𝜃
It can be shown that, 𝜃 (𝑑𝑒𝑔) = 180 × ln 10 × ∆𝐴
4𝜋= 32.98 ∆𝐴
In practice, the molar ellipticity is used: [𝜃] = 100 𝜃 /cl =3298∆𝜖

28
C
Figure 2. 4: Origin of the CD effect. (A) The left (L) and right (R) circularly polarized
components of plane polarized radiation: (I) the two components have the same amplitude and
when combined generate plane polarized radiation; (II) the components are of different
magnitude and the resultant (dashed line) is elliptically polarized. (B) The relationship between
absorption and CD spectra. Band 1 has a positive CD spectrum with L absorbed more than R;
band 2 has a negative CD spectrum with R absorbed more than L; band 3 is due to an achiral
chromophore. (C) Elliptical polarized light (violet) is composed of unequal contributions of right
(blue) and left (red) circular polarized light.
n-π∗ transitions involve moving an electron from a nonbonding electron pair to a antibonding π∗
orbital. They tend to have molar absorbtivities less than 2000 and undergo a blue shift with
solvent interactions (a shift to higher energy and shorter wavelengths). This is because the lone

29
pair interacts with the solvent, especially a polar one, such that the solvent aligns itself with the
ground state. When the excited state emerges, the solvent molecules do not have time to
rearrange in order to stabilize the excited state. This causes a lowering of energy of the ground
state and not the excited state. Because of this, the energy of the transition increases, hence the
"blue shift”. The n-π∗ transition in peptides occurs at 210-225 nm (𝜖 100 M-1 cm-1). The strong
band responsible for the absorbance of most peptide bonds is the 𝜋-𝜋* transition. The π-π∗
transitions involve moving an electron from a bonding ππ orbital to an antibonding π∗π∗ orbital.
They tend to have molar absorptivities on the order of 10,000 and undergo a red shift with
solvent interactions (a shift to lower energy and longer wavelengths). This could either be due to
a raising of the ground state energy or lowering of the excited state energy. If the excited state is
polar, then it will be solvent stabilized, thus lowering its energy and the energy of the transition.
Using CD, these different transitions are more distinctly evident. The two types of 𝜋-𝜋*
transitions occur around 210 and 190 nm (𝜖 7,000 M-1 cm-1).
A CD spectrum of a protein is usually measured in the 180 nm to 350 nm ultraviolet (UV)
region. The far-UV signal between 180 and 250 nm is sensitive to protein’s secondary structure.
The 𝛼-helical structure produces two minima around 208 and 222 nm and a maximum around
192-195 nm, and 𝛽-sheet structure generates a minimum at 216 nm and a maximum around 195
nm [68, 69]. Unordered proteins produce a weak maximum around 220 nm and a deep minimum
around 195-200 nm [68, 69]. The CD signal in the near-UV region (~ 280 nm) is generated by
the side chains of aromatic amino acids (Trp, Tyr, Phe) that “borrow” dichroic properties from
the nearby backbone 𝐶𝛼 atoms. It is often used to characterize the protein’s tertiary structure, the
signal increases with increasing compactness of the protein’s fold. CD thus can be used to
observe how the secondary and tertiary structures of a protein or peptide change with

30
environmental conditions (pH, temperature, salt concentration) or upon interaction with other
molecules. Structural, kinetic and thermodynamic information about macromolecules can be
derived from circular dichroism spectroscopy.
2.3 Fluorescence Spectroscopy (FS)
FS is electronic spectroscopy that is based on light absorption and emission by certain
molecules. The incident light, usually in the UV or visible regions, is absorbed by electronic
transition from the ground state to the higher energy excited state. Both ground and excited states
have many vibrational energy levels that are spaced more closely compared to the energy
difference between the ground and excited levels. The excited electron loses some of its energy
by adopting the lowest vibrational level. Before returning, the electron also loses some of its
energy by various mechanisms, mostly by “solvent relaxation”, i.e. reorienting the polar solvent
molecules, such as H2O. Then, within about 10 ns, the electron returns to the ground state,
emitting light. Through the aforementioned mechanisms, the emitted light carries less energy and
thereby the emission occurs at longer wavelengths than the excitation (Stokes shift) [92]. As
molecules may drop down into any of several vibrational levels in the ground state, the emitted
photons will have different energies, and thus wavelengths, producing an emission band with
nearly Gaussian distribution of intensities.
Best known fluorescent organic molecules are the aromatic rings. Three out of twenty
amino acids found in proteins, i.e. tryptophan (Trp), tyrosine (Tyr), and phenylalanine (Phe),
have such rings and therefore are intrinsically fluorescent. The location of the emission band
relative to the excitation along the wavelength axis indicates how strong the solvent relaxation is.
Stronger solvent relaxation occurs for proteins with more open, solvent accessible tertiary

31
structure, which is manifested by a higher emission wavelength (red shift). Proteins with more
compact tertiary structure display emission at shorter wavelength (blue shift), closer to the
excitation wavelength. Thus, FS is sensitive to protein’s tertiary structure, and together with CD
is used for comprehensive structural characterization of proteins.
2.4 Peptide Preparation
2.4.1 Preparation for Structure and Aggregation of Aβ1-40 and Pyroglutamylated pEAβ3-40
Separately and Combined.
Synthetic Aβ1–40 and pEAβ3–40 peptides were purchased from Innovagen (Lund, Sweden).
Recombinantly expressed, uniformly 13Clabeled Aβ1–40 was from rPeptide (Watkinsville, GA,
USA). All peptides were ≥98% pure as confirmed by HPLC and mass spectrometry. Salts,
buffers, hexafluoroisopropanol (HFIP), ThT, and other chemicals were from Fisher Scientific
(Hanover Park, IL, USA) or Sigma-Aldrich (St. Louis, MO, USA). Quartz cuvettes for CD and
fluorescence measurements were purchased from Starna Calls, Inc. (Atascadero, CA, USA).
CaF2 FTIR windows were from Buck Scientific (East Norwalk, CT, USA). D2O (99.8% pure)
was from Cambridge Isotope Laboratories (Andover, MA, USA).
The lyophilized peptides were dissolved in HFIP at total peptide concentration of 50 μM, and
CD spectra were monitored and measured on a J-810 spectropolarimeter equipped with a
fluorescence attachment and a temperature controller (Jasco, Tokyo, Japan) at 250C, using a 4
mm × 4 mm rectangular quartz cuvette. Under a gentle stream of nitrogen, the same peptide
sample was used to remove the solvent. Then the sample was put inside of a desiccator chamber
for around 1 h, and later the sample was put into J-810 spectropolarimeter to record CD spectra
of dry peptides. Aqueous buffer (25-mM NaCl, 25-mM Na,K-phosphate, 20 μM ThT, pH 7.2)
was then added to the dry peptide to obtain a peptide concentration of 50 μM, and the top of the

32
cuvette was wrapped with Parafilm and rotated on a Fisherbrand™ Multi-Purpose Tube Rotator.
Three samples were conducted in parallel, that is, Aβ1–40, pEAβ3–40, and their 1:1 molar
combination. At defined time points, CD (180–350 nm) and ThT fluorescence (400–600 nm with
excitation at 435 nm) spectra were recorded on same peptide samples on the J-810 instrument.
CD and fluorescence measurement were continued for 200 h.
By plotting ThT fluorescence at 480 nm as a function of time of incubation in buffer the kinetics
of fibrillogenesis was analyzed, and from the time dependence of the ellipticity ratio θρ/θβ,
where θρ and θβ are the ellipticities representing unordered and β-sheet structures the kinetics of
structural transitions were determined. These plots were fitted with single-exponential curves,
which provided the rate constants and the limiting values of ThT fluorescence and secondary
structural changes.
For FTIR experiments on peptides in aqueous buffer, HFIP solution of the peptide was placed in
small glass vials and the solvent was removed by desiccation. D2O-based buffer containing 25-
mM NaCl and 25-mM Na,K-phosphate, adjusted to pH* 6.8, was added to the dry peptide to
achieve 50 μM concentration and stirred for 1.5 h using a magnetic stir bar. Here, pH* is the pH-
meter reading and corresponds to pD 7.2 after correction for the 0.4 pH unit isotopic shift.[93]
70μL of the peptide solution was placed between two CaF2 disks (32 mm in diameter, 3 mm
thick), separated by a 50 μm-thick Teflon spacer, and transmittance spectra were measured at 2
cm−1 nominal resolution, using a Vector-22 FTIR spectrometer (Bruker Optics, Billerica, MA,
USA) equipped with a liquid nitrogen cooled Hg-Cd-Te detector. Transmittance spectra of the
blank buffer were measured and used as reference to calculate the absorbance spectra.
33
For FTIR measurements of dry peptides and those hydrated from gas phase, 35 μL of 200 μM
HFIP solution of Aβ peptide were spread on the surface of a CaF2 disk and air dried, followed by
desiccation for 15 min. The disk was installed on a sample holder, and FTIR transmittance
spectra of the dry peptide were measured. This was followed by measurements of spectra of the
peptide that was slowly hydrated by stepwise exposure to D2O vapor. D2O was used because
H2O absorbs in the amide I region and thereby affects the conformation sensitive amide I band
intensity and line shape. Around 10 mL of D2O in a small beaker was placed on a hotplate,
covered with a larger glass beaker, and brought to ~900C to maximize evaporation. The peptide
sample was placed inside the large beaker and thereby exposed to D2O vapors for a defined
number of seconds, and then the spectrum of the partially hydrated peptide was measured. Care
was taken to thermally isolate the peptide and avoid its heating during hydration from gas phase.
Absorbance spectra were obtained using the transmittance spectrum of the bare CaF2 disk as
reference. This procedure was continued multiple times until spectral changes in the amide I and
amide II regions saturated. Precisely, the amide II absorbance band intensity at 1550–1530 cm−1
gradually decreased due to amide hydrogen-deuterium (H/D) exchange and the amide I peak
shifted to lower wavenumbers due to α-helix to β-sheet transition. The kinetics of structural
changes were analyzed by plotting the ratio of β-sheet and α-helix structures against time of
exposure to D2O vapor. The amount of α-helix at time t was considered proportional to the
absorbance at α-helical wavenumber, αt / 𝐴𝑤 𝛼,𝑡. Values of α-helical wavenumbers, Wα, were
determined based on the spectra of dry peptides, which were α-helical. Upon hydration by D2O
vapor, 𝐴𝑤 𝛼,𝑡 gradually decreased and the β-sheet signal emerged and grew in intensity at β-sheet
wavenumber, Wβ. Because the α-helical amide I band has nonzero intensity at Wβ, which we
denote 𝐴𝑥,𝑡, the amount of β-sheet at time t is proportional to the rise in intensity at Wβ with

34
respect to 𝐴𝑥,𝑡, that is, 𝛽𝑡 ∝ 𝐴𝑤 𝛽,𝑡− 𝐴𝑥,𝑡. As the peptide hydration progresses, 𝐴𝑥,𝑡 decreases by
a time-dependent factor 𝐴𝑤 𝛼,𝑡/𝐴𝑤 𝛼,𝑜:
𝐴𝑥,𝑡 = 𝐴𝑤 𝛽,0
𝐴𝑤 𝛼,𝑡
𝐴𝑤 𝛼,0
The β-sheet/α-helix ratio is then given as follows:
𝛽𝑡
𝛼𝑡=
𝐴𝑤 𝛽,𝑡
𝐴𝑤 𝛼,𝑡−
𝐴𝑤 𝛽,0
𝐴𝑤 𝛼,0
2.4.2 Preparation for Segmental Aggregation and Structural Propensities of Amyloid beta (Aβ)
Peptide
The synthetic A1-42 peptide was from Innovagen (Lund, Sweden) and was >98% pure. Synthetic
peptide fragments, acetylated at N-terminus and amidated at C-terminus, was purchased from
Peptide 2.0 Inc. (Chantilly, VA, USA) and were 98-99% pure, as verified by high performance
liquid chromatography and mass-spectrometry. Hexafluoroisopropanol (HFIP), thioflavin-T
(ThT), salts, buffers, and most of other reagents were purchased from Sigma- Aldrich (St. Louis,
MO, USA) or Fisher Scientific (Hanover Park, IL, USA). Quartz cuvettes for circular dichroism
(CD) measurements were from Starna Calls, Inc. (Atascadero, CA, USA). CaF2 windows for
Fourier transform infrared (FTIR) studies were from Buck Scientific (East Norwalk, CT, USA).
D2O (99.8% pure) was from Cambridge Isotope Laboratories (Andover, MA, USA).
Circular dichroism (CD) and fluorescence spectra were measured using a J-810
spectropolarimeter equipped with a fluorescence attachment and a temperature controller (Jasco,
Tokyo, Japan) at 25 °C. Lyophilized peptides was dissolved in HFIP at a desired concentration
and CD spectra were measured using a 4 mm 4 mm rectangular quartz cuvette. Then, the
solvent was removed by desiccation and CD spectra of the dry peptide stuck on the walls of the

35
cuvette were measured. This was followed by addition of aqueous buffer (25 mM NaCl, 25 mM
Na,K-phosphate, 20 M ThT, pH 7.2) to achieve a target peptide concentration. The cuvette was
capped with a Teflon stopper, sealed with parafilm, and rotated on a Fisherbrand™ Multi-
Purpose Tube Rotator for several days. CD, ThT or intrinsic peptide fluorescence, and light
scattering at 90 degrees were measured periodically on same sample, at pre-determined time
pints, to follow the time dependence of structural changes and aggregation/fibrillogenesis of the
peptides, using the multifunctional J-810 instrument. Measurements of these parameters on same
samples in real time excluded sample to sample errors. For each peptide system, time-dependent
spectroscopic measurements were repeated in three or four independent experiments.
ThT fluorescence was averaged between 475 and 485 nm, when excited at 435 nm, and
plotted against time of incubation in buffer. For fluorescence RET experiments, incident light at
220 nm was used for predominant excitation of phenylalanine as compared to tyrosine, and
spectra were measured between 200 and 400 nm. For each donor/acceptor peptide pair, the
fluorescence of individual peptides was measured at 100 M concentration, then spectra were
recorded for the two peptides mixed at 50 M each to maintain the same total peptide
concentration. For light scattering, incident light at 550 nm was used to avoid generation of
fluorescence signal and scattered light intensity at 90 degrees was measured between 530 and
570 nm. The signal intensity was averaged between 553 and 557 nm and plotted as a function of
time.
The degree of inhibition of fibrillization of A1-42 by peptide fragments was evaluated
based on ThT fluorescence data. Total saturating ThT fluorescence between 32 and 48 hours in
the presence of both A1-42 and a given fragment was considered as a sum of fluorescence due to
each component. Then, fluorescence owing to A1-42 fibrils in the presence of a fragment, F*,

36
was determined by subtracting the signal measured for the fragment alone from total
fluorescence. Fluorescence signal measured for pure fragments was corrected for concentration
before subtraction, i.e. multiplied by 0.7, assuming a linear relationship between fluorescence
and peptide concentration. Inhibition percentage of A1-42 fibrillogenesis was calculated as IP =
(1 – F*/F0)100%, where F0 is ThT fluorescence of A1-42 in the absence of fragments.
For FTIR spectroscopy, HFIP solution of the peptide was placed in small glass vials and the
solvent was removed by desiccation. D2O-baseb buffer containing 25 mM NaCl and 25 mM
Na,K-phosphate, adjusted to pD 7.2, was added to the dry peptide to achieve 50 M
concentration for the full-length peptide A1-42 and 50 M for the fragments. Peptide samples
were stirred by a small (3 mm in diameter) magnetic stir bar over 100 hours. At defined time
points, a 70-L peptide sample was placed between two CaF2 disks (32 mm in diameter, 3 mm
thick), separated by a 50 m thick Teflon spacer, and FTIR spectra were measured at 2 cm-1
nominal resolution, using a Vector-22 FTIR spectrometer (Bruker Optics, Billerica, MA, USA)
equipped with a liquid nitrogen-cooled Hg-Cd-Te detector. Transmittance spectra of the blank
buffer were measured and used as reference to calculate the absorbance spectra. For
measurements of FTIR spectra of dry peptide sample, HFIP solution of the peptide was spread
on a CaF2 disk, dried for 15 minutes in a desiccator, followed by measurement of the
transmission spectrum. A transmission spectrum of the clean CaF2 disk was used as reference to
calculate the absorbance spectrum. The instrument was continuously purged with dry air to avoid
contribution of H2O vibrational/rotational features in the amide I region. Absorbance spectra of
atmospheric H2O were measured separately and subtracted from spectra of peptides when such
contribution was detected.

37
CHAPTER 3: RESULTS AND DISCUSSION
3.1 Structure and Aggregation of Aβ1-40 and Pyroglutamylated pEAβ3-40 Separately and
Combined.
3.1.1 Kinetics of Fibrillogenesis:
Due to the unstable, polymorphic structural behavior [94-96] of Aβ peptide, to avoid sample to
sample errors, it is very important to measure the aggregation and structural change on same
sample at same time. The kinetics of fibrillogenesis and the accompanying structural changes of
Aβ1-40, pEAβ3-40, and their equimolar combination have been monitored by near-simultaneous
measurements of Th-T fluorescence and CD spectra of same samples, using a spectropolarimeter
with a fluorescence attachment.
Incubation of all three peptide samples in aqueous buffer, Th-T fluorescence around 480 nm
(λexcitation = 435 nm) gradually increased (Figure 3.1.1). To estimate fibrillogenesis
propensities of the peptides, the time dependence of Th-T fluorescence and their amplitudes have
been observed. For Aβ1-40, Th-T fluorescence reached ~0.23 relative units and then gradually
decreased as shown in Figure 3.1.1 a, d. Single-exponential fit of the fluorescence increase
yielded a rate constant of k = 0.029 ± 0.004 h−1 (Table 3.1.1) (here and below: average ± SD
from triplicate experiments). It has been reported that for various forms of Aβ, the ascending and
descending wings of the time dependence of Th-T fluorescence were observed which later
interpreted in terms of formation of dense, Th-T-impermeable clumps of fibrils. [51,57,97]

38
Figure 3.1. 1: Th-T fluorescence spectra of 50 µM Aβ1-40 (a) pEAβ3-40 (b), and their equimolar
combination (c) incubated in aqueous buffer containing 25 mM NaCl, 20 µM Th-T, 25 mM
Na,K-phosphate (pH 7.2) at 25oC. All samples have been constantly mixed in a rotatory mixer
between measurements for 200 hours. Only spectra at selected time intervals, indicated in panel
a, are shown. Excitation was at 435 nm. Panels d, e, and f show the time courses of Th-T
fluorescence and the single-exponential fits of data in panels a, b, c, respectively. For each
peptide sample, data from a selected experiment are shown. The rate constants from these
particular experiments are as follows: k = 0.031 h-1 for Aβ1-40 (d), k1 = 0.300 h-1 and k2 = 0.012
h-1 for pEAβ3-40 (e), k = 0.095h-1 for the 1:1 mixture (f).
For pEAβ3-40, the nature of time dependence of Th-T fluorescence was different compared to
Aβ1-40. Two distinct kinetic components of Th-T fluorescence change over time have been
observed (Figure 1b, e). With a rate constant of k1 = 0.320 ± 0.042 h−1, The first component was
comparatively fast and reached 0.025 units. On the other hand, the second component with a rate

39
constant k2 = 0.014 ± 0.002 h−1, was slow and it reached an overall fluorescence intensity of
~0.1 units at 200 hours of incubation in buffer.
A very weak Th-T fluorescence was observed for the equimolar combination of the two peptides.
The Th-T fluorescence reached around 0.025 units with single-exponential fit rate constant of k
= 0.092 ± 0.015 h−1(Figure 3.1.1c, f and Table 3.1.1). All these data clearly indicate that compare
to the peptide pEAβ3-40, Aβ1-40 undergoes fibrillogenesis through distinct pathway. Within 4 days
of incubation in buffer, Aβ1-40 forms mature fibrils and then the fibrils incline to form
supramolecular assemblies. The sample pEAβ3-40 rapidly obtains a conformation that produces
low Th-T fluorescence compared to Aβ1-40. This indicates in the sample of pEAβ3-40, a very small
fraction of the sample undergoes fibrillogenesis and the remaining follows with a much slower
rate. An initial rapid increase of Th-T fluorescence of the pEAβ3-40 sample followed by a second,
slower phase, a biphasic aggregation kinetics of pEAβ3-40 was observed in earlier
experiments.[48]
Table 3.1. 1: Rate constants of the increase in Th-T fluorescence of Aβ1-40, pEAβ3-40, and their
equimolar combination upon incubation in aqueous buffer.
Sample Th-T fluorescence
Aβ1-40 k = 0.029 ± 0.004 h−1
pEAβ3-40 k1 = 0.320 ± 0.042 h−1
k2 = 0.014 ± 0.002 h−1
Combination (1:1) k = 0.092 ± 0.015 h−1
A resistance of fibrillogenesis was observed for the Aβ1–40/pEAβ3–40 equimolar combination.
The Th-T fluorescence was saturated at a low level, similar to the initial phase of pEAβ3–40.

40
Overall, the data indicates that the small fraction of pEAβ3–40 sample forms fibrils but inhibits the
formation of fibril in larger scale separately or in equimolar combination with Aβ1–40.
3.1.2 Peptide Structure from Circular Dichroism
To achieve monodisperse solution (free from preformed aggregates), the lyophilized form of
Aβ1–40 and pEAβ3–40 peptides were dissolved in 1,1,1,3,3,3-hexafluoro-2-propanol (HFIP).[98]
For each peptide and their equimolar combination, the CD spectra of HFIP solution were
measured. A deep minimum around 205-208 nm and a weak minimum at 222 nm were observed
from those spectra (Figure 3.1.2). The dry sample of all three peptides (after the solvent was
removed) shows two minima at around 211 and 223 nm. The intensities of CD spectra for
solvent samples and dry samples were almost equal. It has been reported in previous experiments
that the minima around 208-211 nm and 221-224 nm are regions of α-helical structure of a
peptide, produced by π–π* and n–π* electronic transitions. [99-101] This can only imply that in
separated or in combination, the peptides in HFIP solvent and in dry state adopt α-helical
conformation. For distorted α-helices or proteins containing several short helices with “distorted”
edges are associated with red-shifted n–π* transition and larger θn–π*/θπ–π* ratios [102].
Additionally, red shift of n–π* transition can occur because of low polarity of the protein’s
environment.[100] Hence, more flexible α-helices or large number of shorter α-helices are
present in the peptide sample in dry state compared to peptide sample in HFIP can represented in
terms of the slight red shift of the bands and significantly larger θn–π*/θπ–π* ratios. A lower
polarity of the dry samples compared with HFIP solutions may also contribute to the difference.
In APP, the sequences of Aβ are usually dehydrated which is the part of α-helical transmembrane
segment of the protein [103,104]. So, for analysis of the structural transition following cleavage

41
and mixed with an aqueous solution, the α-helical conformation of dry peptide can serve as a
reasonable initial point.
Figure 3.1. 2: Circular dichroism spectra of Aβ1-40, pEAβ3-40, and their 1:1 molar combination
dissolved in HFIP at 50 µM total peptide concentration and in dry state, as indicated.
After exposed to aqueous buffer all samples of peptides (Aβ1–40, pEAβ3–40, and their equimolar
combination) achieved the unordered structure as indicated by negative ellipticity between 198
and 204 nm (Figure 3.1.3). This can only mean that the dry peptide sample is still in the wall of
testing cuvette and the suspension from the wall of cuvette into the buffer can be monitored by
observing the gradual increment of the signal intensity. After several hours of incubation, Aβ1–40
sample developed a distinct CD spectra minimum at 217 nm (Figure 3.1.3a) which can be
interpreted as the sample have transitioned from unorder structure to β-sheet structure. For
pEAβ3–40 , the CD spectra minimum was at 222 nm (Figure 3.1.3b). Depending on peptide
structural details, β-sheet n–π* band can reach 225 nm [77,80]. On the other hand, pEAβ3–40 may

42
contain a fraction of α-helical structure with n–π* transition around 222 nm[99,100] and/or type I
or type II β-turns with CD minima between 220 and 225 nm.[69] For the equimolar combination
of Aβ1–40 and pEAβ3–40, unordered conformation was acquired in aqueous buffer (negative
ellipticity around 203 nm) then the sample have transitioned to β-sheet structure with CD
minimum at 217 nm (Figure 3.1.3c).
Figure 3.1. 3: Circular dichroism spectra of Aβ1-40 (a), pEAβ3-40 (b), and their 1:1 molar
combination (c) incubated in aqueous buffer (25 mM NaCl, 20 µM ThT, 25 mM Na,K-
phosphate, pH 7.2) at 50 µM total peptide concentration for time periods indicated in panel a
(color code is the same in panels a, b, c). Kinetics of transition from unordered structure to β-
sheet structure are presented in panel d as 𝜃205/ 𝜃217 for Aβ1-40 and the 1:1 combination and 𝜃205/
𝜃222 for pEAβ3-40. Lines are single-exponential fits with rate constants of 0.064 h-1 for Aβ1-40,
0.109 h-1 for pEAβ3-40, and 0.049 h-1 for the combined sample. For each peptide sample, data
from a selected experiment are shown.
Even though there is no definitive isodichroic points were present in the CD data, the Aβ1–40
spectra tend to converge at around 208 nm except for the first observation data since most of the
peptide were still in the wall of testing cuvette (Figure 3.1.3a). Overall, the time dependence CD
data suggested that the peptide sample Aβ1–40 most likely have two-component transition from
the unorder structure to β-sheet structure. In contrast, of pEAβ3–40 and their equimolar

43
combination have more complex transition involving additional structural components,
consistent with above discussion and with the two-phase kinetics of fibrillogenesis (Figure 3.1.
1e).
It has been observed that after 200 hours of incubation in buffer the peptide Aβ1–40, the
ellipticities have got saturated in the range 217-222 nm after 100h of incubation faster than that
of pEAβ3–40 and the 1:1 combination. This indicates that the quantity of β-sheet in Aβ1–40 exceeds
that of pEAβ3–40 and the 1:1 combination by a factor of 1.5 to 2 (Figure 3.1.3a–c), in qualitative
agreement with ThT fluorescence data (Figure 3.1.1). The time dependence of the ellipticity ratio
θρ/θβ i.e the kinetics of the transition from unordered to β-sheet structure were quantify by the
single-exponential curves with the following rate constants: k = 0.059 ± 0.010 h−1 for Aβ1–40, k =
0.118 ± 0.015 h−1 for pEAβ3–40, and k = 0.045 ± 0.007 h−1 for the 1:1 molar combination (θρ and
θβ are the ellipticities corresponding to unordered and β-sheet structures, respectively) (Figure
3.1.3d and Table 3.1.2).
Table 3.1. 2: Rate constants of the transition from unordered to β-sheet structure of Aβ1–40,
pEAβ3–40, and their equimolar combination upon incubation in aqueous buffer.
Sample Transition to β-sheet
Aβ1–40 k = 0.059 ± 0.010 h−1
pEAβ3–40 k = 0.118 ± 0.015 h−1
Combination (1:1) k = 0.045 ± 0.007 h−1
To avoid errors due to spectral noise at lower wavelength ellipticity at 205 nm was chosen for
θρ. By analyzing all these data, it can say that the transition to β-sheet structure was faster for

44
sample pEAβ3–40 compared to Aβ1–40 and their equimolar combination undergoes slower
transition to β-sheet structure than that of the two peptides separately.
Overall, the CD data imply that (i) A larger fraction β-sheet of Aβ1–40 forms compare than
pEAβ3–40 or the Aβ1–40/pEAβ3–40 (1:1) combination, (ii) pEAβ3–40 undergoes transition to β-sheet
structure and may involve fractions of α-helix and/or β-turn structures during the transition, and
(iii) the rate of the secondary structural transition decreases in the sequence: pEAβ3–40 > Aβ1–40 >
Aβ1–40/pEAβ3–40 combination.
The faster transition to β-sheet structure but lower intensity in ThT fluorescence (Figure 3.1.1b)
and weaker CD intensity (Figure 3.1.3b) of pEAβ3–40 compared with Aβ1–40 can be interpreted as
the former peptide forms intermediate β-sheet structure which can be represented as seeds for the
growth of fibril. The two-phase ThT fluorescence of pEAβ3–40 (Figure 3.1.1e), fast nucleation
phase and a slow elongation (fibril growth) phase interpretation is coherent with the former
statement. In earlier study, it has been documented that for both pEAβ3–40 and pEAβ3–42 the
aggregation initiates rapidly by a seeding process,71 is in agreement with our findings.
From the red-shifted CD spectra of pEAβ3–40 (Figure 3.1.3b) it can be said that the sample
pEAβ3–40 generates heterogeneous secondary conformation compared to unmodified peptide with
the mostly β-sheet fibrillar structure. The equimolar combination of Aβ1–40/ pEAβ3–40 shows a
similar phase of structural conversion as the initial short phase as pEAβ3–40, as it reaches around
0.025 relative units of fluorescence. Furthermore, it stays as that level at least for 200 hours
(Figure 3.1.1f). Even though the equimolar combination of Aβ1–40/ pEAβ3–40 might be able to
produce mature fibrils at later time, the data implicated that the fibril formation had delayed by
the presence of pEAβ3–40. Overall, the peptide sample kept in a prefibrillar form for slower time.

45
3.1.3 Peptide Structure from FTIR Spectroscopy
To provide furthermore understanding into the secondary structural information, Aβ1–40, pEAβ3–
40, and their combination in aqueous buffer were monitored by FTIR spectroscopy. All the three
samples show FTIR amide I band (Figure 3.1.4) after calculating the absorbance spectra from
transmission spectrums. To enhance the amide I band second derivative resolution has been
obtained where two major components was identified where 1673 cm−1 is assigned at as β-turn
and other 1623 cm−1 is assigned to β-sheet. [105-107] The lower frequency at 1623 cm−1 had
suggested as the formation of intermolecular, aggregated β-sheet. [106,108] The weaker
components at 1657 and 1647 cm−1 can be assigned to residual α-helix and either unordered
structure or amide-deuterated α-helix, respectively. Spectral features at 1636 and 1689 cm−1
have assigned as a small fraction of intra-molecular β-sheet and the higher frequency counterpart
of antiparallel β-sheet structure. [104–106]
It has been reported in various studies that the FTIR is accomplished of differentiate between α-
helix, β-sheet, and β-turn structures way improved than that CD because the structural features
are spectrally overlapped at the latter measurement. Thereby, FTIR analysis identifies the
existence of β-turn and α-helical structures with the β-sheet structure not only in pEAβ3–40
sample, as insinuated by CD data, but also in Aβ1–40 and their equimolar combination. The
arrangement of β-sheets is at least partially antiparallel. These data also have suggested that the
structural conformation of the equimolar combination of the two peptides looks like that of
pEAβ3–40 more than Aβ1–40, coherent with CD and ThT fluorescence data. While it remains
ambiguous whether various structural components are existent in same peptide molecules or
different molecules adopt different structures, resulting in a heterogeneous peptide samples,

46
FTIR data show that the transition from the initial α-helical conformation to β-sheet structure is
more intricate than a two-component transition.
Figure 3.1. 4: FTIR spectra (a) and inverted second derivatives (b) of Aβ1-40, pEAβ3-40, and their
1:1 combination, as indicated in panel (a), incubated in aqueous buffer of 25 mM NaCl, 25 mM
Na,K-phosphate in D2O, pD 7.2, for 1.5 – 2.0 hours.
3.1.4 Kinetics of Structural Transition upon Hydration from Gas Phase
From previous recorded data, it can be said that in dry state the peptide Aβ adopts α-helical
structure and transitions to a β-sheet conformation in aqueous buffer but neither the preliminary
α-helical structure of Aβ that is just cleaved off from APP nor the fibrils β-sheet conformation
exert the cytotoxic effect. The intermediate, transient prefibrillar structures are the major toxic
species. Hence, it is very imperative to determine the structural features of intermediate forms of
Aβ and analyze these transitions. Here, we have developed a novel biophysical approach to
accomplish this goal, that is, slow hydration of the peptide from gas phase to slow down the

47
structural transition, coupled with FTIR spectroscopy to apprehend the intermediate structures.
The peptide Aβ were dissolved in HFIP solutions. Then the sample was put on CaF2 glass
window and dried the sample before the measurement of FTIR spectra. Then the sample was
exposed to the D2O vapor for specific time periods for gradual hydration monitored by FTIR
measurements. A spectral region covering the amide I and amide II modes was analyzed. The
amide I band is generated mostly by the main-chain C=O stretching vibration and is
conformation sensitive. On the other hand, the amide II band, results mostly from the amide N–H
in-plane bending mode and is less sensitive to the peptide's secondary structure. The amide group
is expected to undergo H/D exchange due to the presence of D2O, resulting in a ~100 cm−1
down- shift of the amide II band and progressive decline of intensity in the 1560- to 1540-cm−1
region. Thus, to evaluate peptide hydration spectral changes, the amide II region were used, and
to measure the secondary structural changes, the amide I region were used.
The dry sample of Aβ1–40 have a peak at 1657 cm-1(Figure 3.1.5a) in amide I region which
indicate α-helical structure. When the sample was exposed to D2O vapor, the α-helical structure
peak slowly decreased meanwhile a new component peak around 1630 cm-1 were generate which
is the conformation wavenumber for β-sheet structure. Gradual hydration of the peptide by
exposed to D2O vapor is monitored by observe the decrease of the amide II band intensity around
1544 cm−1 , which suggests the amide H/D exchange. The single- exponential kinetics of the
secondary structural change was characterized with a rate constant of k = 1.49 ± 0.37 min−1 and a
limiting β-sheet/α-helix ratio of 1.58 ± 0.28 (Figure 3.1.5b, Table 3.1.3).

48
Figure 3.1. 5: (a): FTIR spectra of Aβ1-40 in dry state and after exposure to D2O vapor from 5 sec
to 5 min, as indicated. (b): Dependence of β-sheet/α-helix ratio on time of hydration from gas
phase is fitted with a single-exponential line with a rate constant of k =1.49 min-1.
It has been reported in various studies that the peptides Aβ and pEAβ are existed in brain cell
individually as well as combined, heterogeneous complexes [28,31]. So, it is very essential to
distinguish the structural conformation of Aβ1–40 and pEAβ3–40 separately and intermixed.
Though circular dichroism (CD) is proficient of determination of structure of peptides but it is
futile when the dissection of the structures of both peptides in a binary sample necessary which
can be done by using isotope-edited FTIR spectroscopy. In this method uniformly 13C-labeled
Aβ1–40 (13C-Aβ1–40) and unlabeled pEAβ3–40 were used for intermixed peptides. 13C-labeling of a
protein results in a 40–45 cm−1 downshift of its amide I band, which stipulates spectral resolution
of both 13C-labeled and unlabeled proteins when combined in one sample.[107]
In FTIR spectroscopy, 13C-Aβ1–40 show a peak at 1616 cm-1 in the amide I region which
indicates α-helical structure and illuminating the isotopic shift of the vibrational frequency

49
(downshift by 41 cm−1). After exposed by D2O vapor, the sample peak at 1616 cm-1 gradually
decrease and a new peak arise around 1588 cm-1, the β-sheet component in amide I region.
During the measurement it has been observed that the amide I region also confined a component
around 1677 cm−1 that was not perceptive to amide H/D exchange. This feature has been
reported previously in 13C-Aβ1–42 and other peptides and assigned to residual trifluoroacetic
acid.[85] As expected, the amide II band shows downshift from 1544 cm-1 to 1529 cm-1 due to
13C-labeling to unmodified peptide. The amide II had exhibited multiple spikes in some
measurements, which are produced by the vibrational/rotational hyperfine structure of D2O
bending mode [109,110] and do not comprise spectral noise. Amide H/D exchange was
monitored in the gradual regression of amide II band intensity and correlated with the transition
from α-helix to β-sheet conformation, as described in Figure 3.1.6d. The kinetics of α-helix to β-
sheet transition was illustrated with a single-exponential rate constant k = 1.31 ± 0.25 min−1 and
a limiting β-sheet/α-helix ratio of 1.72 ± 0.33 (Table 3.1.3).

50
Figure 3.1. 6: FTIR spectra of 13C-Aβ1-40 (a), pEAβ3-40 (b), and their 1:1 combination (c) in dry
state (black) and exposed to D2O vapor from 5 s (dark blue) to 5 min (red). The color code is the
same as in Figure 5. Kinetics of α-helix to β- sheet transitions of 13C-Aβ1-40, pEAβ3-40 and the
combination are presented in panels d, e, f, respectively. Data are fitted with single-exponential
lines with rate constants k = 0.93 min-1 for 13C-Aβ1-40 and k = 1.29 min-1 for pEAβ3-40, measured
individually. For the combined peptide sample, structural transitions of 13C-Aβ1-40 and pEAβ3-40,
following the short lag period, are characterized with rate constants k = 1.84 min-1 and k = 1.88
min-1 (red and blue lines in panel f, respectively).

51
Table 3.1. 3: Rate constants (k, min−1) and limiting β-sheet/α-helix ratios ((β/α)max) for α-helix
to β-sheet transitions of Aβ1–40, 13C-Aβ1–40, and pEAβ3–40 separately and in equimolar
combination upon exposure to D2O vapor of dry peptide samples.
Sample Separate
k (𝛽
𝛼⁄ )𝑚𝑎𝑥
Combined
k (𝛽
𝛼⁄ )𝑚𝑎𝑥
Aβ1-40 1.49 ± 0.37 1.58 ± 0.28 N/A N/A
13C-Aβ1-40 1.31 ± 0.25 1.72 ± 0.33 1.67 ± 0.34 1.22 ± 0.23
pEAβ3-40 1.14 ± 0.19 1.25 ± 0.21 1.74 ± 0.26 0.37 ± 0.06
The dry sample of pEAβ3–40 shows amide I peak at around 1656 cm-1 and after exposed to D2O
vapor the new peak arise at 1629 cm-1 (Figure 3.1.6b), indicating the transition from the α-
helical conformation to β-sheet structure. Simultaneously, hydration was supplemented with
decline in the intensity of the amide II band around 1542 cm−1 because of amide H/D exchange.
The kinetics of α-helix to β-sheet transition was illustrated with a single-exponential rate
constant k = 1.14 ± 0.19 min−1 and a limiting β-sheet/α-helix ratio of 1.25 ± 0.21 (Table 3.1.3).
After compare the saturating values of β-sheet/α-helix ratios of pEAβ3–40 with those of 13C-
labeled or unlabeled Aβ1–40, it indicates pEAβ3–40 contain less β-sheet and more α-helix when
aqueous solution was added which is consistent with weaker ThT fluorescence and CD signal of
this peptide (Figures 3.1.1b, e and 3.1.3b). The equimolar combination of 13C-Aβ1–40/pEAβ3–40
display two peaks in amide I region around at 1658cm-1 and 1616cm-1 (Figure 3.1.6c) in dry state
indicates the α-helical structure of both unlabeled and 13C-labeled peptides respectively. After
exposed to D2O vapor those α-helical peaks diminished and new peaks develop at around 1643
cm-1 and 1594 cm-1 and observe increment of intensity after time interval increase which

52
characterize β-sheet structure for unlabeled pEAβ3–40 and 13C-Aβ1–40, respectively. The amide II
band arisen at around 1540 cm-1 to 1530-cm−1 region and declined upon exposure to D2O vapor
due to amide H/D exchange. In a combined sample, the kinetics of α-helix to β-sheet transitions
showed a longer lag time compared with that seen for pEAβ3–40 (Figure 3.1.6e and 3.1.6f) and
were characterized with single-exponential rate constants k = 1.67 ± 0.34 min−1 and k = 1.74 ±
0.26 min−1 and limiting β-sheet/α-helix ratios of 1.22 ± 0.23 and 0.37 ± 0.06 for 13C-Aβ1–40 and
pEAβ3–40, respectively (Figure 3.1.6f, Table 3.1.3).
There are several interesting effects reveal while comparing the spectra of individual peptides
with their equimolar combination. The first thing it was observed that the frequencies of β-sheet
structure of individual peptides (1588 and 1629 cm−1 for 13C-Aβ1–40 and pEAβ3–40, respectively)
considerably lower than those of their equimolar combination (1594 and 1643 cm−1). This kind
of frequency shifts may occur because of (a) transition dipole coupling (TDC) effects, that is,
frequency shifts due to interactions between amide I oscillators [111,112] and (b) structural
differences between individual and combined peptides. It has been reported that the unperturbed
amide I frequency between 1680 and 1672 cm−1 is generated by Unordered proteins with no H-
bonding and no interaction between amide oscillators. [103-106] The specific secondary
structures formation causes the oscillators of amide I into one-another’s force field, resulting in
transition dipole coupling (TDC) and producing characteristic frequencies, such as those
presented by individual peptides (Figure 3.1.6a, b). The resultant of β-sheet signals at higher
frequencies might occurred because of mutual intercalations of 13C-Aβ1–40 and pEAβ3–40
molecules intrude with TDC between both 13C-labeled and unlabeled amide units. Various
studies suggested that aggregated β-sheets with intramolecular H-bonding generate amide I
signal at 10- to 15-cm−1 higher frequencies than intermolecular β-sheets. [106,108] So there is

53
possible fact developed in the difference between the observed frequencies of β-sheet structure
of the peptides in separately and combined. The peptides format intermolecular β-sheets when it
hydrated individually and format β-hairpin-like structures with intramolecular H-bonding when
hydrated combined. Here, equimolar combined unlabeled peptides would generate higher amide
I frequency while in aqueous buffer compared to that of the peptides in separately. Oppose to
this probability, the data of figure 3.1.4b display that Aβ1–40, pEAβ3–40, and the 1:1 combination,
all three samples produce generate β-sheet peaks at same frequencies: a major one at 1623 cm−1
and a minor one at 1636 cm−1. Therefore, the upshifted amide I frequencies of the combined
sample (Figure 3.1.6c), can be completely ascribed to TDC effects. This information insinuates
that the 13C-Aβ1–40 and pEAβ3–40 equimolar combination produces intertwined conformation,
diminishing TDC between like molecules and thus the higher vibrational frequencies are
generated. Previous study had been done with FTIR analysis on 13C-Aβ1–42 and pEAβ3–42 where
similar amide I spectral upshifts were identified for both peptide in their combination.[113]
Although, in contradiction of the 13C-Aβ1–40/pEAβ3–40 system, the spectra of individual peptide
had showed residual higher frequency signals, which became primary in samples are in mixed,
suggesting that the spectral upshift could not explained by TDC alone. The separated Aβ1–42 and
pEAβ3–42 peptides form amide I at lower frequencies represents intermolecular H-bonding,
however in combination, they form intramolecular H-bonding. The study of Aβ1–40/pEAβ3–40
system has shown the spectral shift, which is totally result from TDC effects, inhibiting
propositions of transition in the H-bonding pattern while the peptides in combination.
Moreover, the peak at 1643 cm-1 for pEAβ3–40 in equimolar combination when exposed in D2O
vapor is considerably weaker than that of 13C-Aβ1–40, additionally the spectrum shows an added
peak at 1667 cm-1(Figure 3.1.6c, red line). This can be assigned to a more flexible αII-helix that

54
absorbs at higher frequencies, in the 1667- to 1665-cm−1 spectral region, [114,115] proposing
that pEAβ3–40 sustains a fraction of disordered α-helix structure at the expense of β-sheet when in
aqueous environment. This result indicates that however 13C-Aβ1–40 transition from α-helix to β-
sheet structure in the combined sample, pEAβ3–40 forms β-sheet structure only partially and
maintains a fraction of flexible, or disordered, α-helical structure.
Afterward, the data that were collected from FTIR spectroscopy have been analyzed to determine
the β-sheets of hydrated peptide were either parallel or antiparallel. The second derivatives of
spectra of dry and hydrated samples were done graphically which emphasize the α-helical peaks
of dry peptides and the presence of β-sheet features upon hydration (Figure 3.1.7). For individual
peptides, in addition to the major β-sheet component at 1629–1628 cm−1 (1586 cm−1 for 13C-
Aβ1–40), a spectral feature is observed at 1695 cm−1 (1651 cm−1 for 13C-Aβ1–40) (Figure 3.1.7a–
c), which is represented to the high-frequency counterpart of antiparallel β-sheet.[105-107] For
equimolar combined sample, the spectra of β-sheet peaks for 13C-Aβ1–40 and pEAβ3–40 are
demonstrated at 1592- and 1645- to 1635-cm−1 regions, respectively, but the feature in the high-
frequency region (~1692 cm−1) is either nonexistent or faded (Figure 3.1.7d).

55
Figure 3.1. 7: Inverted second derivatives of FTIR spectra of Aβ1-40 (a), 13C-Aβ1-40 (b), pEAβ3-40
(c), and the 1:1combination of 13C-Aβ1-40 and pEAβ3-40 (d) in dry state (black line) and exposed
to D2O vapor for 10 s, 20 s, 30 s, 1 min, 2 min, 3 min, 4 min, and 5 min (gray to red), derived
from spectra shown in Figures 5 and 6. The wavenumbers of most prominent spectral features
are indicated.
This finding insinuated that the individual peptides obtain antiparallel β-sheets structure in
presence of aqueous system and form mostly parallel β-sheets when they are in combination
together. Nonetheless, FTIR data on the peptides in bulk buffer exhibit the high-frequency
antiparallel β-sheet component in the combined sample as well (Figure 3.1.4b). There is a
possibility that the peptides form mixed antiparallel and parallel β-sheets, with a shift toward the
parallel β-sheets in the combined sample hydrated from gas phase, as stated for Aβ1–40
aggregated on ganglioside-containing membranes.[116] Spectral features at 1666–1664 and 1651
cm−1 (1620 and 1604 cm−1 for 13C-Aβ1–40) are assigned to residual disordered or regular (amide
deuterated) α-helical structures, respectively.
Lastly, the transition’s kinetics from α-helix to β-sheet for 13C-Aβ1–40 and pEAβ3–40 their
equimolar combination implies that both peptides develop β-sheet structure quicker than the

56
separated peptides except the β-sheet/α-helix ratios reach low quantitatively and this tendency is
much more noticeable for pEAβ3–40 compare to that of 13C-Aβ1–40 (Table 3.1.3). Furthermore,
the formation of onset β-sheet structure is led by a lag time for pEAβ3–40 but not 13C-labeled or
unlabeled Aβ1–40, and the lag period is slower for both peptides in the mixed sample (Figure
3.1.6d–f). The repetition of low β-sheet propensity of pEAβ3–40 and indicates mutual suppression
of β-sheet fibril formation by the two peptides. The data collected from isotope edited FTIR
spectroscopy corroborate the finding from CD and ThT fluorescence studies that compare to the
peptide Aβ1–40, the transition from α-helix to β-sheet conformation pEAβ3–40 comprises a reduced
fraction of β-sheet fibrils. Previous studies suggested that Aβ1–40 have greater helical propensity
compared with pEAβ3–40 in H2O/TFE environment [70,117] evidently indicate the helix forming
effect TFE and are not in disagreement with present data collected in pure aqueous medium. In
the equimolar combination, pEAβ3–40 maintains a fraction of α-helical structure and decreases β-
sheet fibril formation propensity compare to Aβ1–40. The inclination of pEAβ3–40 to inhibit
fibrillogenesis may play a role in its increased cytotoxicity as the prefibrillar assemblies are
known to employ the major toxic effect.
3.2 Segmental Aggregation and Structural Propensities of Amyloid beta (Aβ) Peptide
Structural and aggregation properties of the parent A1-42 peptide and seven overlapping peptide
fragments have been studied, i. e. A1-10 (P1), A6-15 (P2), A11 -20 (P3), A16 -25 (P4), A21 -30
(P5), A26 -36 (P6), and A31 -42 (P7), as shown in Figure 3.2.1, to identify the region(s) of A
responsible for aggregation and fibrillogenesis and to use those fragments to inhibit A
aggregation.

57
Figure 3.2. 1: Overlapping Aβ peptide fragments and the parent Aβ1-42 peptide, presented as
single single-letter sequences, along with the theoretical isoelectric point (pI) values.
3.2.1 Peptide Secondary Structure from FTIR Spectroscopy
FTIR spectroscopy was used to analyze the structural transitions in the peptides.
To disperse possible pre-existing aggregates, the lyophilized peptides were dissolved in
hexafluoroisopropanol (HFIP).[98] A1-42 peptide in HFIP solution was span over a CaF2 disk ,
air-dried with gentle stream of N2 gas and desiccated for 15 minutes, followed by measurement
of Fourier transform infrared (FTIR) spectra. The dry peptide obtains -helical structure
displayed by a sharp amide I peak at 1658 cm-1 (Figure 3.2.2). Most of the A sequence
corresponds to the transmembrane -helix embedded in neuronal membranes, before cleavage
from APP. [104] Therefore, this result is coherent with the intrinsic -helical propensity of the
A1-42 sequence in dry state. Instead, determining the structure of the dehydrated peptide is
essential for analysis of structural transitions once the peptide is exposed to an aqueous medium.

58
Figure 3.2. 2: FTIR spectrum of Aβ1-42 dried on a CaF2 disk from 50 𝜇M HFIP solution. Amide I
and amide II peaks are located around 1657 cm-1, amide II around 1537 cm-1, respectively.
Figure 3.2. 3: FTIR spectra at indicated times of incubation in D2O-based buffer (25 mM NaCl,
25 mM Na,K-phosphate, pD 7.2) for Aβ1-42 (a) and peptides P1 (b), P2 (c), P3 (d), P4 (e), P5 (f),
P6 (g), and P7 (h) at 25oC. The concentrations of the peptides were 50 µM for Aβ1-42 and 100
µM for the fragments. Times of incubation in buffer of all fragments are indicated in panel b.

59
Afterward, A1-42 and the seven peptide fragments in HFIP solution were dried separately in
glass vials and aqueous (D2O) buffer was added to reach concentrations of 50 M for A1-42 and
100 M for the peptide fragments. With a small magnetic stir bar, the samples were constantly
stirred, and spectra of 70 L volume of sample were measured periodically over 100 hours to
observe structural changes of the peptides. Initially, the amide I spectrum of A1-42 exhibited two
noticeable components at 1672 and 1647 cm-1, suggesting mostly -turn and unordered or loop
conformations [107] (Figure 3.2.3). the peak at 1647 cm-1 was gradually replaced by a
component at 1627 cm-1, upon incubation in buffer, suggesting the formation of intermolecular
-sheet structure [107] which is consistent with the fibrillar structure of A1-42 containing -sheet
and -turn/loop conformations [118-120] (Figure 3.2.1) and implies that through intermolecular
H-bonding, formation of turn/loop structures leads aggregation and fibrillogenesis.
The distinct structural transitions were observed from the peptide fragments when they
add in aqueous buffer. Each peptide fragments except P7 initially generates significant fraction
of -turn structure in supplement to irregular structure, indicated by amide I components in
1672-1670 cm-1 and 1640 cm-1 regions, respectively (Figure 3.2.3). Only P3 and P6 displayed -
sheet component at 1628-1623 cm-1, among these 6 peptides (Figure 3.2.3d, g). In case of P3,
both -turn and -sheet structures developed at the expense of irregular structure (Figure 3.2.3d),
whereas in P6 the -turn became the principal structure upon continued incubation in buffer
(Figure 3.2.3g). P7 exhibited a distinctive behavior; it rapidly produced -sheet structure with a
distinctive peak around 1626 cm-1, which gradually shifted to higher wavenumbers possibly
reflecting transition to turn and/or -helix structures. Therefore, peptides P3, P6, and P7 display

60
-sheet formation propensity with diverse dynamics of structural transitions while the other four
peptides incline to adopt −turn/loop conformations.
3.2.2 Peptide Secondary Structure from Circular Dichroism (CD) Spectroscopy
For further analysis, the structural transition of peptides in aqueous buffer were monitored by a
complementary biophysical method, circular dichroism (CD). The question “how the structural
transitions of the peptides are corelated to fibrillogenesis”, was focused at the same time which
was accomplished by simultaneous measurements of CD spectra, light scattering, and thioflavin-
T (ThT) fluorescence of same peptide samples in aqueous buffer for over 100 hours.
CD spectra of peptides dissolved in HFIP, in dry state, and in aqueous buffer were measured.
Figure 3.2. 4: CD spectra of Aβ1-42 (a), P1 (b), P2 (c), P3 (d), P4 (e), P5 (f), P6 (g), and P7 (h)
dissolved in HFIP (solid) and in dry state (dotted). The concentration of Aβ1-42 in HFIP is 35 µM
and that of the fragments is 100 µM. The spectra of dry peptides are scaled up by a factor of 5
for better comparison. Averaged from three experiments.

61
A deep minimum at 204 nm and a shoulder around 220 nm (Figure 3.2.4) were generated for the
CD spectrum of the full-length A1-42 peptide in HFIP, suggesting the presence of type I and II
-turns, -strand, and possibly -helix conformations [102,121]. CD spectra of seven peptide
fragments exhibited two negative ellipticities as well. CD spectra of seven peptide fragments
exhibited two negative ellipticities as well. The stronger component arisen in the 205-208 nm
region (P1 and P2) or 195-200 nm region (P3 through P7) (Figure 3.2.4b-h), appointed to -turn
and unordered structures, respectively [91,99-100]. Between 220 and 230 nm, the weaker
component was detected which can be assigned to -helix, -turn and -strand conformations.
By desiccation the solvent was removed and CD spectra of dry peptides were measured. Upon
drying the structure of each peptide changes significantly. A1-42 adopted mostly -helical
structure, demonstrated by a negative component at 223 nm and weaker one at 208 nm, which
are produced by the n-* and -* electronic transitions [100,102]. The similar CD spectra were
observed for P1, P3, and P6. The weaker intensity of the -* transition can be accredited to a
more flexible or distorted -helix [102]. For peptides P4 and P5, the -* transition was
stronger, suggesting the formation of more stable -helix in CD spectra. Just one component
around 220-223 nm was shown for dry peptides P2 and P7, which is most likely to represent
type-I -turn and -strand structures [99,121].
The aqueous buffer was added to the peptides in dry state and structural transitions were
observed by recording of consecutive CD spectra.

62
Figure 3.2. 5: CD spectra of 50 µM Aβ1-42 (a) and 100 µM of peptides P1 (b), P2 (c), P3 (d), P4
(e), P5 (f), P6 (g), and P7 (h) constantly stirred by a tube rotator in buffer (25 mM NaCl, 25 mM
phosphate, pH 7.2) for time periods indicated in panel (a) for Aβ1-42 and in panel (b) for all
fragments. All measurement were conducted at 25oC. Average data from three independent
experiments.
Initially, the CD spectra showed a shallow negative band around 217 nm for A1-42, which
became a well-defined band accompanied with a positive component of nearly equal intensity
around 200 nm upon incubation in buffer for up to 48 hours, clearly indicating formation of -
sheet structure (Figure 3.2.5a). The peptide fragments were examined for longer time since their
structural transition occurred at slower rate. Peptide fragments P1, P2, P4, and P5 exhibit strong
negative ellipticity around 200 nm and weaker one between 225 and 235 nm (217 nm for P2),
indicating these peptides assume mostly unordered conformation with fractions of -turn/-
strand structures (Figure 3.2.5 b,c,e,f). On the other hand, peptides P3, P6, and P7 readily
adopted defined secondary structures within less that 1 hour (Figure 3.2.5 d,g,h). The CD spectra
of these three peptide fragments exhibit a negative n-* band around 220-225 nm of moderate

63
intensity and strong positive ellipticity in the -* region (<200 nm). These spectral features can
be assigned to twisted -sheet structure, as the intense -* transition is indication of twisted -
strands, and the n-* band can be significantly red-shifted depending on the degree of strand
twist [91,99,100,102,122,123]. Since the long optical path-length (4mm) of the cuvette was used
for simultaneous light scattering and fluorescence measurements with CD spectra, the excessive
noise below 200 nm was observed. Nevertheless, this does not undermine above interpretations
of CD spectra in terms of peptides’ structural features.
From FTIR and CD measurements, some differences have been observed in peptide structures,
such as different relative contents of -turn and irregular structures. This divergence might occur
due to non-identical sample preparation and handling protocols, as A structure is exquisitely
sensitive to sample preparation conditions, including the method of sample stirring [94].
Furthermore, both N-terminal acetylation and C-terminal amidation initiate additional amide
bonds that generate FTIR signal in the unordered region, i.e. between 1650 and 1638 cm-1.
Nevertheless, both FTIR and CD data uncover important common structural trends of these
peptide fragments, i.e., P3, P6, and P7 stand out by displaying strong -sheet propensity,
resembling the parent peptide A1-42, whereas other peptides P1, P2, P4, and P5 incline to stay in
-turn or unordered conformations.
3.2.3 Aggregation and Fibrillogenesis
To examine the kinetics of aggregation and fibrillogenesis of the peptides in aqueous buffer, ThT
fluorescence and static light scattering at 90 degrees were monitored. To exclude sample to
sample errors, these measurements were conducted in parallel with CD on same samples, which
permitted analysis of structural changes, peptide aggregation and fibril formation in real time.

64
The indication of increase in ThT fluorescence around 480 nm when excited at 435 nm (Figure
3.2.6 a,b) suggest that without delay A1-42 underwent fibrillogenesis . By around 1 day of
incubation in buffer with constant stirring on a rotary mixer, ThT fluorescence was reached
saturated state. At 550 nm light scattering increased with steeper initial rate and approached
saturation by 10-20 hours of incubation (Figure 3.2.6 c,d). The difference in the initial kinetics of
fluorescence and light scattering may reflect rapid formation of non-fibrillar aggregates that do
not bind ThT.
Figure 3.2. 6: ThT fluorescence with excitation at 435 nm (a) and light scattering with incident
light at 550 nm (c) of 35 µM Aβ1-42 in buffer (25 mM NaCl, 25 mM Na,K-phosphate, pH 7.2)
stirred by a tube rotator for time periods indicated in panel (a). Time dependence of ThT
fluorescence averaged between 475 and 485 nm and of light scattering averaged between 550
and 555 nm are presented in panels (b) and (d), respectively. Average data from three
independent experiments.

65
A very weak ThT fluorescence was monitored for peptide fragments P1, P2, P4, and P5 (Figure
3.2.7a,b,d,e). Peptides P3 and P6 produced higher level of ThT fluorescence, and peptide 7
constructed maximum ThT fluorescence (Figure 3.2.7c,f,g), unraveling a sequence of
fibrillogenesis propensity P7 > P6 P3 >> P4 P5 P2 P1 0 (Figure 3.2.7h).
Figure 3.2. 7: ThT fluorescence spectra of P1, P2, P3, P4, P5, P6, and P7 (panels 1 through g,
respectively) with excitation at 435 nm, at 25oC. Time of incubation of peptide samples in buffer
(25 mM NaCl, 25 mM Na,K-phosphate, pH 7.2) at 100 µM concentration with constant stirring
by a tube rotator is as follows: 0.1 h (dark blue), 2.0 h (light blue), 4.0 h (turquoise), 16.0 h
(green), 40.0 h (yellow), 64.0 h (orange), 104.0 h (red). Panel h shows the time dependence of
ThT fluorescence averaged between 475 and 485 nm for all seven peptides. Average data from
three independent experiments. Error bars are shown only for P1, P3, P4, P6, P7 to maintain
clarity. Error bars for P2 and P5 are of similar magnitude as for those of P1 and P4.

66
Contemporary light scattering measurements implied relatively weak signal for peptides P1, P2,
P4, and P5 and about 3-fold higher signal for peptides P3, P6, and P7 (Figure 3.2.8).
Figure 3.2. 8: Time progression of light scattering spectra of peptides P1 (a), P2 (b), P3 (c), P4
(d), P5 (e), P6 (f), and P7 (g) at 100 µM. Color code in panels (a) through (g) is the same as in
Figure 3.2.7. Panel (h) shows time course of light scattering for all seven peptides. Standard
deviation bars from three experiments are only shown for selected peptides to maintain clarity.
Error bars for other peptides are of similar magnitude.
The peptide fragments P1,P2,P4 and P5 exhibit little ThT fluorescence but substantial light
scattering indicates the formation of non-fibrillar aggregation. Greater level of ThT fluorescence
by P7 compared to P3 and P6 but comparable light scattering (Figure 3.2.7h and 3.2.8h)
insinuates a more extensive ThT binding capacity of P7, probably due to its higher
hydrophobicity and/or a larger number of amino acid residues. Generally, these data provide
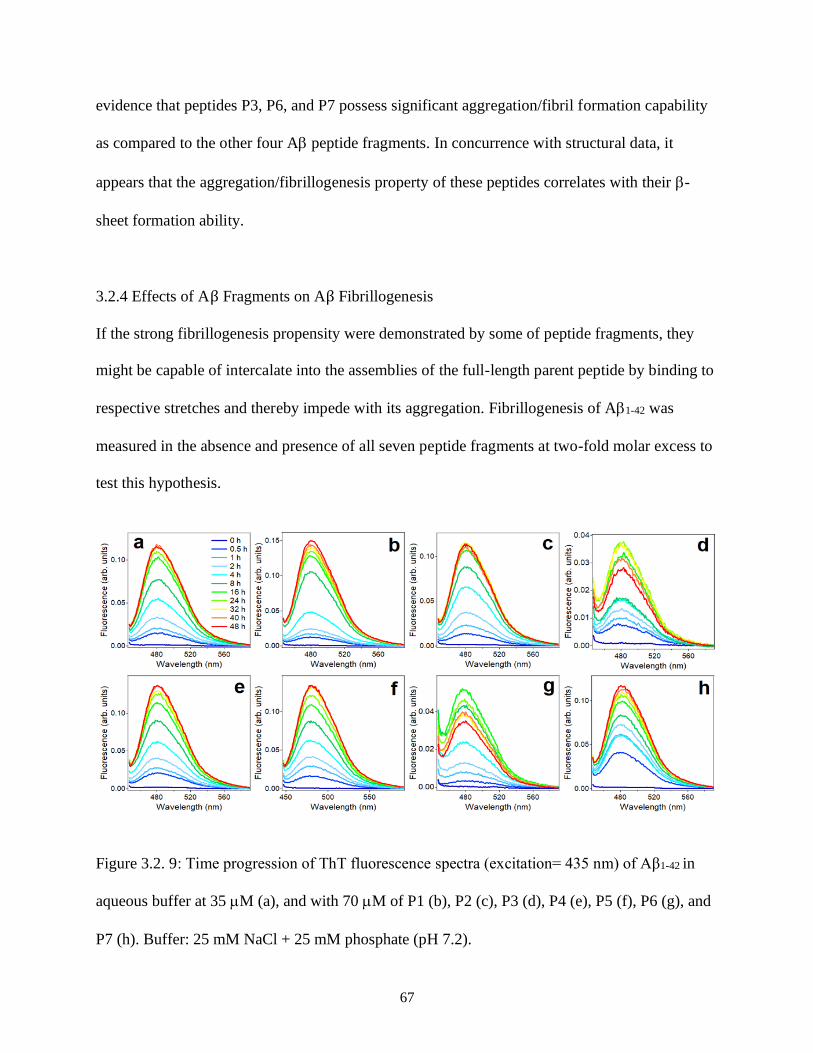
67
evidence that peptides P3, P6, and P7 possess significant aggregation/fibril formation capability
as compared to the other four A peptide fragments. In concurrence with structural data, it
appears that the aggregation/fibrillogenesis property of these peptides correlates with their -
sheet formation ability.
3.2.4 Effects of Aβ Fragments on Aβ Fibrillogenesis
If the strong fibrillogenesis propensity were demonstrated by some of peptide fragments, they
might be capable of intercalate into the assemblies of the full-length parent peptide by binding to
respective stretches and thereby impede with its aggregation. Fibrillogenesis of A1-42 was
measured in the absence and presence of all seven peptide fragments at two-fold molar excess to
test this hypothesis.
Figure 3.2. 9: Time progression of ThT fluorescence spectra (excitation= 435 nm) of Aβ1-42 in
aqueous buffer at 35 M (a), and with 70 M of P1 (b), P2 (c), P3 (d), P4 (e), P5 (f), P6 (g), and
P7 (h). Buffer: 25 mM NaCl + 25 mM phosphate (pH 7.2).

68
In the presence of peptides P1, P2, P4, P5, and P7, ThT fluorescence of A1-42 samples
progressively increased and levelled off by 48 hours of incubation with little effect of these
fragments (Figure 3.2.9 b,c,e,f,h). The intensity values for wavelength 480 nm vs time of
incubation were plotted for every sample. Here it has been observed that the fluorescence
intensity gradually increased over increase of incubation time for samples of Aβ1-42 mixed with
P1, Aβ1-42 mixed with P2, Aβ1-42 mixed with P4, Aβ1-42 mixed with P5, Aβ1-42 mixed with P7 and
reach more than 0.1 arbitrary units where Aβ1-42 mixed with P3 and Aβ1-42 mixed with P6
samples fluorescence around 480 nm were increase initially up to incubation for 16 hours but by
24 hours of incubation the intensity decreases get saturated for further observation by remaining
the intensity around 0.025 arbitrary units. In contrast, P3 and P6 strongly reduced the level of
ThT fluorescence (Figure3.2.9 d,g). Despite relatively large standard deviations among three
experiments, which reflects the inherent polymorphism of A, the distinctive inhibitory effects
of P3 and P6 was statistically significant (Figure 3.2.10).

69
Figure 3.2. 10: Time dependence of ThT fluorescence at 480 nm (excitation= 435 nm) of Aβ1-42
alone and in the presence of 2-fold molar excess of peptides 1 to 7, as indicated. Buffer: 25 mM
NaCl + 25 mM phosphate, pH 7.2.
Quantitative evaluation of inhibition of A1-42 fibril formation by peptide fragments was
performed by calculating the inhibition percentages (IP) for each fragment.

70
Figure 3.2. 11: Inhibition percentages for P1 through P7 calculated based on ThT fluorescence
data (Figures 3.2.6, 3.2.7, 3.2.10) averaged between 32 and 48 hours of incubation of Aβ1-42
alone and with each peptide fragment at 2-fold molar excess in buffer (25 mM NaCl, 25 mM
Na,K-phosphate, pH 7.2). See details in Materials and Methods.
P3 and P6 strongly inhibited A1-42 fibrillization by 80.59.0% and 77.75.8%, respectively
(Figure 3.2.11). Peptides P2 and P7 exhibited moderate inhibitory potencies (IP = 18.82.1%
and 28.73.8%, respectively), and the other three peptides (P1, P4, and P5) were not potent
inhibitors (IP < 5.0%).
This work details an analysis of structural and aggregation propensities of A1-42 fragments and
their effects on A1-42 fibrillogenesis. The results facilitate a better understanding of segment-
specific properties of A1-42 and distinguish peptide fragments capable of inhibiting its
aggregation. We selected 10 to 12-residue overlapping fragments because fragments shorter than
10 residues might be incapable to demonstrate vigorous secondary structure formation and
fibrillogenesis abilities because of insufficient length. Although short A fragments comprising

71
6-8 residues have been shown to adopt parallel or antiparallel -sheets in crystal form [124,125],
the hydrophobic C-terminal sequences of A1-42 containing eight amino acid residues, as well as
an 11-residue stretch (A32-42), did not aggregate into -sheet fibrils in aqueous buffer even at
concentrations exceeding 100 M [83]. On the other hand, use of overlapping sequences was
important for characterization of segments at boundaries of consecutive stretches; properties of
the boundary between P(i) and P(i+2) were reflected in P(i+1), which covers the C- and N-
termini of flanking sequences.
Peptides P1 and P2 represent the N-terminus of A, which has been consistently found in
unordered conformation in the context of A1-40 or A1-42 [94,118,120,126]. The A1-8 fragment
was found in extended coil confirmation in complex with a monoclonal antibody [94]. Despite
its proposed role in stabilizing A fibrils [127], above data and our findings indicate that the N-
terminus of A is intrinsically unordered and unable to undergo fibrillogenesis. This feature is
evidently related with the amino acid composition of these segments; the paucity of nonpolar
side chains and the excess negative charge (pI 4.54 and 5.72 for P1 and P2, respectively) may
inhibit aggregation due to electrostatic repulsion and absence of hydrophobic interactions. P1 is
also a poor inhibitor of A1-42, whereas P2 demonstrates moderate inhibitory activity (Figure
3.2.11), which probably stems from its C-terminal part, as P3 is highly aggregation prone and a
potent inhibitor of A1-42 fibrillogenesis.
The P3 segment corresponds to one of the two major -strands of A1-40 fibrillar structure
A1-42 [94] (Figure 3.2.1). The whole P3 sequence or at least its central part are in -strand
conformation in fibrils formed by of A1-42 as well [118-120] (Figure 3.2.1). P3 has one glutamic
acid (Glu) and one lysine (Lys) residues and nearly zero net charge (pI = 7.01). These features

72
would allow the peptide to form -strand-like non-H-bonded out of register aggregates in
antiparallel sense with oppositely charged side chains facing each other, as shown in Figure
3.2.12.
Figure 3.2. 12: Proposed mode of aggregation of P3. Red, blue, and green side chains are those
of Glu11, Lys16, and His 13 and 14. All other side chains are omitted for clarity. The monomer
𝛽- strand structure is shown as a gray ribbon. The fibril would grow by means of intermolecular
H-bonding perpendicular to the plane of the image.
This arrangement will juxtapose one Glu-Lys pair and one histidine pair between strands so the
structure will be stabilized by Glu-Lys salt bridges and - stacking interactions between
histidines [134,135]. As a fraction of imidazole side chains will be protonated due to the close-
to-neutral pK = 6.30.1 [136], His-His attraction will be further strengthened by nucleophile-
electrophile interactions. This structure may grow laterally beyond tetramer until decreasing
internal energy is compensated by decreasing entropy at a minimum of free energy. The fibril
will grow by means of parallel -sheet formation stabilized by H-bonding perpendicular to the
plane of side chains. The nonpolar overhangs may form turn or parallel -sheet structure
73
stabilized by hydrophobic interactions and - stacking interactions between C-terminal
phenylalanines [134]. In order to test the model of P3 aggregation, assuming the interaction in
stabilized by electrostatic forces. It can be tested it in two different ways:
First, The observation of fibrillogenesis at low pH. At pH 3, the negative charge of Glu (pI 3.22)
side chain will be neutralized and the Glu-Lys ionic bond will be eliminated.
The second way would be using high salt concentration, such as a buffer containing same
concentration of phosphate buffer and 1 M NaCl. Increase in salt concentration at 1.0 M caused a
decrease in protein solubility. At very high salt concentrations, the increase in surface tension of
water creates competition for hydration between protein and salt ions. Salt removes the necessary
layer of water molecules from the surface of the protein and ultimately denatures the protein.
In earlier observations of dimer formation by A10-23 peptide, it has exhibited that the peptide
develops into -sheet fibrillar structure [137]. FTIR data (Figure 3.2.3d) show a low frequency
(1623 cm-1) -sheet component without a high-frequency counterpart diagnostic for antiparallel
-sheet, consistent with parallel -sheet formation. Figures 3.2.9, 3.2.10, and 3.2.11 show that P3
forms fibrils and substantially blocks the fibrillogenesis of A1-42. Inhibition of A1-42
fibrillogenesis presumably occurs through intercalation of P3 aggregates between A1-42
molecules and/or binding of P3 to the homologous or other segments of A1-42. Consistent with
our findings, it was reported earlier that A segment 11-17 (EVHHQKL), i.e. 0.7 part of P3, but
not other A-derived short peptides, effectively blocked A1-40-induced Ca2+ influx into cultured
cells possibly by inhibiting aggregation of A1-40 into a membrane pore-forming structure [129].
P3 is apparently able to bind not only to various parts of A but to other biomolecules as well.
For example, the 12-18 stretch of A (VHHQKLV) has been found to bind to heparin and
thereby mediate the effects of heparin on A plaque formation [138].
74
A region corresponding to P4 (A16-25) contains the central hydrophobic core 17-
LVFFA-21 that is deemed to be important for A aggregation. Molecular modeling and a variety
of experimental studies have shown that the A16-22 fragment (KLVFFAE) forms antiparallel in-
register -sheet stabilized by nonpolar contacts between the central segment and ionic
interactions between the side chains of N- and C-terminal Lys and Glu residues [123,128,139-
140]. Monomeric A16-25 was in coil or extended -strand-like conformation and transitioned
into antiparallel -sheet through intermediate -helical structure [141]. Our data show unordered
plus -strand conformation for P4 in HFIP in monomeric form (Figure 3.2.4e) but transition to
-sheet in aqueous buffer is not observed (Figures 3.2.3e and 3.2.4e). This difference seemingly
results from the supplementary three residues in P4 compared to A16-22. The presence of an
additional anionic side chain of aspartic acid at position 23 results in excess negative charge and
a low pI of 4.37 (Figure 3.2.1). These considerations suggest that long-range electrostatic
repulsion between short peptides may interfere with initial peptide aggregation and subsequent
fibrillization. Furthermore, an analogue of A16-22 with N-methyl amino acids in alternating
positions was a potent inhibitor of A1-40 fibrillogenesis unlike the unmodified peptide [133],
which is coherent with our data of negligible inhibitory effect of P4 on A1-42 fibril formation
(Figures 3.2.10h and 3.2.11).
P5 encompasses the A region that forms a loop between two major -strands of A1-40
fibrils characterized by two- or three-fold symmetry [94] and has been viewed as a folding
nucleus for A 143,144]. This region is mostly in loop conformation in fibrils of A1-42 as well
[118-120] (Figure 3.2.1). In complex with an affibody protein, A1-40 was found in a -hairpin
conformation with residues 24-29 forming a loop between two -strands but without the Asp23-

75
Lys28 salt bridge present in A1-40 fibrils of two-fold symmetry [145]. The isolated P5 segment
itself was mostly unordered [83] or formed a loop with a central -turn structure formed by
residues 24 and 27 and stabilized by ionic interactions of Lys28 with Glu22/Asp23 and nonpolar
contacts between Val24 and Lys28 [143]. P5 did not undergo aggregation in aqueous medium
[83,143], in accord with sequence-based calculation of low aggregation propensity. Transmission
electron microscopic studies shown relatively large (25-120 nm) globular particles produced by
P5 with uncapped termini whereas the N-acetylated/C-amidated peptide formed smaller
particles, implying low aggregation tendency [144]. Our FTIR data for P5 display broad amide I
band dominated by signal in the1670-1640 cm-1 range Figure 3.2.3f), revealing mostly
unordered/turn structure of the peptide. This is confirmed by CD spectra with a deep minimum
around 200 nm and a shallow negative band around 228 nm (Figure 3.2.4f). Figure 3.2.8e, h and
3.2.7e, h display negligible light scattering and ThT fluorescence in P5 peptide samples, and
Figures 3.2.10h and 3.2.11 document the inability of P5 to affect A1-42 fibrillogenesis, inferring
a poor potency of P5 towards homo- or hetero-aggregation.
P6 (A26-36) resembles the A25-35 peptide, which has been studied extensively due to its
highly cytotoxic nature. In aqueous buffer at pH 4.0-5.5, the A25-35 peptide underwent
concentration-dependent unordered-to--sheet transition whereas its C-amidated counterpart was
in random coil state [146]. At close to neutral pH, the N-acetylated/C-amidated peptide attained
β-sheet/β-turn structures [147]. In detergent micelles and in HFIP/water (80/20) environment,
A25-35 was -helical in the C-terminal region and less ordered or turn conformation in the N-
terminus (25-28), and in HFIP/water (20/80) the C-terminus became unordered [148,149]. ThT
and transmission electron microscopy assays revealed fibril formation by A25-35 [128,129] and
-sheet breaking short peptides inhibited fibrillogenesis and cytotoxicity of the peptide [129].

76
Slight sequence differences in this region of A resulted in significant differences in structural
and aggregation properties. Biophysical and computational studies produced A26-36 and A25-35
structural models as -hairpins containing two short -strands separated by a turn [112], in
accord with our FTIR data (Figure 3.2.3g). P6 formed -sheet structure in aqueous buffer with
red-shifted (~220 nm) n-* CD band and exhibited higher fibril formation capability than similar
undecapeptides A25-35 and A24-34 [150], consistent with our results (Figures 3.2.4g and 3.27h).
P7 (A31-42) represents the most hydrophobic C-terminal stretch of A and plays an
important role in its aggregation into -sheet oligomers and fibrils [83,132]. Dynamic light
scattering experiments identified two populations of A1-42 aggregates with hydrodynamic radii
(RH) 8-12 nm and 20-60 nm, which upon elongated incubation in buffer exceeded 500 nm, while
the P7 fragment formed large aggregates with RH around 100 nm [83,132]. In combination, P7
affected the aggregation of A1-42 in a nontrivial way; it increased the abundance of larger
particles but reduced the rate of their formation. Molecular modeling simulations showed that P7
intercalates into A1-42 aggregates and thereby inhibits formation of toxic assemblies of A1-42
[132]. The CD experiments showed that structural transitions of C-terminal fragments of A1-42
were concentration dependent; at 62 M, P7 gradually transitioned from unordered state to -
sheet structure during 96 hours of incubation in buffer and formed fibrils [83], in very consistent
with our finding (Figures 3.2.4h and 3.2.7g,h).
The characterization of the intrinsic aggregation and structural properties of overlapping
peptide segments throughout the A1-42 sequence and the effects of these fragments on A1-42
fibrillogenesis are done here. Though aforementioned studies have exploited a similar approach
and have focused on certain parts of A1-42, such as the C-terminal hydrophobic stretch,
77
systematic dissection and analysis of the whole A1-42 sequence has not been reported. Or data
identify A fragments that are capable of self-aggregation and -sheet structure formation and
substantially inhibit fibrillogenesis of A1-42, presumably by intervention into forming
aggregates or prevention of efficient intermolecular contacts between A1-42 molecules.
However, the self-aggregation/-sheet propensities of the peptide fragments are not universally
correlated to the inhibitory effect of fragments on A1-42 fibril formation. For example, P7, the
most hydrophobic segment that undergoes efficient fibrilization (Figure 3.2.10h) and -sheet
formation (Figures 3.2.3h and 3.2.4h) is a relatively week inhibitor of A1-42 fibrillization of
(Figures 3.2.10h and 3.2.11). Finally based on our overall findings, it can be said that peptide
fragments with high homo-aggregation propensity prefer self-association rather than forming
hetero-aggregates with the full-length peptide.

78
CHAPTER 4: CONCLUSION
Here, the first work aims to clarify the structural transformation of Aβ1-40 and pEAβ3-40 during
fibril formation, either separately or in equimolar combination. Fluorescence data from ThT
indicate that pEAβ3-40 rapidly forms a small fraction of fibers, which tend to grow slowly, and
when combined with Aβ1-40, it can inhibit fibril formation. The CD data have shown that when
dissolved in HFIP and in the dry state, both peptides exhibit an α-helix structure and are
converted to a β-sheet structure in an aqueous buffer. Nevertheless, pEAβ3-40 acquired a unique
conformation, possibly involving an α-helical structure. The combination of the two peptides
exhibited a reduced fraction of the β sheet, consistent with the weaker ThT fluorescence.
Isotope-edited FTIR spectroscopy analyzes the structural transition of each peptide when
combined in a sample. The shifted frequency of amide I indicates that the unmodified and
pyroglutamylated peptides form an intertwined structure and a mutual structural effect, that is,
inhibition of the β-sheet / α-helix ratios. The FTIR data confirmed the retention of the residual α-
helical structure of pEAβ3-40 in individual and in the combined sample during hydration. Because
mature fibrils are composed of cross β-sheet structure, the presence of heterogeneous secondary
structures (including α-helix) will hinder fibril formation, as shown by ThT fluorescence data,
and and will favor a longer lifetime for smaller assemblies that are known to be more toxic.
Therefore, our data provide a molecular explanation for the hypertoxicity of pEAβ alone and in
combination with unmodified Aβ.
The second work has done based on the characterization the intrinsic aggregation and structural
characteristics of overlapping peptides in the complete sequence of Aβ1-42, and the influence of
these fragments on the formation of Aβ1-42 fibrils. FTIR data shows that the full-length A1-42
exhibit -sheet and -turn/loop conformations in the presence aqueous environment, and it

79
indicates that the intermolecular H-bonding, formation of turn/loop structures which leads
aggregation and fibrillogenesis. Where peptide fragments P3, P6, and P7 display -sheet
structure where the other four peptides (P1, P2, P4, P5) incline to adopt −turn/loop
conformations. The CD data established the findings of these peptide fragments, that P3, P6 and
P7 stand out for showing a strong -sheet propensity, comparable to the parent peptide A1-42,
whilst other peptides P1, P2, P4 and P5 incline to remain in -turn or disorderly conformation.
ThT fluorescence and light scattering data provide evidence that, compared with the other four
A peptide fragments, peptides P3, P6, and P7 have significant aggregation ability. Based on
structural data, the aggregation/fibrillation properties of these peptides appear to be related to
their ability to form -sheets. Fibrillogenesis of A1-42 was monitored in the absence and
presence of all seven peptide fragments at two-fold molar excess to test the hypothesis of if
certain peptide fragments exhibit a strong tendency to fibrillate, they may be able to be
embedded in the full-length parent peptide segment by binding to the corresponding fragments to
inhibit their aggregation. This observation indicates that P3 and P6 strongly inhibit A1-42
fibrillation, in which peptides P2 and P7 show moderate inhibitory potency, while the other three
peptides (P1, P4, and P5) are not effective inhibitors, indicating that all three peptides (P1, P4
and P5) are not effective inhibitors and there is no universal correlation between them. Fragment
self-aggregation / β-sheet tendency and inhibition of A1-42 fibril formation. However, effective
inhibition of A1-42 aggregation by peptides P3 and P6 may help to develop new DNA, mRNA,
or peptide-based anti-AD treatment strategies.

80
REFERENCE
[1] Ferreira D, Nordberg A, Westman E. Biological subtypes of Alzheimer disease: a systematic
review and meta-analysis. Neurology. 2020;94(10):436-448.
[2] Thal, D. R., Walter, J., Saido, T. C., & Fändrich, M. (2015) Neuropathology and
biochemistry of Aβ and its aggregates in Alzheimer’s disease. Acta neuropathologica, 129(2),
167-182.
[3] Masters, C. L., & Selkoe, D. J. (2012) Biochemistry of amyloid β-protein and amyloid
deposits in Alzheimer disease. Cold Spring Harbor Perspectives in Medicine, 2(6), a006262.
[4] Musiek, E. S., & Holtzman, D. M. (2015) Three dimensions of the amyloid hypothesis: time,
space and 'wingmen'. Nature Neuroscience, 18(6), 800.
[5] Hardy, J., & Allsop, D. (1991) Amyloid deposition as the central event in the aetiology of
Alzheimer's disease. Trends in Pharmacological Sciences, 12, 383-388.
[6] Lal, R., Lin, H., & Quist, A. P. (2007) Amyloid beta ion channel: 3D structure and relevance
to amyloid channel paradigm. Biochimica et Biophysica Acta (BBA)-Biomembranes, 1768(8),
1966-1975.
[7] Arispe, N., Diaz, J. C., & Simakova, O. (2007) Aβ ion channels. Prospects for treating
Alzheimer's disease with Aβ channel blockers. Biochimica et Biophysica Acta (BBA)-
Biomembranes, 1768(8), 1952-1965.
[8] Gillman, A. L., Jang, H., Lee, J., Ramachandran, S., Kagan, B. L., Nussinov, R., & Teran
Arce, F. (2014) Activity and architecture of pyroglutamate-modified amyloid-β (AβpE3-42)
pores. The Journal of Physical Chemistry B, 118(26), 7335-7344.
81
[9] Ferreiro, E., Oliveira, C. R., & Pereira, C. M. (2008) The release of calcium from the
endoplasmic reticulum induced by amyloid-beta and prion peptides activates the mitochondrial
apoptotic pathway. Neurobiology of Disease, 30(3), 331-342.
[10] Ferreiro, E., Baldeiras, I., Ferreira, I. L., Costa, R. O., Rego, A. C., Pereira, C. F., &
Oliveira, C. R. (2012) Mitochondrial-and endoplasmic reticulum-associated oxidative stress in
Alzheimer's disease: from pathogenesis to biomarkers. International Journal of Cell Biology, vol.
2012, Article ID 735206, 23 pages.
[11] Demuro, A., & Parker, I. (2013) Cytotoxicity of intracellular aβ42 amyloid oligomers
involves Ca2+ release from the endoplasmic reticulum by stimulated production of inositol
trisphosphate. Journal of Neuroscience, 33(9), 3824-3833.
[12] Resende, R., Ferreiro, E., Pereira, C., & De Oliveira, C. R. (2008) Neurotoxic effect of
oligomeric and fibrillar species of amyloid-beta peptide 1-42: involvement of endoplasmic
reticulum calcium release in oligomer-induced cell death. Neuroscience, 155(3), 725-737.
[13] Reddy, P. H., Tripathi, R., Troung, Q., Tirumala, K., Reddy, T. P., Anekonda, V.,
Shirendeb, U.P., Calkins, M.J., Reddy, A.P., Mao, P. (2012) Abnormal mitochondrial dynamics
and synaptic degeneration as early events in Alzheimer's disease: implications to mitochondria-
targeted antioxidant therapeutics. Biochimica et Biophysica Acta (BBA)-Molecular Basis of
Disease, 1822(5), 639-649.
[14] Pagani, L., & Eckert, A. (2011) Amyloid-Beta interaction with mitochondria. International
Journal of Alzheimer’s Disease, vol. 2011, Article ID 925050, 12 pages.
[15] Correia, S.C., Santos, R.X., Santos, M.S., Casadesus, G., Lamanna, J.C., Perry, G., Smith,
M.A. & Moreira, P.I. (2013) Mitochondrial abnormalities in a streptozotocin-induced rat model
of sporadic Alzheimer's disease. Current Alzheimer Research, 10(4), 406-419.

82
[16] Chi, T. Y., Wang, L. H., Ji, X. F., Shen, L., & Zou, L. B. (2013) Protective effect of
xanthoceraside against β-amyloid-induced neurotoxicity in neuroblastoma SH-SY5Y cells.
Journal of Asian Natural Products Research, 15(9), 1013-1022.
[17] Lei, H., Zhao, C. Y., Liu, D. M., Zhang, Y., Li, L., Wang, X. L., & Peng, Y. (2014) L-3-n-
butylphthalide attenuates β-amyloid-induced toxicity in neuroblastoma SH-SY5Y cells through
regulating mitochondrion-mediated apoptosis and MAPK signaling. Journal of Asian Natural
Products Research, 16(8), 854-864.
[18] Malinow, R. (2012) New developments on the role of NMDA receptors in Alzheimer's
disease. Current Opinion in Neurobiology, 22(3), 559-563.
[19] Kim, T., Vidal, G. S., Djurisic, M., William, C. M., Birnbaum, M. E., Garcia, K. C., Hyman,
B.T., Carla, J. et al. (2013) Human LilrB2 is a β-amyloid receptor and its murine homolog PirB
regulates synaptic plasticity in an Alzheimer’s model. Science, 341(6152), 1399-1404.
[20] Benilova, I., Karran, E., & De Strooper, B. (2012) The toxic Aβ oligomer and Alzheimer's
disease: an emperor in need of clothes. Nature Neuroscience, 15(3), 349.
[21] Agostinho P, Pliassova A, Oliveira CR & Cunha RA (2015) Localization and trafficking of
amyloid-b protein precursor and secretases: impact on Alzheimer’s disease. J Alzheimers Dis
45(2015), 329–347.
[22] Naldi, M., Fiori, J., Pistolozzi, M., Drake, A. F., Bertucci, C., Wu, R., Mlynarczyk, K.,
Filipek, S., Simone, A.D. et al. (2012) Amyloid β-peptide 25–35 self-assembly and its inhibition:
a model undecapeptide system to gain atomistic and secondary structure details of the
Alzheimer’s disease process and treatment. ACS Chemical Neuroscience, 3(11), 952-962.
[23] Spies, P. E., Verbeek, M. M., van Groen, T., & Claassen, J. A. (2012) Reviewing reasons
for the decreased CSF Abeta42 concentration in Alzheimer disease. Front Biosci, 17, 2024-2034.

83
[24] Serpell, L. C. (2000) Alzheimer’s amyloid fibrils: structure and assembly. Biochimica et
Biophysica Acta (BBA)-Molecular Basis of Disease, 1502(1), 16-30.
[25] Estrada, L. D., & Soto, C. (2006) Inhibition of protein misfolding and aggregation by small
rationally-designed peptides. Current pharmaceutical design, 12(20), 2557-2567.
[26] Connelly, L., Jang, H., Teran Arce, F., Capone, R., Kotler, S. A., Ramachandran, S., Kagan,
B.L., Nussinov, R. & Lal, R. (2012) Atomic force microscopy and MD simulations reveal pore-
like structures of all-D-enantiomer of Alzheimer’s β-amyloid peptide: relevance to the ion
channel mechanism of AD pathology. The Journal of Physical Chemistry B, 116(5), 1728-1735.
[27] Supnet, C., Grant, J., Westaway, D., & Mayne, M. (2006) Amyloid-β-(1-42) increases
ryanodine receptor-3 expression and function in neurons of TgCRND8 mice. Journal of
Biological Chemistry, 281(50), 38440-38447.
[28] Lin, H. A. I., Bhatia, R., & Lal, R. (2001) Amyloid β protein forms ion channels:
implications for Alzheimer’s disease pathophysiology. The FASEB Journal, 15(13), 2433-2444.
[29] Petkova, A. T., Ishii, Y., Balbach, J. J., Antzutkin, O. N., Leapman, R. D., Delaglio, F., &
Tycko, R. (2002) A structural model for Alzheimer's β-amyloid fibrils based on experimental
constraints from solid state NMR. Proceedings of the National Academy of Sciences of USA,
99(26), 16742-16747.
[30] Coles, M., Bicknell, W., Watson, A. A., Fairlie, D. P., & Craik, D. J. (1998) Solution
Structure of Amyloid β-Peptide (1− 40) in a Water− Micelle Environment. Is the Membrane-
Spanning Domain Where We Think It Is? Biochemistry, 37(31), 11064-11077.
[31] Alomar-Dominguez C, Dostal L, Thaler J, Putz G, Humpel C, Lederer W. Beta-amyloid
peptides(1-42) and (1-40) in the cerebrospinal fluid during pregnancy: a prospective
observational study. Arch Womens Ment Health. 2021 Jun;24(3):455-461.

84
[32] Lin, Y., Sahoo, B. R., Ozawa, D., Kinoshita, M., Kang, J., Lim, M. H., Masaki O. et al.
(2019) Diverse Structural Conversion and Aggregation Pathways of Alzheimerʼs Amyloid-β (1-
40). ACS Nano Article ASAP DOI: 10.1021/acsnano.9b01578.
[33] Anand, B. G., Prajapati, K. P., & Kar, K. (2018) Aβ1-40 mediated aggregation of proteins
and metabolites unveils the relevance of amyloid cross-seeding in amyloidogenesis. Biochemical
and Biophysical Research Communications, 501(1), 158-164.
[34] Baldassarre, M., Baronio, C. M., Morozova-Roche, L. A., & Barth, A. (2017) Amyloid β-
peptides 1–40 and 1–42 form oligomers with mixed β-sheets. Chemical Science, 8(12), 8247-
8254.
[35] Leite JP, Gimeno A, Taboada P, Jiménez-Barbero JJ, Gales L. Dissection of the key steps of
amyloid-β peptide 1-40 fibrillogenesis. Int J Biol Macromol. 2020 Dec 1;164:2240-2246.
[36] Okada, Y., Okubo, K., Ikeda, K., Yano, Y., Hoshino, M., Hayashi, Y., Kiso, y., Watanabe,
H.I., Naito, A. et al. (2018) Toxic Amyloid Tape: A Novel Mixed Antiparallel/Parallel β-Sheet
Structure Formed by Amyloid β-Protein on GM1 Clusters. ACS Chemical Neuroscience, 10(1),
563-572.
[37] Bellomo, G., Bologna, S., Gonnelli, L., Ravera, E., Fragai, M., Lelli, M., & Luchinat, C.
(2018) Aggregation kinetics of the Aβ1–40 peptide monitored by NMR. Chemical
Communications, 54(55), 7601-7604.
[38] Gunn, A. P., Masters, C. L., & Cherny, R. A. (2010) Pyroglutamate-Aβ: role in the natural
history of Alzheimer's disease. Int J Biochem Cell Biol, 42(12), 1915-1918.
[39] Supnet, C., & Bezprozvanny, I. (2010) The dysregulation of intracellular calcium in
Alzheimer disease. Cell Calcium, 47(2), 183-189.

85
[40] St George-Hyslop, P. H. (2000) Molecular genetics of Alzheimer’s disease. Biological
Psychiatry, 47(3), 183-199.
[41] Yu, X., & Zheng, J. (2012) Cholesterol promotes the interaction of Alzheimer β-amyloid
monomer with lipid bilayer. Journal of Molecular Biology, 421(4-5), 561-571.
[42] Di Scala, C., Yahi, N., Lelievre, C., Garmy, N., Chahinian, H., & Fantini, J. (2012)
Biochemical identification of a linear cholesterol-binding domain within Alzheimer’s β amyloid
peptide. ACS Chemical Neuroscience, 4(3), 509-517.
[43] Jawhar, S., Wirths, O., & Bayer, T. A. (2011) Pyroglutamate amyloid-β (Aβ): a hatchet man
in Alzheimer disease. Journal of Biological Chemistry, 286(45), 38825-38832.
[44] Nussbaum, J. M., Schilling, S., Cynis, H., Silva, A., Swanson, E., Wangsanut, T., Tayler,
K., Wiltgen, B., Hatami, A., Reonicke, R. et al. (2012) Prion-like behaviour and tau-dependent
cytotoxicity of pyroglutamylated amyloid-β. Nature, 485(7400), 651–655.
[45] Mandler, M., Walker, L., Santic, R., Hanson, P., Upadhaya, A. R., Colloby, S. J., Morris,
C.M., Thal, D.R., Thomas, A.J., Schneeberger, A. et al. (2014) Pyroglutamylated amyloid-β is
associated with hyperphosphorylated tau and severity of Alzheimer’s disease. Acta
neuropathologica, 128(1), 67-79.
[46] Gunn, A. P., Wong, B. X., Johanssen, T., Griffith, J. C., Masters, C. L., Bush, A. I.,
Barnham, K.J., Duce, J.A. & Cherny, R. A. (2016) Amyloid-β peptide Aβ3pE-42 induces lipid
peroxidation, membrane permeabilization, and calcium influx in neurons. Journal of Biological
Chemistry, 291(12), 6134-6145.
[47] He, W., & Barrow, C. J. (1999) The Aβ 3-pyroglutamyl and 11-pyroglutamyl peptides
found in senile plaque have greater β-sheet forming and aggregation propensities in vitro than
full-length Aβ. Biochemistry, 38(33), 10871-10877.

86
[48] Schilling, S., Lauber, T., Schaupp, M., Manhart, S., Scheel, E., Böhm, G., & Demuth, H. U.
(2006) On the seeding and oligomerization of pGlu-amyloid peptides (in vitro). Biochemistry,
45(41), 12393-12399.
[49] Schilling, S., Zeitschel, U., Hoffmann, T., Heiser, U., Francke, M., Kehlen, A., Holzer, M.,
Hutter-Paier, B. Proksech, M. et al. (2008) Glutaminyl cyclase inhibition attenuates
pyroglutamate Aβ and Alzheimer's disease–like pathology. Nature Medicine, 14(10), 1106–
1111.
[50] Dammers, C., Gremer, L., Reiß, K., Klein, A. N., Neudecker, P., Hartmann, R., Sun, N.,
Demuth, H.U., Schwarten, M. et al. (2015) Structural analysis and aggregation propensity of
pyroglutamate Aβ (3-40) in aqueous trifluoroethanol. PloS One, 10(11), e0143647.
[51] Saido TC, Iwatsubo T, Mann DM, Shimada H, Ihara Y, Kawashima S. Dominant and
differential deposition of distinct β-amyloid peptide species, AβN3(pE), in senile plaques.
Neuron. 1995;14(2):457-466.
[52] Harigaya Y, Saido TC, Eckman CB, Prada CM, Shoji M, Younkin SG. Amyloid β protein
starting pyroglutamate at position 3 is a major component of the amyloid deposits in the
Alzheimer's disease brain. Biochem Biophys Res Commun. 2000;276(2):422-427.
[53] Wulff, M., Baumann, M., Thümmler, A., Yadav, J. K., Heinrich, L., Knüpfer, U., Schlenzig,
D. Schierhorn, A., rahfeld, J.U., Horn U et al (2016) Enhanced Fibril Fragmentation of N‐
Terminally Truncated and Pyroglutamyl‐Modified Aβ Peptides. Angewandte Chemie
International Edition, 55(16), 5081-5084.
[54] Tekirian, T. L., Yang, A. Y., Glabe, C., & Geddes, J. W. (1999) Toxicity of
Pyroglutaminated Amyloid β‐Peptides 3 (pE)‐40 and‐42 Is Similar to That of Aβ1‐40 and‐
42. Journal of Neurochemistry, 73(4), 1584-1589.

87
[55] Sanders, H. M., Lust, R., & Teller, J. K. (2009) Amyloid-beta peptide Aβp3-42 affects early
aggregation of full-length Aβ1-42. Peptides, 30(5), 849-854.
[56] Wirths, O., Erck, C., Martens, H., Harmeier, A., Geumann, C., Jawhar, S., Kumar, S.,
Multhaup, G., Walter, J., Ingelsson, M.et al (2010) Identification of low molecular weight
pyroglutamate Aβ oligomers in Alzheimer disease. A novel tool for therapy and diagnosis.
Journal of Biological Chemistry, 285(53), 41517-41524.
[57] Bouter, Y., Dietrich, K., Wittnam, J. L., Rezaei-Ghaleh, N., Pillot, T., Papot-Couturier, S.,
Lefebvre, T.,Sprenger, F., Wirths, O., Zweckstetter, M. et al. (2013) N-truncated amyloid β (Aβ)
4-42 forms stable aggregates and induces acute and long-lasting behavioral deficits. Acta
Neuropathologica, 126(2), 189-205.
[58] Schlenzig D, Rönicke R, Cynis H, et al. N-terminal pyroglutamate formation of Aβ38 and
Aβ40 enforces oligomer formation and potency to disrupt hippocampal long-term potentiation. J
Neurochem. 2012; 121(5):774-784.
[59] Russo C, Violani E, Salis S, et al. Pyroglutamate-modified amyloid β-peptides AβN3(pE)—
strongly affect cultured neuron and astrocyte survival. J Neurochem. 2002;82(6):1480-1489.
[60] Tekirian TL, Yang AY, Glabe C, Geddes JW. Toxicity of pyroglutaminated amyloid β-
peptides 3(pE)-40 and -42 is similar to that of Aβ1-40 and -42. J Neurochem. 1999;73(4):1584-
1589.
[61] Scheidt HA, Adler J, Zeitschel U, et al. Pyroglutamate-modified amyloid β (11-40) fibrils
are more toxic than wildtype fibrils but structurally very similar. Chemistry. 2017;23(62):15834-
15838.
[62] Sanders HM, Lust R, Teller JK. Amyloid-β peptide Aβp3-42 affects early aggregation of
full-length Aβ1-42. Peptides. 2009;30(5): 849-854.

88
[63] Sigurdsson EM, Permanne B, Soto C, Wisniewski T, Frangione B. In vivo reversal of
amyloid-beta lesions in rat brain. J Neuropathol Exp Neurol. 59, 11–17 (2000).
[64] Gordon DJ, Sciarretta KL, Meredith SC. Inhibition of beta-amyloid(40) fibrillogenesis and
disassembly of beta-amyloid(40) fibrils by short beta-amyloid congeners containing N-methyl
amino acids at alternate residues. Biochemistry. 2001 Jul 27;40(28):8237-45.
[65] Gordon DJ, Meredith SC. Probing the role of backbone hydrogen bonding in beta-amyloid
fibrils with inhibitor peptides containing ester bonds at alternate positions. Biochemistry. 2003
Jan 21;42(2):475-85.
[66] Sciarretta KL, Gordon DJ, Meredith SC. Peptide-based inhibitors of amyloid assembly.
Methods Enzymol. 2006;413:273-312.
[67] Sepulveda FJ, Parodi J, Peoples RW, Opazo C, Aguayo LG. Synaptotoxicity of Alzheimer
beta amyloid can be explained by its membrane perforating property. PLoS One 5, e11820
(2010).
[68] Giordano C, Sansone A, Masi A, Masci A, Mosca L, Chiaraluce R, Pasquo A, Consalvi V.
Inhibition of Amyloid Peptide Fragment Aβ25–35 Fibrillogenesis and Toxicity by N-Terminal β-
Amino Acid-Containing Esapeptides: Is Taurine Moiety Essential for In Vivo Effects? Chem
Biol Drug Des. 2012 Jan;79(1):30-37.
[69] Cheng PN, Liu C, Zhao M, Eisenberg D, Nowick JS. Amyloid β-Sheet Mimics that
Antagonize Amyloid Aggregation and Reduce Amyloid Toxicity. Nat Chem. 2012
Nov;4(11):927-33.
[70] Peters C, Fernandez-Perez EJ, Burgos CF, Espinoza MP, Castillo C, Urrutia JC, Streltsov
VA, Opazo C, Aguayo LG. Inhibition of amyloid beta-induced synaptotoxicity by a pentapeptide
89
derived from the glycine zipper region of the neurotoxic peptide. Neurobiol Aging. 34, 2805–
2814 (2013).
[71] Bharadwaj P, Head R, Martins R., Raussens V, Sarroukh R, Jegasothy H, Waddington L,
Bennett L, Modulation of amyloid-beta 1-42 structure and toxicity by proline-rich whey
peptides. Food Funct. 4, 92–103 (2013).
[72] Barucker C, Bittner HJ, Chang PK, Cameron S, Hancock MA, Liebsch F, Hossain S,
Harmeier A, Shaw H, Charron FM, Gensler M, Dembny P, Zhuang W, Schmitz D, Rabe JP, Rao
Y, Lurz R, Hildebrand PW, McKinney RA, Multhaup G. Aβ42-oligomer Interacting Peptide
(AIP) neutralizes toxic amyloid-β42 species and protects synaptic structure and function. Sci
Rep. 2015 Oct 29;5:15410.
[73] Rajasekhar K, Madhu C, Govindaraju T. A Natural tripeptide-based inhibitor of
multifaceted amyloid β toxicity, ACS Chem. Neurosci. 7, 1300–1310 (2016).
[74] Shea D, Hsu CC, Bi TM, Paranjapye N, Childers MC, Cochran J, Tomberlin CP, Wang L,
Paris D, Zonderman J, Varani G, Link CD, Mullan M, Daggett V. α-Sheet secondary structure in
amyloid β-peptide drives aggregation and toxicity in Alzheimer's disease. Proc Natl Acad Sci
USA 116, 8895–8900 (2019).
[75] Ghosh A, Pradhan N, Bera S, Datta A, Krishnamoorthy J, Jana NR, Bhunia A. Inhibition
and degradation of amyloid beta (Aβ40) fibrillation by designed small peptide: A combined
spectroscopy, microscopy, and cell toxicity study. ACS Chem Neurosci. 8, 718–722 (2017).
[76] Aoraha E, Candreva J, Kim JR. Engineering of a peptide probe for β-amyloid aggregates.
Mol Biosyst. 11, 2281–2289 (2015).

90
[77] Röhrig UF, Laio A, Tantalo N, Parrinello M, Petronzio R. Stability and structure of
oligomers of the Alzheimer peptide Abeta16-22: from the dimer to the 32-mer. Biophys J. 91,
3217–3229 (2006).
[78] Petty SA, Decatur SM. Experimental Evidence for the Reorganization of b-Strands within
Aggregates of the A b(16-22) Peptide. J Am Chem Soc. 2005, 127, 13488-13489.
[79] Fradinger EA, Monien BH, Urbanc B, Lomakin A, Tan M, Li H, Spring SM, Condron MM,
Cruz L, Xie CW, Benedek GB, Bitan G. C-terminal peptides coassemble into Abeta42 oligomers
and protect neurons against Abeta42-induced neurotoxicity. Proc Natl Acad Sci U S A. 105,
14175–14180 (2008).
[80] Li H, Du Z, Lopes DH, Fradinger EA, Wang C, Bitan G. C-terminal tetrapeptides inhibit
Aβ42-induced neurotoxicity primarily through specific interaction at the N-terminus of Aβ42. J
Med Chem. 54, 8451–8460 (2011).
[81] Urbanc B, Betnel M, Cruz L, Li H, Fradinger EA, Monien BH, Bitan G. Structural basis for
Aβ1–42 toxicity inhibition by Aβ C-terminal fragments: discrete molecular dynamics study. J
Mol Biol. 410, 316–328 (2011).
[82] Gessel MM, Wu C, Li H, Bitan G, Shea JE, Bowers MT. Aβ(39-42) modulates Aβ
oligomerization but not fibril formation. Biochemistry. 51, 108–117 (2012).
[83] Li H, Monien BH, Fradinger EA, Urbanc B, Bitan G. Biophysical characterization of
Abeta42 C-terminal fragments: inhibitors of Abeta42 neurotoxicity. Biochemistry. 49,
1259−1267 (2010).
[84] Vandersteen A, Masman MF, De Baets G, Jonckheere W, van der Werf K, Marrink SJ,
Rozenski J, Benilova I, De Strooper B, Subramaniam V. et al. Molecular plasticity regulates

91
oligomerization and cytotoxicity of the multipeptide-length amyloid-β peptide pool. J Biol.
Chem. 287, 36732–36743 (2012).
[85] Tatulian, S. A. (2013) Structural characterization of membrane proteins and peptides by
FTIR and ATR-FTIR spectroscopy. In: Lipid-Protein Interactions (J.H. Kleinschmidt, ed.) (pp.
177-218). Humana Press, Totowa, NJ.
[86] Tatulian, S. A. (2010) Structural analysis of proteins by isotope-edited FTIR spectroscopy.
Spectroscopy, 24(1-2), 37-43.
[87] Atkins, P. & de Paula, J (2005) Elements of Physical Chemistry (4th ed.). Oxford University
Press. ISBN 978-0-7167-7329-0.
[88] Solomon, E.I. & Lever, A. B. P. (2006) Inorganic Electronic Structure and Spectroscopy.
Wiley.
[89] Park, D. (2012) Introduction to the Quantum Theory. Courier Corporation.
[90] Van Holde, K. E., Johnson, W. C., & Ho, P. S. (1998) Principles of Physical Biochemistry,
Chapter-10(10.2.2). Prentice Hall, ISBN: 0-13-720459-0.
[91] Woody, R. W. (1996). Theory of circular dichroism of proteins. In Circular dichroism and
the conformational analysis of biomolecules (pp. 25-67). Springer, Boston, MA. ISBN 978-1-
4419-3249-5.
[92] Lakowicz, J. R. (2013) Principles of Fluorescence Spectroscopy. Springer Science &
Business Media. (3rdEd.).
[93] Makhatadze GI, Clore GM, Gronenborn AM. Solvent isotope effect and protein stability.
Nat Struct Biol. 1995;2(10):852-855.

92
[94] Petkova AT, Leapman RD, Guo Z, Yau WM, Mattson MP, Tycko R. Self-propagating,
molecular-level polymorphism in Alzheimer's β-amyloid fibrils. Science. 2005;307(5707):262-
265.
[95] Jeong JS, Ansaloni A, Mezzenga R, Lashuel HA, Dietler G. Novel mechanistic insight into
the molecular basis of amyloidpolymorphism and secondary nucleation during amyloid
formation.J Mol Biol. 2013;425(10):1765-1781.
[96] Xue C, Tran J, Wang H, Park G, Hsu F, Guo Z. Aβ42 fibril formation from predominantly
oligomeric samples suggests a link between oligomer heterogeneity and fibril polymorphism. R
Soc Open Sci.2019;6(7):190179.
[97] Walsh DM, Hartley DM, Condron MM, Selkoe DJ, Teplow DB. In vitro studies of amyloid
β-protein fibril assembly and toxicity provide clues to the aetiology of Flemish variant
(Ala692!Gly) Alzheimer's disease. Biochem J. 2001;355(3):869-877.
[98] Stine WB Jr, Dahlgren KN, Krafft GA, LaDu MJ. In vitro characterization of conditions for
amyloid-β peptide oligomerization and fibrillogenesis. J Biol Chem. 2003;278(13):11612-11622.
[99] Venyaminov SY, Yang JT. Determination of protein secondary structure. In: Fasman DG,
ed. Circular Dichroism and the Conformational Analysis of Biomolecules. New York, London:
Plenum Press; 1996ch.3:69-107.
[100] Sreerama N, Woody RW. Circular dichroism of peptides and proteins. In: Berova N,
Nakanishi K, Woody RW, eds. Circular Dichroism: Principles and Applications. John Wiley &
Sons; 2000ch. 21:601-620.
[101] Kelly SM, Price NC. The use of circular dichroism in the investigation of protein structure
and function. Curr Protein Pept Sci. 2000;1(4):349-384.

93
[102] Sreerama N, Venyaminov SY, Woody RW. Estimation of the number of α-helical and β-
strand segments in proteins using circular dichroism spectroscopy. Protein Sci. 1999;8(2):370-
380.
[103] Nadezhdin KD, Bocharova OV, Bocharov EV, Arseniev AS. Structural and dynamic study
of the transmembrane domain of the amyloid precursor protein. Acta Naturae. 2011;3(1):69-76.
[104] Barrett PJ, Song Y, Van Horn WD, et al. The amyloid precursor protein has a flexible
transmembrane domain and binds cholesterol. Science. 2012;336(6085):1168-1171.
[105] Goormaghtigh E, Cabiaux V, Ruysschaert JM. Determination of soluble and membrane
protein structure by Fourier transform infrared spectroscopy. III. Secondary structures. Subcell
Biochem. 1994;23: 405-450.
[106] Jackson M, Mantsch HH. The use and misuse of FTIR spectroscopy in the determination
of protein structure. Crit Rev Biochem Mol Biol. 1995;30(2):95-120.
[107] Tatulian SA. FTIR analysis of proteins and protein-membrane interactions. Methods Mol
Biol. 2003;2019:281-325.
[108] Dong A, Matsuura J, Manning MC, Carpenter JF. Intermolecular β-sheet results from
trifluoroethanol-induced nonnative α-helical structure in β-sheet predominant proteins: infrared
and circular dichroism spectroscopic study. Arch Biochem Biophys. 1998;355(2): 275-281.
[109] Brunken S, Muller HS, Endres C, et al. High resolution rotational spectroscopy on D2O up
to 2.7 THz in its ground and first excited vibrational bending states. Phys Chem. 2007;9:2103-
2112.
[110] Cazzoli G, Dore L, Puzzarini C, Gauss J. The hyperfine structure in the rotational spectra
of D2O: lamb-dip measurements and quantum-chemical calculations. Mol Phys.
2010;108(18):2335-2342.

94
[111] Moran A, Mukamel S. The origin of vibrational mode couplings in various secondary
structural motifs of polypeptides. Proc Natl Acad Sci U S A. 2004;101(2):506-510.
[112] Myshakina NS, Asher SA. Peptide bond vibrational coupling. J Phys Chem B.
2007;111(16):4271-4279.
[113] Goldblatt G, Cilenti L, Matos JO, et al. Unmodified and pyroglutamylated amyloid β
peptides form hypertoxic hetero-oligomers of unique secondary structure. FEBS j.
2017;284(9):1355-1369.
[114] Torres J, Sepulcre F, Padrós E. Conformational changes in bacteriorhodopsin associated
with protein-protein interactions: a functional alpha I-alpha II helix switch? Biochemistry.
1995;34(50): 16320-16326.
[115] Wang J, El-Sayed MA. The effect of protein conformation change from αII to αI on the
bacteriorhodopsin photocycle. Biophys J. 2000; 78(4):2031-2036.
[116] Okada Y, Okubo K, Ikeda K, et al. Toxic amyloid tape: a novel mixed antiparallel/parallel
β-sheet structure formed by amyloid β-protein on GM1 clusters. ACS Chem Nerosci.
2019;10(1):563-572.
[117] Vivekanandan S, Brender JR, Lee SY, Ramamoorthy AA. Partially folded structure of
amyloid-beta(1-40) in an aqueous environment Biochem Biophys Res Commun.
2011;411(2):312-316.
[118 ] Xiao Y, Ma B, McElheny D, Parthasarathy S, Long F, Hoshi M, Nussinov R, Ishii Y.
Aβ(1-42) fibril structure illuminates self-recognition and replication of amyloid in Alzheimer's
disease. Nat Struct Mol Biol. 22, 499-505 (2015).

95
[119] Wälti MA, Ravotti F, Arai H, Glabe CG, Wall JS, Böckmann A, Güntert P, Meier BH,
Riek R. Atomic-resolution structure of a disease-relevant Aβ(1-42) amyloid fibril. Proc Natl
Acad Sci USA. 113, E4976−E4984 (2016).
[120] Colvin MT, Silvers R, Ni QZ, Can TV, Sergeyev I, Rosay M, Donovan KJ, Michael B,
Wall J, Linse S, Griffin RG. Atomic resolution structure of monomorphic Aβ42 amyloid fibrils.
J Am Chem Soc. 138, 9663−9674 (2016).
[121] Perczel A., Hollósi M. Turns. In Circular Dichroism and the Conformational Analysis of
Biomolecules; Fasman, G. D., Ed.; Plemun Press: New York, London, 285–380 (1996).
[122] Hamley IW, Nutt DR, Brown GD, Miravet JF, Escuder B, Rodríguez-Llansola F.
Influence of the solvent on the self-assembly of a modified amyloid beta peptide fragment. II.
NMR and computer simulation investigation. J Phys Chem B. 2010 Jan 21;114(2):940-51.
[123] Wang J, Tao K, Zhou P, Pambou E, Li Z, Xu H, Rogers S, King S, Lu JR. Tuning self-
assembled morphology of the Aβ(16-22) peptide by substitution of phenylalanine residues.
Colloids Surf B Biointerfaces. 2016 Nov 1;147:116-123.
[124] Sawaya MR, Sambashivan S, Nelson R, Ivanova MI, Sievers SA, Apostol MI, Thompson
MJ, Balbirnie M, Wiltzius JJ, McFarlane HT, Madsen AØ, Riekel C, Eisenberg D. Atomic
structures of amyloid cross-beta spines reveal varied steric zippers. Nature. 2007 May
24;447(7143):453-7.

96
[125] Colletier JP, Laganowsky A, Landau M, Zhao M, Soriaga AB, Goldschmidt L, Flot D,
Cascio D, Sawaya MR, Eisenberg D. Molecular basis for amyloid-beta polymorphism. Proc Natl
Acad Sci U S A. 2011 Oct 11;108(41):16938-43.
[126] Vugmeyster L, Au DF, Ostrovsky D, Kierl B, Fu R, Hu ZW, Qiang W. Effect of Post-
Translational Modifications and Mutations on Amyloid-β Fibrils Dynamics at N Terminus.
Biophys J. 2019 Oct 15;117(8):1524-1535.
[127] Söldner CA, Sticht H, Horn AHC. Role of the N-terminus for the stability of an amyloid-β
fibril with three-fold symmetry. PLoS One. 2017 Oct 12;12(10):e0186347.
[128] Petty SA, Decatur SM. Experimental Evidence for the Reorganization of b-Strands within
Aggregates of the A b(16-22) Peptide. J Am Chem Soc. 2005, 127, 13488-13489.
[129] Giordano C, Sansone A, Masi A, Masci A, Mosca L, Chiaraluce R, Pasquo A, Consalvi V.
Inhibition of Amyloid Peptide Fragment Aβ25–35 Fibrillogenesis and Toxicity by N-Terminal β-
Amino Acid-Containing Esapeptides: Is Taurine Moiety Essential for In Vivo Effects? Chem
Biol Drug Des. 2012 Jan;79(1):30-37.
[130] Peters C, Fernandez-Perez EJ, Burgos CF, Espinoza MP, Castillo C, Urrutia JC, Streltsov
VA, Opazo C, Aguayo LG. Inhibition of amyloid beta-induced synaptotoxicity by a pentapeptide
derived from the glycine zipper region of the neurotoxic peptide. Neurobiol Aging. 34, 2805–
2814 (2013).

97
[131] Wang W, Hou TT, Jia LF, Wu QQ, Quan MN, Jia JP. Toxic amyloid-β oligomers induced
self-replication in astrocytes triggering neuronal injury. EBioMedicine. 42, 174–187 (2019).
[132] Fradinger EA, Monien BH, Urbanc B, Lomakin A, Tan M, Li H, Spring SM, Condron
MM, Cruz L, Xie CW, Benedek GB, Bitan G. C-terminal peptides coassemble into Abeta42
oligomers and protect neurons against Abeta42-induced neurotoxicity. Proc Natl Acad Sci U S A.
105, 14175–14180 (2008).
[133] Gordon DJ, Meredith SC. Probing the role of backbone hydrogen bonding in beta-amyloid
fibrils with inhibitor peptides containing ester bonds at alternate positions. Biochemistry. 2003
Jan 21;42(2):475-85.
[134] An Y, Bloom JW, Wheeler SE. Quantifying the π-Stacking Interactions in Nitroarene
Binding Sites of Proteins. J Phys Chem B. 2015 Nov 12;119(45):14441-50.
[135] Du M, Zhou K, Yu R, Zhai Y, Chen G, Wang Q. Noncovalent Self-Assembly of Protein
Crystals with Tunable Structures. Nano Lett. 2021 Feb 24;21(4):1749-1757.
[136] Hansen AL, Kay LE. Measurement of histidine pKa values and tautomer populations in
invisible protein states. PNAS April 29, 2014 111 (17) E1705-E1712.
[137] Hilbich, C.; Kisters-Woike, B.; Reed, J.; Masters, C. L.; Beyreuther, K. Human and rodent
sequence analogs of Alzheimer's amyloid beta A4 share similar properties and can be solubilized
in buffers of pH 7.4. Eur. J. Biochem. 1991, 201, 61-69.

98
[138] Nguyen K, Rabenstein DL. Interaction of the Heparin-Binding Consensus Sequence of β-
Amyloid Peptides with Heparin and Heparin-Derived Oligosaccharides. J Phys Chem B 2016
Mar 10;120(9):2187-97.
[139] Balbach JJ, Ishii Y, Antzutkin ON, Leapman RD, Rizzo NW, Dyda F, Reed J, Tycko R.
Amyloid fibril formation by A beta 16-22, a seven-residue fragment of the Alzheimr's beta-
amyloid peptide, and structural characterization by solid state NMR. Biochemistry. 2000 Nov
14;39(45):13748-59.
[140] Santini S, Wei G, Mousseau N, Derreumaux P. Pathway complexity of Alzheimer's beta-
amyloid Abeta16-22 peptide assembly. Structure. 2004 Jul;12(7):1245-55.
[141] Tao K, Wang J, Zhou P, Wang C, Xu H, Zhao X, Lu JR. Self-assembly of short aβ(16-22)
peptides: effect of terminal capping and the role of electrostatic interaction. Langmuir. 2011 Mar
15;27(6):2723-30.
[142] Klimov DK, Thirumalai D. Dissecting the assembly of Abeta16-22 amyloid peptides into
antiparallel beta sheets. Structure. 2003 Mar;11(3):295-307.
[143] Lazo ND, Grant MA, Condron MC, Rigby AC, Teplow DB. On the nucleation of amyloid
beta-protein monomer folding. Protein Sci. 2005 Jun;14(6):1581-96.
[144] Roychaudhuri R, Yang M, Condron MM, Teplow DB. Structural dynamics of the amyloid
β-protein monomer folding nucleus. Biochemistry. 2012 May 15;51(19):3957-9.
[145] Hoyer W, Grönwall C, Jonsson A, Ståhl S, Härd T. Stabilization of a beta-hairpin in
monomeric Alzheimer's amyloid-beta peptide inhibits amyloid formation. Proc Natl Acad Sci U
S A. 2008 Apr 1;105(13):5099-104.
[146] Terzi E, Hölzemann G, Seelig J. Reversible random coil-beta-sheet transition of the
Alzheimer beta-amyloid fragment (25-35). Biochemistry. 1994 Feb 15;33(6):1345-50.

99
[147] Kandel N., Zheng T., Huo Q., and Tatulian S.A. (2017) Membrane Binding and Pore
Formation by a Cytotoxic Fragment of Amyloid β Peptide. J. Phys. Chem. B. 121, 10293-10305.
[148] Kohno, T.; Kobayashi, K.; Maeda, T.; Sato, K.; Takashima, A. Three-dimensional
structures of the amyloid b-peptide (25-35) in membrane-mimicking environment. Biochemistry
1996, 35, 16094-16104.
[149] D'Ursi AM, Armenante MR, Guerrini R, Salvadori S, Sorrentino G, Picone D. Solution
structure of amyloid beta-peptide (25-35) in different media. J Med Chem. 2004 Aug
12;47(17):4231-8.
[150] Do TD, LaPointe NE, Nelson R, Krotee P, Hayden EY, Ulrich B, Quan S, Feinstein SC,
Teplow DB, Eisenberg D, Shea JE, Bowers MT. Amyloid β-Protein C-Terminal Fragments:
Formation of Cylindrins and β-Barrels. J Am Chem Soc. 2016 Jan 20;138(2):549-57.
[151] E. M. Phizicky and S. Fields, “Protein-protein interactions: methods for detection and
analysis,” Microbiological Reviews, vol. 59, no. 1, pp. 94–123, 1995.
[152] A. K. Dunker, M. S. Cortese, P. Romero, L. M. Iakoucheva, and V. N. Uversky, “Flexible
nets: the roles of intrinsic disorder in protein interaction networks,” FEBS Journal, vol. 272, no.
20, pp. 5129–5148, 2005.
[153] M. Sarmady, W. Dampier, and A. Tozeren, “HIV protein sequence hotspots for crosstalk
with host hub proteins,” PLoS ONE, vol. 6, no. 8, Article ID e23293, 2011.