Embed Size (px)
Citation preview
Electronic Supporting Information
Bioorganometallic Ferrocene-Tripeptide Nanoemulsions
Xuejiao Yang,‡a Yuefei Wang,‡a,c Wei Qi,*a,b,c Rongxin Su,a,b,c Zhimin Hea
aState Key Laboratory of Chemical Engineering, School of Chemical Engineering and
Technology, Tianjin University, Tianjin 300072, P. R. China.
bCollaborative Innovation Center of Chemical Science and Engineering (Tianjin), Tianjin
300072, P. R. China.
cTianjin Key Laboratory of Membrane Science and Desalination Technology, Tianjin 300072, P.
R. China.
‡These authors contributed equally.
1
Electronic Supplementary Material (ESI) for Nanoscale.This journal is © The Royal Society of Chemistry 2017
Supplementary Figures
Fig. S1 Static water contact angle in air of the obtained a) Fc-FFH, b) Fc-FFD, c) Fc-FFF, and d) Fc-FFS
nanoemulsions prepared at a 7:3 aqueous/organic volume ratio, indicating the four kinds of nanoemulsions
were oil-in-water.
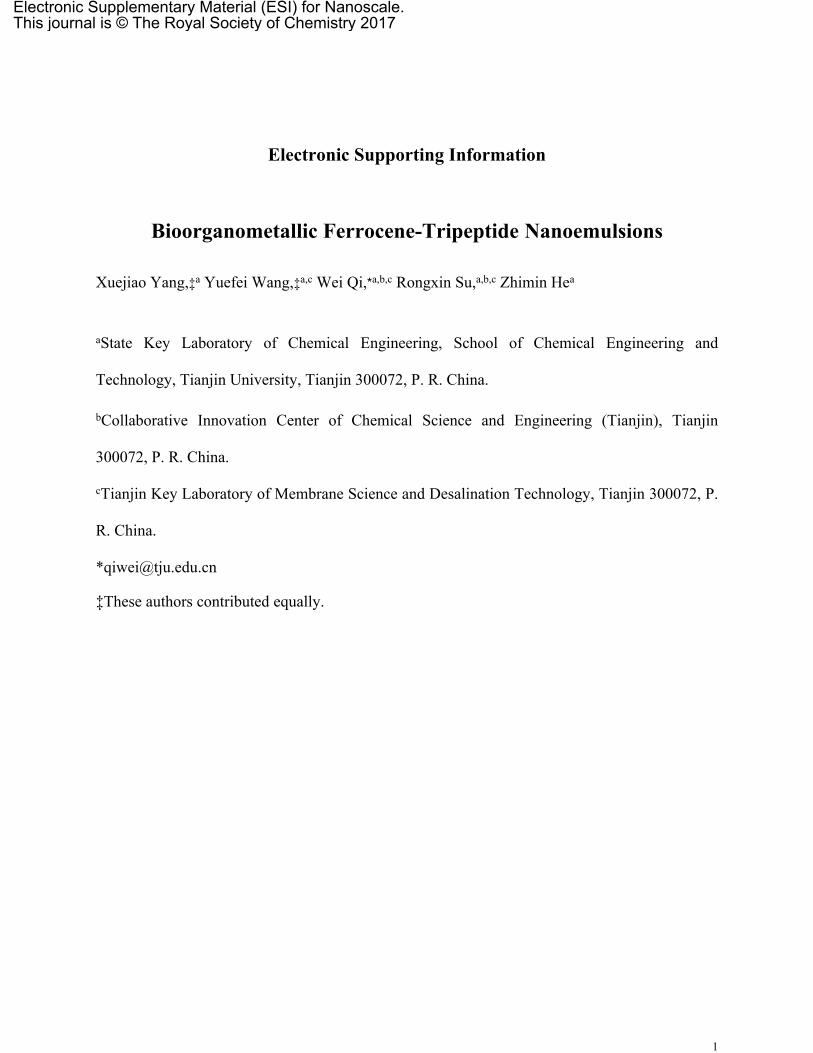
Fig. S2 Confocal laser scanning microscopy (CLSM) images of the a) Fc-FFH, b) Fc-FFD, c) Fc-FFF, and d)
Fc-FFS nanoemulsions prepared at a 7:3 aqueous/organic volume ratio under bright field.
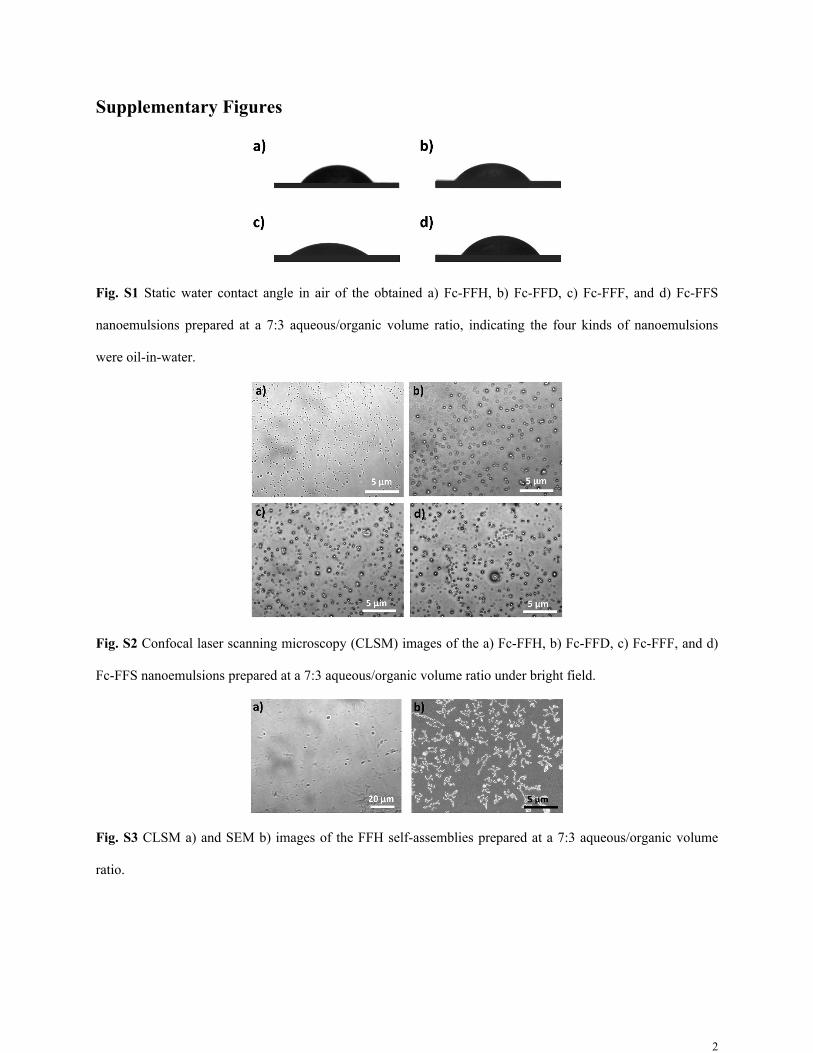
Fig. S3 CLSM a) and SEM b) images of the FFH self-assemblies prepared at a 7:3 aqueous/organic volume
ratio.
2

Fig. S4 The top optical photographs showed tripeptide nanoemulsions freshly prepared at 7:3 aqueous/organic
volume ratio, and the bottom showed the four samples incubated for 4 months at room temperature (T=25 °C).
From left to right, the samples are Fc-FFH, Fc-FFD, Fc-FFF, and Fc-FFS nanoemulsions, respectively.
Fig. S5 High-magnification SEM images of the a) Fc-FFD, b) Fc-FFF, and c) Fc-FFS nanoemulsions prepared
at a 7:3 aqueous/organic volume ratio.
Fig. S6 High-magnification TEM images of the a) Fc-FFD, b) Fc-FFF, and c) Fc-FFS nanoemulsions prepared
at a 7:3 aqueous/organic volume ratio.
3

Fig. S7 Size distribution of the Fc-FFD, Fc-FFF, and Fc-FFS nanoemulsions prepared at a 7:3 aqueous/organic
volume ratio derived from the DLS analysis.
Fig. S8 a) The change in the average diameter of Fc-FFH nanoemulsions as a function of the aqueous/organic
volume ratio. b) Histogram of the normalized size distribution of the Fc-FFH nanoemulsions prepared in a 7:3
aqueous/organic volume ratio, derived from the TEM image. The red curve is the size distribution of Fc-FFH
nanoemulsions prepared in a 7:3 aqueous/organic volume ratio, derived from DLS.
4

Fig. S9 The change in the average diameter of a) Fc-FFD, b) Fc-FFF, and c) Fc-FFS nanoemulsions as a
function of the aqueous/organic volume ratio. As the aqueous/organic volume ratio altered from 1:9 to 9:1, the
average diameter changed from 5391 nm, 928 nm, 375 nm, 158 nm, to 127 nm for Fc-FFD nanoemulsions,
from 5555 nm, 916 nm, 396 nm, 181 nm, to 158 nm for Fc-FFF nanoemulsions, and changed from 5407 nm,
795 nm, 357 nm, 217 nm, to 180 nm for Fc-FFS nanoemulsions, respectively. The insets of the images are the
photographs which show the oil-in-water nanoemulsions (yellow milky layer) prepared by homogenizing ethyl
acetate with 1 mg mL-1 Fc-FFD, Fc-FFF, and Fc-FFS phosphate buffer solution (50 mM, pH 7.20). From left
to right, the volume ratio of phosphate buffer to ethyl acetate was altered from 1:9, 3:7, 5:5, 7:3, to 9:1, and the
total volume was 1 mL.
5

Fig. S10 High-magnification TEM images of a) Fc-FFH, b) Fc-FFD, c) Fc-FFF, and d) Fc-FFS nanoemulsions
prepared at a 7:3 aqueous/organic volume ratio incubated for 4 months at room temperature.
Fig. S11 Size distribution of the Fc-FFH, Fc-FFD, Fc-FFF, and Fc-FFS nanoemulsions prepared at a 7:3
aqueous/organic volume ratio incubated for 4 months derived from the DLS analysis. The average diameter of
Fc-FFH, Fc-FFD, Fc-FFF, and Fc-FFS nanoemulsions is 556 nm, 480 nm, 532 nm, and 498 nm, respectively.
6

Fig. S12 High-magnification SEM images of Fc-FFH hydrogels and nanoemulsions prepared at a 7:3
aqueous/organic volume ratio incubated at a) 10 °C, b) 40 °C, and c) 60 °C for 3 hours.
Fig. S13 Optical photographs of Fc-FFD, Fc-FFF, and Fc-FFS nanoemulsions prepared at a 7: 3
aqueous/organic volume ratio incubated at increasing temperatures for 3 hours. Even at 70 °C, the three kinds
of nanoemulsions still maintain stable, indicating that the nanoemulsions have a strong tolerance to high
temperature.
7

Fig. S14 High-magnification TEM images of a) Fc-FFD, b) Fc-FFF, and c) Fc-FFS nanoemulsions prepared at
a 7:3 aqueous/organic volume ratio incubated at 70 °C for 3 hours.
Fig. S15 The change in the average diameter of Fc-FFD, Fc-FFF, and Fc-FFS nanoemulsions prepared at a 7:3
aqueous/organic volume ratio as the function of temperature.
Fig. S16 2-D X-ray diffraction pattern of Fc-FFH nanoemulsions prepared at a 7:3 aqueous/organic volume
ratio at room temperature.
8

Fig. S17 Standard curve for the relation between monomer concentration and peak ratio (D2O/Fc) derived
from Nuclear Magnetic Resonance (NMR) spectroscopy analysis.
Fig. S18 High-magnification SEM image of oxidized Fc-FFH nanoemulsions prepared at a 7:3
aqueous/organic volume ratio using electrochemical method.
Fig. S19 Standard curve for the relation between the absorbance at 400 nm in UV-visible spectroscopy and the
concentration of PNP which dissolved in 50 mM, pH 7.20 phosphate buffer.
9

Supplementary Tables
Table S1 Monomer concentration of nanoemulsions and hydrogels calculated according to Fig. S17.
Peak Ratio (D2O/Fc) Monomer Concentration (mM)
Nanoemulsions 242.45 0.71
Hydrogels 258.30 0.33
10