Embed Size (px)
Citation preview

Journal of Visualized Experiments www.jove.com
Copyright © 2013 Journal of Visualized Experiments February 2013 | 72 | e50225 | Page 1 of 9
Video Article
Rapid Colorimetric Assays to Qualitatively Distinguish RNA and DNA inBiomolecular SamplesJennifer Patterson1, Cameron Mura1
1Department of Chemistry, University of Virginia
Correspondence to: Cameron Mura at [email protected]
URL: http://www.jove.com/video/50225DOI: doi:10.3791/50225
Keywords: Chemistry, Issue 72, Biochemistry, Chemical Biology, Genetics, Molecular Biology, Cellular Biology, Nucleic Acids, DNA, RNA, Proteins,analytical chemistry, Benedict's assay, Bial's orcinol assay, Dische's diphenylamine assay, colorimetric assay, reducing sugar, purification,transcription, reaction, assay
Date Published: 2/4/2013
Citation: Patterson, J., Mura, C. Rapid Colorimetric Assays to Qualitatively Distinguish RNA and DNA in Biomolecular Samples. J. Vis. Exp. (72),e50225, doi:10.3791/50225 (2013).
Abstract
Biochemical experimentation generally requires accurate knowledge, at an early stage, of the nucleic acid, protein, and other biomolecularcomponents in potentially heterogeneous specimens. Nucleic acids can be detected via several established approaches, including analyticalmethods that are spectrophotometric (e.g., A260), fluorometric (e.g., binding of fluorescent dyes), or colorimetric (nucleoside-specific chromogenicchemical reactions).1 Though it cannot readily distinguish RNA from DNA, the A260/A280 ratio is commonly employed, as it offers a simple andrapid2 assessment of the relative content of nucleic acid, which absorbs predominantly near 260 nm and protein, which absorbs primarily near280 nm. Ratios < 0.8 are taken as indicative of 'pure' protein specimens, while pure nucleic acid (NA) is characterized by ratios > 1.53.
However, there are scenarios in which the protein/NA content cannot be as clearly or reliably inferred from simple uv-vis spectrophotometricmeasurements. For instance, (i) samples may contain one or more proteins which are relatively devoid of the aromatic amino acids responsiblefor absorption at ≈280 nm (Trp, Tyr, Phe), as is the case with some small RNA-binding proteins, and (ii) samples can exhibit intermediate A260/A280 ratios (~0.8 < ~1.5), where the protein/NA content is far less clear and may even reflect some high-affinity association between the proteinand NA components. For such scenarios, we describe herein a suite of colorimetric assays to rapidly distinguish RNA, DNA, and reducingsugars in a potentially mixed sample of biomolecules. The methods rely on the differential sensitivity of pentoses and other carbohydrates toBenedict's, Bial's (orcinol), and Dische's (diphenylamine) reagents; the streamlined protocols can be completed in a matter of minutes, withoutany additional steps of having to isolate the components. The assays can be performed in parallel to differentiate between RNA and DNA, aswell as indicate the presence of free reducing sugars such as glucose, fructose, and ribose (Figure 1).
Video Link
The video component of this article can be found at http://www.jove.com/video/50225/
Introduction
Much of cell biology occurs via molecular interactions involving DNA and RNA.4 These naturally occurring nucleic acids (NAs) interact with oneanother,5 with proteins,6 and with a host of small-molecule compounds and ligands in vivo (e.g., divalent cations7). The interactions may be short-or long-lived (kinetically), may range from high to moderate to low affinity (thermodynamic strength), and can also exhibit substantial variationin chemical properties and specificity - some associations are quite specific (e.g., DNA···transcription factors, RNA···splicing factors), whileother interactions are necessarily far more generic (e.g., DNA···bacterial histone-like HU proteins8). Non-specific interactions with NAs can havepractical consequences for in vitro experiments involving mixtures of biomolecules, as it is possible, and even likely, that some NAs will associatewith the biomolecules of interest, at least under some subset of the experimental conditions being used (ionic strength, solution pH, etc).
Consider, for instance, production of a protein of interest (POI) via heterologous over-expression of the recombinant protein in Escherichiacoli cell culture; such a procedure is routinely performed in virtually any structural biology lab.9 In preparing for further experiments, such asbiochemical/biophysical characterization, crystallization, etc., initial efforts generally focus on obtaining a sufficient quantity of the POI in as purea form as possible, ideally as a chemically homogeneous and biophysically monodisperse specimen. After disruption of host cells, the earlystages of a typical purification workflow aim to isolate the POI from E. coli proteins, nucleic acids, cell wall debris, and other components of thecellular lysate. However, host NAs may co-purify with the POI for several physicochemical reasons - a highly basic POI may non-specificallypull-down host DNA/RNA; the POI may have a generic NA-binding activity (e.g., the aforementioned HU); the POI may be a fairly specific NA-binding protein but exhibit cross-reactivity with host RNAs or DNAs; host NAs may interact with a chromatography matrix and thereby simply co-elute with the POI; and so on. Indiscriminate, high-affinity binding of host NAs to a POI can pose a vexing problem because the NA impurities willlikely interfere with downstream experiments (e.g., fluorescence anisotropy assays of POI•RNA binding10). Alternatively, unanticipated POI···NAassociations also can be viewed fortuitously, as such interactions illuminate the POI's nucleic acid-binding capacity. Either way, whether NAs are

Journal of Visualized Experiments www.jove.com
Copyright © 2013 Journal of Visualized Experiments February 2013 | 72 | e50225 | Page 2 of 9
key components or contaminants, one must first quantify and identify the type (DNA, RNA) of co-purifying NAs in preparation for downstreamexperiments.
Several analytical methods exist for detecting and quantitating NAs in a sample. Most of the available methods are fundamentally eitherspectrophotometric (e.g., A260 absorbance values and A260/A280 ratios), fluorometric (e.g., binding of thiazole orange or other fluorescentdyes to NA), or colorimetric (susceptibility of nucleosides to chemical reactions that yield chromophores absorbing in the uv-vis region of theelectromagnetic spectrum), as recently described by De Mey et al.1 However, the crucial step of identifying the type of polynucleotide as RNA orDNA is beyond the scope of many of these quantitation approaches. Here we provide a set of colorimetric assays to rapidly identify the types ofNA components in a proteinaceous sample.
The protocols described here can be efficiently executed without additional steps of isolating the potential NA impurities, and rely on Benedict'sassay for reducing sugars11, the orcinol assay for pentoses12,13, and diphenylamine reactions14,15 of 2'-deoxypentoses (Figures 1 and 2). TheBenedict's test (Figure 2a) utilizes the ability of the linear, open-chain (aldehyde) form of an aldose sugar to reduce Cu2+, with concomitantoxidation of the sugar's carbonyl to a carboxylate moiety and production of Cu2O as an insoluble red precipitate. This reaction will test positivewith free reducing sugars such as aldoses and ketoses (which convert to the corresponding aldoses via enediol intermediates), but not withpentose sugars that are locked into cyclic form as part of the covalent backbone of a DNA or RNA polynucleotide. Because of the minimalisticrequirement of a free hemiacetal functionality, other compounds that could test positive in this assay - and therefore act as potential interferents- include α-hydroxy-ketones and short oligosaccharides (e.g. the disaccharide maltose). Both the Bial's orcinol (Figure 2b) and Dische'sdiphenylamine (Figure 2c) reactions are based on initial destruction of the polynucleotide backbone, via depurination of the nucleoside andfurther acid- or base-catalyzed hydrolysis of the parent nucleotides, to yield furan-2-carbaldehyde (furfural) derivatives; these derivatives thenreact with either a polyhydroxy phenol such as orcinol (Bial's) or diphenylamine (Dische's) reagents to form colored condensation products oflargely unknown chemical structure. The DNA versus RNA specificity of the Dische's assay stems from the fact that the pentose sugar must be2'-deoxygenated in order to be susceptible to oxidation to ω-hydroxylevulinyl aldehyde, which further reacts with diphenylamine under acidicconditions to yield a bright blue condensate (Figure 2c). Using the streamlined protocols described here, we have found that these sugar-specific colorimetric reactions can differentiate between RNA and DNA, and will also indicate the presence of free reducing sugars such asglucose, fructose, or ribose in a biomolecular sample.
Protocol
1. Benedict's Assay for Reducing Sugars
1. Prepare a suitable quantity of Benedict's reagent - 940 mM anhydrous sodium carbonate, 588 mM sodium citrate dehydrate, 68 mM copper(II) sulfate pentahydrate. This reagent can be stored at room temperature (RT) for at least six months with no noticeable change in reactivity.
2. The above reagent is 6x. Thus, for 600 μl reactions, add 100 μl of Benedict's reagent to a clean 1.5 ml microcentrifuge tube (e.g., Eppendorfbrand), per sample to be assayed.
3. Add anywhere from 10 μl to 500 μl of sample to this tube; the optimal volume can be determined based on the intensity of color formation inan initial trial run. If sufficient sample is available then begin such trials at the maximal possible sample volume (i.e., five-sixths of the overallreaction volume, 500 μl of sample in this case), and then dilute in subsequent assays.
4. Add ddH2O to the tube to bring the final volume to 600 μl; mix the solution by vortexing or pipetting.5. Incubate the samples for 20 min in a boiling water bath.6. Remove the heated sample from the bath and allow it to cool at RT for 10 min.7. Centrifuge the sample tube at > 9,300 x g (~10,000 rpm in an FA45-24-11 Eppendorf fixed-angle rotor) for 5 min in order to sediment any
particulate material; this step is more important for quantitative rather than qualitative studies.8. Aliquot the supernatant from this tube into a clean cuvette.9. Blank the uv-vis spectrophotometer with water.10. Measure the absorbance of this sample at 475 nm.
2. Bial's Orcinol Assay for Pentose Sugars
1. Prepare a suitable quantity of fresh Bial's reagent - 24.2 mM orcinol monohydrate (see Figure 2b for the structure of this compound), 6 MHCl, 0.025% w/v ferric chloride hexahydrate. Note: For extended storage, the Bial's reagent can be prepared as two separate stock solutions:(i) Reagent A [0.05% w/v FeCl3•6H2O in concentrated HCl] and (ii) Reagent B [422 mM orcinol monohydrate prepared in 95% ethanol].Reagent A can be stored at RT for six months; Reagent B can be stored at 4 °C for one month, covered with foil to limit light exposure. Thesestock solutions are mixed in a 15 (A) : 1 (B) v/v ratio prior to use.
2. The above reagent is 2x. Thus, for 1.0 ml reactions, add 500 μl of Bial's reagent to a clean 1.5 ml microcentrifuge tube, per sample to beassayed.
3. Add anywhere from 10 μl to 500 μl of sample to this tube. As per note 1.3 (above), if sufficient sample is available then begin trial reactionsusing the maximal possible sample volume (i.e., one-half the overall reaction volume, 500 μl of sample in this case) and dilute from there.
4. Add ddH2O to the tube to bring the final volume to 1.0 ml; mix the solution by vortexing or pipetting.5. Incubate the samples for 20 min in a boiling water bath.6. Remove the heated sample from the bath and allow it to cool at RT for 10 min.7. Centrifuge the sample tube at > 9,300 x g (~10,000 rpm in an FA45-24-11 Eppendorf fixed-angle rotor) for 5 min in order to sediment any
particulate material; this step is more important for quantitative rather than qualitative studies.8. Aliquot the supernatant from this tube into a clean cuvette for visual inspection.9. For semi-quantitative analysis, blank the uv-vis spectrophotometer with water and measure the absorbance of the cuvette sample at 660 nm.

Journal of Visualized Experiments www.jove.com
Copyright © 2013 Journal of Visualized Experiments February 2013 | 72 | e50225 | Page 3 of 9
3. Dische's Diphenylamine Assay for 2'-deoxypentose Sugars
1. Prepare a suitable quantity of Dische's diphenylamine reagent - 60 mM diphenylamine, 11 M glacial acetic acid, 179 mM sulfuric acid, 0.62%v/v ethanol. This reagent can be prepared in advance and stored at RT in a dark container, or covered with foil, to limit light exposure. Due tolight sensitivity the reagent should not be stored indefinitely, though in practice it can be prepared every two to three months with no apparentchange in reactivity.
2. The above reagent is 2x. Thus, for 1.0 ml reactions, add 500 μl of Dische's reagent to a clean 1.5 ml microcentrifuge tube, per sample to beassayed.
3. Add anywhere from 10 μl to 500 μl of sample to this tube. As per note 1.3 (above), if sufficient sample is available then begin trial reactionsusing the maximal possible sample volume (i.e., one-half the overall reaction volume, 500 μl of sample in this case) and dilute from there.
4. Add ddH2O to the tube to bring the final volume to 1.0 ml; mix the solution by vortexing or pipetting.5. Incubate the samples for 20 min in a boiling water bath.6. Remove the heated sample from the bath and allow it to cool at RT for 10 min.7. Centrifuge the sample tube at >9,300 x g (~10,000 rpm in an FA45-24-11 Eppendorf fixed-angle rotor) for 5 min in order to sediment any
particulate material; this step is more important for quantitative rather than qualitative studies.8. Aliquot the supernatant from this tube into a clean cuvette for visual inspection.9. For semi-quantitative analysis, blank the uv-vis spectrophotometer with water and measure the absorbance of the cuvette sample at 600 nm.
4. Further Usage Notes
1. The following classes of molecules are suitable reference compounds for positive and negative control reactions for each assay:• Benedict's - Positive = free ribose, fructose, glucose; Negative = RNA, DNA, ATP, etc. (any saccharide lacking a free reducing sugar
functionality)• Bial's - Positive = RNA (e.g. baker's yeast extract), ribose, ATP, UMP; Negative = bovine serum albumin (BSA) or any other protein• Dische's - Positive = DNA (e.g. calf thymus); Negative = RNA, ATP, etc. (any non-2'-deoxygenated nucleotide)
2. These assays have been found to be fairly resilient to compounds often used in protein purification; for instance, common salts such asNaCl, (NH4)2SO4, and K2SO4 did not interfere, and the reactions appear generally unaffected by the contents of the diluent. Detergentsor chaotropic agents such as urea may affect the reactivity of the assays if the pH is highly basic; a neutral to acidic pH range is generallymost optimal for the Bial's and Dische's assays because of the underlying reaction chemistry (see the text and the protons in Figure 2b, c).Potentially suboptimal reaction conditions, suspected interferents, etc. should be tested on a case-by-case basis, using positive and negativecontrol experiments with reference compounds.
Representative Results
Results are shown in Figure 3 for application of these colorimetric assays to known reference compounds. Representative qualitative data areshown for the Benedict's (a), Bial's orcinol (b), and Dische's diphenylamine (c) assays, and standard curves for these three assays are shownin Figure 4. In panels 3(a-c), the left panels show positive/negative control experiments using suitably reactive/unreactive analytes; these visualresults are shown in situ, in the cuvettes as described in Protocols 1-3 (above). The right sub-panels show a titration series for each respectiveanalyte. In the Benedict's assay (a), the positive control is ribose (0.42 mg/ml), while negative controls are water, a generic protein (0.75 mg/mlBSA), and two non-reducing sugars (DNA at 0.75 mg/ml and RNA at 12.5 mg/ml). In the orcinol assay (b), the positive controls are ribose (0.15mg/ml), RNA (7.5 mg/ml), and DNA (0.45 mg/ml), while water and BSA protein (0.45 mg/ml) are negative controls. In the diphenylamine assay(c), calf thymus DNA (0.45 mg/ml) is shown as a positive control, and water, yeast extract RNA (7.5 mg/ml), ribose (0.15 mg/ml), and BSA (0.45mg/ml) serve as negative controls. Finally, panel (d) illustrates the robustness of the assays by showing the Dische's reaction with samples ofvarying heterogeneity: two concentrations of DNA are shown as a positive control in the left two samples (cuvettes 1-2), DNA + RNA mixtures(at various ratios) are shown in the next three samples (3-5), and the final three samples show DNA in the absence (sample 6) or presence(samples 7-8) of the nucleic acid-binding protein 'Hfq'.16 Note that the positive result of the Dische's assay is preserved for DNA-containingsamples even in the presence of 'contaminating' RNA or protein.
Quantitative Analysis: The dilution ranges in the Figure 3(a-c) panels vary because each reaction has a distinct visual detection limit, dependingon the type of sugar being assayed. Spectrophotometric, rather than visual, detection can be used to improve the measurement ranges, e.g.as shown in Figure 4 for the (a) Benedict's, (b) Bial's, and (c) Dische's assays. Though the protocols described here are intended as primarilyqualitative assays, the Beer-Lambert relation between absorbance and concentration enables at least semi-quantitative estimation of the sugaror nucleic acid content. As an example of a standard curve for calibration of the Benedict's test, a linear regression fit of absorbance (475 nm)against ribose concentration is shown in Figure 4(a); error bars indicate the standard deviation of n = 3 replicates, and the squared correlationcoefficient is provided. The deviation from linearity at very low ribose concentrations (e.g. the 0.28 mM datum) reflects the limited sensitivity ofthis assay. Though the assays are primarily intended for qualitative studies, the following guidelines are suggested for semi-quantitative analysis:
• For the Benedict's assay (Figure 4a): The reaction readout (A475nm) was found to be linear at least over the range 0.04 → 0.5 mg/ml analyte,as performed in triplicate.
• For the Bial's assay (Figure 4b): The absorbance data (A660nm) were linear at least over the range 0 → 0.5 mg/ml analyte (baker's yeastRNA), the assay having been performed in triplicate (R2 = 0.99 linear regression coefficient). Though the samples were centrifugedfor clarification before absorbance measurements, no precipitant was found at these low concentrations of analyte and therefore thecentrifugation step was not strictly necessary. The assay deviates from linearity at analyte concentrations beyond this range.
• For Dische's assay (Figure 4c): The A600nm response was found to be linear at least over the range 0.15 → 0.75 mg/ml of analyte (calfthymus DNA), the assay having been performed in triplicate (R2 = 0.99). The plot of absorbance versus [analyte] began to plateau at 0.90mg/ml DNA, indicating the boundary of the linear response region.
Journal of Visualized Experiments www.jove.com
Copyright © 2013 Journal of Visualized Experiments February 2013 | 72 | e50225 | Page 4 of 9
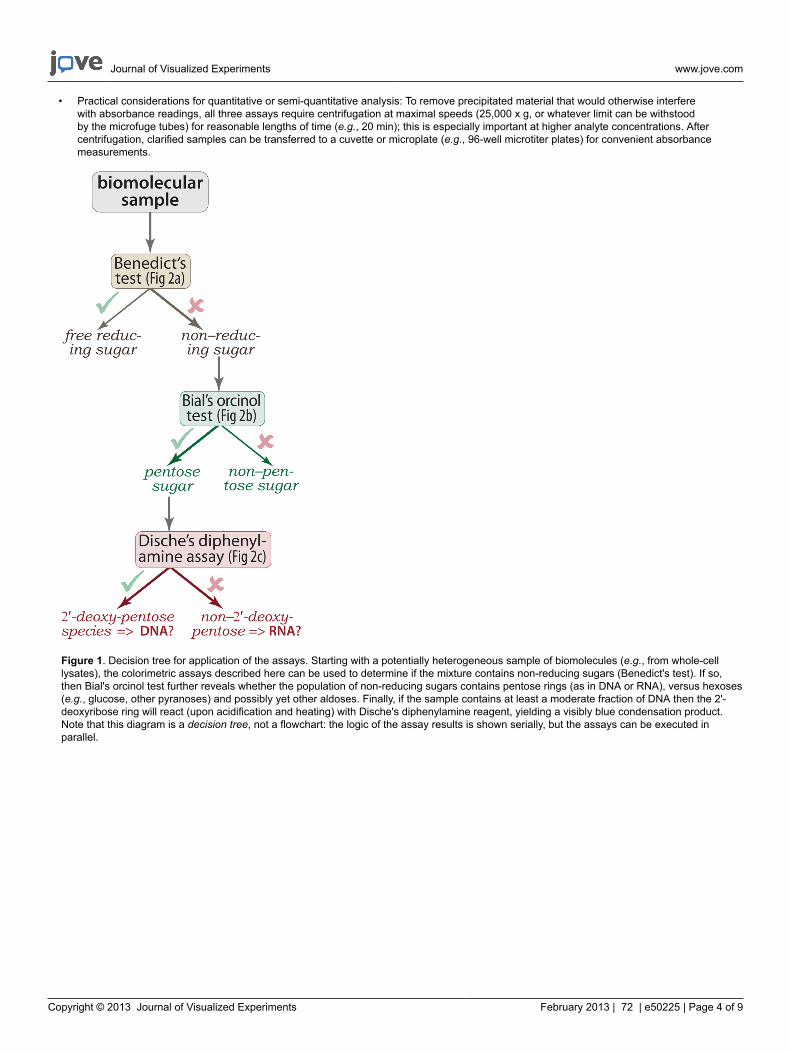
• Practical considerations for quantitative or semi-quantitative analysis: To remove precipitated material that would otherwise interferewith absorbance readings, all three assays require centrifugation at maximal speeds (25,000 x g, or whatever limit can be withstoodby the microfuge tubes) for reasonable lengths of time (e.g., 20 min); this is especially important at higher analyte concentrations. Aftercentrifugation, clarified samples can be transferred to a cuvette or microplate (e.g., 96-well microtiter plates) for convenient absorbancemeasurements.
Figure 1. Decision tree for application of the assays. Starting with a potentially heterogeneous sample of biomolecules (e.g., from whole-celllysates), the colorimetric assays described here can be used to determine if the mixture contains non-reducing sugars (Benedict's test). If so,then Bial's orcinol test further reveals whether the population of non-reducing sugars contains pentose rings (as in DNA or RNA), versus hexoses(e.g., glucose, other pyranoses) and possibly yet other aldoses. Finally, if the sample contains at least a moderate fraction of DNA then the 2'-deoxyribose ring will react (upon acidification and heating) with Dische's diphenylamine reagent, yielding a visibly blue condensation product.Note that this diagram is a decision tree, not a flowchart: the logic of the assay results is shown serially, but the assays can be executed inparallel.

Journal of Visualized Experiments www.jove.com
Copyright © 2013 Journal of Visualized Experiments February 2013 | 72 | e50225 | Page 5 of 9
Figure 2. Underlying chemical reactions are shown for the colorimetric assays, with the detectable colored product indicated alongside thecorresponding reactions. (a) An insoluble, red precipitate of Cu2O is the positive result of Benedict's assay for reducing sugars. (b) Upon heatingand acidification, sugars containing pentose rings will decompose to furfural, which then reacts with orcinol (Bial's reagent) to yield a solubleblue-green adduct. In Dische's assay, lack of a hydroxyl substituent at the 2' position enables a ring-opening oxidation reaction, the aldehydeproduct of which further reacts with diphenylamine [(Ph)2NH] to yield a bright blue product. Chemical structures remain unknown for the large,multi-ring condensation products of the orcinol (b) and diphenylamine (c) reactions.

Journal of Visualized Experiments www.jove.com
Copyright © 2013 Journal of Visualized Experiments February 2013 | 72 | e50225 | Page 6 of 9
Figure 3. Application of the colorimetric assays to reference compounds and heterogeneous samples. Sample results are shown forthe Benedict's (a), Bial's (b), and Dische's (c) colorimetric assays. In (a) → (c), the left sub-panels show positive/negative controls using suitablyreactive/unreactive analytes and the right sub-panels show a titration series for each analyte. Also shown is an illustrative panel of Dischereactions (d) wherein the analyte varies in heterogeneity - either DNA alone (left), DNA/RNA mixtures of differing ratios (middle), or DNA in thepresence of a nucleic acid-associated protein ('Hfq'). These panels are further described in the Representative Results section of the text.

Journal of Visualized Experiments www.jove.com
Copyright © 2013 Journal of Visualized Experiments February 2013 | 72 | e50225 | Page 7 of 9
Figure 4. Standard curves from assays with reference compounds. Calibration curves are shown for the Benedict's (a), Bial's (b), andDische's (c) assays, depicting a representative portion of the linear response region for each assay. The linear regression fits and correspondingcorrelation coefficients are indicated for each assay. Standard baker's yeast RNA (b) and calf thymus DNA (c) were the analytes in these titrationseries. Click here to view larger figure.
Discussion
The colorimetric assays presented here offer a simple approach to rapidly assess the chemical nature of biomolecular mixtures, such asare encountered when purifying proteins, RNAs or complexes from whole-cell lysate in preparation for further studies. As structural biologypursues more native-like assemblies, progressively greater challenges, such as sample heterogeneity, will be posed by the intricate and multi-component complexes. Supramolecular assemblies are often only marginally stable, and their successful isolation may demand less stringentpurification conditions (e.g., as found for spliceosomal snRNP complexes17,18). Under such milder conditions both authentic and spuriousPOI···NA interactions are more likely to persist and thereby interfere in downstream assays with a target protein or nucleic acid. A necessary firststep is identification of the types of chemical components in these samples.
Methods to detect RNA, DNA, and protein vary depending on quantity and concentration of analytes, available resources and time constraintsand, perhaps most importantly, one's prior knowledge about the likely chemical composition of the analytes. Proteinaceous material can bedetected by many well-established methods, including those that are spectroscopic (A280), hydrodynamic (gel electrophoresis), chemical/colorimetric19 (e.g., biuret test for peptide bonds) and, with great sensitivity and accuracy, via mass spectrometry. Similarly, NAs can bedetected by spectroscopic (A260), fluorometric, or chemical assays (described here). Each type of method features characteristic strengthsand weaknesses. For instance, PicoGreen, SYBR-Gold, and other cyanine-based fluorescent dyes are quite sensitive to nucleic acid (manyorders of magnitude beyond the colorimetric assays), exhibit various degrees of selectivity (e.g., PicoGreen for double-stranded DNA, SYBR-

Journal of Visualized Experiments www.jove.com
Copyright © 2013 Journal of Visualized Experiments February 2013 | 72 | e50225 | Page 8 of 9
Gold binds most NAs), and also feature broad dynamic ranges for quantitation purposes. However, these approaches are not without limits:the dyes require more advanced equipment for detection (transilluminators for gels, spectrofluorometers for batch samples), versus simplevisual readout of colorimetric assays; the dyes are treated as mutagens, akin to ethidium bromide; and there are restrictions on assay conditions(e.g., a recommended pH range of 7-8.5 for SYBR-Gold; a 30% reduction of PicoGreen signal intensity at >200 mM NaCl). Thus, colorimetricand fluorescence-based assays are complementary: nucleic acid dyes could be particularly useful in case of negative results with the rapidcolorimetric assays, or as a way to more carefully (quantitatively) expand on initial results from colorimetric assays. A fundamental benefit ofthe colorimetric NA protocols, in addition to simplicity of use, is that they rely solely on the intrinsic covalent structure of NAs rather than fold/3Dstructures, reactivities, or any other properties of the biopolymer that might vary with sequence.
The protocols described here are robust against most difficulties, particularly when performed with simple visual inspection of the reactionproducts; special care must be taken for more quantitative (spectrophotometric) analyses. For instance, in the Benedict's assay the redprecipitant (ppt) that forms in the presence of high concentrations of ribose must be removed prior to spectrophotometric analysis; this is readilyachieved via centrifugation. For the Dische's assay, the addition of diphenylamine reagent is accompanied by formation of a white ppt that canbe solubilized by heating; a green ppt that forms in the presence of DNA may interfere with spectrophotometric measurements and must beremoved prior to quantitative analysis. In addition, each assay is based on chemical reactions that are susceptible to potential interferents, asmentioned in the Introduction and further detailed below. Finally, we note that a high relative concentration of RNA in a DNA/RNA mixture canmask the expected positive result of Dische's assay; this false negative for DNA stems from the fact that a high mole fraction of RNA also reacts,via furfural intermediates, with the Dische's reagents, but yields a colorless product rather than the blue adduct produced by reaction with the 2'-deoxypentose sugar of DNA.
Potential Interferents: Beyond the obvious case of sugars, lipids and proteins are two other biomolecules that could hypothetically causetrouble with these colorimetric assays due to cross-reactivity (false positives) or masked reactivity (false negatives). In principle, several typesof cellular lipids could conceivably interfere, including glycosylglycerols and other glycerolipids conjugated to sugars, glycosphingolipids (e.g.,cerebrosides), saccharolipids (e.g., glucosamine derivatives), lipopolysaccharides, and so on. In practice, these classes of lipids are unlikely topose a problem in working with lipophilic proteins because they are relatively rare, versus the much more abundant phospholipids, and thereforebelow the detection limits of our assays. Because most of the aforementioned cellular lipids are built upon hexoses (galactose, glucose)rather than pentoses, they should not interfere as false-positives in the Bial's or Dische's assays. Free monosaccharides that may give false-positives include fructose, galactofuranose, or other furanoses. On a related note, interference from unwanted sugars could become an issuefor recombinant proteins expressed with maltose-binding protein (MBP) tags. In the affinity chromatography steps used to purify such fusionconstructs, maltose is used to elute the protein, and it is conceivable that residual maltose in downstream preparations could interfere with theBenedict's assay (it is the most general/nonspecific of the assays; the glucose units of maltose should not react under the Bial's or Dische's).Thus, one would have to exercise caution in the post-chromatographic steps to insure that residual maltose did not yield spurious results. Wehave not tested glucosylated proteins or other glycoproteins, but we suspect that it would be difficult to obtain a clear positive result for thepresence of sugars on such proteins (or glycolipid, proteoglycan, or other glycoconjugates) because we expect that the glycan moieties wouldlie below the sensitivity limit of our assays. In principle, a solution containing a free aldohexose such as glucose, liberated from a glucosylatedprotein via acid hydrolysis, would test positive by the Benedict's assay; similarly, a glycoprotein-derived pentose, such as xylose, should yielda positive result in the Bial's assay. However, in practice a positive result for glycoproteins would require extremely high protein concentrations,even for multiply glycosylated polypeptides, because of the low sugar/protein molar ratio.
The assay protocols described here can be extended and adapted to handle the limits of small sample size - i.e., small volumes or lowconcentrations of analytes. For limited sample quantities we have found that the reactions can be scaled down to the 100-μl range (e.g.,using PCR tubes and a thermocycler for the incubation steps). For small-volume samples at low concentrations (near the detection limit), aspectrophotometer equipped with a plate-reader can be used; in such scenarios, the only anticipated difficulty would be removal of any unwantedprecipitant prior to absorbance measurements. Despite the limited detection range of simple visual inspection, an advantage of the approachdescribed here is its efficiency and rapidity, with samples capable of being analyzed instantly upon heating.
Applications of the protocols presented here include the identification of co-purifying compounds, assessment of RNA or DNA purity, and thedetection of residual NA or sugar contamination in protein samples. For example, unwanted NA detected by our assays can be removed froma protein prep via chemical means (e.g., alkaline hydrolysis of RNA) or enzymatic digestion (e.g., nuclease treatment). Although there arealternative approaches to such applications, the methods described here are highly efficient in terms of both time and cost, and can therefore beeasily integrated into an experimental workflow. The early identification of co-purifying compounds as free reducing sugar, RNA, DNA, or proteincan guide the design of downstream purification steps, versus laborious trial and error studies. A common step following our protocols might bethe isolation of RNA from DNA and protein, via thiocyanate-phenol-chloroform extraction, or recovery of DNA alone (by excluding thiocyanate).20
To assess the purity of the NAs resulting from phenol-chloroform extractions, these colorimetric assays can be used as a simple alternativeto electrophoresis or DNase treatment. In this and other ways, the colorimetric assays described here can be combined with well-establishedmethods for protein and NA determination to achieve a rapid and robust system for elucidating the RNA, DNA, and protein components inheterogeneous biomolecular samples.
Disclosures
No conflicts of interest declared.
Acknowledgements
This work was funded by the University of Virginia and the Jeffress Memorial Trust (J-971). We thank L. Columbus, K. Jain, and P. Randolph forhelpful discussions and critical reading of the manuscript.

Journal of Visualized Experiments www.jove.com
Copyright © 2013 Journal of Visualized Experiments February 2013 | 72 | e50225 | Page 9 of 9
References
1. De Mey, M., et al. Comparison of DNA and RNA quantification methods suitable for parameter estimation in metabolic modeling ofmicroorganisms. Anal. Biochem. 353, 198-203, doi:10.1016/j.ab.2006.02.014 (2006).
2. Desjardins, P. & Conklin, D. NanoDrop Microvolume Quantitation of Nucleic Acids. J. Vis. Exp. (45), e2565, doi:10.3791/2565 (2010).3. Ausubel, F.M. In: Short Protocols in Molecular Biology: A Compendium of Methods from Current Protocols in Molecular Biology., 4th edn.,
Wiley, (1999).4. Voet, D. & Voet, J.G. In: Biochemistry., 4th edn., John Wiley & Sons, (2011).5. Adams, R.L.P., Knowler, J.T., & Leader, D.P. In: The Biochemistry of the Nucleic Acids., 10th edn., Chapman and Hall, (1986).6. Rice, P.A. & Correll, C.C. In: Protein-nucleic acid interactions: Structural biology., RSC Pub., (2008).7. Bowman, J.C., Lenz, T.K., Hud, N.V., & Williams, L.D. Cations in charge: Magnesium ions in RNA folding and catalysis. Curr. Opin. Struct.
Biol. doi:10.1016/j.sbi.2012.04.006 (2012).8. Balandina, A., Kamashev, D., & Rouviere-Yaniv, J. The bacterial histone-like protein HU specifically recognizes similar structures in all nucleic
acids. DNA, RNA, and their hybrids. J. Biol. Chem. 277, 27622-27628, doi:10.1074/jbc.M201978200 (2002).9. Graslund, S., et al. Protein production and purification. Nat. Methods. 5, 135-146, doi:10.1038/nmeth.f.202 (2008).10. Pagano, J.M., Clingman, C.C., & Ryder, S.P. Quantitative approaches to monitor protein-nucleic acid interactions using fluorescent probes.
RNA. 17, 14-20, doi:10.1261/rna.2428111 (2011).11. Benedict, S.R. A reagent for the detection of reducing sugars. 1908. J. Biol. Chem. 277, e5 (2002).12. Endo, Y. A simultaneous estimation method of DNA and RNA by the orcinol reaction and a study on the reaction mechanism. J. Biochem. 67,
629-633 (1970).13. Almog, R. & Shirey, T.L. A modified orcinol test for the specific determination of RNA. Anal. Biochem. 91, 130-137 (1978).14. Dische, Z. New color reactions for determination of sugars in polysaccharides. Methods Biochem. Anal. 2, 313-358 (1955).15. Burton, K. A study of the conditions and mechanism of the diphenylamine reaction for the colorimetric estimation of deoxyribonucleic acid.
Biochemical Journal. 62, 315-323 (1956).16. Vogel, J. & Luisi, B.F. Hfq and its constellation of RNA. Nat. Rev. Microbiol. 9, 578-589, doi:10.1038/nrmicro2615 (2011).17. Deckert, J., et al. Protein composition and electron microscopy structure of affinity-purified human spliceosomal B complexes isolated under
physiological conditions. Mol. Cell Biol. 26, 5528-5543, doi:10.1128/MCB.00582-06 (2006).18. Stevens, S.W., et al. Composition and functional characterization of the yeast spliceosomal penta-snRNP. Mol. Cell. 9, 31-44 (2002).19. Sapan, C.V., Lundblad, R.L., & Price, N.C. Colorimetric protein assay techniques. Biotechnol. Appl. Biochem. 29 (Pt. 2), 99-108 (1999).20. Chomczynski, P. & Sacchi, N. The single-step method of RNA isolation by acid guanidinium thiocyanate-phenol-chloroform extraction: twenty-
something years on. Nat. Protoc. 1, 581-585, doi:10.1038/nprot.2006.83 (2006).

Journal of Visualized Experiments www.jove.com
Copyright © 2013 Journal of Visualized Experiments Page 1 of 1
Materials List for:
Rapid Colorimetric Assays to Qualitatively Distinguish RNA and DNA inBiomolecular SamplesJennifer Patterson1, Cameron Mura1
1Department of Chemistry, University of Virginia
Correspondence to: Cameron Mura at [email protected]
URL: http://www.jove.com/video/50225DOI: doi:10.3791/50225
Materials
Name Company Catalog Number Comments
Anhydrous sodium carbonate Fisher Scientific S263
Sodium citrate dihydrate Sigma S-4641
Copper (II) sulfate pentahydrate VWR VW3312-2
Orcinol monohydrate Sigma-Aldrich O1875
Concentrated HCl VWR BDH3030
Ferric chloride hexahydrate Sigma F-2877
Diphenylamine Aldrich 112763
Glacial acetic acid Fisher Scientific A28
Sulfuric acid Sigma-Aldrich 258105
Ethanol Koptec V1101
Ribose Sigma R-7500 prep at 1% w/v in H2O
Ribonucleic acid from baker's yeast(S. cerevisiae)
Sigma R6750 prep at 10 mg/ml in H2O; store at-20 °C
Deoxyribonucleic acid (sodiumsalt), from calf thymus
Sigma D1501 prep at 10 mg/ml in H2O; store at 4°C
Reagents, Equipment & Safety
Materials are listed in the following table in the order in which they appear in the Protocol section. Unless otherwise noted (above), all reagentscan be stored at ambient room temperature and lighting. For any items not listed below (e.g., microcentrifuge tubes), the usual make / model /variety found in a standard biochemical laboratory can be used (e.g., Eppendorf brand 1.5 ml microfuge tubes). Standard plastic microfugetubes should be used for steps involving centrifugation (e.g., to sediment particulate material near the end of each protocol). No particularmaterial is preferable, as long as the tubes can be sealed; the typical polypropylene tubes found in biochemistry laboratories work well. Interms of safety concerns and waste disposal, standard laboratory precautions (safety glasses, fume hoods) should be exercised in pre-paring,working with, and disposing of solutions containing concentrated acetic, hydrochloric, or sulfuric acids. For organic reagents such as orcinol ordiphenylamine, nitrile gloves are preferable to the common latex (natural rubber) variety.


