Embed Size (px)
Citation preview

Biomimetic Sensor for Certain Phenols Employinga Copper(II) Complex
Shaikh M. Mobin,†,‡,§ Bankim J. Sanghavi,† Ashwini K. Srivastava,*,† Pradeep Mathur,*,‡,§ andGoutam K. Lahiri*,‡,§
Department of Chemistry, University of Mumbai, Vidyanagari, Mumbai-400098, India, and National Single CrystalX-ray Diffraction Facility and Department of Chemistry, IIT Bombay, Powai, Mumbai-400076, India
A new dimeric Cu(II) complex [Cu(µ2-hep)(hep-H)]2 ·2PF6 (1) containing a bidentate (hep-H ) 2-(2-hy-droxyethyl)pyridine) ligand was synthesized and char-acterized by single crystal X-ray diffraction studies.Each Cu ion in 1 is in a distorted square pyramidalgeometry. Further 1 is used as a modifier in theconstruction of a biomimetic sensor for determiningphenols [phenol (Phe), resorcinol (Res), hydroquinone(HQ), and catechol (Cat)] in phosphate buffer by usingcyclic voltammetry (CV), chronocoulometry, electro-chemical impedance spectroscopy (EIS), differentialpulse voltammetry (DPV), and square wave voltam-metry (SWV). DPV has been proposed for trace deter-mination of Phe and Res while SWV for HQ and Cat.The method has been applied for the selective andprecise analysis of Phe in commercial injections, Resin hair coloring agents, HQ in photographic developersand cosmetics, and Cat in tea samples and guaranatablets. The calibration curves showed a linear re-sponse ranging between 10-6 and 10-8 M for all fourof the analytes with detection limits (3σ) of 1.04 ×10⁻⁸, 2.31 × 10⁻⁸, 1.54 × 10⁻⁸, and 0.86 × 10⁻⁸ Mfor Phe, Res, HQ, and Cat, respectively. The lifetimeof the biomimetic sensor was 200 days at roomtemperature (at least 750 determinations). The cata-lytic properties of 1-CPE were characterized by chro-noamperometry and were found to be in good agree-ment with Michaelis-Menten kinetics.
Dinuclear Cu(II) complexes containing µ-oxo bridging havedrawn considerable attention in recent years for their potentialapplication in the field of biomimetic chemistry to provide anenhanced understanding of the function of the biological sites andas potential catalysts for substrate oxidations.1-6 Cu(II) complexes
have been known for their structural diversity and functionalmodels for the active centers of copper containing redoxenzymes.7-10 The construction of a biomimetic sensor is aformidable challenge in the development of analytical proceduresfor the determination of various analytes.10-12 Biomimetic sensorsare well documented as efficient catalysts for the oxidation ofphenolic substrates to quinones.7-13 Catechol oxidase is a copper-containing enzyme which catalyzes the oxidation of diphenols bymolecular oxygen with the production of quinones.11,12 Recently,the formation of copper complexes with the ligand containingpyridine, imidazole, and imine donors are of great interest, whichnot only stem from their fascinating structures but also showinteresting material properties.14-17
Phenol (Phe) is a good antiseptic and a neurologic agent whichhas application in pharmaceutical industries as injections. Dihy-droxy phenols have proved their own worth. Hydroquinone (HQ)is a major component in most photographic films and cosmeticsas a skin whitener. Catechol (Cat) is one of the most importantphenols, and its analysis in tea and guarana tablets is importantas it is toxic in nature. Resorcinol (Res) is also an importantcomponent of innumerable hair colors on the market. Thus,phenols are of tremendous importance, but their overdose is toxiccausing giddiness, deafness, salivation, sweating, and convulsions.Thus, their trace analysis is of significant importance.
Various methods have been employed for the trace leveldeterminations of Phe, Res, HQ, and Cat.18-22 However, these
* To whom correspondence should be addressed. Fax: +91-022-26528547.E-mail: [email protected], [email protected] (A.K.S.).
† University of Mumbai.‡ National Single Crystal X-ray Diffraction Facility, IIT Bombay.§ Department of Chemistry, IIT Bombay.
(1) Karlin, K. D.; Tyeklar, Z. Bioinorganic Chemistry of Copper; Chapman &Hill: New York, 1993.
(2) Solomon, E. I.; Sundaram, U. M.; Machonkin, T. E. Chem. Rev. 1996, 96,2563–2605.
(3) Latour, J. M. Bull. Soc. Chim. Fr. 1988, 508–523.(4) Sorrell, T. N. Tetrahedron 1989, 45, 3–68.(5) Vigato, P. A.; Tamburini, S.; Fenton, D. Coord. Chem. Rev. 1990, 106, 25–
170.
(6) Kitajima, N. Adv. Inorg. Chem. 1992, 39, 1–77.(7) Neves, A.; Rossi, L. M.; Bortoluzzi, A. J.; Szpoganicz, B.; Wiezbicki, C.;
Schwingel, E. Inorg. Chem. 2002, 41, 1788–1794.(8) Neves, A.; Rossi, L. M.; Bortoluzzi, A. J.; Mangrich, A. S.; Haase, W.; Werner,
R. J. Braz. Chem. Soc. 2001, 12, 747–754.(9) Neves, A.; Erthal, S. M. D.; Drago, V.; Griesar, K.; Haase, W. Inorg. Chim.
Acta 1992, 197, 121–124.(10) dos Anjos, A.; Bortoluzzi, A. J.; Szpoganicz, B.; Caro, M. S. B.; Friedermann,
G. R.; Mangrich, A. S.; Neves, A. Inorg. Chim. Acta 2005, 358, 3106–3114.(11) Sotomayor, M. D. P.; Tanaka, A. A.; Kubota, L. T. Electrochim. Acta 2003,
48, 855–865.(12) Sotomayor, M. D. P.; Tanaka, A. A.; Kubota, L. T. J. Electroanal. Chem.
2002, 536, 71–81.(13) Ebarvia, B. S.; Cabanilla, S.; Sevilla, S. F., III. Talanta 2005, 66, 145–152.(14) Balamurugan, R.; Palaniandavar, M.; Halcrow, M. A. Polyhedron 2006, 25,
1077–1088.(15) Kim, E. H.; Kim, D. I.; Lee, H. S.; Byun, J. C.; Choi, J. H.; Park, Y. C.
Polyhedron 2007, 26, 85–92.(16) Gao, G. G.; Xu, L.; Wang, W. J.; An, W. J.; Qiu, Y. F.; Wang, Z. Q.; Wang,
E. B. J. Phys. Chem. B 2005, 109, 8948–8953.(17) Salimi, A.; Alizadeh, V.; Hadadzadeh, H. Electroanalysis 2004, 16, 1984–
1991.(18) Pistonesi, M. F.; Di Nezio, M. S.; Centurion, M. E.; Palomeque, M. E.; Lista,
A. G.; Fernandez Band, B. S. Talanta 2006, 69, 1265–1268.
Anal. Chem. 2010, 82, 5983–5992
10.1021/ac1004037 2010 American Chemical Society 5983Analytical Chemistry, Vol. 82, No. 14, July 15, 2010Published on Web 06/22/2010

methods face drawbacks like being expensive, laborious, andrequire pretreatment. On the other hand, modern electroanalyticaltechniques are very sensitive, selective, and seldom requirepretreatment, preseparation, etc. The availability of various modi-fied electrodes at relatively low cost has provided considerableimpetus to the use of electroanalytical techniques for analysis.The present study is concerned with the use of electroanalyticaltechniques for trace determination of phenols.
The electrochemistry of Phe,23-25 Res,26,27 HQ,28,29 andCat30-32 has been well studied. Carbon paste electrodes (CPEs)are very popular due to their wide anodic potential range, lowresidual current, ease of fabrication, easy surface renewal, lowcost, etc. Chemically modified electrodes (CMEs) are used tolower the order of magnitude of detection limits as compared tothe plain carbon paste electrode (PCPE). Various modifiers likenanomaterials,32-36 copper complexes,37,38 macrocycles,39,40 etc.have been employed successfully as modifiers for the carbon pasteelectrode.
The construction of a Cu(II) complex based biomimetic sensoris the most developing area in current research based on sensors.An up-to-date literature survey reveals that many copper containingoxidase complex based biomimetic sensors have been employedfor the trace determination of phenols due to their redoxproperties.41,42
In view of the desirable characteristics of Cu-complexes, it islikely that electrochemical processes may occur in a facile manner.
The present work aims at studying the electrochemical behaviorof Phe, Res, HQ and Cat for trace determination employing variousvoltammetric techniques using synthesized Cu complex as bio-mimetic sensor. The developed methods have been employed forthe selective and precise analysis of Phe in commercial injections,Res in hair coloring agents, HQ in photographic developers andcosmetics, and Cat in tea samples and guarana tablets, andultimately the recovery studies have been carried out for all theaforementioned phenols. The catalytic activity and response timefor phenols were obtained using chronoamperometry. To the bestof our knowledge this is the first example of an alcoholic -OHgroup (present in 1) based biomimetic sensor being developedfor trace determination of phenols.
EXPERIMENTAL SECTIONMaterials and Instrumentation. All chemicals were of A. R.
grade and were used as received without any further purification.Phe, HQ, Res, and Cat were purchased from Fluka. HCl wasprocured from Merck, India. The commercially available startingmaterials, Cu(OC(dO) CH3)2 ·2H2O, 2-(2-hydroxyethyl)pyridine(hep-H), sodium hexaflouro phosphate (NaPF6), ascorbic acid,acetaminophen, uric acid, pyridoxine HCl, folic acid, epineph-rine, aspirin, caffeine, 4-bromophenol, and reagent gradesolvent methanol, were used as received. Aspirin and uric acidwere first dissolved in 0.001 N NaOH. Graphite powder,ascorbic acid, acetaminophen, uric acid, aspirin, 4-bromophenol,and caffeine were purchased from S. D. fine, India. PyridoxineHCl, folic acid, epinephrine, and mineral oil were purchasedfrom Fluka. Metol, methyl paraben, poly(ethylene glycol), ando-aminophenol were procured from Aldrich. Elemental analyseswere carried out with a Perkin-Elmer 240C elemental analyzer.FT-IR spectra of complexes as KBr pellets were recorded usinga Nicolet spectrophotometer. A UV-visible spectrophotometerused for validating the method was procured from Shimadzu,Japan. The pH measurements were performed using an ELICOLI 120 pH meter.
All voltammetric, chrono, and electrochemical impedancestudies (EIS) measurements have been performed using GPESsoftware, version 4.9.005, and Frequency Response Analyzer,software version 2.0, respectively, and were performed on an EcoChemie, Electrochemical Workstation and model Autolab PG-STAT 30. An Ag/AgCl electrode and a platinum electrode wereused as the reference and counter electrodes, respectively, tomeasure all the potentials. A plain carbon paste electrode (PCPE)and modified [Cu(µ2-hep)(hep-H)]2 ·2PF6(1)-CPE (1-CPE) wereused as working electrodes.
Synthesis of [Cu(µ2-hep)(hep-H)]2 ·2PF6 (1). A solutionof hep-H (123 mg, 1 mmol) in methanol (25 mL) was added to asolution of Cu(OC(dO)CH3)2 ·2H2O (199 mg, 1 mmol) inmethanol (25 mL). An aqueos solution of NaPF6 (168 mg, 1mmol) was added to the above reaction mixture, and theresultant solution was stirred for 6 h at room temperature. Thesolution was then passed through the filter paper in order toremove any unreacted materials. The filtrate was allowed tostand at room temperature for crystallization. Dark blue singlecrystals of 1 were obtained within 3 days by slow evaporationof the solvent. mp, 228-230 °C. Yield, 290 mg (91%). Anal.Calcd for C28H34N4O4F12P2Cu2, (MW ) 907.61): C, 37.05; H,3.78; N, 6.17. Found: C, 37.09; H, 3.84; N, 6.12. IR (KBr, cm-1):
(19) Figueiredo, E. C.; Tarley, C. R. T.; Kubota, L. T.; Rath, S.; Arruda, M. A. Z.Microchem. J. 2007, 85, 290–296.
(20) Lin, Y.-H.; Yang, Y.-H.; Wu, S.-M. J. Pharm. Biomed. Anal. 2007, 44, 279–282.
(21) Rodrigues, G. D.; de Lemos, L. R.; da Silva, L. H. M.; da Silva, M. d. C. H.;Minim, L. A.; Coimbra, J. S. d. R. Talanta 2010, 80, 1139–1144.
(22) Xiao, W.; Xiao, D. Talanta 2007, 72, 1288–1292.(23) Lin, H.; Ji, X.; Chen, Q.; Zhou, Y.; Banks, C. E.; Wu, K. Electrochem.
Commun. 2009, 11, 1990–1995.(24) Santos, W. J. R.; Sousa, A. L.; Sotomayor, M. P. T.; Damos, F. S.; Tanaka,
S. M. C. N.; Kubota, L. T.; Tanaka, A. A. J. Braz. Chem. Soc. 2009, 20,1180–1187.
(25) Kim, G.-Y.; Cuong, N. M.; Cho, S.-H.; Shim, J.; Woo, J.-J.; Moon, S.-H.Talanta 2007, 71, 129–135.
(26) Han, L.; Zhang, X. Electroanalysis 2009, 21, 124–129.(27) Wang, Z. H.; Li, S. J.; Lv, Q. Z. Sens. Actuators, B 2007, 127, 420–425.(28) Zhao, D.-M.; Zhang, X.-H.; Feng, L.-J.; Jia, L.; Wang, S.-F. Colloids Surf., B
2009, 74, 317–321.(29) Zhang, Y.; Zeng, G.-M.; Tang, L.; Huang, D.-L.; Jiang, X.-Y.; Chen, T.-N.
Biosens. Bioelectron. 2007, 22, 2121–2126.(30) Sun, W.; Li, Y.; Yang, M.; Li, J.; Jiao, K. Sens. Actuators, B 2008, 133,
387–392.(31) Lin, H.; Gan, T.; Wu, K. Food Chem. 2009, 113, 701–704.(32) Shan, D.; Zhang, J.; Xue, H.-G.; Zhang, Y.-C.; Cosnier, S.; Ding, S.-N. Biosens.
Bioelectron. 2009, 24, 3671–3676.(33) Yang, T.; Zhou, N.; Zhang, Y.; Zhang, W.; Jiao, K.; Li, G. Biosens. Bioelectron.
2009, 24, 2165–2170.(34) Dai, H.; Wang, Y.; Wu, X.; Zhang, L.; Chen, G. Biosens. Bioelectron. 2009,
24, 1230–1234.(35) Beitollahi, H.; Karimi-Maleh, H.; Khabazzadeh, H. Anal. Chem. 2008, 80,
9848–9851.(36) Zhu, S.; Fan, L.; Liu, X.; Shi, L.; Li, H.; Han, S.; Xu, G. Electrochem. Commun.
2008, 10, 695–698.(37) Ines Rosane de Oliveira, W. Z.; Neves, A.; Vieira, I. C. Sens. Actuators, B
2008, 129, 424–430.(38) Hasebe, Y.; Gu, T. J. Electroanal. Chem. 2005, 576, 177–181.(39) Vaze, V. D.; Srivastava, A. K. Electrochim. Acta 2007, 53, 1713–1721.(40) Gaichore R. R.; Srivastava A. K. Anal. Lett. In press.(41) Ines Rosane de Oliveira, W. Z.; Renata El-Hage de Barros Osorio, M.; Neves,
A.; Vieira, I. C. Sens. Actuators, B 2007, 122, 89–94.(42) Sergeyeva, T. A.; Slinchenko, O. A.; Gorbach, L. A.; Matyushov, V. F.;
Brovko, O. O.; Piletsky, S. A.; Sergeeva, L. M.; Elska, G. V. Anal. Chim.Acta 2010, 659, 274–279.
5984 Analytical Chemistry, Vol. 82, No. 14, July 15, 2010

3560(br), 3120(w), 2385(w), 2360(w), 1609(m), 1571(w), 1486(m),1448(s), 1312(w), 1187(w), 1167(w), 1069(s), 1049(m), 1032(w),841(s), 788(m), 773(w), 558(s).
X-ray Crystallography. Single crystal X-ray structural studiesof 1 was performed on a CCD Oxford Diffraction XCALIBUR-Sdiffractometer equipped with an Oxford Instruments low-tempratureattachment. Data was collected at 150(2) K using graphite-mono-chromoated Mo KR radiation (λR ) 0.710 73 Å). The strategy forthe data collection was evaluated by using the CrysAlisPro CCDsoftware. The data were collected by the standard “phi-omega”scan techniques and were scaled and reduced using CrysAlisProRED software. The structures were solved by direct methodsusing SHELXS-97 and refined by full matrix least-squares withSHELXL-97 refining on F2.43
The positions of all the atoms were obtained by direct methods.All non-hydrogen atoms were refined anisotropically. The remain-ing hydrogen atoms were placed in geometrically constrainedpositions and refined with isotropic temperature factors, generally1.2Ueq of their parent atoms. All the H-bonding interactions,mean plane analyses, and molecular drawings were obtainedusing the program Diamond (version 3.1d). The crystal andrefinement data are summarized in Table 1, and selected bonddistances and bond angles are shown in Table S-1 in theSupporting Information.
Chronoamperometry. Kinetic data for oxidation of Cat in pH7.0 phosphate buffer (0.1 M) was obtained by using chronoamper-ometry for 1-CPE at a potential of 0.7 V. The results were obtainedby gradually increasing the concentration of Cat in the range of
0-80 µM under stirring conditions. From the plot of i vs t, theslopes for the initial 0.8 s were measured after each increment ofCat. The data were then fitted with the Michaelis-Menten model,and the apparent kinetic parameters viz. Michaelis constant (KM),maximum enzyme velocity (Vmax), turnover number (kcat), andspecificity constant (kcat/KM) were estimated. The same tech-nique was employed for all the other substrates.
Construction of the PCPE and Biomimetic Sensor (1-CPE). PCPE was prepared by mixing graphite with mineral oilat the composition of 70:30 (w/w) using a mortar and pestle andwas allowed to homogenize for 48 h.44,45 1-CPE was prepared bymixing 25 mg (10% w/w) of 1 with 150 mg of graphite powder(60% w/w) and 75 mg of mineral oil (30% w/w). The resulting1-CPE was used for all the analysis.
Procedures for Sample Preparation for Determination ofPhenols in Real Samples. Phenol was analyzed in commercialinjection samples. The sample (water based phenol injections) wasdissolved in water and used as such. The oil based samples weretreated as follows: The sample was dissolved in 10 mL of etherand extracted with successive 1 mL quantities of 2 M sodiumhydroxide until the extraction is complete. The combined extractswere then boiled for 2 min, cooled, and diluted to 250 mL withwater. Appropriate aliquots were taken from both the injectionsamples and diluted to 25 mL with supporting electrolyte. Themethod was validated by the procedure given in Pharmacopoeia.46
Res was extracted from all the hair coloring samples by liquidliquid partition.47 The cream was accurately weighed and dissolvedin 1:1 (v/v) ethanol-water by stirring for 5-6 min. This alcoholicmixture was then extracted with ether (20 mL), and this extractwas evaporated. The dry residue was dissolved in 1:1 (v/v)ethanol-water, and the solution was transferred to a 50 mLvolumetric flask and diluted to volume with the same solventmixture. Appropriate quantities were then taken for the analysis.
Hydroquinone was determined in photographic developers andcosmetics. An accurate amount ranging from 5 to 7 g of eachpowder photographic developer sample was transferred into a 50mL calibrated flask, dissolved, and diluted to volume with water.48
An aliquot of 10 mL of this solution was treated initially by passingthrough a 0.8 cm (i.d.) × 15 cm (length) glass column packedwith cation-exchange resin (Merck strongly acid, type I), wherethe metol was totally retained. The column was eluted with water,and the effluent was collected in a 25 mL calibrated flask. A 2 mLaliquot of this solution was reacted with 1 mL of 8.0 M formal-dehyde solution at pH 4.5 promoting the formation of the sodiumR-hydroxymethanesulfonate adduct. After the elimination of bothinterfering agents (metol and sodium sulfite), a 1 mL aliquot wastransferred into a glass cell containing 10 mL of 0.1 M phosphatebuffer (pH 7.0) solution and voltammograms were recorded. HQwas also analyzed in cosmetics as follows:49 50 mg of sample wasaccurately weighed into a glass centrifuge tube, 10 mL of methanolwas added, and the tube was heated at 40 °C in a water-bath withstirring until sample dissolution was complete. After sample
(43) Sheldrick, G. M. Acta Crystallogr., Sect. A 2008, A64, 112–122. Programfor Crystal Structure Solution and Refinement; University of Goettingen:Goettingen, Germany, 1997.
(44) Adams, R. N. Anal. Chem. 1958, 30, 1576–1576.(45) Svancara, I.; Vytras, K.; Kalcher, K.; Walcarius, A.; Wang, J. Electroanalysis
2008, 21, 7–28.(46) British Pharmacopoeia; 2003.(47) Wang, L.-H.; Kuo, Y.-P. Chromatographia 1999, 49, 208–211.(48) Vieira, I. C.; Fatibello-Filho, O. Talanta 2000, 52, 681–689.(49) Sirajuddin; Bhanger, M. I.; Niaz, A.; Shah, A.; Rauf, A. Talanta 2007, 72,
546–553.
Table 1. Crystallographic Parameters for 1
identification code 1 (150 K)
empirical formula C28H34N4O4F12P2Cu2formula weight 907.61wavelength 0.710 73 Acrystal system, space group orthorhombic, Pbcna 14.580 6(5), Åb 9.496 8(3), Åc 24.917 6(6) ÅR 90� 90γ 90V Å3 3450.32(18)Z, calculated density 4, 1.747 mg/m3
absorption coefficient 1.432 mm-1
F(000) 1832crystal size 0.36 mm × 0.32 mm × 0.27 mmθ range for data collection 3.04-25.00°index ranges -15 e h e 17, -11 e k e 9,
-28 e l e 29reflections collected/unique 16 840/3 034 [R(int)) 0.0371]data collection instrument Oxford XCalibur-Sabsorption correction multiscanmaximum and
minimum transmission0.6985 and 0.6267
refinement method full-matrix least-squares on F2
data/restraints/parameters 3034/0/241goodness-of-fit on F2 1.087final R indices [I > 2σ(I)] R1 ) 0.0418, wR2 ) 0.0941R indices (all data) R1 ) 0.0567, wR2 ) 0.1021largest difference
peak and hole0.771 and -0.520 e A-3
5985Analytical Chemistry, Vol. 82, No. 14, July 15, 2010

cooling and centrifugation, the supernatant was transferred intoa 10 mL calibrated flask and made up to volume with water.Because of the high concentration of hydroquinone present inthe cream, the solution had to be diluted. This was done by taking100 µL of the previous solution and making it up to a volume of25 mL with the pH 7.0 phosphate buffer for the analysis.
Cat was analyzed in tea and guarana tablet samples.50 Varioustea samples were purchased from local market and treated asfollows: The tea sample (about 0.50 g) was exactly weighed, andthe catechol was extracted with 60 mL of 20% (v/v) methanolsolution for 20 min at 80 °C. The mixture was filtered and thevolume made up to 100.0 mL for further measurement. Theguarana powder samples were analyzed by taking one aliquot of1.0 g of each sample of guarana powder that was extracted with100 mL of ethanol at room temperature overnight, and then itwas filtered through quantitative paper filter. After this step, analiquot of 1 mL of the filtered solution (diluted with supportingelectrolyte) was added to the cell containing the electrolyte.
Sea and sewage water samples were collected from variouslocations in India. Sea water samples were collected in polypro-pylene bottles from various locations in India. In order to preservethe sample, three drops of concentrated nitric acid were addedfor each 100 mL of water. Sewage samples were collected fromdifferent drains in and around Mumbai, India. Samples (100 mL)were collected in polypropylene bottles at the outlet of the drains.These collected samples were acidified, stored in a freezer, andanalyzed in a way similar to that for the seawater. A total of 10aliquots of both sea and sewage water samples were taken in orderto guarantee the representation of the samples. The only samplecleanup used was filtering through a 0.22 µm PVDF syringe filter(Millex, Millipore Corporation), and no extraction steps wereundertaken prior to the voltammetric measurements. An appropri-ate volume of sample was taken and made up to 25 mL withphosphate buffer (pH 6.0 for Phe and Res; pH 7.0 for HQ andCat). The recovery tests were performed on sea and sewage watersamples by spiking them with standard phenol solutions.
RESULTS AND DISCUSSIONThe dimeric complex [Cu(µ2-hep)(hep-H)]2 ·2PF6 (1) has been
synthesized by the reaction of 2-(2-hydroxyethyl)pyridine(hep-H) with the methanolic solution of copper acetate dihydrateand aqueous solution of PF6 under magnetic stirring for 6 h atroom temperature. Subsequent slow evaporation of the solventat room temperature yields single crystals suitable for X-raydiffraction, which establishes the dimeric structure of 1 as hasbeen evidenced by its single crystal X-ray structure (Figure 1). 1has been characterized with the aid of elemental analysis, IR, andUV-visible spectroscopic studies and yielded the correct elementalanalysis. Strong IR bands confirm the presence of O-H strechingwith characteristic absorption at 3560 (broad) cm-1.
The compound 1 crystallizes in the orthorhombic Pbcn spacegroup with a crystallographically imposed inversion center (Table1). The asymmetric unit consists of one Cu atom, one hep- ligand,one hep-H group, and two half symmetric free PF6 molecule.The crystal structure of 1 reveals the dinuclear feature of thecomplex with the overall composition of one [Cu(µ2-hep)(hep-
H)]22+ cation and two PF6 anions (Figure 1). Each CuII ion is
in a pentacoordinated N2O3 environment, bonded to twobridging µ-alkoxy oxygen atoms and one nitrogen atom of hep-
ligand and another nitrogen atom from the hep-H ligand andthe fifth coordination site is occupied by the elongated oneoxygen atom of unprotonated hep-H ligand. The basal positionsof each Cu ion in 1 are composed of O(1), O(1A), N(1) of hep-,and N(2) of hep-H. The Cu(1)-O(1), Cu-O(1A), Cu(1)-N(1), and Cu(1)-N(2) bond lengths are 1.906(1), 1.927(2),1.954(1), and 1.992(2) Å, respectively (Table S-1 in the Sup-porting Information). The axial position is filled with an O(2)donor of the hydroxyl group of hep-H with an elongatedCu(1)-O(2) distance of 2.572(1) Å due to the Jahn-Teller effect.This results in a distorted square pyramidal geometry around eachof the copper ions. The central Cu2O2 ring with two differenttypes of Cu-O bond distances is nonplanar unlike the similardimeric unit reported by us recently51,52 in which central Cu2O2
is planar. The slight bend in the Cu2O2 is due to the bulkierhep-H ligand compared to the -OAc group. The Cu · · ·Cudistance in 1 is 3.017(1) Å. The cation 1 signifies the structuralmodel for the active site of the phenolic group since it possessa dicopper-dioxygen (Cu2O2) unit containing without a depro-tonated alcoholic (OH) group axially coordinated to each Cu(II)center.
The packing diagram of 1 along the c-axis reveals variousintermolecular C-H · · ·F and O-H · · ·F interactions in conjunctionwith one intramolecular C-H · · ·O interactions (Figure S-1 andTable S-2 in the Supporting Information). The presence of variousintermolecular interactions in 1 prompted us to explore thepossibility of the sensing properties via electrochemical pathways.
Recently we have reported several neutral dicopper-dioxygencomplexes [(OR)Cu(µ-hep)2Cu(OR/)] · 2H2O in presence ofancillary ligands [ORdOR′ ) bidentate acetate, n-propionicacid, and trifluoro acetic acid and the bidentate mixed OR)acetate/OR′ ) n-propionic acid],51,52 which were applied in asingle-crystal to single-crystal (SCSC) transformation from thedimeric copper complex to the tetrameric copper complex onexposure to alcohol vapors. This sensing property of the above-
(50) Magna, A.; Salomao, A. A.; Vila, M. M. D. C.; Tubino, M. J. Braz. Chem.Soc. 2003, 14, 129–132.
(51) Shaikh, M. M.; Srivastava, A. K.; Mathur, P.; Lahiri, G. K. Inorg. Chem.2009, 48, 4652–4654.
(52) Shaikh, M. M.; Srivastava, A. K.; Mathur, P.; Lahiri, G. K. Dalton Trans.2010, 39, 1447–1449.
Figure 1. ORTEP view of 1 showing the molecule in the asymmetricunit with anisotropic displacement drawn at 50% probability.
5986 Analytical Chemistry, Vol. 82, No. 14, July 15, 2010

mentioned complexes prompted us to employ them as a modifierin the carbon paste electrode for determination of phenols butcould not yield good selectivity, sensitivity, and response time.Thus we decided to synthesize a new ionic complex 1 in absenceof any ancillary ligand. 1 consists of [Cu(µ2-hep)(hep-H)]2
2+
cation possessing a dicopper-dioxygen unit and axially coor-dinated alcoholic OH group [Cu(1)-O(2) distance of 2.572(1)Å]. This alcoholic OH group can be easily available to form anactive site for phenols to bind two Cu(II) centers.
Electrochemical Studies: Optimization of 1-CPE Vari-ables. Differential pulse (DPV) and square wave voltammetry(SWV) were performed on all the phenols. It was observed thatthe highest sensitivity in terms of peak height was obtained forPhe and Res employing DPV while that for HQ and Cat by usingSWV. The optimum conditions for analysis were established byrecording the peak current response of phenols on various factorssuch as (i) the composition of the modifier, (ii) effect of pH, (iii)various supporting electrolytes, and (iv) pulse height and thefrequency range (SWV).
The amount of the modifier (1) on the surface of the electrodeplays a predominant role in the voltammetric oxidation of phenols.The response of the various composition of 1 in the range of5-20% (w/w) into carbon paste was studied. It was observed thatthe oxidation peak current for phenols increased with the increasein percentage of 1 up to 10% beyond which saturation in the anodicpeak current occurs. As a result, 10% of 1 was selected as theoptimum amount for preparation of the modified electrode (1-CPE). The 1-CPE was prepared (in the same fashion in whichPCPE was prepared) in the composition of graphite/1/mineraloil (60:10:30% w/w/w).
The influence of the pH on the oxidation peaks of all phenols(Phe, HQ, Cat, and Res) was investigated individually in the pHrange of 2-12 using Britton-Robinson (BR) buffer. It wasobserved that the peak potential of phenols shifted to less positivevalues with the increase in pH. The maximum peak current wasobtained for Phe and Res at pH 6.0 (DPV) while that for HQ andCat at pH 7.0 (SWV). These pH values were thus employed forfurther studies. Various buffers were then employed, viz., acetate,BR, citrate-phosphate, HEPES, and phosphate at the optimizedpH values. The best peak sensitivity was observed in the case ofphosphate buffer which was employed for further studies. Theconcentration of phosphate buffer was then optimized employingit in a range of 0.01-0.5 M. It was observed that the best responsein terms of peak current was obtained at 0.1 M of the buffer.
The differential pulse voltammogram was recorded by scanningthe potential toward the positive direction in the range of about+0.4 to +1.1 V for Phe and Res and at a pulse height in the rangeof 10-100 mV in phosphate buffer (pH 6.0). However, the bestshape of voltammogram was obtained at 50 mV pulse height;hence, it was employed for further studies. SWV was carried outby studying the effects of frequency, pulse amplitude, and scanincrement parameters on the peak current response to HQ andCat oxidation in 0.1 M phosphate buffer solution pH 7.0. Theinfluence of the frequency from 10 to 300 Hz on the 1-CPEresponse was studied. The highest current response was obtainedat 100 Hz for HQ and 80 Hz for Cat with 100 mV pulse amplitude.The effect of the scan increment was investigated in the range of
0.5-4.0 mV. The current increased up to 3.0 mV and remainedconstant at higher values, which was chosen for further studies.
Differential pulse voltammograms of Phe and Res and squarewave voltammograms of HQ and Cat at PCPE and 1-CPEemploying the above optimized conditions are given in Figure 3.A 5-fold enhancement is obtained at 1-CPE for Phe and 4 timesenhancement for Res as compared to PCPE. The 16-fold enhance-ment in peak current was obtained for HQ and 14-fold enhance-ments for Cat at 1-CPE as compared to PCPE, which reveals thatthe 1-CPE has a high selectivity for phenols.
Cyclic Voltammetry, Chronocoulometry, and Electro-chemical Impedance Spectroscopy. The surface areas of allthe four electrodes of the same nominal bore size were found outusing the 6 mM of [Fe(CN)6]3-/[Fe(CN)6]2- system in 0.1 MKNO3. The surface areas of both the electrodes were calculatedusing the Randles-Sevcik equation and were found to be0.0039 cm2 for PCPE and 0.0164 cm2 for Cu(II)-PE.
Comparative cyclic voltammograms for Cu(II) salt and 1 areas shown in Figure S-2 in the Supporting Information. The effectof the scan rate on the electrochemical behavior of Cu(II) saltand 1 reveal that when the potential was varied from -0.5 to +0.5V, the peak potentials changed gradually (Figures S-3 and S-4 inthe Supporting Information). The plot of ip vs v1/2 gave a straightline plot which implies that the redox reaction is diffusioncontrolled on the PCPE.
The electrochemical behavior of phenols was investigatedusing the plain carbon paste electrode and 1-CPE by cyclicvoltammetry. In this study, cyclic voltammetric measurementswere obtained by sweeping the potential between an approximaterange of -0.6 to +1.3 V for Phe, Res, HQ, and Cat, respectively,vs Ag/AgCl(aq) (3 M KCl) at a scan rate of 100 mV/s. It wasseen that Phe and Res gave a completely irreversible peak at+0.777 and +0.814 V, respectively, while HQ and Cat both givea redox peak. The Ep,a and Ep,c for HQ were +0.471 and +0.053V while that for Cat were +0.430 and -0.052 V, respectively.Figure 2 shows the cyclic voltammograms obtained using a plaincarbon paste electrode and 1-CPE based biomimetic sensor in0.1 M phosphate buffer solution (pH 6.0 for Phe and Res; pH 7.0for HQ and Cat). As can be observed, the peak response to theoxidation of phenols on employing 1-CPE was much better thanthat of the PCPE. The probable reaction process could bedescribed using the following equations:
Reaction 1 is irreversible for Phe and Res and reversible for HQand Cat. Cu(II) acts as an electrocatalyst for oxidation of phenols.These reactions are highly facile in the presence of molecularoxygen.
The effect of scan rate on all phenols has been studied (FiguresS-5 and S-6 in the Supporting Information). The straight line plotof ip vs v1/2 reveals that the oxidation of all phenols of interestis diffusion controlled. At different scan rates ranging from 10to 2000 mV/s, it can be seen that the anodic peak shifts to amore positive value for Res, Phe, Cat, and HQ and the cathodic
5987Analytical Chemistry, Vol. 82, No. 14, July 15, 2010

peak for HQ and Cat shifts to the more negative values withincreasing scan rates with a concurrent increase in peakcurrent.
Electro-oxidation of Phe, Res, HQ, and Cat at the PCPE and1-CPE was characterized by employing chronocoulometry for thedetermination of the kinetics and mechanism of electrode reac-tions. The calculated parameters (diffusion coefficient and surfacecoverage) on employing double-potential step chronocoulometry53
have been presented in Table 2. As can be seen from the Table,the value of Qads for 1-CPE are more than that of PCPE,confirming that 1-CPE makes the accumulation of all phenolson the electrode surface more effective.
In an attempt to clarify the difference between electrochemi-cal performance of PCPE and 1-CPE, electrochemical imped-
ance spectroscopy was used. The Nyquist plots54 for PCPE and1-CPE show a significant difference in the response for PCPEand 1-CPE as shown in Figure 4. It reveals that 1-CPEconsiderably affects the surface impedance properties. Asemicircle with a larger diameter is observed for PCPE in thefrequency range of 10-2 to 106 Hz; however, the diameter ofthe semicircle diminished with the employment of modifier1-CPE (Figure 4). This implies that charge transfer resistanceof the electrode surface decreases, and the charge transfer rateincreased on employing 1-CPE. A Warburg at 45° is alsoobserved for both the electrodes.
(53) Anson, F. C. Anal. Chem. 1966, 38, 54–57.
Figure 2. Cyclic voltammograms at scanning electrode potential with 100 mV/s (a) for Phe, 3.54 × 10⁻⁶ M at PCPE (red s) and Cu(II)-PE(blue s) between +0.30 and +1.3 V in phosphate buffer solution (pH 6.0). (b) For Res, 3.54 × 10⁻⁶ M at PCPE (red s) and Cu(II)-PE (blue s)between +0.4 and +1.2 V in phosphate buffer solution (pH 6.0). (c) For HQ, 1 × 10⁻⁶ M at PCPE (red s) and Cu(II)-PE (blue s) between-0.45 and +0.8 V in phosphate buffer solution (pH 7.0). (d) For Cat, 3.54 × 10⁻⁶ M at PCPE (red s) and Cu(II)-PE (blue s) between -0.6 and+1.0 V in phosphate buffer solution (pH 7.0).
5988 Analytical Chemistry, Vol. 82, No. 14, July 15, 2010

Determination of Michaelis-Menten Parameters by Chro-noamperometry. The apparent Michaelis-Menten parameters,viz, Michaelis constant (KM), maximum enzyme velocity (Vmax),
turnover number (kcat), and specificity constant (kcat/KM) werecalculated to study the catalytic effect of 1-CPE on the substrateby employing chronoamperometry in a rapidly stirred solu-tion.55 This approach allowed the 1-CPE catalyzed reaction tobe monitored directly in the solution without a lag-phase. Thecatalysis process is based on diffusion layer approach. Figure5a is a plot of initial rate (derived from the slope of current vstime over the first 0.8 s of chronoamperometric measurement)vs substrate concentration which reveals that the reaction rateincreases linearly at low substrate concentrations. However, athigh substrate concentrations, the Michaelis-Menten process isobeyed which implies an enzyme like catalytic process. Figure5b is a Lineweaver-Burk plot obtained from the data in Figure
(54) Orazem, M. E.; Tribollet, B. Electrochemical Impedance Spectroscopy; Wiley:New York, 2008.
(55) Kamin, A.; Willson, G. S. Anal. Chem. 1980, 52, 1198–1205.
Figure 3. Differential pulse voltammogram at pulse height 50 mV of (a) Phe at PCPE (red s) and Cu(II)-PE (blue s). The concentration of Phe is7.23 × 10-7 M in phosphate buffer solution (pH 6.0). (b) RES at PCPE (red s) and Cu(II)-PE (blue s). The concentration of Res is 1.33 × 10⁻⁶ Mat pulse height 50 mV in phosphate buffer solution (pH 6.0). Square wave voltammogram (c) of HQ at PCPE (red s) and Cu(II)-PE (blue s). Theconcentration of HQ is 1.33 × 10⁻⁷ M at pulse height 50 mV and frequency 100 Hz in phosphate buffer solution (pH 7.0). (d) Cat at PCPE (reds) andCu(II)-PE (blue s). The concentration of Cat is 7.81 × 10⁻⁷ M at pulse height 50 mV and frequency 80 Hz in phosphate buffer solution (pH 7.0).
Table 2. Chronocoulometry Data for 4 × 10⁻⁵ M Phe,Res, HQ, and Cat
molecule electrodeslope
(µC/s-1/2)Qads(µC)
surfacecoverage
(10-10 mol/cm2)
diffusioncoefficient
(10-6 cm2/s)
Phe PCPE 0.083 0.096 1.276 5.91 ± 0.331-CPE 0.352 1.652 5.221 6.09 ± 0.49
Res PCPE 0.089 0.117 1.561 6.93 ± 0.171-CPE 0.379 1.865 5.892 7.02 ± 0.84
HQ PCPE 0.092 0.146 1.937 7.33 ± 0.371-CPE 0.391 1.958 6.186 7.48 ± 0.50
Cat PCPE 0.088 0.152 2.016 6.67 ± 0.381-CPE 0.367 1.898 5.999 6.58 ± 0.41
5989Analytical Chemistry, Vol. 82, No. 14, July 15, 2010

5a. KM and Vmax values were obtained from this plot. Theturnover number (kcat) of the catalyst was determined byrecording the initial rate of the oxidation of substrate (20 µM)in the presence of varying quantities of 1 (ranges 2-300 nmol)until saturation was observed. kcat was calculated employingthe formula Vmax ) kcat[E]t. [E]t is the concentration of theactive sites that is obtained from the number of active sites(Et) within 1. It was observed that the initial rate increaseduntil about 115 nmol of 1 was added to the substrate (Figure
S-11 in the Supporting Information). Since 1 is a dinuclearcomplex, we get Et ) 57.5 nmol in 25 mL of solution which inturn gives [E]t.
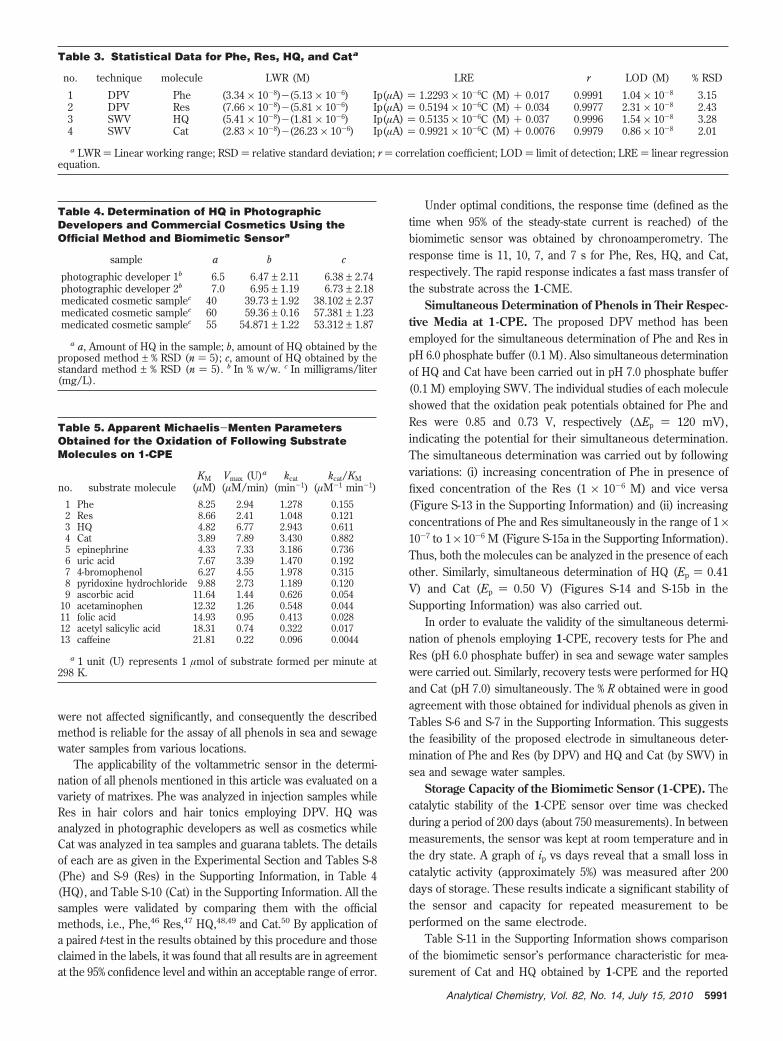
In Table 5, the catalytic activity of various substrates has beendescribed with respect to their kinetic parameters. From thekinetic parameters, it can be seen that catalytic effect of 1 ismaximum on Cat. The order for catalytic effect of 1 on phenolsunder study is Cat > HQ > Phe > Res. Few other molecules, viz.,epinephrine, uric acid, 4-bromophenol, etc., have been employedto study the catalytic effect of 1 on them. Figure S-12 in theSupporting Information shows DPV plots of a few molecules onPCPE and 1-CPE in pH 6.0 phosphate buffer. The values obtainedfor KM, Vmax, kcat, and kcat/KM suggest 1 is an efficient catalystfor substrates having an -OH group.
Interference Studies, Validation, and Sample Analysis.Under optimal experimental conditions, the interferences of somemetal ions and organic compounds especially phenols have beenevaluated. The tolerance limit for interfering species was consid-ered as the maximum concentration that gave a relative error interms of ∆Ip less than ±5.0% at a concentration of 1.0 × 10⁻⁶ Mof Phe, Res, HQ, and Cat. The results are tabulated in TableS-3 in the Supporting Information. Five replicates of eachexperimental set were performed for the calculation of the % RSD.
The statistical parameters are given in Table 3. The detectionlimits were calculated for all the phenols employing the IUPACnomenclature of 3σ, where σ is the standard deviation of the peakcurrents of the blank at oxidation potentials for the respectivephenol. The statistical data is presented in Table 3. The calibrationcurves based on voltammograms (Figures S-7-S-10 in the Sup-porting Information) showed a linear response ranging from ∼10-6
to 10-8 M for all the four analytes with detection limits of 1.04× 10⁻⁸, 2.31 × 10⁻⁸, 1.54 × 10⁻⁸, and 0.86 × 10⁻⁸ M for Phe,Res, HQ, and Cat, respectively.
Repeatability, reproducibility, precision, and accuracy of analy-sis using the proposed procedure were identified by performingfive replicate measurements for standard solutions containing 2.17× 10⁻⁷ M Phe, 1.89 × 10⁻⁷ M Res, 3.09 × 10⁻⁷ M HQ, and 2.55× 10⁻⁷ M Cat over a single day (intraday assay) (n ) 5) andfor 5 days over a period of 1 week (interday assay). Satisfactorymean percentage recoveries (% R) and relative standarddeviations (% RSD) were achieved (Table S-4 in the SupportingInformation). The recoveries obtained confirmed both the highprecision of the proposed procedure and stability of Phe, Res, HQ,and Cat solutions. The robustness of the proposed procedure(Table S-5 in the Supporting Information) was examined bystudying the effect of a small variation of pH from 5.8 to 6.2 (Pheand Res) and 6.8 to 7.2 (HQ and Cat). The effect of varying thefrequency over a narrow range on the recovery was obtained forHQ and Cat. As can be seen from Table S-5 in the SupportingInformation, the % R of Phe, Res, HQ, and Cat were good and didnot show a significant change when the critical parameters weremodified. For further evaluation of the validity of the proposedmethod, the recovery tests for all phenols in sea and sewage waterwere carried out and the results are given in Tables S-6 (seawater)and S-7(sewage water) in the Supporting Information. The varioussuccessive standard additions made are as given in the tables. Itwas observed that average % recovery varied between 98.0 and102% for all phenols in the case of all samples. Recovery results
Figure 4. Nyquist plots for EIS measurements of PCPE (000)and 1-CPE (OOO) in the frequency range 10-2 to 106 Hz. In thebox on the right lower side, an equivalent circuit was used for datafitting.
Figure 5. (a) Michaelis plot showing the initial reaction velocity inenzyme units (U), as determined by chronoamperometry at +0.65 Vafter addition of Cat for 1-CME. (b) Lineweaver-Burk plot for theoxidation of Cat on 1-CME.
5990 Analytical Chemistry, Vol. 82, No. 14, July 15, 2010
were not affected significantly, and consequently the describedmethod is reliable for the assay of all phenols in sea and sewagewater samples from various locations.
The applicability of the voltammetric sensor in the determi-nation of all phenols mentioned in this article was evaluated on avariety of matrixes. Phe was analyzed in injection samples whileRes in hair colors and hair tonics employing DPV. HQ wasanalyzed in photographic developers as well as cosmetics whileCat was analyzed in tea samples and guarana tablets. The detailsof each are as given in the Experimental Section and Tables S-8(Phe) and S-9 (Res) in the Supporting Information, in Table 4(HQ), and Table S-10 (Cat) in the Supporting Information. All thesamples were validated by comparing them with the officialmethods, i.e., Phe,46 Res,47 HQ,48,49 and Cat.50 By application ofa paired t-test in the results obtained by this procedure and thoseclaimed in the labels, it was found that all results are in agreementat the 95% confidence level and within an acceptable range of error.
Under optimal conditions, the response time (defined as thetime when 95% of the steady-state current is reached) of thebiomimetic sensor was obtained by chronoamperometry. Theresponse time is 11, 10, 7, and 7 s for Phe, Res, HQ, and Cat,respectively. The rapid response indicates a fast mass transfer ofthe substrate across the 1-CME.
Simultaneous Determination of Phenols in Their Respec-tive Media at 1-CPE. The proposed DPV method has beenemployed for the simultaneous determination of Phe and Res inpH 6.0 phosphate buffer (0.1 M). Also simultaneous determinationof HQ and Cat have been carried out in pH 7.0 phosphate buffer(0.1 M) employing SWV. The individual studies of each moleculeshowed that the oxidation peak potentials obtained for Phe andRes were 0.85 and 0.73 V, respectively (∆Ep ) 120 mV),indicating the potential for their simultaneous determination.The simultaneous determination was carried out by followingvariations: (i) increasing concentration of Phe in presence offixed concentration of the Res (1 × 10⁻⁶ M) and vice versa(Figure S-13 in the Supporting Information) and (ii) increasingconcentrations of Phe and Res simultaneously in the range of 1 ×10⁻⁷ to 1 × 10⁻⁶ M (Figure S-15a in the Supporting Information).Thus, both the molecules can be analyzed in the presence of eachother. Similarly, simultaneous determination of HQ (Ep ) 0.41V) and Cat (Ep ) 0.50 V) (Figures S-14 and S-15b in theSupporting Information) was also carried out.
In order to evaluate the validity of the simultaneous determi-nation of phenols employing 1-CPE, recovery tests for Phe andRes (pH 6.0 phosphate buffer) in sea and sewage water sampleswere carried out. Similarly, recovery tests were performed for HQand Cat (pH 7.0) simultaneously. The % R obtained were in goodagreement with those obtained for individual phenols as given inTables S-6 and S-7 in the Supporting Information. This suggeststhe feasibility of the proposed electrode in simultaneous deter-mination of Phe and Res (by DPV) and HQ and Cat (by SWV) insea and sewage water samples.
Storage Capacity of the Biomimetic Sensor (1-CPE). Thecatalytic stability of the 1-CPE sensor over time was checkedduring a period of 200 days (about 750 measurements). In betweenmeasurements, the sensor was kept at room temperature and inthe dry state. A graph of ip vs days reveal that a small loss incatalytic activity (approximately 5%) was measured after 200days of storage. These results indicate a significant stability ofthe sensor and capacity for repeated measurement to beperformed on the same electrode.
Table S-11 in the Supporting Information shows comparisonof the biomimetic sensor’s performance characteristic for mea-surement of Cat and HQ obtained by 1-CPE and the reported
Table 3. Statistical Data for Phe, Res, HQ, and Cata
no. technique molecule LWR (M) LRE r LOD (M) % RSD
1 DPV Phe (3.34 × 10⁻⁸)-(5.13 × 10⁻⁶) Ip(µA) ) 1.2293 × 10⁻⁶C (M) + 0.017 0.9991 1.04 × 10⁻⁸ 3.152 DPV Res (7.66 × 10⁻⁸)-(5.81 × 10⁻⁶) Ip(µA) ) 0.5194 × 10⁻⁶C (M) + 0.034 0.9977 2.31 × 10⁻⁸ 2.433 SWV HQ (5.41 × 10⁻⁸)-(1.81 × 10⁻⁶) Ip(µA) ) 0.5135 × 10⁻⁶C (M) + 0.037 0.9996 1.54 × 10⁻⁸ 3.284 SWV Cat (2.83 × 10⁻⁸)-(26.23 × 10⁻⁶) Ip(µA) ) 0.9921 × 10⁻⁶C (M) + 0.0076 0.9979 0.86 × 10⁻⁸ 2.01
a LWR ) Linear working range; RSD ) relative standard deviation; r ) correlation coefficient; LOD ) limit of detection; LRE ) linear regressionequation.
Table 4. Determination of HQ in PhotographicDevelopers and Commercial Cosmetics Using theOfficial Method and Biomimetic Sensora
sample a b c
photographic developer 1b 6.5 6.47 ± 2.11 6.38 ± 2.74photographic developer 2b 7.0 6.95 ± 1.19 6.73 ± 2.18medicated cosmetic samplec 40 39.73 ± 1.92 38.102 ± 2.37medicated cosmetic samplec 60 59.36 ± 0.16 57.381 ± 1.23medicated cosmetic samplec 55 54.871 ± 1.22 53.312 ± 1.87
a a, Amount of HQ in the sample; b, amount of HQ obtained by theproposed method ± % RSD (n ) 5); c, amount of HQ obtained by thestandard method ± % RSD (n ) 5). b In % w/w. c In milligrams/liter(mg/L).
Table 5. Apparent Michaelis-Menten ParametersObtained for the Oxidation of Following SubstrateMolecules on 1-CPE
no. substrate moleculeKM
(µM)Vmax (U)a
(µM/min)kcat
(min-1)kcat/KM
(µM-1 min-1)1 Phe 8.25 2.94 1.278 0.1552 Res 8.66 2.41 1.048 0.1213 HQ 4.82 6.77 2.943 0.6114 Cat 3.89 7.89 3.430 0.8825 epinephrine 4.33 7.33 3.186 0.7366 uric acid 7.67 3.39 1.470 0.1927 4-bromophenol 6.27 4.55 1.978 0.3158 pyridoxine hydrochloride 9.88 2.73 1.189 0.1209 ascorbic acid 11.64 1.44 0.626 0.054
10 acetaminophen 12.32 1.26 0.548 0.04411 folic acid 14.93 0.95 0.413 0.02812 acetyl salicylic acid 18.31 0.74 0.322 0.01713 caffeine 21.81 0.22 0.096 0.0044
a 1 unit (U) represents 1 µmol of substrate formed per minute at298 K.
5991Analytical Chemistry, Vol. 82, No. 14, July 15, 2010

biomimetic sensors.41,42,56,57 The lower limit of detection, low Km
values, short response time, and high Vmax and kcat valuesobtained for 1-CPE suggest better catalytic activity of 1-CPEon Cat and HQ. Moreover 1-CPE has been employed forvarious samples including sea and sewage water, cosmetics,and photographic developers. The presence of newly synthe-sized 1 as a modifier is distinctive to another modified electrodereported earlier due to its potential application as a biomimeticsensor with high sensitivity.
CONCLUSIONSWe have synthesized and fully characterized a new dinuclear
copper(II) complex which contains an alcoholic OH groupcoordinated axially to each copper center forming a Cu2O2
nonplanar ring, which mimics the intermediate proposed in themechanism of catechol oxidation through the enzyme catecholoxidase. The ability of this complex to mimic the active site ofthe enzyme was successfully used to construct a biomimeticsensor. To the best of our knowledge this is the first exampleof an alcoholic -OH group based biomimetic sensor beingdeveloped for trace determination of phenols. This is a first ofits kind sensor where no oxidase or tyrosinase type ligand hasbeen employed as a sensor material.
The method has been applied for the selective and preciseanalysis of Phe in commercial injections, Res in hair coloring
agents, HQ in photographic developers and cosmetics, and Catin tea samples and guarana tablets. This proposed method is freeof common interferences associated with the molecules of interestand consequently is recommended for trace determination of Phe,Res, HQ, and Cat in clinical as well as quality control laboratorieswith great confidence. Moreover, the proposed methods havebeen employed for the trace simultaneous determination of Pheand Res in pH 6.0 phosphate buffer and HQ and Cat in pH 7.0phosphate buffer. This sensor has practical application in quantita-tive analysis of certain acids, vitamins, and drugs having a -OHgroup. Further studies are planned for developing screen printedelectrodes employing 1-CPE for determination of phenols andother substrates considered in the present investigation. Also, thecopper complex (1) has a potential to be employed for trace leveldetection of neurotransmitters, viz., glutamate, dopamine, etc., andeven for peroxide and nitrite.
ACKNOWLEDGMENTA.K.S. and B.J.S. are thankful to the University Grant Com-
mission-Special Assistance Programme, New Delhi, India, forproviding financial assistance for the ongoing project. We are alsograteful to Prof. M. Sudersanan, Adjunct Professor, University ofMumbai, for his valuable suggestions.
SUPPORTING INFORMATION AVAILABLEAdditional information as noted in text. This material is
available free of charge via the Internet at http://pubs.acs.org.
Received for review February 13, 2010. Accepted May 31,2010.
AC1004037
(56) Lakshmi, D.; Bossi, A.; Whitcombe, M. J.; Chianella, I.; Fowler, S. A.;Subrahmanyam, S.; Piletska, E. V.; Piletsky, S. A. Anal. Chem. 2009, 81,3576–3584.
(57) Kafi, A. K. M.; Lee, D.-Y.; Park, S.-H.; Kwon, Y.-S. Thin Solid Films 2008,516, 2816–2821.
5992 Analytical Chemistry, Vol. 82, No. 14, July 15, 2010