Embed Size (px)
Citation preview

BioMetric
Version 1.8 A Terrestrial Biodiversity Assessment Tool for the NSW Property Vegetation Plan Developer
Operational Manual
Gibbons, P., Ayers, D., Seddon, J., Doyle, S. and Briggs, S.
NSW Department of Environment and Conservation
c/- CSIRO Sustainable Ecosystems
GPO Box 284
Canberra ACT 2601
April 2005

BioMetric Tool
© - Copyright - New South Wales Department of Environment and Conservation for and on behalf of the Crown in right of the State of New South Wales 2005.
All rights reserved. No part of the tool (the BioMetric Tool) or this Operational Manual for the BioMetric may be altered in any way without the prior written permission of the Department of Environment and Conservation for and on behalf of the Crown in right of the State of New South Wales, except as permitted under the Copyright Act 1968.
The full Copyright and Disclaimer Statement is in the BioMetric Tool.
Acknowledgments Many people contributed to the development of BioMetric and this Operational Manual. In particular we thank David Parkes and associates whose vision and work over the past decade inspired the development of this Tool. Special thanks to all staff from DIPNR and CMAs involved in the PVP trials that provided invaluable feedback on earlier versions of this Tool, John Benson who provided and allowed us to use his unpublished information on vegetation communities of NSW, staff in DEC's Conservation and Data Assessment Units who compiled and provided information on vegetation communities throughout NSW (Wil Allen, Tom Barrett, Mark Cameron, Shawn Capararo, Daniel Connolly, Phil Gilmour, Tim Hager, Miranda Kerr, Paul Sheringham and Jill Smith), staff in other parts of DEC, particularly John Briggs, Peter Christie, Peter Richards, John Turbill, Geoff Robertson, Shane Ruming, David Keith, Keith McDougall, Rainer Rehwinkel, Mike Fleming and Ron Haering whose inputs considerably improved the Tool, and staff in the Department of Infrastructure Planning and Natural Resources, Forests NSW and various Catchment Management Authorities, including Doug Binns, Roger Oxley, Donna Hazell, Ian Oliver, Darren Shelley, Alan Ede, James Val, Michael Dunn, Wendy Hawes, Dominic Siversten, Ross Peacock, Megan McNellie, Terry Mazzer, Ken Turner, Phil Redpath, David Russell and Steve Lewer who provided benchmarks. We also thank Miles Boak, Simon Ferrier, Michael Drielsma, Julie Ravallion, Michael Saxon, Julianne Smart, Gary Howling, Kevin Roberts, Klaus Koop, Jim Booth, Simon Smith, Peter Cosier and stakeholder representatives for their input. Last, we thank colleagues at CSIRO Sustainable Ecosystems and our other scientific colleagues who, with good humour and understanding, tolerated our withdrawal from pre-existing commitements over the last year.
2

BioMetric Tool
Summary This Manual is a guide for using BioMetric. BioMetric is an Excel™ tool used to assess the impacts (positive and negative) on terrestrial biodiversity of applications for clearing and applications for incentives in native vegetation under the NSW Native Vegetation Act (2003). BioMetric assesses the value of native vegetation for terrestrial biodiversity at the national, regional, landscape and site scales. BioMetric is used in conjuction with: a GIS tool that maps features of proposals; tools that assess threatened species, soils, salinity, water quality and invasive native scrub; a tool that collates this information into a Property Vegetation Plan; and a system that databases this information. Proposals to clear native vegetation Clearing of native vegetation is permitted under the NV Act if it improves or maintains environmental outcomes. In BioMetric no further clearing of native vegetation is permitted in vegetation types or landscapes that are already overcleared or listed as threatened at the national, regional or landscape scales, unless the vegetation is in low condition. Other native vegetation can only be cleared if losses from proposed clearing can be offset by commensurate long-term gains from management. Offsets can only improve or maintain environmental outcomes if: a) offsets are in vegetation types of equal or greater Regional Value (the
conservation status of the vegetation type) to the vegetation proposed for clearing; AND
b) improvement in Landscape Value (the configuration of vegetation) from the offset are commensurate with losses in Landscape Value brought about by proposed clearing; AND
c) improvement in Site Value (the quality and quantity of vegetation) from the offset are commensurate with losses in Site Value from proposed clearing.
Proposals to obtain incentive funding for native vegetation management Applications for incentive funding under the NV Act are assessed using the same criteria as applications for clearing (i.e., Regional Value, Landscape Value and Site Value) with the addition of measures for the duration of management commitment and a threatened species index which is taken from a separate Threatened Species Tool. Unlike clearing proposals, incentive proposals are summarised into a single metric, or score, for terrestrial biodiversity value that combines the above elements. This single metric facilitates the option of using market-like instruments to disseminate incentive funding. However, the way in which this metric is used to allocate incentives is not a subject covered in BioMetric.
3

BioMetric Tool
Contents
1 INTRODUCTION 6
1.1 The NSW Native Vegetation Act (2003) 6
1.2 Proposals for clearing native vegetation 6
1.3 Proposals for incentive funding 7
2 AN OUTLINE OF THE ASSESSMENT PROCESS 7
2.1 Resources required to complete an assessment 7
2.2 Prior to the site inspection 9
2.3 The site inspection 10 2.3.1 Proposals to clear native vegetation 10 2.3.2 Proposals to thin native vegetation 11 2.3.3 Incentive PVPs 11
3 A STEP-BY-STEP GUIDE TO RUNNING BIOMETRIC 12
3.1 Introduction 12
3.2 Step 1 - PVP type 13 3.2.1 What is the PVP number generated by the PVP Mapper? 13 3.2.2 What is the CMA? 13 3.2.3 What is the nature of the proposal? 13 3.2.4 Clear all data 13
3.3 Step 2 - Can assessment proceed? 13 3.3.1 How many vegetation zones in proposal? 14 3.3.2 Zone 14 3.3.3 Low condition? 14 3.3.4 Mitchell Landscape 15 3.3.5 Vegetation formation 16 3.3.6 Vegetation type 16 3.3.7 Threatened ecological community? 17 3.3.8 Can PVP assessment proceed for zone? 17
3.4 Step 3 – What are the impacts of clearing? 18 3.4.1 Regional Value 18 3.4.2 Landscape Value 18 3.4.3 Site Value 23
3.5 Step 3b - Can thinning proceed without offsets? 26 3.5.1 Vegetation types 26 3.5.2 Zones 26
3.6 Step 4 - Can the impacts of clearing be offset? 27
4

BioMetric Tool
3.6.1 Regional Value 27 3.6.2 Landscape Value 27 3.6.3 Site Value 28
3.7 Step 5 – Incentives 29 3.7.1 Regional Value 30 3.7.2 Landscape Value 30 3.7.3 Site Value 30 3.7.4 Threatened Species 30 3.7.5 Duration of Commitment 30
3.8 Step 6 – Summary of BioMetric assessment 31 3.8.1 Detailed description of agreed action 31 3.8.2 Duration 31
4 REFERENCES 32
5 GLOSSARY 34
APPENDIX 1 OBTAINING BENCHMARKS FROM REFERENCE SITES, WHERE NO DATA ARE CURRENTLY AVAILABLE 37
APPENDIX 2 PER CENT COVER OF NATIVE VEGETATION AT THE LANDSCAPE SCALE 39
APPENDIX 3 FIELD METHODOLOGY FOR MEASURING CONDITION VARIABLES IN SITE VALUE 40
APPENDIX 4 GUIDELINES FOR ASSESSING THE IMPACTS OF MANAGEMENT ACTIONS ON SITE VALUE 45
APPENDIX 5 RIPARIAN ZONES AND BUFFERS - DEFINITIONS 50
APPENDIX 6 GUIDE TO AVERAGE HECTARES OF OFFSET REQUIRED 51
APPENDIX 7 EXPLANATION OF THE PADDOCK TREE CALCULATOR 52
5

BioMetric Tool Introduction
1 Introduction
This Manual is a guide for using BioMetric. BioMetric is an Excel™ tool that provides a quantitative assessment of the impacts (positive and negative) to terrestrial biodiversity of management activities. This tool, in conjunction with other tools that map native vegetation, assess threatened species, invasive native scrub, soils, water quality and salinity, is used to underpin the preparation of Property Vegetation Plans (PVPs) under the NSW Native Vegetation Act (2003). BioMetric assesses losses of biodiversity from proposed clearing (including thinning), gains in biodiversity from proposed offsets, and gains in biodiversity from management actions proposed for incentives. BioMetric is a tool for assessing terrestrial biodiversity at the scale of the patch, paddock or property - it is not a planning tool. Neither the BioMetric nor this Manual deals with assessments of threatened species, invasive native scrub, water quality, soils or salinity. BioMetric does not deal with private native forestry, clearing for routine agricultural management activities, continuation of existing farming activities, or clearing of regrowth.
1.1 The NSW Native Vegetation Act (2003) Property Vegetation Plans are developed under the NV Act (2003). The objects of the NV Act (2003) are:
a) to provide for, encourage and promote the management of native vegetation on a regional basis in the social, economic and environmental interests of the State, and
b) to prevent broadscale clearing unless it improves or maintains environmental outcomes, and
c) to protect native vegetation of high conservation value having regard to its contribution to such matters as water quality, biodiversity, or the prevention of salinity or land degradation, and
d) to improve the condition of existing native vegetation, particularly where it has high conservation value, and
e) to encourage the revegetation of land, and the rehabilitation of land, with appropriate native vegetation, in accordance with the principles of ecologically sustainable development.
Under the NV Act (2003) PVPs may be submitted by landholders for native vegetation management. Among other things, PVPs may provide for:
a) proposals for clearing native vegetation on the land, and b) proposals to enable landholders to obtain financial incentives for managing
natural resources, including funding native vegetation management activities by Catchment Management Authorities (CMAs).
1.2 Proposals for clearing native vegetation Proposals for clearing (including thinning) native vegetation generally fall into one of the following categories:
6

BioMetric Tool Introduction
• ‘green’ category - actions that improve or maintain environmental outcomes in their own right and can be undertaken without offsets or mitigating actions (thinning native vegetation to benchmark stem densities for that vegetation type falls within this category)
• ‘amber’ category - actions that usually require offsets or mitigating actions to improve or maintain environmental outcomes (offsets that provide gains equal to, or exceeding, losses from clearing subsequently fall into the ‘green’ category)
• ‘red’ category - actions that cannot be undertaken as they do not improve or maintain environmental outcomes (clearing native vegetation with high conservation value, i.e. vegetation not in low condition and of a type, or within a landscape, that is highly cleared, falls into this category as do offsets that do not provide gains equal to, or exceeding, losses from clearing).
A flow chart outlining the framework for assessing proposals to clear native vegetation is in Figure 1.
1.3 Proposals for incentive funding A score, or metric, is allocated to incentive proposals based on the existing biodiversity value of the site and the predicted biodiversity value of the site with proposed management inputs. This score is calculated using similar data to that used to assess proposals to clear native vegetation. The mechanism for allocating funds is external to the assessment process in BioMetric.
2 An outline of the assessment process
This section outlines the process for assessing proposals to clear, thin or obtain financial incentives for, native vegetation using BioMetric. BioMetric incorporates the following steps (details of which are provided in the next section): Step 1. PVP type Step 2. Can assessment proceed? Step 3. What are the impacts of clearing? Step 3b. Can thinning proceed without offsets? Step 4. Can the impacts of clearing be offset? Step 5. Incentives Step 6. Summary of BioMetric assessment.
2.1 Resources required to complete an assessment The following resources are required to complete an assessment using BioMetric:
hard copy of the BioMetric Operational Manual laptop computer loaded with the PVP Developer software (note that BioMetric
works best with the computer screen resolution set to 1024x768) orthorectified digital imagery for the property extending a distance of at least
1.75km from the property boundary a digital layer of any vegetation mapping in the study area is desirable hard copy printout of imagery for the proposal that can be annotated.
7

BioMetric Tool Outline of assessment process
Y
Vegetain ‘lo
conditi
Overclevegeta
type landsc
Permittexcluded as definedor Regul
N
Y
Approved
‘Remnant’ as defined in Act
Y Riparvegeteta
Threateecolog
commu
Y
Not approved
START
N Does proposal
(and offset where Not
Figure 1. Flow chart of the assessflowchart are in BioMetric. Stepsthreatened species, water qualitytools.
Y
N
N
tion w on’?
ared tion or ape?
ed or clearing in Act
ations?
ian tion?
N
ned ical nity?
N
N
Y
Y
relevant) improve or maintain
biodiversity?
Approved
Approved with appropriate offset and management actions
ment process for clearing in a PVP. Unshaded steps in the shaded grey are not assessed using BioMetric. Note that
, soils, salinity and invasive native scrub are assessed using other
8

BioMetric Tool Outline of assessment process
hard copy data entry sheets (templates available at http://www.nationalparks.nsw.gov.au/npws.nsf/Content/BioMetric_tool) (these can be customised as required)
printed copy of relevant vegetation types and definitions for the CMA from BioMetric (i.e. there are descriptions of each vegetation type in the CMA in BioMetric that can be formatted as required). These are also available on the website listed above
definitions of potential Threatened Ecological Communities (TECs) that may occur on the site listed under the Threatened Species Conservation Act (http://www3.environment.nsw.gov.au/npws.nsf/Content/Threatened+Species+Search and search for Ecological Communities), and Environmental Protection and Biodiversity Conservation Act (http://www.deh.gov.au/cgi-bin/sprat/public/publiclookupcommunities.pl)
relevant benchmarks for vegetation condition from http://www.nationalparks.nsw.gov.au/npws.nsf/Content/BioMetric_tool or from reference sites
Global Positioning System (GPS) receiver 2 x 50m measuring tapes and tent/surveyors pegs to secure tape ends small measuring tape/diameter tape clipboard and pencils digital camera (not essential) plant identification books if required (native and weeds) portable printer to leave preliminary copies of PVP with landholder if feasible.
2.2 Prior to the site inspection Background work done prior to the site inspection will reduce the amount of time spent at the site. An initial visit to the site prior to the inspection proper may be desirable. BioMetric can be used to do a desk-top simulation of proposals to obtain indicative results, however, all assessments must be ultimately validated with field data. The suggested actions prior to the site inspection are as follows: 1. Refer to the BioMetric website for the most recent versions of supporting
documentation and data (http://www.nationalparks.nsw.gov.au/npws.nsf/Content/BioMetric_tool).
2. At first contact with the landholder obtain as much information about the proposal as possible (i.e. boundaries and areas of proposal including offsets if relevant, vegetation types and general condition of vegetation in proposal areas, and proposed nature and impact of clearing on all zones that form the proposal). Inform the landholder about offsets (i.e. that offsets must provide a gain in biodiversity that is equivalent to the expected loss in biodiversity from development and must be located in a similar vegetation type to the development site). This step could require an initial visit to the site.
3. Use the PVP Mapper to place the approximate location of the proposal area in the Mitchell Landscape layer and any available vegetation maps to determine whether the proposal is likely to be in an over-cleared landscape or over-cleared vegetation type and therefore could be a “Red light”. Vegetation maps are usually too coarse for reliably showing vegetation types at the scale of the patch or paddock, so the actual vegetation types must be confirmed during a site visit. However, vegetation maps may indicate vegetation types likely to be at the site.
4. Undertake as much of the assessment as possible in the office using the PVP Mapper and BioMetric and available data prior to the site inspection.
9

BioMetric Tool Outline of assessment process
5. If sufficient information has been provided to indicate that the proposal will be unsuccessful as it stands, then consider discussing with the landholder prior to the site inspection.
6. Print a hard copy of the orthorectified image with property boundary, riparian areas, proposal area (if known) and Mitchell Landscape boundaries marked on it. Annotate each Mitchell Landscape with its per cent cleared estimate (obtained from Step 1 in BioMetric). Consider printing the 0.2, 0.55 and 1.75km radii circles on a transparency at the same scale as the image/photo for overlaying in the field (see Step 3).
7. Print hard copies of all data sheets from BioMetric for completion in the field. 8. Print a copy of the relevant vegetation type definitions from BioMetric. 9. If data have been entered into BioMetric, save a copy of the preliminary
assessment on the laptop in the PVP Developer and take it to the site inspection.
2.3 The site inspection A suggested order of assessment using BioMetric for each type of PVP (Clearing, Clearing (thinning only), and Incentives) is provided in this section (the actual order of assessment will be at the discretion of the site assessor, and will depend on information gleaned prior to the site inspection, availability of facilities to use a laptop computer and the complexity of the assessment). The process detailed below is based on the assumption that data are initially entered in field sheets printed from BioMetric and a laptop computer is not used until the end of the assessment (i.e. either at the homestead or back at the assessor’s office). However, data can be entered into the laptop at any stage through the assessment if conditions allow. 2.3.1 Proposals to clear native vegetation The steps for assessing proposals to clear native vegetation in the field are: 1. Outline the process with the landholder or proponent. 2. Map the proposal area(s) on the hard copy aerial photo or satellite image with the
landholder. 3. Walk and/or drive around the proposal area, identify and map the discrete
vegetation zones on the hard copy aerial photo or satellite image (see Step 2, below, for definitions of zone).
4. Collect required field information for each zone and record in the relevant field data sheet (see Step 2).
5. If the application is a “Red light” (see Step 2 for criteria) then discuss options with the landholder (e.g. modifying the proposal, considering incentives). The assessment for biodiversity for the current clearing proposal is complete if an application is determined to be a “Red light” at this point.
6. If the proposal is not a “Red light” then record the necessary plot data for each zone in the relevant field data sheet (see Step 3, below).
7. If facilities for using a laptop computer are available then transpose data from the data sheets into BioMetric at the property and discuss the offset requirements.
8. If facilities for using a laptop computer are not available then discuss the likely offset requirements with the landholder and undertake Step 4 of BioMetric on the offset site(s) using the relevant data sheets. This process is similar to steps 2-5 (above). If it is determined in the field that the offset is inadequate during Step 4 then this should be discussed with the landholder. If no feasible options are available then the assessment for biodiversity is complete for the proposal being
10

BioMetric Tool Outline of assessment process
assessed. Necessary data for the PVP should then be entered in the laptop to verify the results.
9. If all information has been collected on the site, and there are indoor facilities available, then complete Step 6 of BioMetric, and print a draft PVP on site. The advantage of running BioMetric at the site is that any modifications to the proposal can be discussed and tested on site without a further site visit.
10. If the assessment cannot be completed on site then complete the above step in the CMA office. Discuss the results with the landholder via telephone or arrange another meeting. If the proposal is unsuccessful discuss options.
11. Obtain the appropriate clearance for the assessment before finalising the PVP. 2.3.2 Proposals to thin native vegetation The steps for assessing proposals to thin native vegetation in the field are: 1. Outline the process with the landholder or proponent. 2. Map the proposal area(s) on the hard copy aerial photo or satellite image with the
landholder. 3. Walk and/or drive around the proposal area, identify and map the discrete
vegetation zones on the hard copy aerial photo or satellite image (see Step 2, below, for definitions of zone) and record relevant data in field data sheets.
4. If there are indoor facilities available, then enter relevant data on benchmark stem densities for each vegetation type using information provided at the BioMetric website (http://www.nationalparks.nsw.gov.au/npws.nsf/Content/BioMetric_tool), or collected by the assessor on good condition reference sites. If the landholder wishes to thin below the benchmark then the assessment must continue as a clearing proposal as outlined in Section 2.3.1
5. Complete Step 6 of BioMetric, and print a draft PVP on site if feasible to do so. The advantage of running BioMetric at the site is that any modifications to the proposal can be discussed and tested on site without a further site visit.
6. If the assessment cannot be completed on site then complete the above two steps in the CMA office. Discuss the results with the landholder via telephone or arrange another meeting.
7. Obtain the appropriate clearance for the assessment before finalising the PVP. 2.3.3 Incentive PVPs 1. Outline the process with the landholder or proponent. 2. Map the proposal area(s) on the hard copy aerial photo or satellite image with the
landholder. 3. Walk and/or drive around the proposal area, identify and map the discrete
vegetation zones on the hard copy aerial photo or satellite image (see Step 2, below, for definitions of zone).
4. Collect required field information for each zone and record in the relevant field data sheets (see Step 5).
5. If facilities for using a laptop computer are available then transpose data from the data sheets into BioMetric at the property.
6. If all information has been collected on the site, and there are indoor facilities available, then complete Step 6 of BioMetric, and print a draft PVP on site. The advantage of running BioMetric at the site is that any modifications to the proposal can be discussed and entered on site without a further site visit.
7. If the assessment cannot be completed on site then complete the above step in the office and provide a copy to the landholder.
11

BioMetric Tool Outline of assessment process
8. Obtain the appropriate clearance for the assessment and submit to the relevant incentive process for the CMA.
9. Formally notify the landholder as soon as results are available regarding funding.
3 A step-by-step guide to running BioMetric
The following sections describe how to work through the steps in the BioMetric tool.
3.1 Introduction
This section of BioMetric contains basic instructions, copyright information and a link to a Disclaimer statement. When opening BioMetric you must select “Enable Macros”. BioMetric works optimally with the computer screen resolution set to 1024x768 . For new assessments always begin with a blank copy of the tool. Note these important points:
• Data are entered in white cells only. • Any changes to data entry in drop-down cells should be made only after
deleting the previous entry. • Do not cut and paste data into drop-down cells.
12

BioMetric Tool Running BioMetric
3.2 Step 1 - PVP type
3.2.1 What is the PVP number generated by the PVP Mapper? Type in the application number generated by the PVP Mapper. 3.2.2 What is the CMA? Select the CMA in which the proposal occurs from the drop-down list. All subsequent data for the assessment in BioMetric will be linked to this CMA. 3.2.3 What is the nature of the proposal? Select the type of PVP from the drop-down list (the options are Clearing, Clearing (thinning only), Incentive or Continuous Use). The subsequent step in BioMetric differs with the type of PVP. BioMetric must be run separately for different types of PVP. If the application is for continuous use then further assessment using BioMetric is not required. 3.2.4 Clear all data This button clears all data from BioMetric. Any data that is not saved will be lost.
3.3 Step 2 - Can assessment proceed?
13

BioMetric Tool Running BioMetric
This step identifies clearing proposals that can, and cannot, proceed from the outset. Native vegetation cannot be cleared if it: (a) occurs in an over-cleared landscape (>70% of native vegetation in Mitchell landscape cleared), OR (b) is an over-cleared vegetation type (>70% of vegetation type in the CMA is cleared), OR (c) is a threatened ecological community (as listed on the TSC Act or EPBC Act) AND (c) is NOT in low condition. Vegetation that is in low condition can be assessed further for clearing. 3.3.1 How many vegetation zones in proposal? Select the number of zones (defined below) in the proposal from the drop-down list. Unwanted zones are hidden from view. The tool accepts up to 10 zones. If a proposal has more than 10 zones then it must be assessed as multiple proposals. 3.3.2 Zone The development proposal must be divided into relatively homogenous or discrete zones for assessment. Each zone should represent a distinct vegetation type (according to the vegetation types provided in BioMetric) and broad condition state (vegetation in low condition must always form a separate zone to vegetation not in low condition). Zones within proposals do not need to be continuous (i.e. a single zone could occupy two or more discrete areas). Each zone must be >0.25ha in area (equivalent to 50mx50m). These zones should be digitized and labelled using the PVP Mapper, and the same zone labels entered into BioMetric. An example of a clearing proposal divided into zones is provided in Figure 2.
Figure 2. An example of how an area proposed for clearing (proposal area) should be broken into relatively homogeneous vegetation zones before commencing the assessment. This proposal has been broken into three zones: Zone 1, bounded by blue, is essentially cleared and was determined to be a single vegetation type; Zone 2, bounded by green, appears to be a distinct vegetation type that is in a broadly uniform condition state; and Zone 3, bounded by red, is the same vegetation type as in Zone 1, but is in a different condition state.
3.3.3 Low condition? If the vegetation on the proposal site meets the definition of “low condition” then the assessment progresses to the next step regardless of whether the landscape and/or
14

BioMetric Tool Running BioMetric
vegetation type are highly (>70%) cleared. Vegetation in low condition has a high likelihood of not being viable in the long-term under current management, so an offset that improves long-term viability of other vegetation is appropriate. Definitions of vegetation in “low condition” are provided in Box 1. Box 1. Definitions for native vegetation in low condition.
A. Native woody vegetation is in low condition if: The over-storey per cent foliage cover is <25% of the lower value of the over-storey per cent foliage cover benchmark for that vegetation type AND <50% of vegetation in the ground layer is indigenous species or >90% is ploughed or fallow. B. Native grassland, shrubland, wetland or herbfield in low condition if: <50% of vegetation in the ground layer is indigenous species or >90% is ploughed or fallow. Notes: Only patches of vegetation >0.25ha are assessed separately (as distinct zones) from surrounding vegetation (e.g. a patch of vegetation with benchmark over-storey cover that is <0.25ha is not assessed separately from surrounding vegetation with sparser over-storey cover). The ground layer must be assessed using a method consistent with the Regulation or the method detailed in Appendix 3. The over-storey is assessed using one of the methods in Appendix 3. 3.3.4 Mitchell Landscape Native remnant vegetation cannot be cleared if it: occurs in a Mitchell Landscape that is >70% cleared and is NOT in low condition (see definitions of low condition in Box 1). The analysis of % cleared by Mitchell Landscape type was undertaken by overlaying the NSW Landscapes coverage (Mitchell 2002) with a presence/absence layer of native vegetation in NSW - an updated version of the layer developed by Pressey et al. (2000) called “SCMP Presence/Absence Vegetation” (NSW National Parks and Wildlife Service 2002). Identify the Mitchell Landscape in which the site occurs using the NSW Landscapes coverage (Mitchell 2002) loaded in the PVP Mapper. Mitchell Landscapes were mapped at a broad scale (1: 250,000) so the Landscape in which a proposal occurs may not always be the landscape mapped (e.g. where the proposal occurs near the boundary of landscapes). The Mitchell Landscape chosen from the drop-down list in BioMetric can be different from the Landscape indicated by the map in the PVP Mapper if the description of an adjacent Landscape more accurately reflects the environment in which the proposal occurs. Field descriptions of Mitchell Landscapes are loaded into BioMetric to enable this and are accessed by selecting the
15

BioMetric Tool Running BioMetric
“Descriptions” button. When a Mitchell Landscape is selected BioMetric will look up the per cent of native vegetation cleared in this Landscape (this figure is provided to the right of screen). This figure can be annotated on the hard copy image printed for the site assessment. 3.3.5 Vegetation formation Next the assessor selects the vegetation formation (Keith 2004) present in each zone to identity the list of possible vegetation types that will occur on the site. Select the vegetation formation that best matches the vegetation in the zone from the drop-down list (the “Definitions” button links to a key to the vegetation formations). If the vegetation is in low condition an expert judgment as to the vegetation formation that originally occupied the site must be made in the field based on the pattern of surrounding vegetation types at similar positions in the landscape. Do not use predicted pre-clearing vegetation maps to make this decision without field inspection. 3.3.6 Vegetation type Remnant native vegetation cannot be cleared if it is a vegetation type that is >70% cleared and NOT in low condition (see definitions in Box 1). The National Objectives and Targets for Biodiversity 2001-2005 Agreement (Commonwealth of Australia 2001) signed by NSW, and the Natural Heritage Trust Bilateral Agreement (2003) signed between NSW and the Commonwealth for the provision of NHT funding require NSW to prevent clearing of ecological communities that are already >70% cleared. The vegetation type closest to the vegetation at the site or likely to have originally occurred at the site (i.e. pre-clearing, or pre-1750) must be selected from the drop-down list. That is, the vegetation type should be the original vegetation type at the site, not the derived vegetation type. Derived vegetation types can be selected from the list only where the original vegetation type cannot be determined. Vegetation types are an expression of environmental continua (Austin 1999) and therefore change continuously across a landscape. However, dividing vegetation into discrete communities is required for management. Some vegetation types observed in the field will not fit neatly into any of the vegetation types listed for a CMA in BioMetric (e.g., where the vegetation lies in an ecotone between two types). In these cases professional judgement is required regarding the closest matching vegetation type in BioMetric. Vegetation type is used in BioMetric as a surrogate for regional conservation value. Thus, the vegetation type chosen from the list in BioMetric should reflect this. For example, a site containing a mix of plant species typical of vegetation in flat, productive and highly cleared environments and plant species typical of steeper, less productive and less cleared environments should be classified as the vegetation type that is more typical of the environment supporting the vegetation. The lists of vegetation types were assembled for each CMA based on best available data for each region (see the field definitions provided in BioMetric for a list of sources). Only sources that provided % cleared estimates could be used. A major review of vegetation types in NSW is underway by John Benson of the Royal Botanic Gardens. A link to definitions for each vegetation type within the chosen CMA is provided via the “Field Definitions” button (Figure 3). This list can be filtered or formatted as required. A list of vegetation types should be printed for use in the field
16

BioMetric Tool Running BioMetric
(or a subset comprising those vegetation types likely to be present at the proposal). Estimates of % remaining for the vegetation type selected (rounded to the nearest 5%) can be seen to the right of the screen in Step 2. These estimates are also provided with the field definitions.
Figure 3. An example of field definitions provided for vegetation types within a CMA.
3.3.7 Threatened ecological community? Vegetation that is a threatened ecological community AND is NOT in low condition (see definitions in Box 1) cannot be cleared. Determine whether the vegetation type is a threatened ecological community by referring to definitions in the TSC Act (http://www3.environment.nsw.gov.au/npws.nsf/Content/Threatened+Species+Search and search for Ecological Communities) and the EPBC Act (http://www.deh.gov.au/cgi-bin/sprat/public/publiclookupcommunities.pl). A full list of threatened ecological communities and their definitions should be assembled for the CMA prior to commencing assessments. This list should be updated periodically from the above websites. 3.3.8 Can PVP assessment proceed for zone? A development proposal can only proceed to the next step if the answer to this question is “Yes” for all zones. If “Yes” is not answered in all zones, then the proposal must be revised for the assessment to continue. The assessor should ensure that the rows are filled from the top if the assessment proceeds (i.e. do not leave any blank rows above rows populated with data). If a change to the proposal is made delete the existing data for that row and re-enter the new data or an error will occur (this is a limitation associated with Excel and the Data Validation command).
17

BioMetric Tool Running BioMetric
3.4 Step 3 – What are the impacts of clearing?
The impacts of clearing are assessed in terms of Regional Value (the vegetation type), Landscape Value (the configuration of vegetation) and Site Value (the quality and quantity of vegetation). These impacts are summarised in the fixed yellow pane at the top of the screen (note that if there is no impact of clearing at the scale of the site it follows that there cannot be an impact at the scale of the landscape or region). Negative impacts are represented by negative numbers. 3.4.1 Regional Value
Regional Value is based on the relationship between the % cleared of the vegetation types on the site relative to their pre-European (or pre-1750) extent within each CMA. A score is allocated based on the relationship between % cleared and a generic species area curve (Rosenzweig 1995). The area of each zone (in hectares obtained from the PVP Mapper) must be entered. Vegetation formation and type information for each zone are automatically transferred from Step 2. 3.4.2 Landscape Value
Landscape Value is an assessment of the spatial configuration of vegetation, viz. total cover, connectivity and adjacency of native vegetation up to 1000ha around the proposal. For each measure (except Total adjacent remnant area) there is one assessment of the current state of the landscape around the entire proposal and one assessment of the state of the landscape were the proposal to proceed. The measures of Landscape Value are: 1. % native vegetation cover in the landscape. Current native vegetation cover and
native vegetation cover after clearing must be assessed within radii of 1.75km (1000ha), 0.55km (100ha) and 0.2km(10ha) around the proposal site. Cover is estimated in categories of 0-10%, 11-30%, 31-70%, or >70% cover using the imagery in the PVP Mapper or on the hard copy printouts. These percentages represent thresholds at which fragmentation effects generally escalate for
18

BioMetric Tool Running BioMetric
different biota (Andren 1994, McIntyre et al. 2000). The different radii recognise that different biota range over, and are affected by, activities at different scales. Broader scales are assessed by other measures. Tools in the PVP Mapper draw circles with these three radii. Each circle should be centred so it captures the maximum area of the proposal (see Figure 4). Non-contiguous proposals should be split into separate proposals if they cannot be completely contained within the largest circle (see Figure 4). Appendix 2 contains diagrams to assist with visual estimates of native vegetation cover in landscapes. Digitising tools in the PVP Mapper can be used to estimate the area of cover within any given circle if it lies close to a threshold that cannot be confidently assessed by eye. Cover estimates in woody vegetation are based on the % cover of the overstorey relative to the approximate benchmark for that vegetation type. For example, a completely vegetated circle with benchmark overstorey cover around the proposal would be assessed as >70% cover whether it is open woodland or closed forest. However, if the cover still occurred across the whole circle, but was around 30-70% of the benchmark overstorey cover for that vegetation (e.g. because of thinning) then the estimate of cover would be 30-70%. In non-woody vegetation (e.g. grassland) the assessment is based on the amount of vegetation in the landscape that is unlikely to meet the definition of low condition. These estimates can be made from the imagery and knowledge of the area. Any vegetation native to Australia can contribute to this measure (i.e. planted native species not indigenous to the area can contribute to this measure).
2. Connectivity value. This measure aims to assess the impact of the proposal on connectivity between surrounding vegetation. Assess the current connectivity value of the proposal area and the connectivity value with the proposal using the imagery of the site in the PVP Mapper as one of four levels: high, moderate, low, and nil, using the criteria in Table 1. Examples are provided in Figure 5 to assist with the assessment. The change in connectivity value that would occur were the proposal to proceed is used in BioMetric to calculate the impact of the proposal in this respect.
19

BioMetric Tool Running BioMetric
Figure 4. Examples illustrating how to assess % native vegetation cover in the landscape for different proposals (outlined in bold). Each circle in which cover is assessed must be centred so it captures the maximum area of the proposal. Non-contiguous proposals should be split into separate proposals if they are not completely contained within the largest circle.
20

BioMetric Tool Running BioMetric
Table 1. Criteria for assessing connectivity value. Where the proposal includes multiple types of vegetation, choose the highest connectivity value that pertains to vegetation within the proposal. Vegetation is linked to surrounding native vegetation if it is ≤100m from native vegetation that is, in turn, linked to native vegetation not in low condition and ≥1ha. Any gap >100m within a proposal means that the vegetation is not linked. Low condition is as defined in Box 1, Section 3.3.3. Connectivity
value Current With proposal
High The proposal includes vegetation that: • is not in low condition • has an average width >100m, and • links to surrounding native
vegetation on more than one compass quarter of the proposal.
At least one high connectivity value vegetation link is maintained (following clearing) or created (by the offset or incentive proposal) between surrounding native vegetation on more than one compass quarter.
Moderate The proposal includes vegetation that: • is not in low condition, • has an average width of >30m-
100m, and • links to surrounding native
vegetation on more than one compass quarter of the proposal.
At least one moderate connectivity value vegetation link is maintained (following clearing) or created (by the offset or incentive proposal) between surrounding native vegetation on more than one compass quarter.
Low The proposal includes vegetation that: • is in low condition, • has an average width >100m, and • links to surrounding native
vegetation on more than one compass quarter of the proposal; OR
The proposal includes vegetation that: • is not in low condition • has an average width ≥5m-30m,
and • links to surrounding native
vegetation on more than one compass quarter of the proposal.
The proposal includes vegetation that: • links to surrounding native
vegetation via exotic vegetation with similar structure to the proposal on more than one compass quarter.
At least one low connectivity value vegetation link is maintained (following clearing) or created (by the offset or incentive proposal) between surrounding native vegetation on more than one compass quarter.
Nil The proposal includes vegetation that meets none of the above definitions.
No links between vegetation surrounding proposal that meet any of the above criteria will be maintained (following clearing) or created (by the offset or incentive proposal).
21

BioMetric Tool Running BioMetric
Example clearing proposal Current With clearing
Moderate, because the vegetation in the proposal area: • is not in low condition, • has an average width
of >30-100m, and • is linked to
surrounding native vegetation on two compass quarters.
Nil, because no link (of any connectivity value) will be maintained between the surrounding areas of native vegetation following clearing of the proposal area.
Low, because the vegetation in the proposal area: • is in low condition, • has an average width
>100m, and • is linked to
surrounding native vegetation on 4 compass quarters.
Low, because a low connectivity value vegetation link will be maintained between surrounding remnants following clearing of the proposal area.
Low, because the vegetation in the proposal area: • links to other native
vegetation via exotic vegetation with similar structure to the proposal (i.e. exotic pine plantation) on 3 compass quarters.
Low, because a low connectivity value link will be maintained between surrounding native vegetation remnants (≥1ha) via exotic vegetation with similar structure (i.e. exotic pine plantation) following clearing of the proposal area.
High, because the vegetation in the proposal area: • is not in low condition • has an average width
>100m, and • is linked to
surrounding native vegetation on 3 compass quarters.
Moderate, because one vegetation link of moderate connectivity value (i.e. not in low condition and >30m-100m wide) will be maintained between the areas of surrounding native vegetation following clearing of the proposal area.
High, because the vegetation in the proposal area: • is not in low condition • has an average width
>100m, and • is surrounded by native
vegetation (ie. is linked on 4 compass quarters).
High, because high connectivity value vegetation links will be maintained between all areas of surrounding native vegetation following clearing of the proposal area.
Figure 5: Clearing examples illustrating the four levels of connectivity value. Note, very dark vegetation patches (examples 3 and 4) are areas of exotic pine plantation.
22

BioMetric Tool Running BioMetric
3. Total adjacent remnant area. The aim of this measure is to encourage offsets to
be established adjacent to, or as part of, remnants that are of equivalent size or larger than the remnant in which clearing is proposed to occur. This reflects findings that vegetation that is adjoining, and therefore part of, large remnants is generally of more value to biota than vegetation that is adjoining, and therefore part of, smaller remnants (e.g. Platt 2002). Record the total remnant area of which the proposal is a part as one of four levels: very large, large, medium, or small. Very large, large, medium, and small remnants are defined differently according to the extent to which the Mitchell Landscape in which most of the proposal occurs has been cleared (Table 2). This figure can be obtained from Step 2 in BioMetric. Digitising tools in the PVP Mapper can be used to help estimate the area of the adjacent remnant if necessary.
Table 2. Criteria used for assessing total adjacent remnant area. Adjacent remnant area refers to the area (ha) of native vegetation that is not in low condition and is linked to (≤100m from) the proposal area. The % of native vegetation cleared in the Mitchell Landscape in which most of the proposal occurs is calculated in Step 2.
% native vegetation cleared in the Mitchell Landscape in which most of proposal occurs
Level for total adjacent remnant area
<30% 30-70% 71-90% >90% Very large >500 >100 >50 >20 Large 201-500 51-100 21-50 11-20 Medium 101-200 21-50 11-20 1-10 Small <100 <20 <10 <1 3.4.3 Site Value
Site Value is assessed for each zone by measuring the ten condition variables in plots and comparing the measured values with benchmarks. Benchmarks represent the range of variability for the condition variables in relatively unmodified examples of the same vegetation type. Each condition variable is allocated a score in BioMetric from 0-3 (0=low, 1=moderate, 2=high, 3=very high) based on the difference between its measured value and its benchmark. This scoring system is explained in Table 3.
23

BioMetric Tool Running BioMetric
Table 3. Explanation of the way each variable in Site Value is scored.
Score in BioMetric Variable 0 1 2 3 Native plant species richness 0 0-<50%
of benchmark 50-<100%
of benchmark ≥ benchmark
Native over-storey cover
0-10% or
>200% of benchmark
>10-<50% or
<150-200% of benchmark
50-<100% or
>100-150% of benchmark
within benchmark
Native mid-storey cover
0-10% or
>200% of benchmark
>10-<50% or
<150-200% of benchmark
50-<100% or
>100-150% of benchmark
within benchmark
Native ground cover (grasses)
0-10% or
>200% of benchmark
>10-<50% or
<150-200% of benchmark
50-<100% or
>100-150% of benchmark
within benchmark
Native ground cover (shrubs)
0-10% or
>200% of benchmark
>10-<50% or
<150-200% of benchmark
50-<100% or
>100-150% of benchmark
within benchmark
Native ground cover (other)
0-10% or
>200% of benchmark
>10-<50% or
<150-200% of benchmark
50-<100% or
>100-150% of benchmark
within benchmark
Exotic plant cover (calculated in BioMetric as % of total ground and mid-storey cover)
>66% <33-66% <5-33% 0-5%
Number of trees with hollows
0 (unless benchmark
includes 0)
>0-<50% of benchmark
50-<100% of benchmark ≥ benchmark
Proportion of over-storey species occurring as regeneration
0% >0-<50% 50-<100% ≥100%
Total length of fallen logs
0-10% of benchmark
0-50% of benchmark
50-100% of benchmark ≥ benchmark
Site Value is assessed as follows: 1. Plots are established in each zone. Zones are relatively homogeneous units
within the proposal. However, given there is always variation in native vegetation, plots should be established in each zone in approximate proportion to any different habitat types that occur in that zone to achieve a representative sample. It is difficult to provide hard and fast rules regarding the number of plots that must be established. Recommended steps for establishing plots within a zone are as follows: (a) divide the zone roughly into homogeneous units (e.g. denser and sparser vegetation) using the imagery (these units do not need to be digitised or recorded); (b) roughly estimate the proportion of the zone taken up by each unit; (c) allocate a minimum of one plot to the smallest unit and then allocate plots to the remaining units in proportion to their area (e.g. if there are two units and the smallest is approximately one third of the total area of the zone then allocate one plot to the smallest unit and two plots to the larger unit). A maximum of ten plots should be
24

BioMetric Tool Running BioMetric
measured within a single zone. Plots should be established randomly within a zone (or within the different habitat types within a zone). This can be done by: marking points randomly on the imagery within the zone and establishing plots at all, or some, of these points or pacing a random distance into the zone, establishing a plot that this point and then repeating the process.
2. The ten Site Value variables are measured in plots or across the zone, recorded on a data entry sheet in the field (sample field data sheets are available at the BioMetric website http://www.nationalparks.nsw.gov.au/npws.nsf/Content/BioMetric_tool) and transcribed into the BioMetric plot data entry sheet (“Data entry – Development site”). There is a button at the Site Value section of Step 3 that takes you to this sheet). Methods for measuring Site Value variables in the field are described in Appendix 3.
3. Enter benchmark values for the condition variables in the data entry sheet (“Data
entry – Development”). Benchmark data are available for most vegetation classes (sensu Keith 2004) in each CMA at http://www.nationalparks.nsw.gov.au/npws.nsf/Content/BioMetric_tool. Benchmark data must be entered manually. If benchmark data are not available for a vegetation type on the site they must be obtained from reference sites of the same vegetation type in relatively unmodified condition. Methods for obtaining benchmarks from reference sites are described in Appendix 1. Use the “Data entry – Benchmarks” worksheet (a link from the “Data entry – Development site” sheet is provided) to enter benchmark data obtained from plots at reference sites. This worksheet automatically calculates benchmark values, which then need to be manually transcribed by the assessor to the Development site data entry sheet.
4. A score from 0-3 for each variable in each zone is generated in BioMetric based on the differences between observed data and benchmark data for each variable (note that a higher score is given for low exotic plant cover and a low score for high exotic cover). The assessor then predicts the impact of the development proposal on each condition variable in each zone using the information in Appendix 4.
25

BioMetric Tool Running BioMetric
5. Site Value for each zone is calculated in BioMetric as the difference in the value of the proposal area before and after clearing multiplied by the area of the zone. The total Site Value is this figure summed across all zones.
6. The balance sheet at the top of Step 3 will indicate when an offset is required, i.e. if the proposed clearing will not improve or maintain environmental outcomes. If an offset is required then the next step is described in Section 3.6. If an offset is not required then the next step is described in Section 3.8. The “Next step” button on this sheet will take you to the appropriate step.
3.5 Step 3b - Can thinning proceed without offsets?
BioMetric is used to assess only those thinning proposals that are not assessed in the Invasive Native Scrub Tool. Step 3b is the next step in BioMetric if the proposal is recorded as “Clearing (thinning only)” in Step 1. Thinning improves or maintains environmental outcomes—and does not require offsets—if, and only if, it results in: stem densities at or above a pre-defined benchmark for the vegetation type; minimal disturbance to remaining vegetation; and does not occur over more than 80% of the proposal area. If proposed thinning does not meet these criteria the assessment returns to Step 1 and must be assessed as a regular clearing application. Note that the policy position on thinning was still under discussion at the time of writing. 3.5.1 Vegetation types Record the vegetation formation and type for each zone and the area of each zone in the same way as for a regular clearing proposal Sections 3.3.5 and 3.3.6. 3.5.2 Zones
The assessment for each zone is the simple matter of entering relevant data for the vegetation type on: (a) the diameter classes to which the vegetation type has been divided; and (b) the benchmark stem densities by diameter class. Some benchmark data are available from http://www.nationalparks.nsw.gov.au/npws.nsf/Content/BioMetric_tool, but reference sites may be required to obtain benchmark stem densities (see Appendix 1). Record whether the landholder proposes to thin to a level equal to, or above, the benchmark. No plots need to be established at the proposal to assess this. The mean spacing between stems at the benchmark stem density is calculated within BioMetric to assist
26

BioMetric Tool Running BioMetric
with this judgement. Thinning can proceed without offsets if the answer is “Yes” for all diameter classes in all vegetation zones and thinning is consistent with the other conditions listed above.
3.6 Step 4 - Can the impacts of clearing be offset?
Losses of biodiversity from clearing must be offset by commensurate gains to biodiversity on other sites for the proposal to improve or maintain environmental outcomes. Offsets are based on the principle of like-for-like to ensure that any gain is comparable with any loss. Offsets can therefore only improve or maintain if: d) the offset is in a vegetation type of equal or greater Regional Value than the
vegetation cleared; e) improvements in Landscape Value brought about by the offset are commensurate
with losses in Landscape Value brought about by clearing; AND f) improvements in Site Value on the offset site are commensurate with losses in
Site Value from clearing. The impacts of the clearing and offset assessments appear in the balance section at the top of the screen in this sheet. As you fill out the relevant sections in this step the balance will be updated. Offsets can only improve or maintain environmetnal outcomes if the value for each component of the assessment is not negative. That is, there is no point in continuing from the Regional Value assessment to the Landscape Value assessment or from the Landscape Value Assessment to the Site Value assessment unless the balance for each of the completed assessments is greater than or equal to zero. The negotiation of offsets could require several iterations, requiring modification of the initial development and offset proposals. This will require the assessor to go backwards and forwards in BioMetric. The BioMetric tool can be used to explore what-if scenarios based on estimated data, but the final assessment must be underpinned by adequate real field data. 3.6.1 Regional Value This is measured in the same way as described in Section 3.4.1. The proposal cannot proceed if the offset returns a negative balance at the top of the worksheet. If this occurs the assessor must modify or terminate the assessment. 3.6.2 Landscape Value
27

BioMetric Tool Running BioMetric
Landscape Value is measured in the same way as described in Section 3.4.2, with an additional measure called “% within riparian area”. Offsets with >25% of their area within riparian areas (i.e. riparian zone plus buffer as defined in Appendix 5) receive an additional score (i.e. this recognises the high value of riparian areas for biodiversity (e.g. MacNally et al. 2000). The ‘With clearing & offset’ part of the assessment is made on the assumption that the proposed clearing has occurred. The assessment cannot proceed if the offset for Landscape Value returns a negative balance in the summary at the top of the worksheet, in which case discuss options with the landholder or terminate the assessment. 3.6.3 Site Value This part of the assessment can only proceed if the offset has passed the Regional Value and Landscape Value components of the assessment (recorded in the Balance at the top of the worksheet). The ‘Current score’ is measured as described in Section 3.4.3. The ‘Score with offset’ is based on the extent to which the management actions proposed by the landholder will improve the state of each variable. Note that these do not need to be new management actions - they may include, or be confined to, actions that the landholder is already undertaking and for which further gains are expected. For example, it is quite feasible that a landholder proposes, as an offset, an area in which grazing was previously excluded and proposes to continue to exclude grazing. If the assessed gain from continuing this activity is commensurate with the loss from development assessed in Step 3 then this would be an appropriate offset. For each zone the assessor predicts the future condition of the 10 condition variables based on the proposed management actions. The predicted improvements in condition must be consistent with the duration of the offset. Guidelines for scoring management actions are provided in Appendix 4. We encourage each CMA to develop guidelines specific to local conditions. Proposed management actions can only advance the score for each variable 1 or 2 levels, depending on the variable (except tree hollows for which no improvement can be scored because of the period required for hollows to form). These limits reflect the slow rate at which restoration occurs and the inherent risk associated with achieving biodiversity outcomes in the long-term. The proposed management actions for each zone are recorded in the tick boxes (multiple actions can be ticked), but note that these tick boxes are not linked to the scoring system, i.e. the effects of management must be scored manually. There is space for recording the specific details of each management action in the next step. An example of an assessment of current and predicted Site Value is in Figure 6.
28

BioMetric Tool Running BioMetric
Figure 6. Assessing Site Value on an offset zone. Site Value with the proposed offset is determined by predicting how each site value variable will change with the agreed management actions. The maximum change for each variable is 1 or 2 levels in the score, except for tree hollows, which cannot be improved with management actions because of the long timeframe required for hollows to form.
Note that the ‘Score’ for each zone is not simply the difference between the ‘Current score’ and the ‘Score with offset’. The extent to which the zone could be degraded over time within the minimum standards set by the NV Act (2003) is taken into account. This means that landholders will not get a better score by degrading native vegetation (within the standards of the NV Act) on the proposed offset site prior to the assessment, and equally, landholders who have managed native vegetation above the standards of the NV Act are rewarded for that management. The Balance at the top of this sheet (Step 4) indicates whether the offset is sufficient for the proposal to pass the three components of the assessment. If none of the three balances in the summary are negative, the “Improve or maintain?” outcome is “Yes”, and the assessment may proceed to Step 6 – Summary of BioMetric Assessment. If the proposal does not pass, then the proposal must be modified or the assessment is terminated.
3.7 Step 5 – Incentives
Applications for incentive funding are assessed using the same types of data as applications for clearing (i.e., Regional Value, Landscape Value and Site Value) with the addition of a measure for the duration of management commitment, and a threatened species index for incentives taken from the Threatened Species Tool. The biodiversity value of management actions proposed by the landholder is predicted in a similar way as for offsets in Step 4. However, there are three key differences in the way the biodiversity index for incentives is calculated compared with offsets: 1. The scores for duration of management commitment, Threatened Species,
Regional Value, Landscape Value and Site Value are combined into a single
29

BioMetric Tool Running BioMetric
score per hectare out of 100. The total score for the incentive proposal is the per hectare score multiplied by the area of the proposal. A single metric or score enables a broad suite of policy instruments (e.g. market-based instruments such as tender schemes) to be employed to allocate incentives.
2. The duration of the management commitment is factored in as a multiplier of the incentive index. Agreements in perpetuity have greater value for biodiversity than temporary agreements.
3. The Site Value part of the index is calculated as the product of the current Site Value and the difference between the predicted Site Value with management and the predicted Site Value without management, as guided by the minimum standards for managing native vegetation in the NV Act (2003). Current management actions that enhance condition and which the landholder continues are taken into account when increases in condition with management actions are scored for incentives. This both rewards landholders who manage their land well for biodiversity and allocates priority to sites in reasonable condition that are more likely to recover with management.
3.7.1 Regional Value Regional Value for Incentives is assessed as for Clearing PVPs (Section 3.4.1). 3.7.2 Landscape Value Landscape Value is assessed as for Clearing proposals (Section 3.4.2), but only for the ‘with proposal’ component (ie. ‘current’ value is not assessed). 3.7.3 Site Value Site Value is assessed as for Clearing proposals (Section 3.4.3) although there are differences in the way the score is calculated as outlined above. 3.7.4 Threatened Species A score for benefits for threatened species that must be transcribed from the Threatened Species Tool. 3.7.5 Duration of Commitment Management actions that last longer receive higher scores. Management actions in perpetuity result in the highest scores. Duration of commitment is calculated as a multiplier on the overall incentive score. In perpetuity agreements receive a multiplier of one (i.e. the full score contributed by threatened species score, Regional Value, Landscape Value and Site Value), while shorter agreements receive multipliers of less than one (5 years=0.1, 10 years=0.3, 15 years=0.5). Choose the appropriate duration of commitment after discussing with the landholder. Options and methods for delivering incentive PVPs were under discussion at the time of writing.
30

BioMetric Tool Running BioMetric
3.8 Step 6 – Summary of BioMetric assessment
The final step in BioMetric provides a summary of the assessment and agreed actions. It includes the following information automatically copied from the main body of the assessment:
• basic application details (e.g. PVP number, CMA); • nature of application (i.e. PVP type); and • results from the assessment.
This information is used in the overall PVP agreement for the site, which also includes detailed information about the proposal, soils, salinity, threatened species information and assessment, a map of the property and all proposed management actions. 3.8.1 Detailed description of agreed action The assessor must provide a description of each action within each zone. The description of each management action should include, where relevant: (a) the objective of the action; (b) a description of the action that will be undertaken; (c) when the action is to be undertaken; and (d) a monitoring and adaptive management strategy. Principles for developing management agreements are provided in separate PVP documentation. 3.8.2 Duration The starting date and finishing date for the action must be entered, with a schedule for ongoing actions if relevant.
31

BioMetric Tool References
4 References
Andren, H. (1994). Effects of habitat fragmentation on birds and mammals in landscapes with different proportions of suitable habitat: a review. Oikos 71, 355-366.
Austin, M.P. (1999). The potential contribution of vegetation ecology to biodiversity research. Ecography 22: 465-484.
Commonwealth of Australia (2001). National objectives and targets for biodiversity conservation 2001 -2005. Commonwealth of Australia, Canberra.
Department of Infrastructure Planning and Natural Resources (2005). Water Quality Tool Operational Manual for PVP Developer.
Environment Protection and Biodiversity Conservation Act (1999). Commonwealth of Australia, Canberra.
Keith, D. (2004). Ocean shores to desert dunes: the native vegetation of New South Wales and the ACT. NSW Department of Environment and Conservation. Hurstville, NSW.
MacNally, RC, Soderquist, TR and Tzaros, C, 2000. The conservation value of mesic gullies in dry forest landscapes: avian assemblages in the box-ironbark ecosystem of southern Australia. Biological Conservation 93:293-302
McIntyre, S., McIvor, J. G., & MacLeod, N. D. (2000). Principles for sustainable grazing in eucalypt woodlands: landscape-scale indicators and the search for thresholds. In Management for Sustainable Ecosystems, eds. P. Hale et al., pp. 92-100. The University of Queensland, Brisbane.
Mitchell, P.B. (2002). NSW ecosystems study: background and methodology. Unpublished report to the NSW National Parks and Wildlife Service, Hurstville.
Mitchell, P.B. (2003). NSW ecosystems database mapping unit descriptions. Unpublished report to the NSW National Parks and Wildlife Service, Hurstville.
National Land and Water Resources Audit (2000). Australian Vegetation Attributes. Version 5.0. Audit, Canberra.
Natural Heritage Trust Bilateral Agreement (2003). Bilateral agreement between the Commonwealth of Australia and the State of New South Wales to deliver the Natural Heritage Trust. Commonwealth of Australia, Canberra.
NSW Department of Environment and Conservation (2005). Threatened Species Tool software.
NSW Department of Infrastructure Planning and Natural Resources (2005). PVP Mapper software.
NSW National Parks and Wildlife Service (2002). SCMP Presence/Absence Vegetation. Metadata Statement and GIS layer.
32

BioMetric Tool References
NSW Native Vegetation Act (2003). NSW Parliament, Sydney.
NSW Threatened Species Conservation Act (1995). NSW Parliament, Sydney.
NSW Threatened Species Conservation Amendment Act (2004). NSW Parliament, Sydney.
Platt, S.J. (2002). How to plan wildlife landscapes: a guide for community organisations. Department of Natural Resources and Environment, Melbourne.
Pressey, R.L., Hagar, T.C., Ryan, K.M., Schwarz, J., Wall, S., Ferrier, S., and Creaser, P.M. (2000). Using abiotic data for conservation assessments over extensive regions: quantitative methods applied across New South Wales, Australia. Biological Conservation 96, 55-82.
Rosenzweig, M.L. (1995). Species diversity in space and time. Cambridge University Press, New York.
Walker, J. and Hopkins, M.S. (1998). Vegetation. Pp. 58-86 in Australian Soil and Land Survey Field Handbook. Second Edition. Ed by McDonald, R.C., R.F. Isbell, J.G. Speight, J. Walker, and M.S. Hopkins. Australian Collaborative Land Evaluation Program, CSIRO Land and Water, Canberra.
33
BioMetric Tool Glossary
5 Glossary
Benchmark. Benchmarks are quatitative measures of the range of variability in in vegetation with relatively little evidence of modification by humans since European settlement. Benchmarks are defined for specified variables by vegetation community at the scale of the stand or patch. Vegetation with relatively little evidence of modification generally has minimal timber harvesting (few stumps, coppicing, cut logs), minimal firewood collection, minimal exotic weed cover, minimal grazing and trampling by introduced or over abundant native herbivores, minimal soil disturbance, minimal canopy dieback, no evidence of recent fire or flood, not subject to high frequency burning, and evidence of recruitment of native species. Benchmarks are currently available by vegetation class (sensu Keith 2004) at http://www.nationalparks.nsw.gov.au/npws.nsf/Content/BioMetric_tool. Broadscale clearing. Clearing of remnant native vegetation or protected regrowth (as defined in the NSW Native Vegetation Act 2003). Clearing. Broadscale clearing of native vegetation that is not thinning to benchmark stem densities. Cover. The area occupied by the periphery of vegetation, i.e. when the vegetation outline is treated as a solid object. Expressed as per cent. Connectivity value. A measure of the extent to which native vegetation not in low condition is linked. Assessed as high, moderate, low, nil according to Table 1 in Section 3.4.2. Derived vegetation type. A vegetation type modified substantially since European Settlement and with no relatively unmodified analogue. Development. Clearing or thinning of native vegetation in the context of a PVP. dbh. Stem diameter at breast height, i.e., at 1.3 metres above the ground. Foliage Cover. The amount of light intercepted by vegetation (leaves and branches) as if a light source were directly overhead. Expressed as a per cent. Low condition vegetation. Defined in Box 1 in Section 3.3.3. Landscape Value. Extent of fragmentation, connectivity and adjacency of native vegetation within 1000 ha of the site being assessed. Listed ecological community. Critically endangered, endangered or vulnerable ecological community listed under the NSW Threatened Species Conservation Act 1995 or the Federal Environment Protection and Biodiversity Conservation Act 1999. Management actions. Actions that lead to increases (or occasionally decreases) in Site Value. Gains in biodiversity to offset loss in biodiversity from clearing are partly derived from increases in condition predicted to occur with management actions. Management actions must fall under eight broad headings - stock grazing exclusion, strategic stock grazing, planting or direct seeding of native vegetation, weed control,
34

BioMetric Tool Glossary
erosion control, feral herbivore control, retention of all dead timber, retention of all regrowth (regrowth as defined in the NSW Native Vegetation Act 2003). Mitchell Landscape. NSW is divided into 580 relatively homogeneous landscapes in terms of geomorphology, soils and broad vegetation types mapped at a scale of 1:250,000 (Mitchell 2002, 2003). These landscapes are used in parts of the assessment in BioMetric. Offset. Actions on a site that aim to balance any losses on another site proposed for clearing. Overcleared landscape. A Mitchell Landscape in which more than 70% native vegetation cover has been cleared. Overcleared vegetation type. A vegetation type of which more than 70% has been cleared in the Catchment Management Area. Percent foliage cover. Percent foliage cover is equivalent to the amount of shadow that would be cast on the ground if there were a light source directly overhead. Permitted clearing. Broadscale clearing that is permitted as defined in Section 8 of the NV Act 2003. Plot. Area in which the assessment of individual variables that make up the Site Value score are is undertaken; usually 0.1 hectare or 0.04 hectare depending on the condition variable being measured. Proposal. The proposed site and management actions put forward for assessment by a landholder. Reference site. Relatively unmodified sites used to obtain benchmark information where the benchmarks are not already available for a vegetation type. Refer to Appendix 1. Regional Value. Regional Value is a measure of the conservation significance of the vegetation type at the regional scale and is measured in BioMetric as the percentage of the original extent that a vegetation type has been cleared in the CMA. The greater the percentage of the original extent of a vegetation type that has been cleared the higher is its Regional Value. Regrowth. Any native vegetation that has regrown since 1983 in the Western Division or 1990 in the case of other land or since the date specified in a PVP (see Section 9 of NV Act). Riparian area. Area in riparian zone and buffer as defined in Appendix 5. Stem density. Number of tree stems per hectare. Where a single tree has multiple stems then refers to the largest stem. Site Value. Quantitative measure of structural, compositional and functional condition of native vegetation multiplied by the area of the zone.
35

BioMetric Tool Glossary
Thinning. Removing individual trees or shrubs only to benchmark densities. Thinning to benchmark levels for stem densities improves or maintains environmental outcomes for biodiversity in its own right (no offset is required). Thinning to below benchmark levels for stem densities generally requires offsets to improve or maintain environmental outcomes for biodiversity and is assessed as clearing. Total adjacent remnant area. The total remnant area of which the proposal is a part. Assessed as very large, large, medium or small using criteria in Section 3.4.2. Vegetation Class. An intermediate level of vegetation classification as defined in Keith (2004). There are 99 vegetation classes across NSW. Vegetation Formation. A broad level of vegetation classification as defined in Keith (2004). There are 17 vegetation formations across NSW. Vegetation type. The finest level of vegetation classification employed in BioMetric. Typologies were obtained from a number of sources across NSW, so vary in the way they were defined, but are generally at the classification level of association as defined in the Native Vegetation Information System (National Land and Water Resources Audit 2000). Zone. Relatively homogenous unit within proposal area that is the same vegetation type and broad condition state. A single zone must not contain a mix of vegetation in low condition and not in low condition.
36

BioMetric Tool Appendix 1
Appendix 1 Obtaining benchmarks from reference sites, where no data are currently available
The Site Value score in BioMetric is based on a comparison between measurements of several variables on the proposal area and a benchmark for each of these variables. Benchmarks are quatitative measures of the range of variability in vegetation with relatively little evidence of modification by humans since European settlement. Benchmarks are defined for specified variables by vegetation community at the scale of the stand or patch. .Benchmarks derived from quantitative data and expert knowledge are available for most vegetation classes across NSW at http://www.nationalparks.nsw.gov.au/npws.nsf/Content/BioMetric_tool. However, where benchmarks do not exist for a vegetation type they must be derived from measurements taken in reference sites, that is, sites measured in the same vegetation type in relatively unmodified condition. Locating reference sites Reference sites are required to have little modification relative to other vegetation in the region as indicated by: minimal timber harvesting (few stumps, coppicing, cut logs), minimal firewood collection, minimal exotic weed cover, minimal grazing and trampling by introduced or over abundant native herbivores, minimal soil disturbance, dieback not in excess of normal senescence, no evidence of very recent major perturbation such as fire or flood, not subject to high frequency burning, and evidence of recruitment of native species. It may be difficult to find totally unmodified sites in a landscape, particularly in highly cleared regions. Vegetation in relatively unmodified condition can be found in some travelling stock routes and reserves, national parks and nature reserves, state forests (especially Flora Reserves), cemeteries, roadsides and commons. Appropriate reference sites may exist on the assessment property. Reference sites can occur in small remnants, such as narrow roadsides and cemeteries. Sources of local knowledge regarding the potential location of reference sites include field-based staff from: CMAs, DEC, DIPNR, Department of Primary Industries (including Forests NSW), Rural Lands Protection Boards, Greening Australia, Landcare Coordinators, field naturalist clubs and landholders. Individuals who undertook the surveys underpinning the vegetation types listed in BioMetric (these sources are listed with the definitions of each vegetation type) may be another potential source of information regarding potential reference site locations. Numbers of reference plots To obtain a reasonable composite picture that encompasses the variation in condition variables, a minimum of three reference plots for each variable should be measured for each vegetation type with more plots being desirable. Field methods for measuring the vegetation condition variables on reference sites The methods for recording data from reference plots is identical to the methods for recording data for Site Value in PVPs as outlined in Appendix 3. Field datasheets for reference plots are available at the BioMetric website (http://www.nationalparks.nsw.gov.au/npws.nsf/Content/BioMetric_tool).
37

BioMetric Tool Appendix 1
Data entry The data from all reference plots for a specific PVP assessment need to be entered into the “Data entry - Benchmarks” sheet in the BioMetric assessment for that property. Benchmark values are automatically calculated. These benchmarks then need to be copied by the assessor into the relevant data entry sheets (development, thinning, offset or incentive) in BioMetric for the Site Value assessment.
38

BioMetric Tool Appendix 2
39
Appendix 2 Per cent cover of native vegetation at the landscape scale
<10% cover
10%–30% cover
30%–70% cover
>70% cover

BioMetric Tool Appendix 3
Appendix 3 Field methodology for measuring condition variables in Site Value
Suggested plot layout Plot marker and GPS point
where relevant
20x20m plot
m
m Figure 1. Layout of nested 20condition attributes.
20
20
x50m and 20x20m
4
50m line transect
plots used for the assessment of vegetation
0

BioMetric Tool Appendix 3
Field methodology Table 1: Field methods for measuring the vegetation condition variables in Site Value. An asterisk indicates that an alternative method is provided for proposals where tree density is very low (e.g. paddock trees).
Variable Plot or transect type Method
Indigenous plant species richness
20mx20m plot Indigenous plant species refers to vascular species local to the area and, if planted, come from a local seed source. Systematically walk the plot counting the number of indigenous plant species for all vascular plants (i.e. the species do not have to be identified).
Native over-storey cover
At 10 points along a 50m transect*
Native over-storey is the tallest woody stratum present (including emergents) above 1m and includes all species native to New South Wales (i.e. native species not local to the area can contribute to over-storey structure). In a woodland community the over-storey stratum is the tree layer, and in a shrubland community the over-storey stratum is the tallest shrub layer. Some vegetation types (e.g. grasslands) may not have an over-storey stratum. Over-storey cover is estimated as per cent foliage cover, which is equivalent to the amount of shadow that would be cast on the ground if there were a light source directly overhead and can be estimated using one of two methods: (1) At 10 points along the 50m transect (i.e. every 5m) estimate per
cent foliage cover directly overhead using the images provided in Figure 2. Divide the total by the number of points (i.e. 10) measured along the transect (e.g. 50%, 0%, 0%, 40%,0% ,45%, 50%, 55%, 0%, 0% = 240/10 =24% foliage cover); OR
(2) In proposals where the over-storey cover is very sparse (e.g. paddock trees), foliage cover can be estimated across the entire zone using the following steps: (a) calculate the average crown diameter of trees using the imagery in the PVP Mapper, (b) determine the average foliage cover of individual trees (estimated by observing several trees in the field using diagrams in Figure 2); (c) count the number of trees in a known area within the zone using the imagery and PVP Mapper; (d) enter these data in the Paddock Calculator in BioMetric (Appendix 7) to arrive at the estimate for the entire zone. This figure must then be recorded as the over-storey cover estimate for each plot within the relevant zone.
Native mid-storey cover
At 10 points along a 50m transect, or 20mx20m plot
The mid-storey contains all vegetation between the over-storey stratum and 1m in height (typically tall shrubs, under-storey trees and tree regeneration) and includes all species native to New South Wales (i.e. native species not local to the area can contribute to mid-storey structure). Foliage cover of the mid-storey is expressed as a % and can be measured using one of two methods: (1) Visually estimate per cent foliage cover in a 20mx20m plot.
The precision of the estimate can be improved if the assessment is conducted separately in each of the four 10mx10m quarters that make up the 20mx20m plot. In a 10mx10m sub-plot 1m2 of foliage cover is equal to 1% of foliage cover (in a 20mx20m plot 1% of foliage cover is equal to 4 m2 of foliage cover). Tally the total m2 of foliage cover for each of the four 10mx10m sub-plot and average them for a per cent foliage cover estimate for the entire 20mx20m plot; OR
(2) At 10 points along the 50m transect (i.e. every 5m) estimate per cent foliage cover in the mid-storey. Divide the total by the number of points (i.e. 10) measured along the transect (e.g. 50%, 0%, 0%, 40%,0% ,45%, 50%, 55%, 0%, 0% = 240/10 =24% foliage cover).
41

BioMetric Tool Appendix 3
Variable Plot or
transect type Method
Native ground cover (grasses)
20mx20m plot, or at 50 points along a 50m transect
The ground stratum contains all native vegetation below 1m in height and includes all species native to New South Wales (i.e. is not confined to species indigenous to the area). The ground stratum (grasses) refers to native grasses (i.e. plants belonging to the family Poaceae). Foliage cover of the ground stratum (grasses) is expressed as a % and can be measured using one of two methods: (1) Visually estimate per cent foliage cover in a 20mx20m plot as
described for native mid-storey cover above; OR (2) At 50 points along the 50m transect (i.e. every 1m) record
whether native grass intersects that point. Divide the total of ‘hits’ by the number of points measured along the transect (i.e. 50).
Native ground cover (shrubs)
20mx20m plot, or at 50 points along a 50m transect
The ground stratum contains all native vegetation below 1m in height and includes all species native to New South Wales (i.e. is not confined to species indigenous to the area). The ground stratum (shrubs) refers to native woody vegetation <1m. It is measured in the same way as for native ground cover (grasses) (see above).
Native ground cover (other)
20mx20m plot, or at 50 points along a 50m transect
The ground stratum contains all native vegetation below 1m in height and includes all species native to New South Wales (i.e. is not confined to species indigenous to the area). The ground stratum (other) refers to non-woody native vegetation (vascular plants only) <1m that is not grass (e.g. herbs, ferns). It is measured in the same way as for native ground cover (grasses) (see above).
Exotic plant cover
20mx20m plot, or at 50 points along a 50m transect
Exotic plants are vascular plants not native to Australia. Exotic plant cover is measured as total per cent foliage cover of all exotics in all strata. Exotic cover was measured as a % of total ground cover vegetation in previous versions of BioMetric. This calculation is now done within BioMetric. If the exotics are in the over-storey then measure using the same method as native over-storey cover (see above), if exotics are in the mid-storey then measure using the same method as native mid-storey cover (see above) and if exotics are in the ground stratum then measure using the same method as described for native ground cover (grasses) (see above).
Number of trees with hollows
50mx20m plot*
This is a count of the number of living and dead trees within a 50mx20m plot with at least one hollow (note that the hollows do not have to be within the plot). A hollow is only recorded if: (a) the entrance can be seen; (b) the minimum entrance width is at least 5cm across; (c) the hollow appears to have depth (i.e. you cannot see solid wood beyond the entrance); (d) the hollow is at least 1m above the ground (this omits hollows in cut stumps or at the base of trees); and (e) the centre of the tree is within the plot. Trees should be examined from all angles. In proposals where trees occur in very low densities (e.g. paddock trees), the number of trees with hollows per 0.1ha (equivalent to the area of a 50x20m plot) can be estimated by: (a) identifying a representative area (in hectares) over which all trees will be examined using the imagery in the PVP Mapper; (b) recording the number of trees with hollows within this area; and (c) entering these data in the Paddock Calculator in BioMetric. This figure must then be recorded as number of trees with hollows in each plot within the relevant zone.
Regeneration Entire zone Regeneration is measured as the proportion of over-storey species present at the site that are regenerating (i.e. with dbh < 5cm). For example if there are three tree species present at the site but only one of these species is regenerating, then the value is 0.33. The maximum value for this measure is 1.
42

BioMetric Tool Appendix 3
Variable Plot or
transect type Method
Total length of fallen logs
50mx20m plot This is the total length of logs at least 10cm diameter and at least 0.5m long. The diameter is estimated with a measuring tape (or callipers if available) held horizontally immediately above the log and the length is estimated to the nearest metre by measuring with a tape, or pacing, along the part of the log that is at least 10cm diameter. If estimating length by pacing then the actual length of a sample of logs should be measured regularly with a tape so the assessor can calibrate their estimate derived from pacing. Only those parts of logs lying within the plot are measured.
Number of stems in specified diameter classes
50mx20m plot These data are only recorded in reference plots for thinning proposals where benchmarks do not exist. This is a count of the number of stems of over-storey tree species in dbh classes relevant for the vegetation type. Record only those trees in which the centre of the stem is within the plot. Record only the largest stem for multi-stemmed trees.
43

BioMetric Tool Appendix 3
Figure 2. Diagrams to assist with estimates of per cent foliage cover (from Walker and Hopkins 1998).
44

BioMetric Tool Appendix 4
Appendix 4 Guidelines for assessing the impacts of management actions on Site Value
This appendix provides guidelines to assess change in Site Value with proposed clearing and with proposed management actions. Site Value is made up of 10 variables: richness, over-storey, mid-storey, ground layer (grasses, shrubs, other), exotic plant cover, trees with hollows, logs and regeneration. For the current value of the proposal site, a score between 0 and 3 is allocated to each variable based on the difference between the observed value in the proposal and the benchmark. Scores are allocated as described in Section 3.4.3. For the future value of the proposal site with management actions (i.e., clearing, offsets or incentives), the assessor must predict the loss or gain that can be feasibly expected with any proposed management actions. This appendix is a guide to doing this, but the assessor must also bring to bear informed judgement based on the local conditions to this decision. We encourage regional bodies to develop guidelines to assist assessors make transparent and consistent decisions in this regard. Predicting change in Site Value from clearing proposals For proposals to clear native vegetation the assessment is based on the difference between the current value of the proposal site and the value of the proposal site were clearing to proceed. The method for assessing the current value of the proposal is explained in Section 3.4.3. This process allocates a score between 0 and 3 to each variable. The assessor then assigns a score to each condition variable based on the effect of the proposed clearing. This step cannot be automated within BioMetric because many scenarios are possible and thus requires expert input by the assessor. The impacts of clearing are often negative, but can vary in their effect. A proposal to clear intact woodland (e.g. to establish a crop) will generally take all condition variables down to zero (i.e. cropping does not generally include the permanent retention of any components of native vegetation). A proposal to partially clear the over-storey for grazing (i.e., where some trees will be retained for shade and other environmental services) will take the over-storey down one or two points commensurate with the level of over-storey removal. An understanding of how the Site Value score works (see Section 3.4.3) will help the assessor judge the extent of loss. For example, if the benchmark for over-storey is 20-30% cover and the site currently has 25% over-storey cover then the current score for over-storey is 3. If the proposal is predicted to result in an over-storey cover of around 5% then the score with the proposal would be 1 (i.e. the proposal results in over-storey cover that is within 10-50% of the lower benchmark), but if the proposal were to result in only few scattered trees, or a predicted over-storey cover of 1% then the score with the proposal would be 0 (i.e., 0-10% of the lower benchmark). Some impacts of clearing can be positive. For example, the removal of over-storey and/or mid-storey without damage to the ground layer can stimulate increased cover in the ground layer. Certain rules must be observed when scoring an increase in value of a variable:
45

BioMetric Tool Appendix 4
(1) the increase in the score for each variablecan generally only be by one point unless there is strong management intervention (e.g. planting or direct seeding of native pasture species) in which case the increase can be by two points;
(2) planting or direct seeding will only result in an increase in richness if the species is indigenous to the area and the seed is sourced locally; and
(3) where a variable is currently absent from the proposal site and adjacent area then an increase cannot generally be scored unless it is to be specifically introduced;
(4) where an increase is not feasible because of other pressures associated with the proposal (e.g. grazing or exotic invasion) then an increase should not be scored;
(5) an increase in some variables (e.g. ground cover) beyond the benchmark will result in a decrease in the score (e.g. if the current score for grass cover is 3 then an anticipated increase in grass cover beyond the benchmark range will reduce the score to 2).
Predicting change in Site Value with proposed management actions for offsets or incentives For proposals to manage native vegetation as part of offsets or incentive applications, the calculations of the score in BioMetric are based on the difference between the current Site Value of the proposal (minus any loss that is acceptable under the NV Act) and the future Site Value were the management actions implemented. Changes in the condition score with management actions is predicted for each of the 10 variables that make up Site Value. After assessing the current condition score for each variable in each zone the assessor must define the specific management actions that the landholder agrees to undertake and then estimate the future condition for each variable given these actions. Eight generic management actions listed in BioMetric (Table 1) are acceptable, although any combination of actions a landholder wishes to undertake that fall under these broad categories can be applied. Table 1. Definitions for generic management actions listed in BioMetric. Any combination of actions that fall under these broad headings is permitted. Management
action Definition
Grazing exclusion
The complete and permanent removal of grazing by all domestic stock at the site.
Strategic grazing
The implementation of a variable and adaptive stock grazing regime for enhancing biodiversity, such as for controlling exotic weeds or vegetation biomass and/or enhancing competitiveness of native perennial species. Typically involves short periods of intensive grazing between long periods of little or no grazing. Strategic grazing strategies differ with management goals, seasonal conditions and regions.
Planting/direct seeding
The direct establishment of tree, shrub or groundlayer species that are likely to have existed at the site, using species and seed sources suitable for the vegetation type and region.
Weed control Reducing the number or cover of exotic plants using herbicides, manual or mechanical control. Stock grazing for weed management is covered by the management action ‘Strategic grazing’. Landholders are required by law to ‘continuously suppress and destroy’ some weed species, including most Noxious Weed categories (all W1, W2, W4d and W4e weeds). Management of such species is therefore outside the definition of this management action.
Erosion control
The mitigation of mass soil movement. It can be achieved using engineering solutions, management of grazing and/or revegetation.
46

BioMetric Tool Appendix 4
Management
action Definition
Feral herbivore control
Aims to eliminate or reduce to very low population densities exotic herbivores that contribute to high total grazing pressures and disturbance of areas of native vegetation. Feral herbivore species include rabbits, goats, pigs, horses, escaped domestic stock, and deer.
Retain dead timber
Means that no dead timber (i.e. logs and litter on the ground and standing dead trees) is removed from a site.
Retain regrowth
The retention of all regrowth on a site is defined as: not clearing communities of native vegetation comprising trees, under-storey and groundcover that have regrown since 1 January 1983 in the Western Division and 1 January 1990 in the case of other land.
Some general rules must be considered when scoring an expected increase in value of a variable with management: (1) the increase in the score for a variable can generally only be by one point unless
there is strong management intervention (e.g. planting or direct seeding) in which case the increase can be by two points;
(2) planting or direct seeding will increase the relevant cover values, but will only result in an increase in richness if the species are indigenous to the area and the seed is sourced locally;
(3) where a variable is currently absent from the proposal site and adjacent area then an increase cannot generally be scored unless it is to be specifically introduced;
(4) where an increase is not feasible because of other pressures associated with the proposal (e.g. grazing or exotic invasion) then an increase should not be scored;
(5) no increase can be scored for trees with hollows because of the long period that hollows take to form (generally >100 years).
Suggested scores for different management actions in BioMetric are outlined in Table 2. However, when estimating the effect of management actions on the proposal site the assessor must balance the potential positive impacts of the proposed management actions with the potential negative impacts of other pressures on the same zone. For example, native ground cover is unlikely to increase with the removal of grazing alone on a site that has very high exotic ground cover. In Table 2 we have also suggested the conditions in which management actions are likely to have a positive effect. The information in Table 2 is intended as a guide only and should be informed by local conditions and professional judgement by the assessor.
47

BioMetric Tool Appendix 4
Table 2. Suggested responses to Site Value scores with different management actions. The + sign followed by a number refers to the suggested number of increments that the score should be increased with the activity and the codes (e.g. N1) refer to the conditions that should be present before such a response can be expected (see below for explanation of codes). This table is intended as a guide only and should be augmented by local knowledge.
Variable Grazing exclusion
Strategic grazing
Planting/ direct
seeding
Weed control
Erosion control
Feral herbivore
control
Retain dead
timber
Retain regrowth
Indigenous plant species richness
+1 N1, E2
+1 N1, E2
+1 G1, P2
+1 N2, E2, G1, P1
+1 N2, E2,
G1
+1 N1, E2, G1,
F1, F2
No change No change
Native over-storey cover
+1 E1, E2, P1, R1
+1 E1, E2, P1, R1
+2 G1, P2
+1 E2, G1, P1, R1
+1 E2, G1,
R1
+1 E1, G1, F1, F2, P1, R1
No change +1 G1
Native mid-storey cover
+1 N1, E1, E2, P1
+1 N1, E1, E2, P1
+2 G1, P2
+1 N2, E2, G1, P1
+1 N2, E2,
G1
+1 N1, E1, G1, P1, F1, F2
No change +1 G1
Native ground cover (measured separately for grasses, shrubs & other plant life forms)
+1 N1, E1,
E2
+1 N1, E1,
E2
+1 (+2 for grasses) G1, P2
+1 N2, E2,
G1
+1 N2, E2,
G1
+1 N1, G1, F1,
F2
No change No change
Exotic plant cover +1 E2
+1 E2
+1 E2, P2
+1 E2
+1 E2
+1 E2
No change No change
Number of trees with hollows
No change
No change
No change No change
No change
No change No change No change
Over-storey Regeneration
+1 E1, E2, P1, R1,
R2
+1 E1, E2, P1, R1,
R2
+1 E1, E2, G1, P2
+1 E2, G1, P1, R1,
R2
+1 E2, G1, P1, R1
+1 E1, E2, G1, P1, F2, R1
No change No change
Total length of fallen logs
No change
No change
No change No change
No change
No change +1 T1
+1 T1
Codes for Table 2 are: NATIVE SPECIES N1: some palatable &/or grazing-sensitive native plant species (within relevant structural class/es) still present on site or in adjacent vegetation of same type. N2: some native plant species (within relevant structural class/es) still present on site or in adjacent vegetation of same type. EXOTIC PLANTS E1: initial exotic ground cover on site is low. E2: exotic plant species monitored and managed if cover increases. GRAZING MANAGEMENT G1: grazing management (exclusion or strategic stock grazing) undertaken if necessary to facilitate natural regeneration of native plant species in relevant structural class/es. Includes control of access to watering points. PLANTING OR DIRECT SEEDING P1: planting/seeding and follow-up management of indigenous local species relevant to vegetation type, landscape position & structural class/es if natural regeneration does not occur within three years. Seeds/seedlings to be of local provenance. Follow-
48

BioMetric Tool Appendix 4
up management includes watering, grazing management, control of weeds & other competing species. P2: • appropriate site preparation prior to planting/seeding (including weed control) • plantings restricted to indigenous local species relevant to vegetation type,
landscape position & structural class/es, with seeds/seedlings of local provenance • follow-up management of plantings for long-term survival (e.g. watering, grazing
management, control of weeds & other competing species, replanting) • planting configuration reflects natural density and patchiness • grazing excluded until seedlings established. FERAL HERBIVORES F1: monitoring of specified feral herbivore species and management of populations to allow regeneration of native plant species in relevant structural class/es. F2: existing (or recent) grazing pressure from feral herbivores moderate to high. NATURAL REGENERATION R1: nearby seed source of native over-storey species (on site or in adjacent vegetation of same type). R2: site preparation for natural eucalypt regeneration, if necessary. FALLEN TIMBER MANAGEMENT T1: retention of all fallen timber.
49

BioMetric Tool Appendix 5
Appendix 5 Riparian zones and buffers - definitions
Widths of riparian zones and buffers (in parentheses). Figures are distances (m) from the top of each bank if defined, otherwise from the centre of the stream. More information is in Department of Infrastructure and Natural Resources (2005).
Size of stream
Location Minor
watercourses, flood
runners and
effluents
Minor creeks and
lagoons
Minor rivers,
wetlands and major
creeks
Major rivers
and important
wetlands
Coast & tablelands 10m 20m 30m 40m
Western slopes
and plains
20m 40m (+60m) 60m (+140m) 100m (+400m)
Estuarine areas 50m from the astronomical high tide mark (where no obvious bank).
50
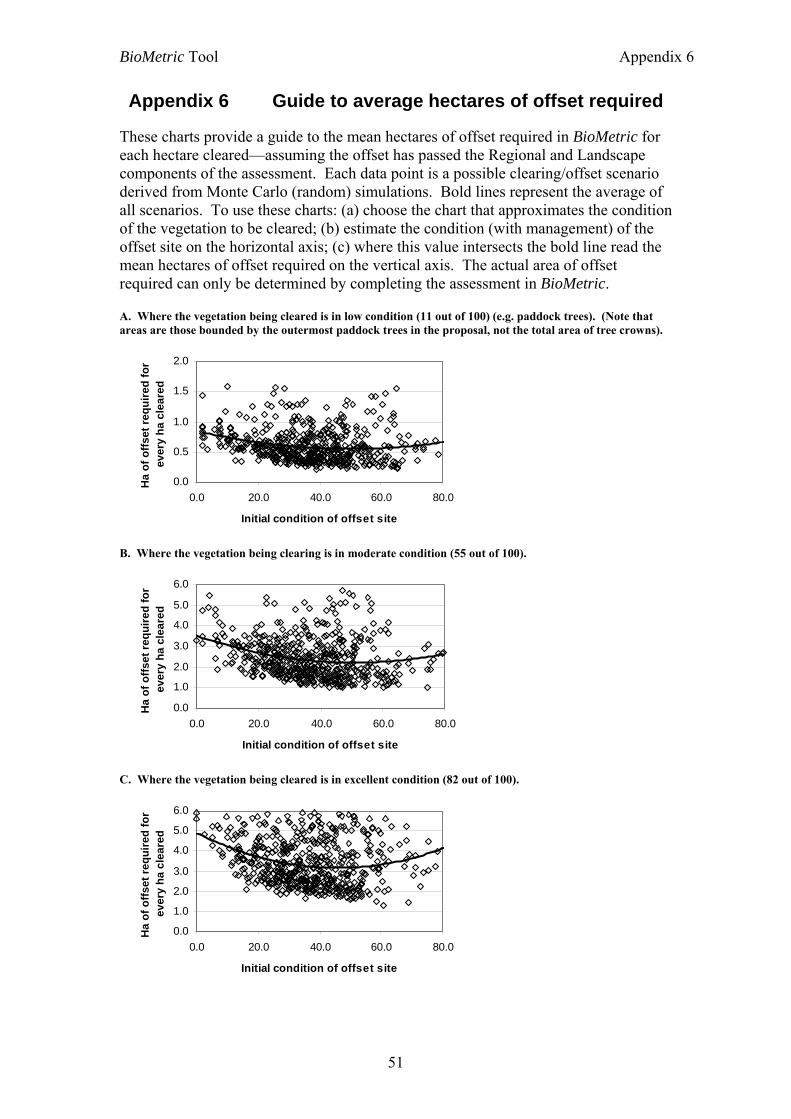
BioMetric Tool Appendix 6
Appendix 6 Guide to average hectares of offset required
These charts provide a guide to the mean hectares of offset required in BioMetric for each hectare cleared—assuming the offset has passed the Regional and Landscape components of the assessment. Each data point is a possible clearing/offset scenario derived from Monte Carlo (random) simulations. Bold lines represent the average of all scenarios. To use these charts: (a) choose the chart that approximates the condition of the vegetation to be cleared; (b) estimate the condition (with management) of the offset site on the horizontal axis; (c) where this value intersects the bold line read the mean hectares of offset required on the vertical axis. The actual area of offset required can only be determined by completing the assessment in BioMetric. A. Where the vegetation being cleared is in low condition (11 out of 100) (e.g. paddock trees). (Note that areas are those bounded by the outermost paddock trees in the proposal, not the total area of tree crowns).
0.0
0.5
1.0
1.5
2.0
0.0 20.0 40.0 60.0 80.0
Initial condition of offset site
Ha
of o
ffset
requ
ired
for
ever
y ha
cle
ared
B. Where the vegetation being clearing is in moderate condition (55 out of 100).
0.0
1.0
2.0
3.0
4.0
5.0
6.0
0.0 20.0 40.0 60.0 80.0
Initial condition of offset site
Ha
of o
ffset
requ
ired
for
ever
y ha
cle
ared
C. Where the vegetation being cleared is in excellent condition (82 out of 100).
0.0
1.0
2.0
3.0
4.0
5.0
6.0
0.0 20.0 40.0 60.0 80.0
Initial condition of offset site
Ha
of o
ffset
requ
ired
for
ever
y ha
cle
ared
51

BioMetric Tool Appendix 7
Appendix 7 Explanation of the paddock tree calculator
In sparsely wooded vegetation (e.g. paddock trees) overstorey cover and trees with hollows can be assessed using the rectified imagery in the PVP Mapper combined with some simple field measurements rather than by measuring these variables in plots. In response to feedback from the trials this version of BioMetric includes a tool to make these calculations. The calculator for paddock trees is accessed via the plot data entry sheet.
To assess overstorey cover using the calculator 1. Enter the average crown diameter of paddock trees in the zone by measuring several
crowns on the rectified imagery within the zone (using the distance tool in ArcView which is opened with the PVP Mapper) and averaging them.
2. Enter the average foliage cover by examining the crowns of several trees in the zone, assigning a % foliage cover using the diagrams in Appendix 3 and averaging these (the typical range of % cover for eucalypts in good health is 40-70%).
3. Enter the number of trees within the entire zone or a representative area within the zone.
4. Enter the area (in hectares) in which the trees were counted. This is determined using digitising tools in the PVP Mapper.
5. The paddock calculator will provide the % foliage cover of the overstorey for the whole zone.
6. Return to the plot data entry sheet and enter this figure for each plot established within the zone.
52

BioMetric Tool Appendix 7
To assess whether overstorey cover meets the low condition definition using the calculator Native vegetation must have an overstorey cover <25% of the lower benchmark value (as well as understorey that is <50% native) to be classed as “low condition”. The paddock calculator can be used assess whether the vegetation meets the overstorey criterion for low condition by simply entering the lower overstorey benchmark for the vegetation type. This part of the calculator will only work if the foliage cover was calculated following the above steps. To assess the number of trees with hollows using the calculator 1. Enter the area (in hectares) over which hollows in trees were examined. This may be
the entire zone, a representative area sampled within the zone or the same area in which trees were counted for the overstorey cover calculation (above).
2. Enter the number of trees with hollows (living and dead) observed within this area. 3. The paddock calculator will provide the average number of hollow-bearing trees (per
0.1 ha or 50x20m plot) for the zone. 4. Return to the plot data entry sheet and enter this figure for each plot established
within the zone.
53