Embed Size (px)
Citation preview

1
Biomechanics of Free-Throw Motion—Uniform Motion and Lever
Mechanics
Brian Fox
Student at Lewis and Clark State College
Lewiston, Idaho
Erik Helleson
Cheney High School
Cheney, WA
Bill Knapp
Timberline High School
Weippe, Idaho
Eric Nordquist
Colton Middle School
Colton, WA
Glenn Voshell
Colton High School
Colton, WA
Washington State University Mentor
Professor David Lin
Bio-Engineering
July, 2008
The project herein was supported by the National Science Foundation Grant No. EEC-
0808716: Dr. Richard L. Zollars, Principal Investigator and Dr. Donald C. Orlich, co-PI.
The module was developed by the authors and does not necessarily represent an official
endorsement by the National Science Foundation.

2
Table of Contents
Page #
Summary 3
Introduction 3
Rationale 5
Science 5
Engineering 5
Goals 6
Prerequisite Skills / Knowledge 6
Equipment (model construction) 8
Activities 11
Lever Mechanics of the Throwing Motion
Lever Mechanics Student Worksheet
Finding the Velocity of a Projectile Using Vectors
Vector Activity Student Worksheet
Uniform Motion Activity
Uniform Motion Activity Student Worksheet
Extensions 26
Appendices 27
The Quadratic Formula
The Pythagorean Theorem
Right Triangle Trigonometry
Uniform Motion Problems
Vector Algebra
References 34

3
Summary
Overview of Project
This module has been designed to introduce Jr. High School and Senior High School students to
the field of engineering and to enhance their interest in engineering and its practical application
through bioengineering. The module will first look at the anatomy/physiology of the human arm
and more specifically, the elbow and wrist joints by using a simple, homemade model. Then,
using the arm model as a springboard, the module will explore the anatomical and physiological
aspects of the arm including: 1), the basic skeleton-muscular structures of the arm; 2) the lever
mechanics of how muscles work together to perform an action of shooting a basketball free
throw using a projectile; 3) the algebra and trigonometry involved in how the arm moves at
specific angles and how changing insertion points of various muscles might impact the flight of
the ball
Intended Audience
As mentioned earlier, our intended audience will be middle school and high school students. The
basic skeleton-muscular structures of the arm including muscles, bones, tendons, ligaments can
be taught in middle school life-science. The algebra segments of this module can be incorporated
in 9th
grade physical science with the building of the model and the performing of the throwing
function. More detailed anatomy can be taught in high school anatomy classes and high school
trigonometry classes can investigate angles, velocities and vectors.
Estimated Duration
The duration of these activities could run from two or three days to three weeks, depending on
the activities chosen.
Introduction
Biological engineering is any type of engineering--for example, mechanical engineering--applied
to living things.
Bioengineers are concerned with the application of engineering sciences, methods, and
techniques to problems in medicine and biology. Bioengineering encompasses two closely
related fields of interest: the application of engineering sciences to understand how animals and
plants function; and the application of engineering technologies to design and develop new
devices, including diagnostic or therapeutic instrumentation, or the formulation of synthetic
biomaterials, the design of artificial tissues and organs, and the development of new drug
delivery systems.
Bioengineering is the application of the principles of engineering and natural sciences to tissues,
cells and molecules. Closely related to this is biotechnology, which deals with the
implementation of biological knowledge in industrial processes. Applications from both fields
are widely used in medical and natural sciences and also in engineering.

4
The National Institute of Health (NIH) Bioengineering Consortium agreed on the following
definition for bioengineering research on biology, medicine, behavior, or health recognizing that
no definition could completely eliminate overlap with other research disciplines or preclude
variations in interpretation by different individuals and organizations.
Definition
Bioengineering integrates physical, chemical, or mathematical sciences and engineering
principles for the study of biology, medicine, behavior, or health. It advances fundamental
concepts, creates knowledge for the molecular to the organ systems levels, and develops
innovative biologics, materials, processes, implants, devices, and informatics approaches for the
prevention, diagnosis, and treatment of disease, for patient rehabilitation, and for improving
health.
If we ignore the obvious health focus in the NIH definition, it is clear that bioengineering is
concerned with applying an engineering approach (systematic, quantitative, and integrative) and
an engineering focus (the solutions of problems) to biological problems.
“Bioengineering or Biomedical Engineering is a discipline that advances knowledge in
engineering, biology, and medicine --and improves human health through cross-disciplinary
activities that integrate the engineering sciences with the biomedical sciences and clinical
practice. Major advances in Bioengineering include the development of artificial joints, magnetic
resonance imaging (MRI), the heart pacemaker, arthroscopy, angioplasty, bioengineered skin,
kidney dialysis, and the heart-lung machine (“Bionewsonline,” 2005).
Preparation
A bachelor‟s degree in engineering is required for almost all entry-level engineering jobs.
Unlike many other engineering specialties, a graduate degree may be recommended or
required for some entry-level jobs in bioengineering. College graduates with a degree in a
physical science or mathematics occasionally may qualify for some engineering jobs,
especially in specialties in high demand. Most engineering degrees are granted in electrical,
electronics, mechanical, chemical, civil, or materials engineering. However, engineers trained
in one branch may work in related branches. For example, some biological engineers also
have training in mechanical engineering. This flexibility allows employers to meet staffing
needs in new technologies and specialties in which engineers may be in short supply. It also
allows engineers to shift to fields with better employment prospects or to those that more
closely match their interests (Sloan Career Center, 2003).

5
Rationale
One of the goals of the Washington State University and National Science Foundation Institute
for Science and Mathematics Education through Engineering Experiences is to have participants
prepare a teaching module that is appropriate for their classroom. These activities will help to
illustrate the connection between science and engineering. Students will be shown engineering
principles that are applied in a diagnostic laboratory. This module is based on research being
done in the Bio-Engineering Department at Washington State University under the direction of
Professor David Lin. The focus of his work is muscle physiology and how muscles can act as
springs or dampers, depending on the situation.
Science
Science can be defined as “accumulated and established knowledge, which has been
systematized and formulated with reference to the discovery of general truths or the operation of
general laws; knowledge classified and made available in work, life, or the search for truth;
comprehensive, profound, or philosophical knowledge.” Science is generally driven by the quest
to find out why something happens. A method of learning about the natural world, science
focuses on formulating and testing naturalistic explanations for natural occurrences.
Engineering
“Engineering is the application of science to the needs of humanity. This is accomplished
through knowledge, mathematics, and practical experience applied to the design of useful objects
or processes. Professional practitioners of engineering are called engineers. Engineering is
concerned with the design of a solution to a practical problem. A scientist may ask „why?‟ and
proceed to research the answer to the question. By contrast, engineers want to know how to solve
a problem, and how to implement that solution. In other words, scientists investigate phenomena,
whereas engineers create solutions to problems or improve upon existing solutions. However, in
the course of their work, scientists may have to complete engineering tasks (such as: designing
experimental apparatus, or building prototypes), while engineers often have to do research. In
general, it can be stated that a scientist builds in order to learn, but an engineer learns in order to
build.” [6]

6
Module Goals and Objectives
The students will build a model of a human arm under direction from the teacher
The students will analyze the dynamics of the human arm and its musculature
The students will use biological methods to understand the muscle structure in the human
arm
The students will see and understand the relationship between engineering and the
biological sciences
Skills / Background Knowledge
This module is not designed to be a standalone exercise. It is strongly recommended that the
students have a background in the following mathematical and physical concepts:
Right Triangle Trigonometry
Quadratic Equations
Vector Algebra
Levers

7
Frayer Model
When a teacher elects to use this module, it is helpful to know the students background
knowledge. This can be achieved using the Frayer Model (Barton, ML & Heidema, C, 2002).
The time required to administer this assessment is approximately 10 minutes. The Frayer Model
has the following characteristics: It is a diagram that is divided into four parts. The teacher
inserts the word / concept to be assessed in the center circle. The student then fills in the
remaining quadrants as illustrated in the diagram provided. Once the students are finished , the
teacher can then assess the students level of understanding in a very short time and cover any
concepts students may have difficulty with.

8
Free Throw Model Construction
Materials:
¼” Dowel
3/16” dowel
1/4” Threadstock- 6.5” length
6 ¼” nuts
2 ¼” washers
1 3” bolt
1 2” bolt
2X6 38cm length
4 eye hooks
25 cm oxyacetylene welding rod or stiff wire (ie metal coat hanger)
2 5cm diameter wooden pulley wheels
2 2X.5X20cm wood scrap (paint stirring sticks)
80 cm of 2X2 cm wood scrap (maybe garden posts)
Rubber bands (variety)
8 feet of string
3” wood screw
Any epoxy or adhesive, ie JB Quik Weld
Practice golf ball
Tools (Jigsaw, plyers, table saw)
Dimensions Wrist: 2X2cmX5cm scrap wood
1cm top and 1 cm bottom eye-hook for tendon insertion
12 cm welding rod for hands (2)—any stiff wire (like a coat hanger)
wood screw centered on wrist block
Adjustable Stop: 1X1, at least 5 cm long (Paint stick or pencil will work)
Radius and Ulna: 20 cm length each
Elbow hinge bolt: 2 cm from end
Wrist hinge bolt: 1.5 cm from end
Insertion points: 7 cm, 10 cm, 13 cm
Humerus: 30 cm length
Shoulder hinge bolt: 2 cm from end
Elbow hinge bolt: 2.5 cm from end
Muscle insertion holes: 6 and 9.5 cm from shoulder end
Muscle insertion to wrist joint connection: 7 cm from elbow end (top & bottom)
Base: 38 cm length
Cut 6x12cm center end
Holes on each side for dowels: 5, 8, 11 cm
9
Construction:
1. Base: Cut 6X12cm slot at center on one end
2. Drill 5/16” hole 3cm from cut-end centered into both sides
3. Drill ¼” stop holes at 5, 8, 11 cm centered on both sides of slot
4. (optional) With 1” drill bit, approx 1/8” deep for golf ball holder, 5cm centered from end
5. Humerus: Cut 30cm length of 2cmX2cm wood
6. Shoulder hinge: Drill ¼” 2 cm from one end on side for threadstock
7. Muscle insertion holes: Drill ¼” 6cm & 9.5cm from shoulder end
8. Elbow hinge: Drill ¼” on side 2.5 cm from end.
9. Cross-joint muscle eye hooks: Eye hooks top & bottom 7cm from elbow end
10. Radius & Ulna: Cut 20cm lengths each of 2X.5 scrap wood (paint stirrers)
11. Drill ¼” 2cm from elbow end
12. Drill ¼” 1.5cm from wrist end
13. Drill 7/32” at 7cm, 10cm, & 13cm for insertion points
14. Cut 3/16” dowel 6 cm in length
15. Wrist: Cut 5cm length of 2X2
16. Drill ¼” 1.5 cm from wrist end
17. Drill holes ~ 1cm from fingers end for the fingers (do not drill all the way through)
18. Screw 3” wood screw into fingers end (adjustable)
19. Screw in eye hooks centered over wrist joint (top & bottom) for tendon insertions
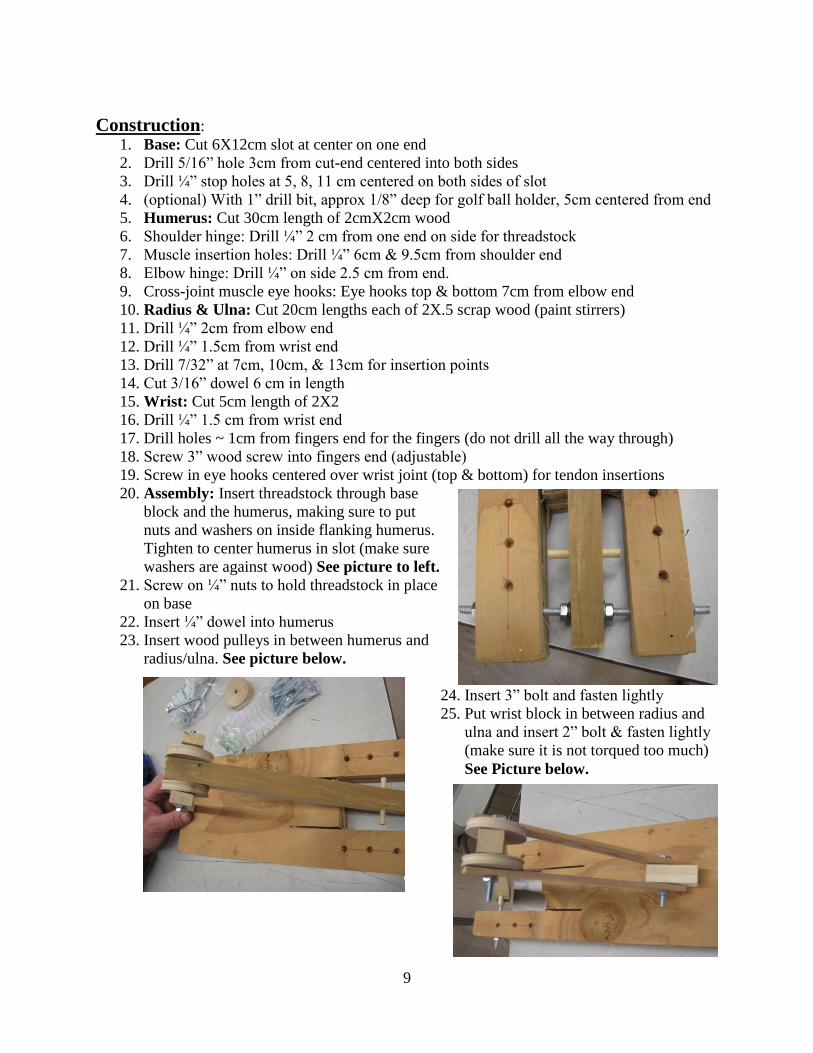
20. Assembly: Insert threadstock through base
block and the humerus, making sure to put
nuts and washers on inside flanking humerus.
Tighten to center humerus in slot (make sure
washers are against wood) See picture to left.
21. Screw on ¼” nuts to hold threadstock in place
on base
22. Insert ¼” dowel into humerus
23. Insert wood pulleys in between humerus and
radius/ulna. See picture below.
24. Insert 3” bolt and fasten lightly
25. Put wrist block in between radius and
ulna and insert 2” bolt & fasten lightly
(make sure it is not torqued too much)
See Picture below.

10
26. Insert oxyacetylene welding rods into arc- into
pre-drilled holes and bend accordingly with
plyers. Epoxy. For safety put on optional
nalgene tubing into end of rods (Thank you
Mr. N). See picture on right.
27. Insert 3/16” dowel into pre-drilled holes of
radius/ulna
28. Cut string into 2 ~18 cm lengths. At one end
tie to larger rubber bands. To other end tie to
3/16” dowel
29. Cut string (make sure you have enough for ease of tying the knots). Tie one end to top
eye hook of humerus and at the other end to the bottom eye hook on wrist block. Assure
that when flexed the tendon string stops the arm from folding. See picture bottom left.
30. Run rubber band through top eye hook of humerus and
loop through itself. Tie piece of string to r.b. and attach
to top eye hook of wrist block. Make sure to put tension
on r.b. and tie string off.
31. Same instructions as 30, except rubber band attaches to
bottom eye hook of humerus and the string to bottom eye
hook of wrist.. See picture below right.
32. Insert ¼”
dowels into
base and
insert stop
block.
33. Enjoy.
Safety: This is a tension-filled model that carries the possibility of rubber bands snapping, thus
it would be strongly advised that all operators wear proper eye protection.

11
Lever Mechanics of the Free-Throw Motion
The lever is often the first example of a simple machine that is taught in an introductory science
class. A lever is defined as a rigid bar that is free to move around a
fixed point. Each lever is composed of different parts: The bar
rotates around a fulcrum, the input force is the force done on the
machine, and the output force is the force exerted by the machine.
There are three different classes of levers, each differentiated by the
different locations of the fulcrum, input and output forces as shown
in the figure to the left.
Activity Objective: After completion of this activity the students
will be able to identify the types of levers present in the free-throw
motion, noting the location of the fulcrum, input and output forces,
and deduct which muscle insertion provides the greatest mechanical
advantage. Finally, the students will investigate the scientific
method fallacies of this exercise and re-design the experiment to
solely measure the effect of different insertion points.
Exercises:
1) The students will identify the three levers involved in the action mimicking a free throw. The
motion of the arm is composed of three different levers: 2 third-class levers and 1 first-class.
(Note: You do not need to give them the hint of the different classes if you are confident
they can deduce them.)
i. 1st class: Extension of the triceps: load-ball in hand, fulcrum- elbow joint,
effort-triceps
ii. 3rd
class: Load-ball in hand, effort-muscle insertion holes on forearm,
fulcrum-elbow joint
iii. 3rd
class: Load-ball in hand, effort-wrist muscles insert distal to wrist joint,
fulcrum-wrist joint.
b. In groups of 2-3, the teacher should provide each group some kind of ball, like a
basketball to practice the free-throw motion.
c. The students need to work together looking at anatomy books and feeling their own
muscles while mimicking the action. Encourage the students to study the different
muscles and joints involved to determine the levers involved.
d. When the students have successfully identified the three levers have them draw the
isolated levers on their activity sheet labeling which muscles and joints are the
fulcrum, input and output forces.
NOVATeachers (2004).
12
2) Studying the mechanical advantage of the lever involving the forearm muscles.
a. Question: Which of the three levers are affected if we change the insertion point of
the muscles representing the triceps? (answer: the 3rd
class lever action of the
forearm: fulcrum=elbow, input = muscle insertion, load =ball.)
b. Have the students predict which muscle insertion is going to produce the greatest
distance thrown and why. Encourage them to think about 3rd
class levers and the
components of mechanical advantage.
c. After the prediction have each group perform five trials at each insertion point,
measuring the distance traveled. Make sure the students pull back the model the
same amount for each trial. The easiest release point is when the radius and ulna are
parallel to the table. Have the students record the data on the data table and find the
average for each insertion point.
d. Compare their results to the prediction and have them explain why the third insertion
point produced (hopefully) the furthest distance in terms of levers and mechanical
advantage.
e. You could also have the students measure the input and output distances to calculate
the mechanical advantage of each insertion point.
3) Identifying the scientific method fallacy in this activity.
a. Have the students identify the manipulated, controlled and responding variable(s) in
this experiment.
b. Is there anything wrong with this picture? (if the students do not identify that the
tension of the rubber band also is manipulated in addition to changing the insertion
point nudge them in that direction) Hopefully the students will recognize that having
two manipulated variables is a violation of the scientific method.
c. Working in groups, have the students re-design the experiment so they are solely
measuring the effect of the different insertion points.
d. If time permits, allow the students to make the three different sets of muscles to make
the tension equal, have them form another prediction and run the data sets again
comparing these results to the first data sets.
4) Bioengineering Activity (optional)
a. Once the students have completed the exercises using the free-throw model introduce
students to the field of bioengineering by posing this unguided inquiry question:
i. Re-engineer this model to where it is a leg model and it kicks a ball.

13
Lever Mechanics Student Worksheet
Objective: Classify the lever actions of the free-throw model and determine the effect of
changing the effort distance.
Materials: Basketball(optional) Anatomy references
Extra string Rubber bands
Measuring tool (tape measure) Free-throw motion model
1. Studying your free throw motion
a. In groups of 2-3, each student will practice a free throw motion paying attention to
the muscles and joints involved.
b. You will discuss with your partners and use anatomy references to label the muscles
and joints.
2. Classifying levers
a. There are three levers working together to produce the free-throw motion
(discounting the effect of the shoulder). Using your own motion and observing the
model find the three levers and classify them as 1st, 2
nd, or 3
rd class.
b. Isolate the three levers and identify the fulcrum, effort and load. Draw and record
these on the data sheet.
3. Mechanical advantage of levers
a. Which of the three levers are affected if the insertion points on the radius/ulna are
changed?
b. Predict which muscle insertion is going to produce the greatest distance thrown and
why? Include references to lever class and mechanical advantage.
c. One student will act as the releaser for all trials. Make sure they always release the
ball from the same point. The easiest way is to release when the radius and ulna are
parallel to the ground/table.
d. Use the insertion point closest to the elbow joint first. One student will release the
ball and the others will calculate the distance traveled. Record.
e. Perform five trials and then find the average distance.
f. Repeat steps d-e using the second and third insertion points.
g. Measure effort and load distances for each insertion point and calculate the
mechanical advantage.
h. Compare your results to your prediction. Did the evidence support or refute your
hypothesis? Why or why not? Include discussion of effect of mechanical advantage
on distance thrown.
4. Scientific Method
a. Identify the manipulated, controlled and responding variables.
b. What are some problems with the activity you just completed?
c. As a group, re-design the experiment so it is solely measuring the effect of changing
insertion points.
d. Make your suggested changes and run the data sets again. You will have to make
your own data tables.
e. Compare these results to your previous data set.
5. Bioengineering(optional)
a. Re-engineer this model to where it is a leg model and it kicks the practice golf ball.

14
Data Sheet
Which of the three levers are affected if the insertion points of the triceps are
changed?___________________________________________________________
__________________________________________________________________
__________________________________________________________________
__________________________________________________________________
Class of lever:_________________________________________________________
Muscles and joints involved:______________________________________________
Draw and label the fulcrum, effort, and load:
Class of lever:_________________________________________________________
Muscles and joints involved:______________________________________________
Draw and label the fulcrum, effort, and load:
Class of lever:_________________________________________________________
Muscles and joints involved:______________________________________________
Draw and label the fulcrum, effort, and load:

15
Hypothesis: Which muscle insertion is going to produce the greatest distance
thrown and why? Include references to lever class and mechanical
advantage.__________________________________________________________
__________________________________________________________________
__________________________________________________________________
Insertion Point 1 Insertion Point 2 Insertion Point 3
Trial 1
Trial 2
Trial 3
Trial 4
Trial 5
Average Distance
Mechanical
Advantage
Discussion: Identify manipulated, controlled, and responding variables
Manipulated:___________________________________________________
Controlled:____________________________________________________
Responding:___________________________________________________
How does this activity violate the scientific method?________________________
__________________________________________________________________
__________________________________________________________________
___________________________________________________
Compare your results to your prediction. Did the evidence support or refute your
hypothesis? Why or why not? Include discussion of effect of mechanical
advantage on distance thrown.__________________________________________
__________________________________________________________________
__________________________________________________________________
__________________________________________________________________
On a separate sheet of paper, re-design this experiment so you are only solely
measuring the effect of the different insertion points. The sections that must be
included are: materials, methods, hypothesis, identification of variables, and data
tables. Run the experiment.

16
Finding the Velocity of a Projectile Using Vectors
Objective: Students will be able to construct the resultant velocity vector from the arm model
and use the parallelogram method to draw the resultant vectors.
Safety considerations: The students are working with a tension-filled model, thus it would be
advised that they wear proper eye protection.
Exercises:
1. Design a makeshift protractor: There are two different routes that can be taken to find the
release angle.
a. Obtain a large piece of cardboard.
i. Use small protractor in the bottom center of the cardboard and extend the
major angles with a meter stick (90, 75, 60, 45, 30, 15)
ii. Cut out the Cardboard in a half-dome shape
b. The second option (less accurate) is to have a student use a meter stick showing
the angle and comparing it to a small protractor to find the release angle.
2. Finding the resultant vector of the projectile (Groups of 4)
a. Each group member is going to have a particular role: releaser, angle determiner,
and two people in charge of the stopwatches, and measuring distance.
b. Releaser: Needs to make sure the arm is brought back the same distance for every
throw. The easiest way is to release the ball when the radius/ulna are parallel to
the table.
c. Angle determiner: Using whatever makeshift protractor method, this person
needs to use a meter stick to re-create the angle from the base of the humerus to
where the ball was released. Either using the small protractor or cardboard
protractor, record the release angle.
d. Stopwatch: These people need to start the stopwatch when the ball was released
and stop when the ball hits the floor. The actual time will then be the average
time between the two. It would be advised to have someone stand right next to
the release point, and the other closer to where the ball hits. They will then mark
where the ball hits and measure the distance from the model.
3. Finding the release height:
a. Place the model at the first release point.
b. Have one student launch the ball and the other students are closely observing at
what height the ball is released.
c. Have the students agree upon a spot and measure the height from the ground/table
to that point and record in the data table. Perform a total of three trials and
calculate the average.
d. Repeat the steps for the second and third release points.
4. Measured data:
a. Perform five trials at each of the release angles. Move the dowels at the base of
the model to either the 1st, 2nd, or 3rd inserts to change the angles.
b. The release angle of each trial will be recorded and then the average taken.
c. The average times for each trial will be recorded, and then the final average taken.
d. The distance for each trial will be recorded, and then the average taken.

17
e. Each student will then have to calculate the vertical velocity of the ball for each
trial using the equation h(t) = -4.9t2 + vyt + h0
f. Each student will also calculate the horizontal velocity using the equation vx=
distance/time
g. Repeat the steps for each release angle.
h. Note: For assistance with the mathematics visits the Appendices at the back
of this module.
5. Graphing the vectors:
a. Students/class will need to come up with a graphing scale for the horizontal and
vertical velocities.
b. Students will then graph the horizontal and vertical components.
c. Using the parallelogram method, the students will diagram the resultant vector
which is v0. Using a ruler and the known scale record Vo
d. Using a protractor the students will determine the angle and compare it to the
measured angle.
6. Discussion points:
a. Make sure you have the students predict which release angle is going to produce
the greatest velocity and distance. Why?
b. Have students identify the manipulated, controlled, and responding variables.
c. What is the ideal release angle for a projectile object like a cannon ball and why?
Use your data and vectors to come to this conclusion.
7. Extension Opportunity (optional)
a. For a fun competition, purchase some cheap basketball hoops that stick to the wall
(available at any variety or dollar store).
b. Set up the hoop(s) at a known height and tell the students each group has 10 shots
and the group that makes the most baskets gets a prize, extra credit, or whatever
you choose. You could set a minimum amount of baskets to get a passing grade
for the activity.
c. Provide the students with piles of rubber bands, string, and other materials to re-
engineer the model to their liking.
d. Have the students evaluate their data to find the ideal angle of release, distance
away from hoop, etc…beforehand so they do not waste any shots.
e. You may want to present the mathematics to find the maximum height of the
different release points they measured.
i. Use the equation h(t) = -4.9t2 + vyt + h0.
ii. Because the motion of the flight is a parabola the maximum height is
when the time is at its halfway point.
iii. For help with the mathematics, refer to the Appendices at the end of the
module.

18
Vector Activity Student Worksheet
Objective: Construct the horizontal and vertical components and use the parallelogram method
to find the resultant velocity vector.
Materials: Free-throw model Large piece of cardboard (1 per group)
Meter stick Protractor
Stopwatches (2 per group) Graph paper
Tape measure Ruler
A. Roles
o You will be in groups of 4, your teacher will inform whether you get to choose your
roles or they will be assigned.
Releaser: You are in charge of using the free-throw model, launching the ball.
It is important that you release the ball at the same point for each trial. The
easiest way is to release when the radius/ulna is parallel to the ground.
Angle Determiner: Using the protractor you built in section A keep a close
eye on the model and mark the release angle.
Timer(2): One person will stand near the model and the other near where the
ball will land. Both students will press START when the ball is released from
the hand and STOP when it hit the ground. The student by the landing will
mark where the ball hits and the timers will measure the distance from the
model.
B. Building the protractor
o Obtain a large piece of cardboard
o Place a small protractor on the bottom center of the cardboard and make marks of the
major angles (15, 30, 45, 60, 75, 90, 105, 120, 135, 150, and 165)
o Use a meter stick to extend the angles.
o Cut out the cardboard in a half-moon shape like the protractor.
C. Finding the release height
o Place the model at the first release point.
o Have one student launch the ball and the other students are closely observing at what
height the ball is released.
o Agree upon a spot and measure the height from the ground/table to that point and
record in the data table. Perform a total of three trials and calculate the average.
o Repeat the steps for the second and third release points.
D. Finding the resultant velocity vectors
o Predict which release point is going to produce the greatest velocity upon release.
o Place the wooden dowels on the base in the first hole.
o The releaser will pull back the model and release the ball, angle determiner marking
the angle, and timers find the time in the air and distance the ball traveled.
Record.
Calculate vertical velocity using the equation h(t) = -4.9t + vy. + h0

19
Calculate horizontal velocity using Vx= distance/time
o Perform five trials.
o Repeat the steps at the other two release angles.
E. Graphing the vectors
o Come up with a scaling method for the magnitude the vertical and horizontal
components.
o Use ruler to draw the horizontal and vertical components
o Draw parallelograms to find the resultant vector.
o Use a ruler to determine the velocity of the resultant vector.
o Use a protractor to measure the release angle.
o Compare the graphed release angle to the measured angle.

20
Finding the Velocity of a Projectile Using Vectors
State your hypothesis: Which release point is going to produce the highest velocity
and why? ______________________________________________
__________________________________________________________________
________________________________________________________
Release
point 1
Trial 1 Trial 2 Trial 3 Trial 4 Trial 5 Average
Release
Height (h0)
n/a n/a
Angle of
Release
Time
(sec)
Distance
(m)
Velocityy
(m/s)
Velocityx
(m/s)
Velocity0 n/a n/a n/a n/a n/a
Release
point 2
Trial 1 Trial 2 Trial 3 Trial 4 Trial 5 Average
Release
Height (h0)
n/a n/a
Angle of
Release
Time
(sec)
Distance
(m)
Velocityy
(m/s)
Velocityx
(m/s)
Velocity0 n/a n/a n/a n/a n/a

21
Release
point 3
Trial 1 Trial 2 Trial 3 Trial 4 Trial 5 Average
Release
Height (h0)
n/a n/a
Angle of
Release
Time
(sec)
Distance
(m)
Velocityy
(m/s)
Velocityx
(m/s)
Velocity0 n/a n/a n/a n/a n/a
Release point 1 Release point 2 Release point 3
Measured angle
Discussion:
Identify the controlled, manipulated, and responding variables in this activity:
Controlled:____________________________________________________
Manipulated:___________________________________________________
Responding:___________________________________________________
Compare your measured angle and the angle of release using the makeshift
protractor. Were they reasonably close? What are some factors that contributed to
their differences? ____________________________________________________
__________________________________________________________________
__________________________________________________________________
__________________________________________________________________

22
Compare your v0 values between the three release points. Did the data support or
refute your hypothesis? Why or why not? _______________________________
__________________________________________________________________
__________________________________________________________________
__________________________________________________________________
__________________________________________________________________
What is the ideal release angle for a projectile object like a cannon ball and why?
Use your data and vectors to come to this conclusion._______________________
__________________________________________________________________
__________________________________________________________________
__________________________________________________________________
__________________________________________________________________
__________________________________________________________________
__________________________________________________________________
When working with this model, do you think that it represents an accurate
portrayal of a human arm? Why or why not?______________________________
__________________________________________________________________
__________________________________________________________________
__________________________________________________________________
__________________________________________________________________
__________________________________________________________________

23
Uniform Motion Activity Materials
1. Stopwatch
2. Calculator
3. Model
4. Tape measure
Mathematics
1. , where t is the time measured in seconds, is the
vertical component ( velocity ) and is the initial height.
2. , where is the horizontal component (velocity) , t is the elapsed time(the time
the ball is in the air), and d is the distance the ball travelled.
3. , where is the velocity of the ball.
4.
5. , or
Students will use the model to make predictions as to the maximum height the ball will achieve
during its flight, and optimum angles that will achieve and furthest distance the ball will travel.
They will then check those results using the mathematics and hypothesize why or why not the
results vary with the initial predictions.
Step 1: Using the muscle insertion point in the first position, place the ball in the hand and
release the arm. Students will use the stopwatch to time the flight of the ball. Once the ball has
completed its flight, the students will measure the distance the ball has travelled.
Step 2: Once we have the time and distance we can calculate and . To find , substitute
the values t and found from the trials using the model into „1‟. Find using „2‟. Now, we
can use „3‟ to find the velocity of the ball.
Step 3: We are now ready to find the maximum height of the ball. Using the average time of the
flight of the ball, , substitute this number in for t in . The result will be the maximum
height the achieved during its flight.
Step 4: Calculate the angle, , that the ball was released using either the sine ratio or the cosine.
To do this, use either or the .
*(for an example, see the appendix)

24
Student Activity Worksheet
Uniform Motion Materials
5. Stopwatch
6. Calculator
7. Model
8. Tape measure
Mathematics
6. , where t is the time measured in seconds, is the
vertical component ( velocity ) and is the initial height.
7. , where is the horizontal component (velocity) , t is the elapsed time(the
time the ball is in the air), and d is the distance the ball travelled.
8. , where is the velocity of the ball.
9.
10. , or
1) With arm cocked and ready to launch, measure the distance from the ball to the floor and
record the result. This is the value in „1 „ above.
2) Using the model, a stopwatch and a tape measure, launch the ball three times and record the
time and distance in the table provided. Start the stopwatch upon release of the arm and stop
when the ball strikes the ground.
Trial 1 Trial 2 Trial 3 Avg. Trial
Time
Distance
3) Using the data you recorded, answer the following questions:
1) Find and . ( Hint: To find , set )
2) Using and , find . What does this quantity represent?
3) Calculate the maximum height the ball achieved.
4) Find the angle that ball was released at.

25
4) Repeat the above exercises by moving your stop block to the second and third locations.
Record all data.
Stop 2:
Trial 1 Trial 2 Trial 3 Avg. Trial
Time
Distance
Stop 3:
Trial 1 Trial 2 Trial 3 Avg. Trial
Time
Distance
5) What happens to the trajectory when the arm is elevated? Why?
6) At what angle do you think you would achieve a maximum trajectory? Why?
7) When working with this model, do you think that it represents an accurate portrayal of a
human arm? Why or why not?
8) If you answered no to question 7, what do you think you could do to the model to create
something that more closely resembles human motion?

26
Extensions Uniform Motion
If a CBR (Calculator Based Ranger, Texas Instruments) is available, it can be used by the
students to analyze uniform motion and interpreting data from graphs. This can be achieved by
having the students break up into small groups and have one student hold the CBR in front of the
model. Cock and release the arm and follow the instructions with the CBR to gather the data
from the motion of the ball. They can then interpret the data displayed from the graph(s) and
compare those to the data they gathered from the activities.
Transforming Arm Model to a Leg Model
Once the students have completed the exercises using the free-throw model introduce
students to the field of bioengineering by posing this unguided inquiry question:
o Re-engineer this model to where it is a leg model and it kicks a ball.
Free Throw Competition
For a fun competition, purchase some cheap basketball hoops that stick to the wall
(available at any variety or dollar store).
Set up the hoop(s) at a known height and tell the students each group has 10 shots and the
group that makes the most baskets gets a prize, extra credit, or whatever you choose.
You could set a minimum amount of baskets to get a passing grade for the activity.
Provide the students with piles of rubber bands, string, and other materials to re-engineer
the model to their liking.
Have the students evaluate their data to find the ideal angle of release, distance away
from hoop, etc…beforehand so they do not waste any shots.
You may want to present the mathematics to find the maximum height of the different
release points they measured.
o Use the equation h(t) = -9.8t2 + vyt + h0.
o Because the motion of the flight is a parabola the maximum height is when the
time is at its halfway point.
o For help with the mathematics, refer to the Appendices at the end of the module.

27
Appendix
This appendix contains all of the key mathematical concepts needed by the student to be
successful when attempting this module. Student exercises are include, with answers provided at
the end of the appendix.
Quadratic Formula

28
The Pythagorean Theorem
A
c
b
C a B

29
Right Triangle Trigonometry
A
c
b
C
a B

30
Uniform Motion
31
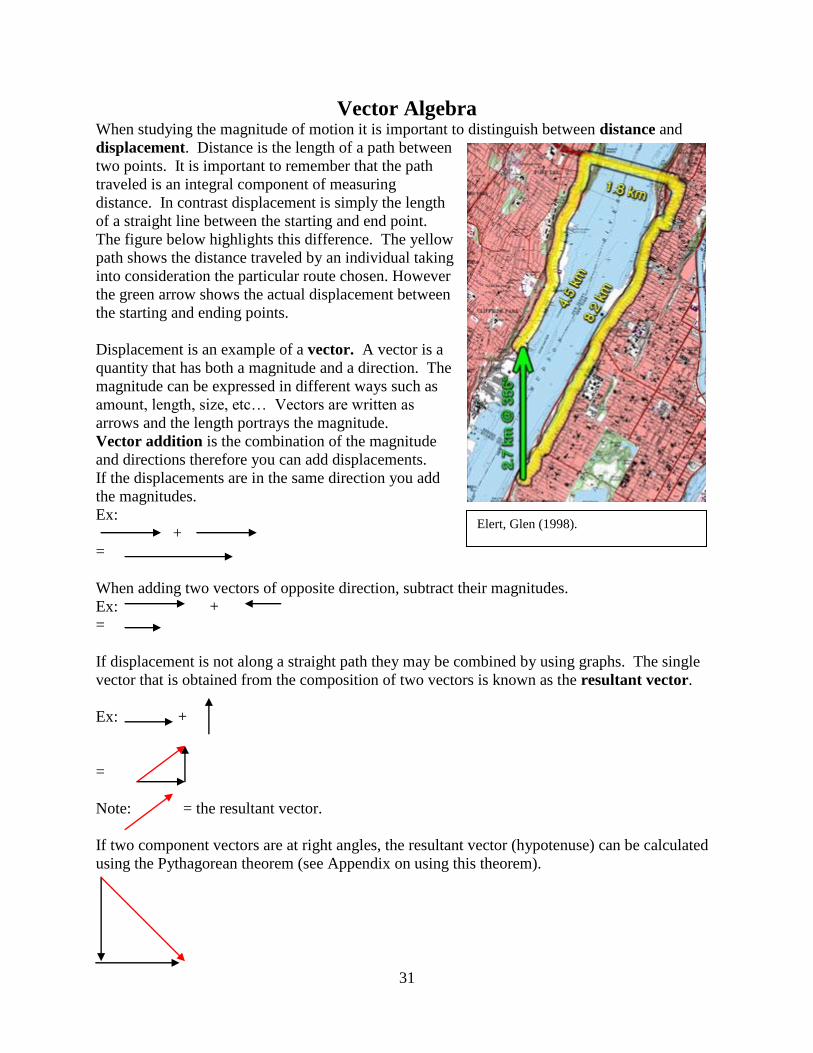
Vector Algebra When studying the magnitude of motion it is important to distinguish between distance and
displacement. Distance is the length of a path between
two points. It is important to remember that the path
traveled is an integral component of measuring
distance. In contrast displacement is simply the length
of a straight line between the starting and end point.
The figure below highlights this difference. The yellow
path shows the distance traveled by an individual taking
into consideration the particular route chosen. However
the green arrow shows the actual displacement between
the starting and ending points.
Displacement is an example of a vector. A vector is a
quantity that has both a magnitude and a direction. The
magnitude can be expressed in different ways such as
amount, length, size, etc… Vectors are written as
arrows and the length portrays the magnitude.
Vector addition is the combination of the magnitude
and directions therefore you can add displacements.
If the displacements are in the same direction you add
the magnitudes.
Ex:
+
=
When adding two vectors of opposite direction, subtract their magnitudes.
Ex: +
=
If displacement is not along a straight path they may be combined by using graphs. The single
vector that is obtained from the composition of two vectors is known as the resultant vector.
Ex: +
=
Note: = the resultant vector.
If two component vectors are at right angles, the resultant vector (hypotenuse) can be calculated
using the Pythagorean theorem (see Appendix on using this theorem).
Elert, Glen (1998).
32
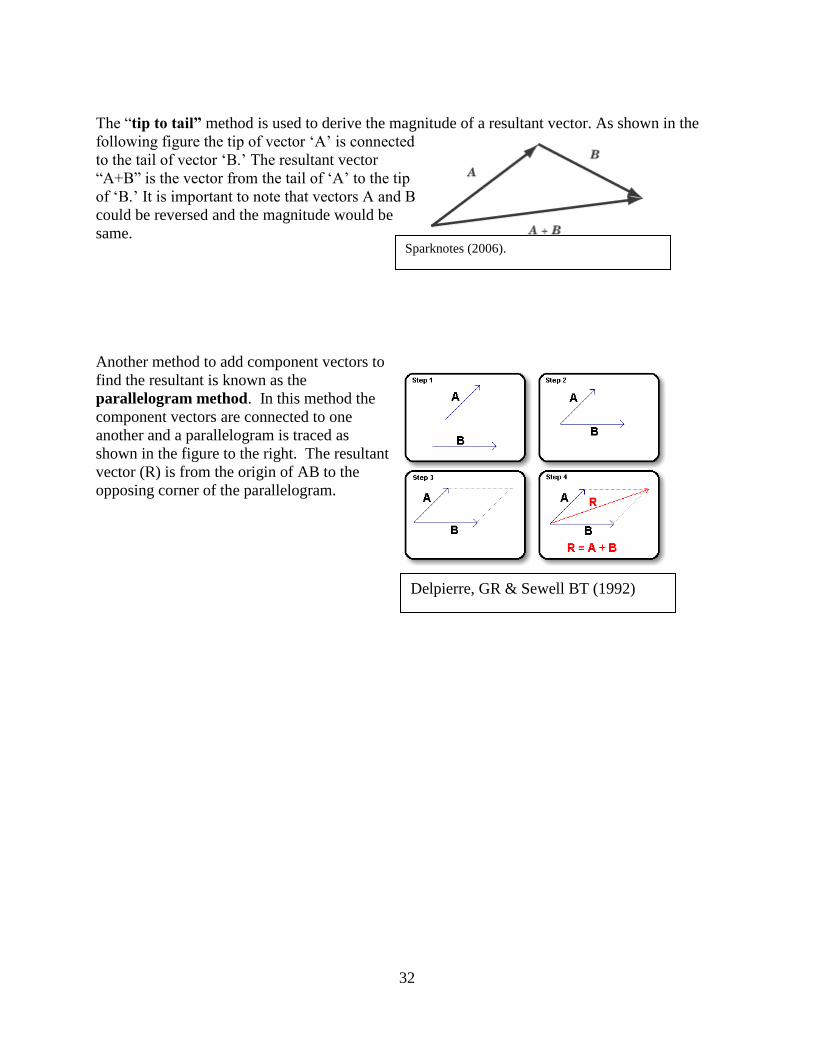
The “tip to tail” method is used to derive the magnitude of a resultant vector. As shown in the
following figure the tip of vector „A‟ is connected
to the tail of vector „B.‟ The resultant vector
“A+B” is the vector from the tail of „A‟ to the tip
of „B.‟ It is important to note that vectors A and B
could be reversed and the magnitude would be
same.
Another method to add component vectors to
find the resultant is known as the
parallelogram method. In this method the
component vectors are connected to one
another and a parallelogram is traced as
shown in the figure to the right. The resultant
vector (R) is from the origin of AB to the
opposing corner of the parallelogram.
Sparknotes (2006).
Delpierre, GR & Sewell BT (1992)

33
Exercises:
1. Draw the resultant vector, when composing the following vectors:
a. + =
b. + =
c. + =
d. +
2. Compute the magnitude R of the resultant vector, given the magnitudes of vectors A and
B.
a. A = 3, B = 4, R = ? (A & B are in the same direction)
R
b. B
A
3. Draw the component vectors and determine the magnitude of the resultant vector.
a. A girl walks home from school to home the same way each day. She starts by
walking 2 blocks east, then turns a corner and walks one block north. She turns
once again and walks one block east. She finishes the walk home by going three
blocks to the north. What are the distance the girl traveled and the displacement
from the school to the house?

34
References
Barton, ML & Heidema, C (2002). Teaching and Reading in Mathematics (2nd
Ed.) MCREL.
Bioengineering Overview (2003). Sloan Career Center. Retrieved July 30, 2008 from
http://www.careercornerstone.org/pdf/bioeng/bioeng.pdf
Bionewsonline (2005) Transgalactic LTD. Retrieved July 30, 2008, from
http://www.bionewsonline.com/k/what_is_bioengineering.htm
Delpierre, GR & Sewell BT (1992). Electronic Science Tutor. Found July 30, 2008 from
http://www.physchem.co.za/Vectors/Addition.htm#Parallelogram
Elert, Glen (1998) Physics Hypertextbook. Found July 9, 2008 at
http://hypertextbook.com/physics/mechanics/displacement/
Secrets of Lost Empires—Pharoahs Obselisk (2004). NOVA Teachers. Found July 30, 2008
from http://www.pbs.org/wgbh/nova/teachers/activities/27po_sle2phar.html
Vector Addition (2006). Sparknotes. Found July 30, 2008 from
http://www.sparknotes.com/testprep/books/sat2/physics/chapter4section2.rhtml