Embed Size (px)
Citation preview
BIOMECHANICAL ANALYSES OF ANTERIOR VAGINAL WALL PROLAPSE: MR IMAGING AND COMPUTER
MODELING STUDIES
by Luyun Chen
A dissertation submitted in partial fulfillment Of the requirements for the degree of
Doctor of Philosophy (Biomedical Engineering)
In The University of Michigan 2008
Doctoral Committee: Research Professor James A. Ashton-Miller, Co-Chair Professor John O.L. DeLancey, Co-Chair Professor Douglas C. Noll Professor Gregory M. Hulbert

© 2008
Luyun Chen
All Rights Reserved

ii
To my parents

iii
Acknowledgements
Thank you Professor James A. Ashton-Miller and Professor John O.L. DeLancey for the
guidance, assistance, patience and encouragement; to Professor Douglas C. Noll and
Professor Gregory M. Hulbert for serving on my committee and for the helpful advice
and comments; to Yvonne Hsu for all the wonderful corporations and contribution on
clinical insights; to Biomechanics Research Lab and Pelvic Floor Research Group for
stimulating and friendly interdisciplinary research environment; to NIH grants NICHD
R01 HD038665, P50 HD044406, for financial support.

iv
Preface
Chapter 2 to chapter 6 of this dissertation were written as separate papers, published or to
be submitted to technical journals. For that reason some repetition of material does occur,
particularly in the introduction of each chapter.
v
Table of Contents Dedication .....................................................................................................................ii Acknowledgements .....................................................................................................iii Preface..........................................................................................................................iv List of Figures...........................................................................................................vii List of Tables............................................................................................................xiv List of Appendices....................................................................................................xv Chapter 1 Introduction..............................................................................................1
1.1 What is pelvic organ prolapse and how big is the problem? .....................................................1 1.2 Why is improving understanding mechanisms of anterior vaginal wall prolapse important?...2 1.3 What are risk factors for pelvic organ prolapse? .......................................................................3 1.4 What structures are responsible for normal pelvic floor support?.............................................4
Levator ani muscle support .....................................................................................................4 Connective tissue support........................................................................................................5
1.5. A brief historical overview and the present understanding of the mechanisms underlying anterior vaginal wall prolapse. ........................................................................................................6 1.6 What is the evidence for connective tissue failure in the development of AVP? .................... 11 1.7 What is the evidence that suggests levator ani muscle impairment also plays a role in AVP? 12 1.8 Hypothesis and Specific Aims................................................................................................. 12
Aim 1: Morphological measurement of anterior vaginal wall support system using MR imaging.................................................................................................................................. 13 Aim 2: Biomechanical modeling of AVP ........................................................................... 13 Aim 3. In vivo assessment of the compliance of the anterior compartment and the exploration of more extensive ways to validate model ......................................................... 14
References ..................................................................................................................................... 15 Chapter 2 Cross-sectional Area Measurement of Levator Ani Muscle in women with and without prolapse ..........................................................................19
2.1 Introduction ............................................................................................................................. 19 2.2 Materials & Methods:.............................................................................................................. 21
2.2.1 Develop and validate measurement technique on women with unilateral levator ani muscle defect......................................................................................................................... 21 2.2.2 Quantify muscle cross-section loss in women with and without prolapse ................... 28
2.3 Results ..................................................................................................................................... 31 2.3.1 Results for women with unilateral levator ani muscle defect....................................... 31 2.3.2 Results for women with and with prolapse .................................................................. 33
2.4 Discussion ............................................................................................................................... 35 Chapter 3 Geometrical Analyses of Anterior Vaginal Wall in Women Wit
h and Without Prolapse..........................................................................................44 3.1 Vaginal Thickness, Cross-Sectional Area, and Perimeter in Women With and Those Without Prolapse ......................................................................................................................................... 44
ABSTRACT.......................................................................................................................... 44 3.1.1 Introduction .................................................................................................................. 45

vi
3.1.2 Materials and Methods ................................................................................................. 46 3.1.3 Results .......................................................................................................................... 49 3.1.4 Discussion .................................................................................................................... 52
3.2 Anterior vaginal wall length and degree of anterior compartment prolapse seen on dynamic MR images .................................................................................................................................... 56
ABSTRACT.......................................................................................................................... 56 3.2.1 Introduction .................................................................................................................. 56 3.2.2 Materials and methods.................................................................................................. 57 3.2.3 Results .......................................................................................................................... 60 3.2.4 Discussion .................................................................................................................... 62
References ..................................................................................................................................... 65 Chapter 4 2D Conceptual Lumped Parameter Model .....................................70
4.1 Introduction ............................................................................................................................. 71 4.2 Methods................................................................................................................................... 72 4.3 Results ..................................................................................................................................... 77 4.4 Discussion ............................................................................................................................... 79
Chapter 5 Development of a 3-D Finite Element Model of Anterior Vaginal Wall Support to Evaluate Mechanisms Underlying Cystocele Formation87
ABSTRACT.................................................................................................................................. 87 5.1 Introduction ............................................................................................................................. 88 5.2 Methods................................................................................................................................... 89 5.3 Results ..................................................................................................................................... 94 5.4 Discussion ............................................................................................................................. 101 References ................................................................................................................................... 104
Chapter 6 In Vivo Assessment of Anterior Compartment Compliance and Its Relation to Prolapse ......................................................................................107
ABSTRACT................................................................................................................................ 107 6.1 Introduction ........................................................................................................................... 108 6.3 Results ................................................................................................................................... 112 6.4 Discussion ............................................................................................................................. 112 References ................................................................................................................................... 115
Chapter 7 General Discussion.............................................................................. 117 Chapter 8 Conclusions...........................................................................................125 Chapter 9 Suggestions for Future Research.....................................................127 Appendices................................................................................................................129

vii
List of Figures
Figure 1-1. Photograph of the anterior vaginal wall protruding from the vaginal introitus showing two types of cystocele. Left; distention type AVP with stretched anterior vaginal wall (AVW). Right, displaced AVP with intact AVW that has become detached form supports (cervix, Cx also seen). (© DeLancey ) .....1
Figure 1-2 Illustration of levator ani muscle. Pubic portion include puboperineal
muscle (PPM), puborectalis muscle (PRM) and puboanalis muscle (PAM). ICM: iliococcygeal muscle; ATLA: Arcus tendineus levator ani; EAS: external anal spincter; PB: perineal body. (From DeLancey private collection) .................5
Figure 1-3 Anatomy of anterior vaginal wall support and sites of support failure
(Bladder removed) (© DeLancey ) .................................................................6
Figure 1-4. Bonney’s analogy of vaginal prolapse. The eversion of an intussuscepted surgical glove finger by increasing pressure within the glove is analogous to prolapse of the vagina © DELANCEY 2002, with permission).....................8
Figure 1-5 . Diagrammatic display of vaginal support. A. Invaginated area in a
surrounding compartment; B. The prolapse opens when the pressure (arrow) is increased; C. Closing the bottom of the vagina prevents prolapse by constriction; D. Ligament suspension; E. Flap valve closure where suspending fibers hold the vagina in a position against the wall allowing increases in pressure to pin it in place ©DELANCEY 2002, with permission).................................................9
Figure 1-6 The extant understanding of cystocele formation supported by scientific
studies. ..........................................................................................................10
Figure 1-7 Variation between women with AVP (© DeLancey) ......................... 11
Figure 2-1: Axial proton density MR image of a woman with a right unilateral defect. The left levator ani muscle is intact (denoted by *) while the right side portion of the muscle is missing. PB denotes pubic bone; U: urethra; V: vagina; R: Rectum; OI: obturator internus muscle. ......................................................................22
Figure 2-2. Reconstructed 3-D model showing the pubic bone and levator ani muscle
with a right unilateral defect (A). In B, the dashed region shows the expected location of the missing muscle after reflecting the muscle from the normal across the midline side. ............................................................................................24
viii
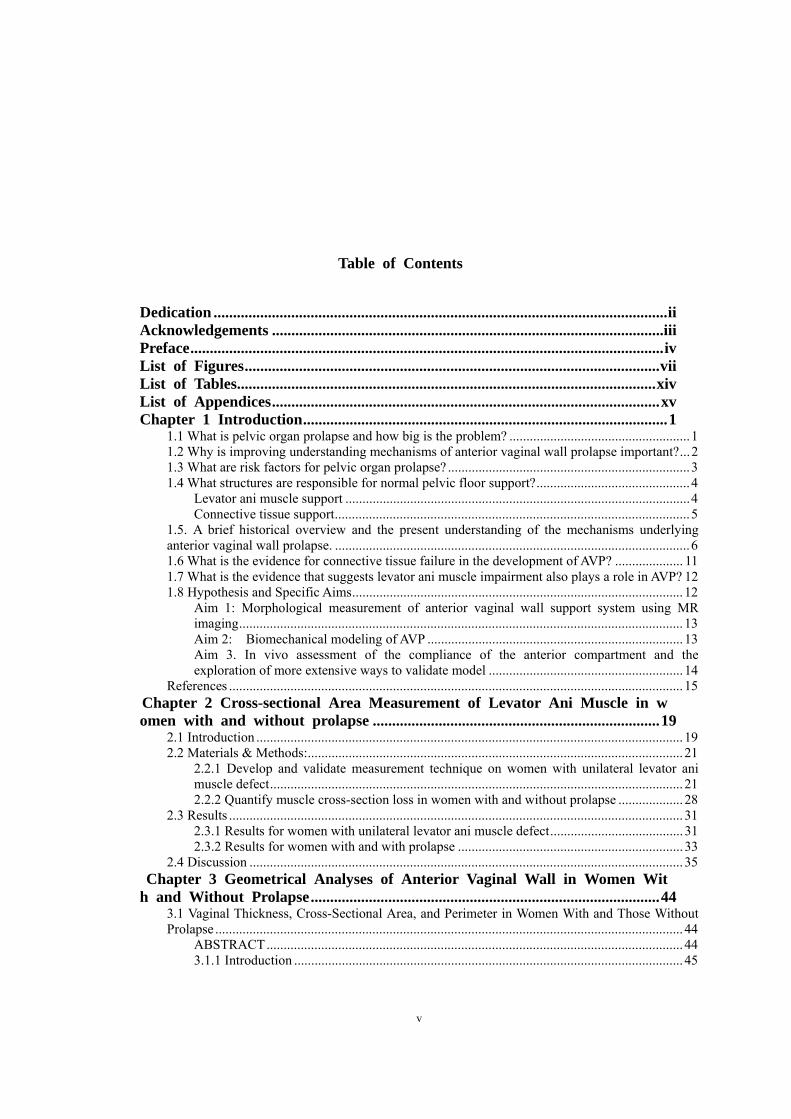
Figure 2-3. Separating the pubic portion of levator ani from the iliococcygeus portion on MR scans. a): identification of the middle point (triangle) on the mid-sagittal MRI; b & c): identification of the two lateral points on MRI (cross and diamond). The following structures were identified in MRI to help for orientation. PS: pubic symphysis; PB:pubic bone; B: bladder; A: anus; OI: oburator internus; U:uterus (with fibroids); PRM: puborectalis muscle. ICM: iliococcygeus muscle.....25
Figure 2-4: 3-D view of the separation of the pubic portion from the iliococcygeal
portion of the levator ani. The dashed line represents the plane of separation, while the triangle, cross and diamond have the same meaning as in the preceding figure. ............................................................................................................25
Figure 2-5. Reference points for determining fiber direction in the pubic portion of
the levator ani. a) Origin points on axial MR at its junction with obturator internus (OI) as open circle on patient’s left and filled circle on patient’s right; b&c) Right (filled square) and left (open square) insertion point on sagittal MR scans. The following structures are identified aid orientation. PB: pubic bone; B: bladder; V: vagina; R: rectum; A: anus............................................................................26
Figure 2-6. Lines connecting the origin and insertion points (see preceding figure)
were used to estimate muscle fiber direction. The dashed region shows the expected location of the muscle on the defective side, were it intact. ..........26
Figure 2-7. Steps to quantify levator ani muscle loss in a subject with a unilateral
defect. A: Frontal view of the 3-D reconstruction model of levator ani was built. B: The pubic portion is separated from the iliococcygeal portion; here only the pubic portion is shown. C: The line of estimated fiber direction of the pubic portion was determined. Equally-spaced cutting planes perpendicular to the fiber direction line were placed. D: The resulting cross-sections are shown. Cross-sectional areas were then calculated. Due to the defect on the right, muscle is not present at location 1, therefore, it is not shown. .....................27
Figure 2-8 A: Cross-sectional area perpendicular to dnormalT muscle direction; B:
Cross-sectional area perpendicular to remaining muscle direction. .............28
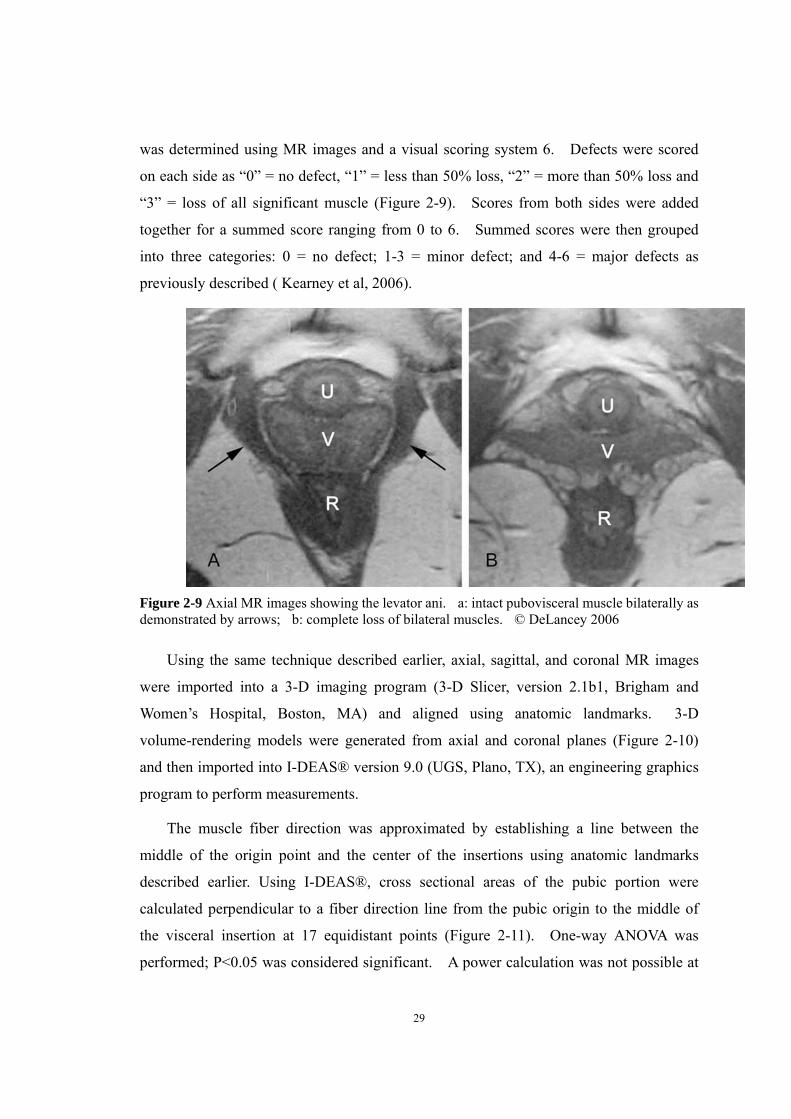
Figure 2-9 Axial MRI showing the levator ani. a: intact pubovisceral muscle bilaterally as demonstrated by arrows; b: complete loss of bilateral muscles. © DeLancey 2006 .............................................................................................29
Figure 2-10 3-D Slicer models. a: ¾view of the levator ani muscle and pubic bone;
b: levator ani with pubic bones removed; c: lateral view of muscle. © DeLancey 2006 .............................................................................................30
Figure 2-11: Levator model and cross-sections. Fiber direction line for the left side of pubic portion of levator ani muscle is shown. The locations of cross-section areas

ix
(CSA) are shown and numbered 1 (most ventral) to 17 (most dorsal). The model has been cut at CSA 7. CSA 8 to 16 are not numbered in the figure. © DeLancey 2006 .............................................................................................30
Figure 2-12. Bilateral comparison of muscle cross-sectional area of pubic portion of
levator ani muscle perpendicular to its fiber direction. Bars are standard error and * denotes p<0.05. ..........................................................................................32
Figure 2-13: Levator cross-section areas at various locations (Mean ± SEM).....34 Figure 3-1-1. Axial slices at 5-mm intervals arranged caudal to cephalad starting from
the image in the upper left (image 0). Vaginal tracings were made from above the level of the vestibular bulbs (VB), represented by asterisks (*), caudally (image 0) to below where the cervix (C) could be seen (image -4.0). U, urethra; V, vagina; R, rectum; B, bladder. © DeLancey 2004. ........................................................47
Figure 3-1-2. Selected 3-dimensional model as it appears in I-DEAS 9.0. The sacrum
(Sac), pubic bone (PB), and pelvic organs have been shown for orientation. B, bladder; U, urethra; UT, uterus; V, vagina; R, rectum. © DeLancey 2004...48
Figure 3-1-3. Steps in obtaining vaginal measurements: A. Threedimensional I-DEAS
9.0 vaginal model. B. Longitudinal axis determined in the mid-sagittal plane, with 5 equally spaced locations along the longitudinal axis marked. C.Sample cross sections: Location 1 is near the vaginal apex, and location 5 is near the hymen. D. Mid-sagittal diameter, perimeter, and cross-sectional area were calculated for each axial cross section. © DeLancey 2004. .........................49
Figure 3-1-4. Vaginal mid-sagittal diameter at each of the 5 vaginal locations. Refer to
Figure 3-1-3 for vaginal locations. The aggregate mean of the 5 individual segments is also shown at right. Error bars indicate standard error of the mean........................................................................................................................50
Figure 3-1-5. Cross-sectional area at each of the 5 vaginal locations. The aggregate
mean of the 5 individual segments is shown at right. Error bars indicate standard error of the mean...........................................................................................51
Figure 3-1-6. Vaginal perimeter. The aggregate mean of the 5 individual segments is
shown at right. Error bars indicate standard error of the mean.....................52
Figure 3-2-1 MR image at maximal Valsalva showing anterior vaginal wall tracing (solid black line), distal vaginal wall (x), bladder location (triangle), cervical os location (circle), and coordinate system (dotted lines) .................................59
Figure 3-2-2 Area under the anterior vaginal wall profile. Pubic bone, sacrum, and
coccyx are traced. The anterior vaginal wall tracings are shown. A line (small dotted) is used to connect the two ends of the vaginal wall tracing to create an area (shown in gray). Examples aligned using horizontal large dotted reference line. a Minimal descent of most caudal bladder point (triangle). b Greater descent of the bladder point with longer vaginal wall length and larger area. c Similar vaginal

x
wall length to B but smaller area and lesser descent of bladder point..........60
Figure 3-2-3 Vaginal length during Valsalva and distance of the most caudal bladder point below normal. There is a linear correlation y = 0.69 x − 0.85, R 2 = 0.30 61
Figure 3-2-4 Subject examples showing relationship between apical support and
vaginal length in determining the size of cystoceles. Top row: MR image with maximal Valsalva. Bottom row: Coordinate axis, vaginal tracings, as well as bladder and cervical locations. Images have been standardized for pelvic size and orientation. a Subject who had uterine descent and large cystocele. b Subject with relatively well-supported apical compartments who had large cystocele with a long anterior vaginal wall. c Subject with cystocele and a normal vaginal wall length. d Subject with cystocele with a short vaginal wall length ................62
Figure 4-1, Model Development. A: mid-sagittal MR image. B: modeled element
traced or projected on mid-sagittal MR image. C: lumped parameter biomechanical model. Pubovisceral muscle ( PVM ) is modeled as a spring in parallel with an active force generator. PS: pubic symphysis; SAC: sacrum; PM: perineal membrane; LA plate: levator plate; R: rectum; V: vagina; CL: cardinal ligament spring; US: uterosacral ligament spring; B: bladder; UT: uterus. Copyright: Biomechanics Research Laboratory, University of Michigan, 2006 73
Figure 4-2. Force diagram showing the loading of the anterior vaginal wall and its
support system. .............................................................................................76
A: loading anterior vaginal wall with normal muscular support ; B: loaded pelvic floor with defective muscular support and part of vaginal wall exposed to intra-abdominal pressure (light grey arrows). IAP denotes intra-abdominal pressure; Fpvm: tensile force generated by pubovisceral muscle between the projection of its origin on the pelvic side wall and insertion on the levator plate; Tc and Tu: tensile forces generated by the cardinal and uterosacral ligaments; D: the decent of the most dependent point of vaginal wall from end of perineal membrane (PM) which is used as the measurement of prolapse size in the simulation. Note descent of the vaginal apex as well as vaginal wall protrusion. Copyright: Biomechanics Research Laboratory, University of Michigan, 2006 76
Figure 4-3. Simulated deformation of the model anterior vaginal wall, and its support
system, under maximal Valsalva with various degrees of pubovisceral muscle (PVM) and cardinal and uterosacral ligament impairment (indicated in percent). D presents the size of prolapse measured as the decent of the most dependent point of vaginal wall from end of perineal membrane. Copyright: Biomechanics Research Laboratory, University of Michigan, 2006....................................78
Figure 4-4: Prolapse size measured by the most dependent point on the vaginal wall
as a function of apical support impairment for different degrees of pubovisceral muscle (PVM) impairment. Copyright Biomechanics Research Laboratory, University of Michigan, 2006 .......................................................................79

xi
Figure 4-5. Validation of the model. A: mid-sagittal MR image of resting status; B:
mid-sagittal MR image at maximum Valsava; C: sample model simulation result having a similar configuration as in (b). In this figure PS denotes pubic symphysis; SAC: sacrum; PM: perineal membrane; PVM: pubovisceral muscle; LA plate: levator plate; R: rectum; V: vagina; CL: cardinal ligament; US: uterosacral ligament; B: bladder; and UT: uterus Copyright Biomechanics Research Laboratory, University of Michigan, 2006 ...................................................80
Figure 5-2 The material property of vagina, ligaments and levator ani muscle used in
the model simulation,....................................................................................93
Figure 5-3 Vaginal wall tissue material properties at different stage of tissue adaptation. The curve on the left most (status 0) is the original data from Yamada (Yamada, 1976) which is assigned as status 0. Status 3, vaginal tissue has the longest dead band..........................................................................................93
Figure 5-4 Outcome measurements. The illustration is the model configuration at
maximum abdominal pressure and shows the four outcome measurements: a: apical descent, middle of vagina apex displacement from its position at rest; h: hiatus size at maximum loading, measured as tip of posterior vaginal compartment to distal end of vaginal wall (fixed); d: Prolapse size, measured as the vertical descent of the most dependent point of the vagina to distal end of vagina; Exposed Vaginal Length measured as the length of vaginal wall unsupported by the posterior vaginal compartment (and therefore exposed to the pressure differential with intra-abdominal pressure acting on the proximal surface and atmospheric pressure acting on its distal surface)..................................95
Figure 5-5. Model validation. At left side is one model-generated simulation result with a similar cystocele formation to that seen clinically in the dynamic MRI on right side of the figure...................................................................................96
Figure 5-6 Lateral view of a mid-sagittal plane section of the 3D finite element model.
Panel A: In this simulation, all support elements (levator ani muscle, cardinal uterosacral ligament, paravaginal support) have normal material properties. Panel B: In this simulation, the levator ani muscle was set to have a 60% reduction in its properties, and a 50% reduction in cardinal and uterosacral ligament and paravaginal support properties. LA denotes levator ani, CL: cardinal ligament, AVW: arterial vaginal wall, PC: posterior compartment, US: uterosacral ligament.......................................................................................................................96
Figure 5-7. Sequential development of a typical simulated cystocele. In this
simulation, the levator ani muscle had a 60% impairment, apical and paravaginal support properties were set to having a 50% impairment,,. The abdominal pressure was then increased from zero to 100 cmH2O over time course (plotted on the vertical axis of the bottom illustration) at four different time points (seen on the horizontal axis of the bottom plot). The first row shows the three-quarter view, while the second row shows a sagittal section. The color map shows the stress

xii
distributions in the different regions, with red indicating a low stress region and blue indicating a high stress region...............................................................97
Figure 5-8 Relationship between cystocele size and intra-abdominal pressure in a simulated cystocele. In this simulation, the levator ani muscle had a 60% impairment, apical and paravaginal support were set to having a 50% impairment. The best fit line for non-zero cystocele size data points is plotted. The linear regression equation and coefficient of determination are shown in the illustration........................................................................................................................98
Figure 5-9 Simulated cystocele size for models with different impairment patterns at
increasing values of maximum intra-abdominal pressure loading. ..............99
Figure 5-10 Effects of muscle impairment on cystocele formation. The outcome measurement was normalized to model outcome with intact LA muscle resistance to stretch........................................................................................................99
Figure 5-11 Effects of apical and paravaginal impairments on cystocele formation.
Simulations had 60% levator ani muscle impairments and were loaded with 168cmH2O maximum intra-abdominal pressure. For apical impairment simulations, models had normal paravaginal support, but a varying degree of apical support impairment with remaining apical connective tissue stiffness ranging from from 20% to 100% of the normal value. For paravaginal impairment simulations, models had normal apical support but varying degree of paravaginal support impairment with remaining paravaginal connective tissue stiffness ranging from 20% to 100% of normal values.............................................100
Figure 5-12 Relationship between vaginal tissue status and cystocele size. Vaginal
tissue dead band status 0, 1, 2, 3 were as shown in figure 5-3. ..................101
Figure 6-1 The upper tracings were constructed from dynamic mid-sagittal images of the subject whose lines is marked with an asterix. Black dots represent the most dependent bladder point and black triangles the location of the normal bladder point in nullipara. The graph showed the relationship between intra-abdominal pressure and bladder location during loading (solid tracing) and unloading (dashed tracing) cycle. Straight line is the best fitted line for the loading curve...................................................................................................................... 111
Figure 6-2 Best fit lines for the loading curves for all subjects. Solid lines present data
for women with prolapse, dashed line were the data for women with normal support......................................................................................................... 113
Figure 7-1 The understanding of cystocele formation supported by scientific data
extant at the time this dissertation work started in the year 2002. IAP denotes intra-abdominal pressure; AVW: anterior vaginal wall; T: tension; and ε : strain......................................................................................................................120
Figure 7-2 A new conceptual (systems analysis) model for the mechanism of anterior

xiii
vaginal wall prolapse showing the factors leading to the development of a cystocele of size ‘d’. The black ‘putative’ portion represents the historical understanding in the year 2002 (when this dissertation research was started). The dark grey ‘novel’ portion represents the contribution of this dissertation. In particular, the idea of focusing on the pressure differential acting on the exposed distal portion of vagina as the driving force to the development of prolapse (Chapter 4 & 5) is held to be a key contribution. The light grey ‘potential’ portion represents tissue adaptational mechanisms that could act over time and need to be investigated in the future. In this dissertation the effect of a single loading cycle, with different magnitudes of intra-abdominal pressure, IAP, was investigated, but the effect of multiple loading cycles should be investigated in the future. IAP denotes intra-abdominal pressure; PVM: pubovisceral muscle, pubic portion of levator ani muscle; AVW: anterior vaginal wall; α : active contraction of levator ani muscle; P0: atmosphere pressure; Δp : pressure differential ; T: tension; and ε : strain.......................................................................................................121
Figure A-1. Tracings of the uterosacral ligament on axial MR images. .............132
Figure A-2. Tracings of the cardinal ligament on coronal MR images...............133
Figure B-1 Image registration framework implemented using ITK ...................142
Figure B-2 First row are the sequential MR images during Valsalva loading cycle. Second role are the calculated deformation field between adjacent images. For example 1-2 means deformation field between image 1 and 2. Third role, first image is the tracing of anterior vagina wall at first image. 2’, 3’, 4’ and 5’ are the calculated location of anterior vaginal wall. ...............................................143
xiv
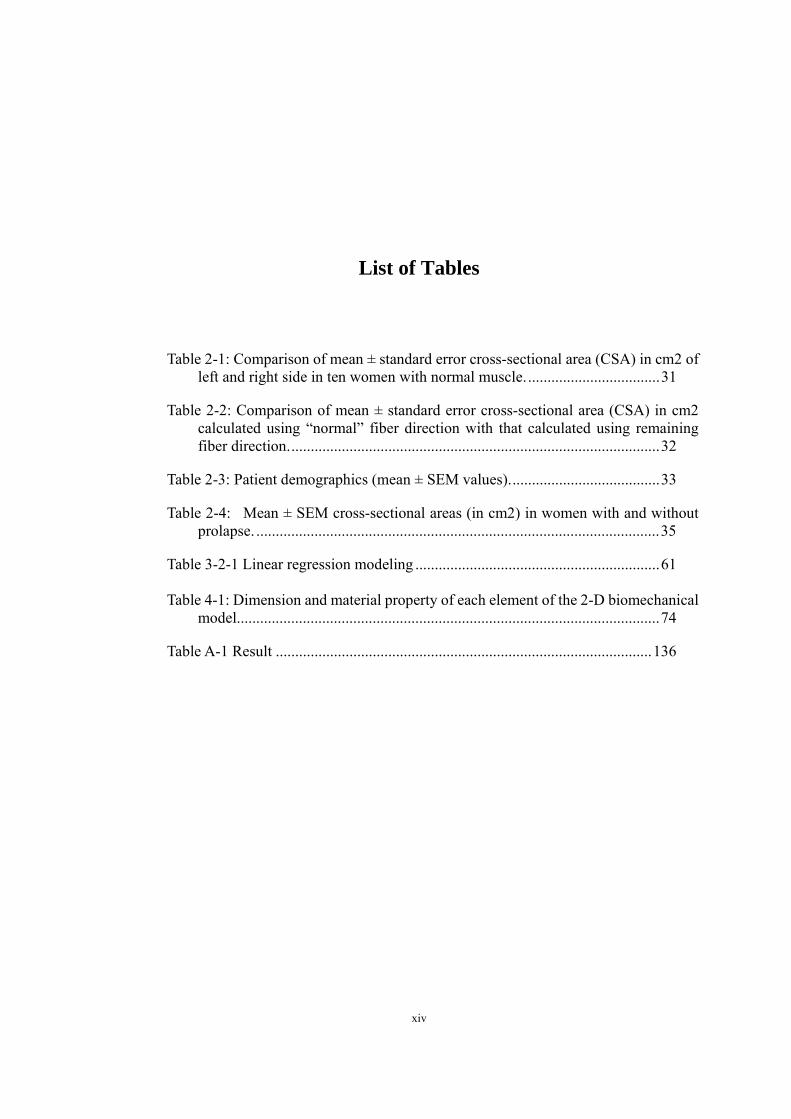
List of Tables
Table 2-1: Comparison of mean ± standard error cross-sectional area (CSA) in cm2 of
left and right side in ten women with normal muscle...................................31
Table 2-2: Comparison of mean ± standard error cross-sectional area (CSA) in cm2 calculated using “normal” fiber direction with that calculated using remaining fiber direction................................................................................................32
Table 2-3: Patient demographics (mean ± SEM values).......................................33
Table 2-4: Mean ± SEM cross-sectional areas (in cm2) in women with and without
prolapse. ........................................................................................................35
Table 3-2-1 Linear regression modeling ...............................................................61
Table 4-1: Dimension and material property of each element of the 2-D biomechanical model.............................................................................................................74
Table A-1 Result .................................................................................................136

xv
List of Appendices
Appendix A ...............................................................................................................130 Appendix B ...............................................................................................................140

1
Chapter 1
Introduction
1.1 What is pelvic organ prolapse and how big is the problem?
Pelvic organ prolapse is a distressing and debilitating condition for women. It is a
problem that most women don’t like to discuss, even when the symptoms interfere with
their work, intimate relationships or ability to travel. Pelvic floor prolapse occurs when
the network of muscle and connective tissue supporting the female pelvic organs weakens
and sags. As a result, the vagina, bladder, uterus or rectum can slip out of position,
sometimes protruding into or even inverting the vagina.
Figure 1-1. Photograph of the anterior vaginal wall protruding from the vaginal introitus showing two types of cystocele. Left; distention type AVP with stretched anterior vaginal wall (AVW). Right, displaced AVP with intact AVW that has become detached form supports (cervix, Cx also seen). (© DeLancey )

2
Figure 1-1 shows pictures of examples of anterior vaginal wall prolapse taken during a
clinical exam. The functional consequences of pelvic organ prolapse include, but are not
limited to, urinary incontinence, voiding dysfunction, fecal incontinence, sexual
dysfunction, and difficulty with defecation. Although some women treat their symptoms
conservatively with pessaries, medications, physiotherapy, or behavioral therapy, others
resort to protective undergarments and vaginal deodorizers to avoid odors. Women who
are the most impaired seek surgical solutions. A majority of the approximately 300,000
female pelvic floor operations performed each year are performed for pelvic organ
prolapse (i.e., approximately 200,000 operations each year) (Boyles et al, 2003). This
makes pelvic organ prolapse the pelvic floor disorder most often requiring surgical repair
and it costs society of over one billion dollars per year (Subak et al, 2002).
Approximately one out of 10 American women (Olsen et al, 1997) will require surgery
for pelvic floor dysfunction during their lifetime and 29% will undergo re-operation
(Olsen et al, 1997). This latter statistic is a relatively high re-operation rate and indicates
that the methods of surgical repair may be open to improvement.
Thus, pelvic floor prolapse is not only socially embarrassing and disabling, but the
treatments are also costly and can place women at risk of additional surgery. This
spectrum of problems creates an enormous socioeconomic burden on our society.
1.2 Why is improving understanding mechanisms of anterior vaginal wall prolapse
important?
Anterior vaginal prolapse (AVP), clinically referred to as “cystocele,” is the most
common form of pelvic organ prolapse (Hendrix et al, 2002) and an important problem
whose successful treatment remains a challenge, even for experienced surgeons. The
anterior vagina is the prolapse site with the highest rates of persistent and recurrent
support defects (Shull et al, 2000). Blinded follow-up in a recent randomized prospective
study of surgical techniques for AVP at an institution known internationally for
excellence in urogynecologic surgery found that only 30-45% of patients had satisfactory
or optimal results at 24 months (Weber et al, 2001). A review of the published articles for

3
surgical outcomes showed that recurrence of the AVP accounted for 42% of operative
failures for pelvic organ prolapse (Sze et al, 1997). The inability to predict the patients
who will experience surgical failure remains a significant barrier to developing more
successful treatment. An improved understanding of the mechanisms underlying AVP
will aid more successful treatment development and selection.
1.3 What are risk factors for pelvic organ prolapse?
Despite the prevalence of the problem, any understanding of the mechanisms
underlying pelvic organ prolapse lag far behind the epidemiology. Risk factors for and
correlates of pelvic organ prolapse are primarily based on expert opinion and are
supported by limited epidemiologic and clinical evidence. Existing data suggest that age
and ethnicity are associated with pelvic organ prolapse (Hendrix et al. 2002). Of greater
interest to clinicians, however, are risk factors that maybe amenable to intervention to
reduce injury to the pelvic floor. One such potential risk factor is childbirth, and, in
particular vaginal birth. In the Oxford Family Planning Asscociation prolapse
epidemiology study, parity was the strongest risk factor for pelvic organ prolapse, with an
adjusted risk ratio of 10.85 (Mant et al, 1997). Although this trauma to the pelvic floor
cannot be easily avoided, there has been increasing interest in understanding the specific
aspects of the labor and delivery process that affect the pelvic floor. Lien et al. developed
computer models to simulate vaginal birth and study the possible injury mechanisms
identifying stretch injury of the ventral pubovisceral muscle as one candidate (Lien et al,
2004, 2005). There is scant evidence about other risk factors that are possibly amenable
to efforts to prevent pelvic organ prolapse. In one study or ergonomic significance
(Jørgensen et al, 1994), nursing assistants were more likely to undergo surgery for pelvic
floor disorders than the general population, but no adjustment was made for vaginal birth.
Surgical injury to the pelvic floor and underlying connective tissue disorders have also
been implicated in pelvic organ prolapse. Obesity, cigarette smoking with chronic cough,
previous hysterectomy, constipation, and estrogen deficiency have all been commonly
implicated in the cause of pelvic organ prolapse. However, there is little, if any, evidence
that mechanistically relates these factors to the development of AVP.
4
1.4 What structures are responsible for normal pelvic floor support?
The pelvic floor organs, when removed from the body, exist only as a limp and
formless mass. Their shape and position in living women is determined by their
attachments to the pubic bones through the muscles and connective tissue of the pelvis.
The viscera are often thought of as being supported by the pelvic floor, but are actually a
part of it. For example, the support of anterior compartment of pelvic floor consists of
levator ani muscle, apical connective mesenteric tissue such as cardinal and uterosacral
ligaments, paravaginal connective tissue, and the anterior vaginal wall itself.
Levator ani muscle support
The levator ani muscle, the main muscle comprising the pelvic floor, is believed to
play a very important role in pelvic floor support. The levator ani muscle (LA) has a
complex shape with muscle fibers running in multiple directions. The muscle structure
can be simplified by dividing the levator ani muscle into two regions (Lawson et al, 1974,
Kearney et al, 2004). The pubic portion of the muscle arises from the pubic bone and
then attaches to the perineal structures and walls of the pelvic organs. The other portion is
the iliococcygeal muscle, which forms a relatively flat, horizontal shelf that spans the
pelvic opening from one pelvic sidewall to the other (Figure 1-2).

5
Figure 1-2 Illustration of levator ani muscle. Pubic portion include puboperineal muscle (PPM), puborectalis muscle (PRM) and puboanalis muscle (PAM). ICM: iliococcygeal muscle; ATLA: Arcus tendineus levator ani; EAS: external anal spincter; PB: perineal body. (From DeLancey private collection)
Connective tissue support
The anterior vaginal wall is supported by different connective tissues in different
regions (Figure 1-3). The cardinal and uterosacral ligament attach the cervix and uterus to
the pelvic side wall and provide the support for the vaginal apex, which is referred as
“apical support” or “Level I” support. In the mid-portion of the vagina, the connective
tissue attaches the vagina laterally and more directly to the pelvic walls and is used
referred as “paravaginal support” or “Level II” support. It is not a separate layer from the
vagina, as is sometimes inferred, but is a combination of the anterior vaginal wall and its
attachments to the pelvic wall. In the distal vagina, the vaginal wall is directly attached to
surrounding structures without any intervening connective tissue. Anteriorly it fuses with
the urethra, posteriorly with the perineal body and laterally with the levator ani muscle
and is usually referred as “Level III” support.

6
Figure 1-3 Anatomy of anterior vaginal wall support and sites of support failure (Bladder removed) (© DeLancey )
Anterior vaginal wall
The anterior vaginal wall, a very important part of anterior compartment pelvic floor
support, makes up the central support “fabric”, suspended as it is from the surrounding
‘frames’ of the pelvis by attachments at two sides (i.e., “paravaginal” support) and the
proximal one end (i.e., “apical” support). Its distal end is fused with the levator ani
muscle (Level III support).
1.5. A brief historical overview and the present understanding of the mechanisms
underlying anterior vaginal wall prolapse.
Pelvic organ prolapse is a remarkably common problem, yet the disease mechanism
resulting in its occurrence remains poorly understood. In 1918, Paramore described the
support of the vagina as being like a ship in its berth, floating on the water and attached
by ropes on either side to a dock (Paramore 1918). The ship is analogous to the vagina,
the ropes to the ligaments, and the water to the supportive layer formed by the pelvic
muscles. The ropes function to hold the ship (pelvic organs) in the center of its berth as it

7
rests on the water (pelvic muscles). If, however, the water level were to fall far enough
that the ropes would be required to hold the ship without the supporting water, the ropes
would all break.
In 1934, Bonney pointed out that the vagina is in the same relationship to the
abdominal cavity as the in-turned finger of a surgical glove is to the rest of the glove
(Figure 1-4) (Bonney 1934). If the pressure in the glove is increased, it forces the finger
to protrude downwards in the same way that increases in abdominal pressure force the
vagina to prolapse. Figure 1-5a and Figure 1-5b provide a schematic illustration of this
prolapse phenomenon. In Figure 1-5c, the lower end of the vagina is held closed by the
pelvic floor muscles, preventing prolapse by constricting the base of the invaginated
finger closed. Figure 1-5d shows suspension of the vagina to the pelvic walls. Figure
1-5e demonstrates that spatial relationships are important in the “flap-valve” closure
where the suspending fibers hold the vagina in a position against the supporting walls of
the pelvis; increases in pressure force the vagina against the wall, thereby pinning it in
place. Vaginal support is a combination of constriction, suspension, and structural
geometry.

8
Figure. 1-4. Bonney’s analogy of vaginal prolapse. The eversion of an intussuscepted surgical glove finger by increasing pressure within the glove is analogous to prolapse of the vagina © DELANCEY 2002, with permission)
The Ship-in-berth analogy and surgical glove analogy both point out the interaction
between levator ani muscle and endopelvic fasica, which is one of the most important
biomechanical features of pelvic organ support. However there are no scientific studies
of this phenomenon and experiments investigating this interaction and supporting those
theories are lacking.
In 2002, at the time this dissertation research was started, there were several
competing hypotheses that have been proposed to explain how anterior vaginal wall
prolapsed occurs. A first hypothesis involved midline stretching of the vaginal wall,
while a second involved peripheral detachment in the paravaginal and apical areas of
support to the vaginal wall. The first hypothesis focuses on the stretching of the
fibromuscular vaginal tube (fascia) as the disease mechanism of prolapse. This has also
been referred to as a distention cystocele (Nichols et al. 1996). The distention cystocele
implies that the vagina becomes thin and attenuated in the formation of the cystocele (or

9
hernia). The other hypothesis focuses more on the connections of the vaginal tube to the
pelvic sidewall (Richardson 1976, 1981). When these connections break, a paravaginal
defect or a displacement cystocele is thought to occur.(Nichols et al. 1996,Richardson et
al. 2000).
Figure 1-5 . Diagrammatic display of vaginal support. A. Invaginated area in a surrounding compartment; B. The prolapse opens when the pressure (arrow) is increased; C. Closing the bottom of the vagina prevents prolapse by constriction; D. Ligament suspension; E. Flap valve closure where suspending fibers hold the vagina in a position against the wall allowing increases in pressure to pin it in place ©DELANCEY 2002, with permission).
Figure 1-6 shows a systems analsysis model of the extant cystocele formation
theories that are supported by scientific studies. Intra-abdominal pressure loaded on
anterior compartment causes the tension in the paravaginal supports and vaginal wall

10
itself. Impairments in paravaginal connective tissue and/or the weakening of anterior
vaginal wall result in an abnormal vaginal wall elongation and cause the vagina to bulge
based on the geometric constraints provided by the paravaginal attachments.
Figure 1-6 The extant understanding of cystocele formation supported by scientific studies.
However, these theories only concentrate on the connective tissue support failure.
Levator ani muscle plays an important role in pelvic organ support. A recent study of our
group (DeLancey et al. 2007) showed that pubococcygeal muscle (PCM) damage is four
times more common in women with prolapse. Neither of these findings can explain this
observation. Also, we observed that there are distinguishable vaginal deformation
patterns in women with AVP when performing Valsalva (Figure 1-7). Therefore, we
hypothesize that the occurrence and magnitude of AVP is not explained by any single
mechanism but involves combination of connective tissue support failure at one or more
sites, also involving an interaction with pubococcygeal (levator) muscle impairment.

11
Figure 1-7 Variation between women with AVP (© DeLancey)
1.6 What is the evidence for connective tissue failure in the development of AVP?
The mechanical characteristics of pelvic connective tissue samples taken from
women undergoing surgery for prolapse suggest that there may be multiple sites of tissue
failure. The shear strength of vaginal wall specimens has been found to be lower in
patients with pelvic floor dysfunction than in normal controls (Kondo et al. 1994) and
great variability in the tensile and bending strengths of the samples has also been
observed (Cosson et al. 2004). The resiliency of the apical support structures, such as the
uterosacral ligaments, has also been found to be significantly reduced among women
with symptomatic uterovaginal prolapse (Reay et al. 2003). The variation in these studies
suggests that there are different sites of failure. Although, in general, each of these
studies confirms that women with pelvic floor dysfunction have tissues that, on average,
are inferior to control women, there is no single explanation to account for the clinical

12
variability seen. The proposed AVP mechanism has the potential to build on these finding
by considering specific support defects in the vagina or uterosacral ligaments present in
an individual woman.
1.7 What is the evidence that suggests levator ani muscle impairment also plays a role
in AVP?
That levator ani weakness may be involved in the development of AVP is suggested
by a study by DeLancey et al. that showed that the rate of levator ani defect was four-fold
higher (DeLancey et al. 2007) and the contraction force developed by the levator ani was
46% lower in women with prolapse compared with controls (Morgan et al.2005). Several
other studies have also suggested the clinical importance of levator ani injury. For
example, Koelbl et al. (1989) biopsied the region where the levator ani muscle is
normally found during surgery on women with cystocele and found a substantial number
of women lacking normal muscle at this site. A further study by the same group (Hanzal
et al. 1993) showed that 53% of the women who had missing muscle also experienced
operative failure, while there were no failures among those with normal muscle on biopsy.
These visible manifestations are supported by histological studies revealing muscle
fibrosis and evidence of direct myogenic muscle damage among parous and older women.
More recently, magnetic resonance (MR) imaging has revealed morphologic and
structural changes in the levator ani muscles in women with pelvic floor dysfunction
(Tunn et al. 1998, Hoyte et al. 2001, Singh et al. 2003). So, levator ani weakness does
appear to be a contributory factor, but the mechanism by which it plays a role remains
unclear.
1.8 Hypothesis and Specific Aims
In this dissertation we hypothesize that the occurrence and magnitude of AVP is not
explained by any single mechanism but involves combination of connective tissue
support failure at one or more anatomic site and also involves an interaction with
pubococcygeal muscle impairment. This dissertation involves an approach which

13
combines measurements in living women, via MR imaging with theoretical
biomechanical modeling simulations to test the above hypothesis.
Aim 1: Morphological measurement of anterior vaginal wall support system using
MR imaging
There are mainly two purposes for these morphological measurements. The first is to
compare the key structural elements’ morphology in women with normal support and
women with AVP. This includes the anterior vaginal wall support system comprised of
the levator ani muscle, the apical and paravaginal support connective tissues, and the
anterior vaginal wall. Morphological differences will provide insight into how the AVP
patients differ from normal age-matched controls. The other purpose is to establish the
average morphology in women with normal support thus providing useful geometric
information for biomechanical models (Aim 2).
Aim 2: Biomechanical modeling of AVP
An essential aim of this thesis is to develop biomechanical models of the anterior
vaginal wall support system in order to improve the understanding of the mechanism
underlying the development of AVP.
The models range from simple, two-dimensional, lumped parameter models to
anatomically more accurate finite element models. Biomechanical models can yield
powerful insights and are relatively inexpensive, fast and safe to implement. Unlike
biological systems in vivo, the model allows one to vary a single factor at a time so that
the sensitivity of the system to changes in this factor, or a combination of factors, can be
analyzed.

14
Aim 3. In vivo assessment of the compliance of the anterior compartment and the
exploration of more extensive ways to validate model
By incorporating intra-abdominal pressure and structural displacement information,
the compliance of the support system can also be estimated. By comparing MR images in
the resting and maximum Valsalva states we can explore the feasibility of estimating the
deformation field under load using a non-rigid 3-D image registration method and the
possibility of using this information to validate the biomechanical model developed in
Aim 2.
Hence the overall goal of this dissertation is to try to understand the biomechanical
mechanisms underlying the development of anterior vaginal wall prolapse in women.

15
References
Bonney, V. The principles that should underlie all operations for prolapse. Obstet
Gynaecol Br Emp 1934;41: 669.
Boyles SH, Weber AM, Meyn L. Procedures for pelvic organ prolapse in the United
States, 1979-1997. Am J Obstet Gynecol. 2003 Jan;188(1):108-15
Boyles SH, Weber AM, Meyn L. Procedures for urinary incontinence in the United
States, 1979-1997. Am J Obstet Gynecol 2003;189:·70-5.
Cosson M, Lambaudie E, Boukerrou M, Lobry P, Crépin G, Ego A. A biomechanical
study of the strength of vaginal tissues. Results on 16 post-menopausal patients
presenting with genital prolapse. Eur J Obstet Gynecol Reprod Biol. 2004 Feb
10;112(2):201-5.
DeLancey JO, Morgan DM, Fenner DE, Kearney R, Guire K, Miller JM, Hussain H,
Umek W, Hsu Y, Ashton-Miller JA. Comparison of levator ani muscle defects and
function in women with and without pelvic organ prolapse. Obstet Gynecol. 2007
Feb;109(2 Pt 1):295-302.
Hanzal E, Berger E, Koelbl H. Levator ani muscle morphology and recurrent genuine
stress incontinence. Obstet Gynecol 1993;81:426-9.
Hendrix SL, Clark A, Nygaard I, Aragaki A, Barnabei V, McTiernan A. Pelvic organ
prolapse in the Women's Health Initiative: gravity and gravidity. Am J Obstet Gynecol.
2002 Jun;186(6):1160-6
Hoyte L, Ratiu P. Linear measurements in 2-dimensional pelvic floor imaging: the impact
of slice tilt angles on measurement reproducibility. Am J Obstet Gynecol

16
2001;185:537-44.
Jørgensen S, Hein HO, Gyntelberg F. Heavy lifting at work and risk of genital prolapse
and herniated lumbar disc in assistant nurses. Occup Med (Lond). 1994 Feb;44(1):47-9.
Kearney R, Miller JM, Ashton-Miller JA, DeLancey JOL. Obstetric factors associated
with levator ani muscle injury after vaginal birth. Obstet Gynecol. 2006; 107(1): 144-9.
Koelbl H, Strassegger H, Riss PA, Gruber H. Morphologic and functional aspects of
pelvic floor muscles in patients with pelvic relaxation and genuine stress incontinence.
Obstet Gynecol 1989;74:789-95.
Kondo A, Narushima M, Yoshikawa Y, Hayashi H. Pelvic fascia strength in women with
stress urinary incontinence in comparison with those who are continent. Neurourol
Urodynam 1994;13:507-13.
Lien KC, Mooney B, DeLancey JO, Ashton-Miller JA. Levator ani muscle stretch
induced by simulated vaginal birth. Obstet Gynecol 2004;103:31-40.
Lien KC, Morgan DM, DeLancey JO, Ashton-Miller JA. Pudendal nerve stretch during
vaginal birth: a 3D computer simulation. Am J Obstet Gynecol. 2005
May;192(5):1669-76.
Lawson JO. Pelvic anatomy. I. Pelvic floor muscles Ann R Coll Surg Engl
1974;54:244-52.
Mant J, Painter R, Vessey M. Epidemiology of genital prolapse: Observations from the
Oxford Family Planning Association Study. Br J Obstet Gynaecol 1997;104:579–85.
Morgan DM, Kaur G, Hsu Y, Fenner DE, Guire K, Miller J, Ashton-Miller JA,
DeLancey JOL. Does vaginal closure force differ in the supine and standing positions?

17
American J Obstet and Gynecol. May 2005; 192(5):1722-1728
Nichols DH, Randall CL. Vaginal surgery. 4th ed. Baltimore (MD): Williams & Wilkins;
1996.
Olsen AL, Smith VJ, Bergstrom JO, Colling JC, Clark AL. Epidemiology of surgically
managed pelvic organ prolapse and urinary incontinence Obstet Gynecol. 1997
Apr;89(4):501-6
Paramore, R. H.: The uterus as a floating organ. In: The statics of the female pelvic
viscera. H.K. Lewis and Co. Ltd, London: p. 12, 1918.
Reay Jones NH, Healy JC, King LJ, Saini S, Shousha S, Allen-Mersh TG. Pelvic
connective tissue resilience decreases with vaginal delivery, menopause and uterine
prolapse. Brit J Surg 2003;90:466-72.
Richardson AC, Lyon JB, Williams NL. A new look at pelvic relaxation. Am J Obstet
Gynecol 1976;126:568–73.
Richardson AC, Edmonds PB, Williams NL. Treatment of stress urinary incontinence
due to paravaginal fascial defect. Obstet Gynecol 1981;57:357–62.
Richardson AC. Paravaginal repair. In: Hurt WG, editor. Urogynecologic surgery. 2nd ed.
Philadelphia (PA): Lippincott Williams & Wilkins; 2000. p. 71–80
Sze EH, Karram MM. Transvaginal repair of vault prolapse: a review. Obstet Gynecol
1997;89:466-75.
Shull BL, Bachofen C, Coates KW, Kuehl TJ. A transvaginal approach to repair of apical
and other associated sites of pelvic organ prolapse with uterosacral ligaments. Am J

18
Obstet Gynecol 2000;183:1365-73.
Singh K, Jakab M, Reid WM, Berger LA, Hoyte L. Three-dimensional magnetic
resonance imaging assessment of levator ani morphologic features in different grades of
prolapse. Am J Obstet Gynecol 2003;188:910-915.
Tunn R, DeLancey JOL, Howard D, Thorp JM, Ashton-Miller JA, Quint LE. MR
Imaging of levator ani muscle recovery following vaginal delivery. Int Urogynecol J
1999;10:300-7.
Weber AM, Walters MD, Piedmonte MR, Ballard LA. Anterior colporrhaphy: a
randomized trial of three surgical techniques. Am J Obstet Gynecol 2001;185:1299-304;
discussion 1304-6.

19
Chapter 2
Cross-sectional Area Measurement of Levator Ani Muscle in
women with and without prolapse
2.1 Introduction
Despite the prevalence of the problem, the disease mechanism responsible for organ
prolapse is still not fully understood. However injury and deterioration of muscle, nerve
and connective tissue are believed to play a role in altering normal pelvic organ function
and predicposing to prolapsed (for example, Boreham et al, 2002, Takano et al, 2002,
Smith et al, 1989).
There is also a growing body of evidence that the levator ani muscles are important
to pelvic organ support. Magnetic resonance (MR) imaging reveals levator ani muscle
morphology. A visible defect in the pubic portion of the levator ani can be seen in 18% of
primiparous women six months after vaginal delivery (DeLancey et al, 2003, Dietz et al,
2005, Kearney et al, 2006), and these types of defect have been found in women with
pelvic floor dysfunction (Kirschner-Hermanns et al, 1993, Tunn et al, 1998, Hoyte et al,
2001, Singh 2003). The iliococcygeal portion is less commonly affected (in only 2% of
women, DeLancey et al, 2003). The pubic portion contains muscle fibers that originate
from the pubic bone and include the pubovisceral muscle and puborectal muscle
(Kearney et al, 2004). Despite the association between prolapse and levator damage,

20
there are women with prolapse who do not have levator damage and women with normal
support who do have levator damage. This has led some investigators to quantify levator
ani muscle bulk to see if this explains the discrepancy.Several techniques have been used
to quantify muscle bulk and therby loss in muscle bulk. For example, Hoyte
measured the distance from the pubic bone to the remaining muscle (Hoyte et al, 2001) as
well as muscle thickness (Hoyte et al, 2004). Levator ani muscle volume has also been
quantified (Fielding et al, 2000, Hoyte et al, 2001). Our group has assessed the degree
of muscle damage visible in 2-D images (Kearney et al. 2006). This later technique
focused on the amount of muscle missing but did not quantify how much muscle remains.
Thus, despite a levator injury, a woman who started off with a larger muscle may end up
with the same amount of muscle as a woman who inherently had smaller muscles.
While comparing muscle volume provides useful information about muscle loss, muscle
volume does not correlate as well with force because, although a longer parallel fibered
muscle of a given cross-sectional area has a larger volume, it will not develop more force
than a shorter muscle parallel-fibered muscle of the same cross-sectional area. The
maximum force developed by striated muscle is related to its cross-sectional area
measured perpendicular to muscle fiber direction and has been measured to be between 4
and 8 Kg/cm2 (Ikai et al, 1968, 1970). Therefore cross-sectional area measurement
perpendicular to muscle fiber direction, rather than muscle volume, is the appropriate
way to relate muscle morphology to function.
The levator ani muscle has a complex shape with fibers running in multiple directions.
In particular, the muscle fibers in the pubic portion of the levator ani muscle run in a
different direction than those in the iliococcygeal muscle (Lawson et al, 1974, Kearney et
al, 2004, Singh et al, 2002). Therefore, the two regions must be separated prior to
measurements of cross-sectional area perpendicular to the fiber direction. The muscle
fibers in these regions also do not run perpendicular to standard axial, coronal or sagittal
MR scan planes, so cross-sectional area measurements cannot be properly performed on

21
standard 2-D images.
2.2 Materials & Methods:
We first developed a method for quantifying the cross-sectional area of pubic portion
of the levator ani muscle perpendicular to its muscle fiber direction. Then, the method
was used to quantify the loss in cross-sectional area in women with unilateral levator ani
defects where normal and abnormal muscle could be seen in the same individual. We
then used this technique to investigate the extent of the muscle loss at different locations
along the length of the muscle and also validate the technique’s ability and sensitivity to
detect muscle defects. The null hypotheses were tested that there would be no difference
in (a) cross-sectional area between the defect and normal sides, nor (b) in the
cross-sectional area along the length of the muscle.
Then we applied this 3-D technique to women with and without muscle defect and
prolapse to test the hypotheses that levator ani cross-sectional area would not vary with
defect severity as identified on MR scans. We also tested the hypothesis that these
cross-sectional areas would not differ in women with normal support from those with
pelvic organ prolapse.
2.2.1 Develop and validate measurement technique on women with unilateral levator
ani muscle defect
2.2.1.1 Unilateral levator ani muscle defect study group
A convenience sample of twelve women with a unilateral levator ani muscle defect
were selected from an IRB-approved study comparing muscle anatomy in women with
prolapse and women with normal pelvic organ support. The prolapse patients were
recruited through the University of Michigan Urogynecology Clinic. The controls were
recruited through advertisements as well as through the Women’s Health Registry; a list
of women who expressed interest in participating in women’s health projects. Patients

22
were excluded if they had previous surgery for prolapse or incontinence, genital
anomalies, or had delivered in the past year. Patients were enrolled between June, 2001
and September, 2003. Women with visible unilateral defects in the pubic portion of the
levator ani muscle on MR images were selected so that, within the same individual,
normal muscle morphology on one side could be compared with abnormal muscle
morphology on the other side (Figure 2-1). This circumvents inter-individual
differences in muscle appearance and bulk. These women represented both individuals
with prolapse and normal support.
Figure 2-1: Axial proton density MR image of a woman with a right unilateral defect. The left levator ani muscle is intact (denoted by *) while the right side portion of the muscle is missing. PB denotes pubic bone; U: urethra; V: vagina; R: Rectum; OI: obturator internus muscle.
In the 12 women selected, five had prolapse of one vaginal wall or a cervix at least 1
cm below the hymen and seven had normal support of all pelvic structures with no
vaginal wall lower than 1 cm above the hymen as assessed by clinic evaluation (POP-Q)
(Bump et al, 1996). The average age was 56.2 ± SD 11.9 years and average BMI was
27.3 ± SD 4.0 Kg/m2. Parity was 3.15± SD 1.77. Ten additional women with normal

23
intact levator ani muscle on MRI were selected as control group to validate the method.
Five had prolapse and five had normal pelvic organ support. The average age was 62.5 ±
SD 3.34 years and average BMI was 27.5 ± SD 5.0 Kg/m2. Parity was 2.8± SD 1.75.
To compare the normal and defective sides, we first separated the levator ani in the
midline. Each side was then designated as either “normal” or “defective”. Within 12
women, five had defective muscle on left side and seven had defective right side muscle.
2.2.1.2 Model reconstruction
Multiplanar, two-dimensional, fast spin, proton density MR images (echo time 15 ms,
repetition time 4000 ms) were obtained by use of a 1.5 T superconducting magnet
(General Electric Signa Horizon LX) with version 9.1 software. The fields of view of
axial and coronal images were both 16×16 cm and the field of view in sagittal images
was 20×20 cm. All three views had slice thicknesses of 4 mm with a 1 mm gap between
slices.
Axial, sagittal and coronal MR-images were imported into a three-dimensional (3-D)
imaging program (3-D Slicer, version 2.1b1) and aligned using anatomic landmarks
(arcuate pubic ligament, pubic bone, pubic symphysis, etc). To reduce modeling artifacts
from partial volume averaging of oblique structures on a single scan plane, 3-D
volume-rendering models were generated by combining models built from axial and
coronal planes. The combined models were imported into I-DEAS version 9.0 (EDS,
Plano, TX), an engineering graphics program (Figure 2-2A).
A mirrored model of the normal muscle (dashed outline) was superimposed on the
contralateral defective side to visualize the area of missing muscle (Figure 2-2B).
Volumes of the overall levator ani muscle including both the pubic portion and
iliococcygeal portion on the normal and defective sides were calculated in I-DEAS ®.

24
Figure 2-2. Reconstructed 3-D model showing the pubic bone and levator ani muscle with a right unilateral defect (A). In B, the dashed region shows the expected location of the missing muscle after reflecting the muscle from the normal across the midline side.
2.2.1.3 Separate pubic portion of levator ani muscle
The pubic portion of the levator ani muscle was separated from the iliococcygeal
portion by establishing a dividing plane through three anatomical landmarks that could be
identified independent of whether or not there was a defect in the levator ani. The
middle landmark was defined as the upper aspect of the puborectalis “bump” on the
mid-sagittal slice (Figure 2-3a). Two lateral landmarks for the plane were defined as the
most medial origin of the iliococcygeus from the arcus tendineus levator ani (ATFP).
As the ATFP directly overlies the obturator internus muscle, the point of connection of
the iliococcygeal and the obturator internus on the left and the right sides was used as the
landmark (Figure 2-3b & c). All landmarks were imported into the I-DEAS based model.
The levator ani muscle was then divided into a pubic portion and an iliococcygeus
portion on both normal and defective sides by a plane constructed using the landmarks
described above (Figure 2-4). The volumes were calculated for each portion of the
muscle.

25
Figure 2-3. Separating the pubic portion of levator ani from the iliococcygeus portion on MR scans. a): identification of the middle point (triangle) on the mid-sagittal MR image; b & c): identification of the two lateral points on MR image (cross and diamond). The following structures were identified in MR image to help for orientation. PS: pubic symphysis; PB:pubic bone; B: bladder; A: anus; OI: oburator internus; U:uterus (with fibroids); PRM: puborectalis muscle. ICM: iliococcygeus muscle
Figure 2-4: 3-D view of the separation of the pubic portion from the iliococcygeal portion of the levator ani. The dashed line represents the plane of separation, while the triangle, cross and diamond have the same meaning as in the preceding figure.
2.2.1.4 Identify muscle fiber direction
Although there is evidence that the pubic portion of the levator ani has a
parallel-fibered morphology (Janda et al, 2003), its muscle fiber direction is not directly

26
observable on the MR scans, so it was approximated by establishing a line between the
middle of the origin point and the center of the insertions using anatomic landmarks
independent of muscle presence or absence. The muscle origins were defined in axial MR
images as lying 1.5 cm above the arcuate pubic ligament, and 0.2 cm medial from the
obturator internus insertion on the left and right pubic rami, based on the senior author’s
dissection and MR imaging experience (Strohbehn et al, 1996). The insertion points were
defined in the sagittal plane as the center of the intersphincteric groove on slices 0.5 cm
lateral to the mid-sagittal slice on either side (Figures 2-5 & 2-6).
Figure 2-5. Reference points for determining fiber direction in the pubic portion of the levator ani. a) Origin points on axial MR image at its junction with obturator internus (OI) as open circle on patient’s left and filled circle on patient’s right; b&c) Right (filled square) and left (open square) insertion point on sagittal MR scans. The following structures are identified aid orientation. PB: pubic bone; B: bladder; V: vagina; R: rectum; A: anus
Figure 2-6. Lines connecting the origin and insertion points (see preceding figure) were used to estimate muscle fiber direction. The dashed region shows the expected location of the muscle on the defective side, were it intact.

27
2.2.1.5 Calculate muscle cross-sectional area
Using I-DEAS, five equally-spaced cross-sectional ‘cutting’ planes were passed
perpendicular to the fiber direction line. The resulting cross-sections were numbered
from ‘1’ at the pubic origin to ‘5’ at the insertion end (Figure 2-7). Since location 5 lay
dorsal to the edge of the muscle with the defect, the cross-sectional areas were only
calculated bilaterally from locations 1 to 4. Figure 2-7 shows a graphical demonstration
of the sequence of steps used to quantify the unilateral levator ani muscle loss.
Two-sided paired t-tests were used to compare for bilateral differences in cross-sectional
area and volume.
Figure 2-7. Steps to quantify levator ani muscle loss in a subject with a unilateral defect. A: Frontal view of the 3-D reconstruction model of levator ani was built. B: The pubic portion is separated from the iliococcygeal portion; here only the pubic portion is shown. C: The line of estimated fiber direction of the pubic portion was determined. Equally-spaced cutting planes perpendicular to the fiber direction line were placed. D: The resulting cross-sections are shown. Cross-sectional areas were then calculated. Due to the defect on the right, muscle is not present at location 1, therefore, it is not shown.
One might hypothesize that the fiber direction of the remaining muscle could change
due to the presence of the defect and the use of the normal fiber direction may cause
some error in estimation of the cross-sectional area of the remaining muscle. We
therefore performed additional analysis by approximating the defect muscle direction by
curving and rotating the normal muscle fiber direction line to best fit the remaining
muscle model. We then estimated the degree of error by calculating the cross-sectional
area perpendicular to remaining muscle fiber direction and comparing it with the normal
fiber direction by using a paired t- test (Figure 2-8).

28
Figure 2-8 A: Cross-sectional area perpendicular to normal muscle direction; B: Cross-sectional area perpendicular to remaining muscle direction.
2.2.2 Quantify muscle cross-section loss in women with and without prolapse
To perform this analysis, sixty subjects were selected from an ongoing IRB-approved
case-control study comparing findings in women with normal support to women with
pelvic organ prolapse between November 2000 and April 2005. Of these, 30 women
had pelvic organ prolapse as demonstrated by a vaginal wall or the cervix being at least 1
cm beyond the introitus upon supine examination during maximal Valsalva. Thirty
controls, who had normal support with vaginal wall and cervix 1 cm or more above the
hymen were also selected for analysis. In both the prolapse and control group, women
were selected from the parent study with 10 having “no levator ani defects”, 10 having
“minor” defects and 10 having “major” defects (see below). Patients were selected such
that the mean age of each group would be similar. Subjects were all Caucasian with the
exception of one African-American woman. For the parent study, women with prolapse
had been recruited from the University of Michigan Urogynecology Clinic while controls
were women recruited through advertisements, as well as through the Women's Health
Registry, a database of women who expressed interest in participating in women's health
projects. Women were excluded if they had previous surgery for prolapse or
incontinence, had genital anomalies, or had delivered in the past year.
The severity of the defect in the pubovisceral portion of the levator ani muscle
29
was determined using MR images and a visual scoring system 6. Defects were scored
on each side as “0” = no defect, “1” = less than 50% loss, “2” = more than 50% loss and
“3” = loss of all significant muscle (Figure 2-9). Scores from both sides were added
together for a summed score ranging from 0 to 6. Summed scores were then grouped
into three categories: 0 = no defect; 1-3 = minor defect; and 4-6 = major defects as
previously described ( Kearney et al, 2006).
Figure 2-9 Axial MR images showing the levator ani. a: intact pubovisceral muscle bilaterally as demonstrated by arrows; b: complete loss of bilateral muscles. © DeLancey 2006
Using the same technique described earlier, axial, sagittal, and coronal MR images
were imported into a 3-D imaging program (3-D Slicer, version 2.1b1, Brigham and
Women’s Hospital, Boston, MA) and aligned using anatomic landmarks. 3-D
volume-rendering models were generated from axial and coronal planes (Figure 2-10)
and then imported into I-DEAS® version 9.0 (UGS, Plano, TX), an engineering graphics
program to perform measurements.
The muscle fiber direction was approximated by establishing a line between the
middle of the origin point and the center of the insertions using anatomic landmarks
described earlier. Using I-DEAS®, cross sectional areas of the pubic portion were
calculated perpendicular to a fiber direction line from the pubic origin to the middle of
the visceral insertion at 17 equidistant points (Figure 2-11). One-way ANOVA was
performed; P<0.05 was considered significant. A power calculation was not possible at

30
the beginning of the study since no data were available concerning these measurements.
Therefore, a post-hoc power calculation was performed.
Figure 2-10 3-D Slicer models. a: ¾view of the levator ani muscle and pubic bone; b: levator ani with pubic bones removed; c: lateral view of muscle. © DeLancey 2006
Figure 2-11: Levator model and cross-sections. Fiber direction line for the left side of pubic portion of levator ani muscle is shown. The locations of cross-section areas (CSA) are shown and numbered 1 (most ventral) to 17 (most dorsal). The model has been cut at CSA 7. CSA 8 to 16 are not numbered in the figure. © DeLancey 2006

31
2.3 Results
2.3.1 Results for women with unilateral levator ani muscle defect
In the women with normal levator ani muscle, there is no significant difference
between left and right cross-sectional areas at any location (Table 2-1).
Table 2-1: Comparison of mean ± standard error cross-sectional area (CSA) in cm2 of left and right side in ten women with normal muscle.
Locatio
n 1
Locatio
n 2
Locatio
n 3
Locatio
n 4
CSA of left side (cm2) 1.30 ±
0.20
2.26 ±
0.15
2.84 ±
0.11
2.62 ±
0.21
CSA of right side (cm2) 1.20 ±
0.25
2.23 ±
0.17
2.71 ±
0.14
2.74 ±
0.19
P-value 0.43 0.84 0.35 0.42
In the women with a unilateral defect, the defective side had a significantly smaller
muscle cross-sectional area at each location in the pubic portion of the levator ani (Figure
2-12). However, the extent of the cross-sectional area loss differed depending on
location. The largest mean cross-sectional area loss (81%, P=0.0002) was near the pubic
origin (location 1), while near the insertion (location 4) the loss in mean cross-sectional
area was not statistically significant (13.5%, P=0.1987).
There was not a statistically significant difference in the cross-sectional areas
calculated using the “normal” fiber direction compared to the approximated remaining
fiber direction (Table 2-2), thereby validating the use of the “normal” fiber direction on
the defective side.

32
Figure 2-12. Bilateral comparison of muscle cross-sectional area of pubic portion of levator ani muscle perpendicular to its fiber direction. Bars are standard error and * denotes p<0.05.
Table 2-2: Comparison of mean ± standard error cross-sectional area (CSA) in cm2 calculated using “normal” fiber direction with that calculated using remaining fiber direction.
Loca
tion
1
Loca
tion
2
Loca
tion
3
Loca
tion
4
CSA perpendicular
to ‘normal’ muscle
direction
0.19
±
0.06
1.19
±
0.23
2.12
±
0.19
2.43
±
0.18
CSA perpendicular
to remaining
muscle direction
0.24
±
0.10
1.15
±
0.20
2.09
±
0.20
2.31
±
0.20
P-value 0.24 0.33 0.60 0.42
The overall volume of the levator muscle was 13.69% smaller on the defective

33
side(17.96 ± 1.4 cm3 ) than on the normal side (20.81± 1.35 cm3 , P=0.0004). This was
primarily attributable to a reduction in the pubic portion of levator ani muscle (defective
side: 9.16 ± 0.83 cm3 normal side: 12.19 ± 0.71 cm3, a 24.6% volume reduction,
P<0.0001), while the iliococcygeal portions were not significantly different (defective
side: 8.80 ± 1.25 cm3; normal side: 8.62 ± 1.12 cm3, P<0.0001P=0.64).
2.3.2 Results for women with and with prolapse
Patient demographics are presented in Table 2-3. There was no significant
difference in BMI between women with and without prolapse (mean BMI:
prolapse=27.16 kg/m2, controls=25.92 kg/m2, P-value = 0.2689). The max POP-Q point
is also shown which represents the most dependent vaginal wall point. All patients with
prolapse were Stage II or greater. Of the 30 patients with prolapse, the majority had
anterior compartment prolapse (N=25) while three patients had posterior compartment
prolapse and two had apical prolapse.
Table 2-3: Patient demographics (mean ± SEM values). Defect
status
Group
status Age (year)
Vaginal
parity BMI (kg/m2)
Max
POP-Q(cm)
Normal 63 ± 2.4 2.8 ± 0.3 23.7 ± 0.6 -1.2 ± 0.1 None
Prolapse 62 ± 3.1 2.7 ± 0.5 29.5 ± 1.4 +1.9 ± 0.4
Normal 60.6 ± 2.5 2.5 ± 0.6 25.9 ± 1.5 -1.5 ± 0.2 Minor
Prolapse 61.5 ± 1.9 4.6 ± 0.7 25.3 ± 1.1 +2.6 ± 0.3
Normal 60.4 ± 2.8 2.9 ± 0.5 28.2 ± 1.3 -1.2 ± 0.1 Major
Prolapse 62.3 ± 3.5 3.7 ± 0.7 26.7 ± 1.4 +2.5 ± 0.5
The mean cross-sectional areas at each location are shown in Figure 2-13. In
locations (2 - 7), the women with major defects had the smallest cross-sectional area,
followed by those with minor defects. These cross-section locations represent where the
muscle originates from the pubic bone. We designated locations 2-10 as the ventral
portion of the muscle based their locations on our 3-D models. The mean (± SEM)
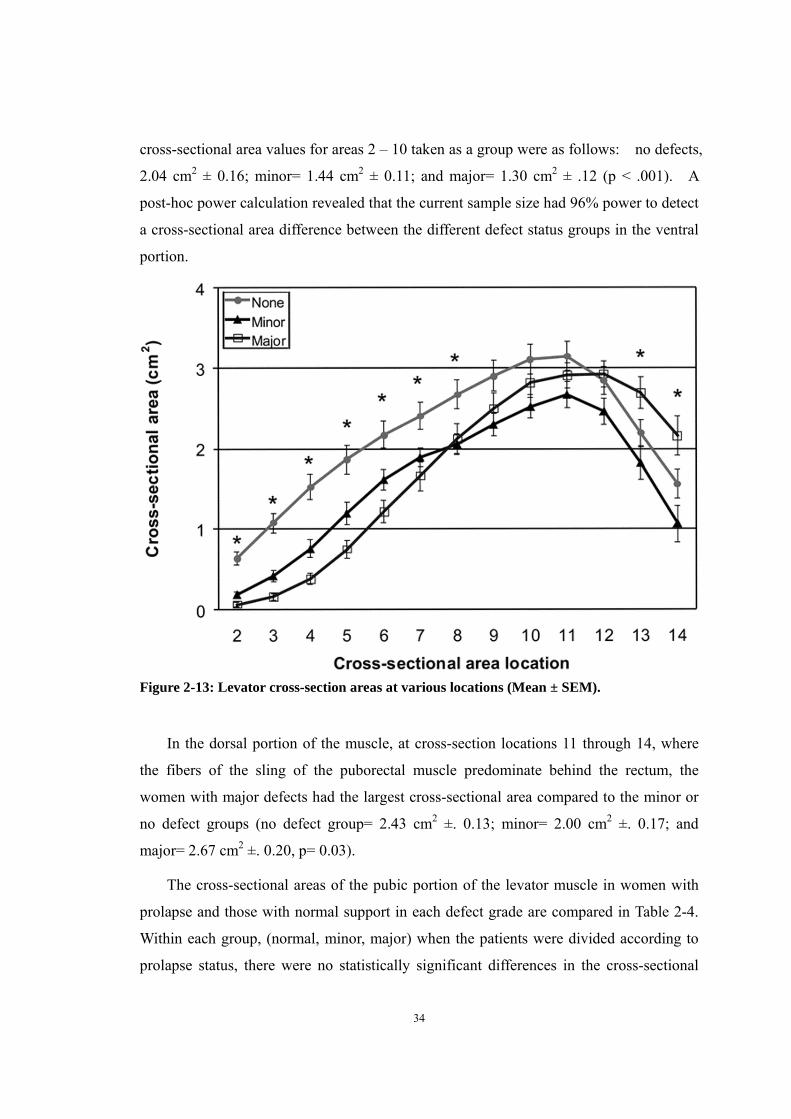
34
cross-sectional area values for areas 2 – 10 taken as a group were as follows: no defects,
2.04 cm2 ± 0.16; minor= 1.44 cm2 ± 0.11; and major= 1.30 cm2 ± .12 (p < .001). A
post-hoc power calculation revealed that the current sample size had 96% power to detect
a cross-sectional area difference between the different defect status groups in the ventral
portion.
Figure 2-13: Levator cross-section areas at various locations (Mean ± SEM).
In the dorsal portion of the muscle, at cross-section locations 11 through 14, where
the fibers of the sling of the puborectal muscle predominate behind the rectum, the
women with major defects had the largest cross-sectional area compared to the minor or
no defect groups (no defect group= 2.43 cm2 ±. 0.13; minor= 2.00 cm2 ±. 0.17; and
major= 2.67 cm2 ±. 0.20, p= 0.03).
The cross-sectional areas of the pubic portion of the levator muscle in women with
prolapse and those with normal support in each defect grade are compared in Table 2-4.
Within each group, (normal, minor, major) when the patients were divided according to
prolapse status, there were no statistically significant differences in the cross-sectional
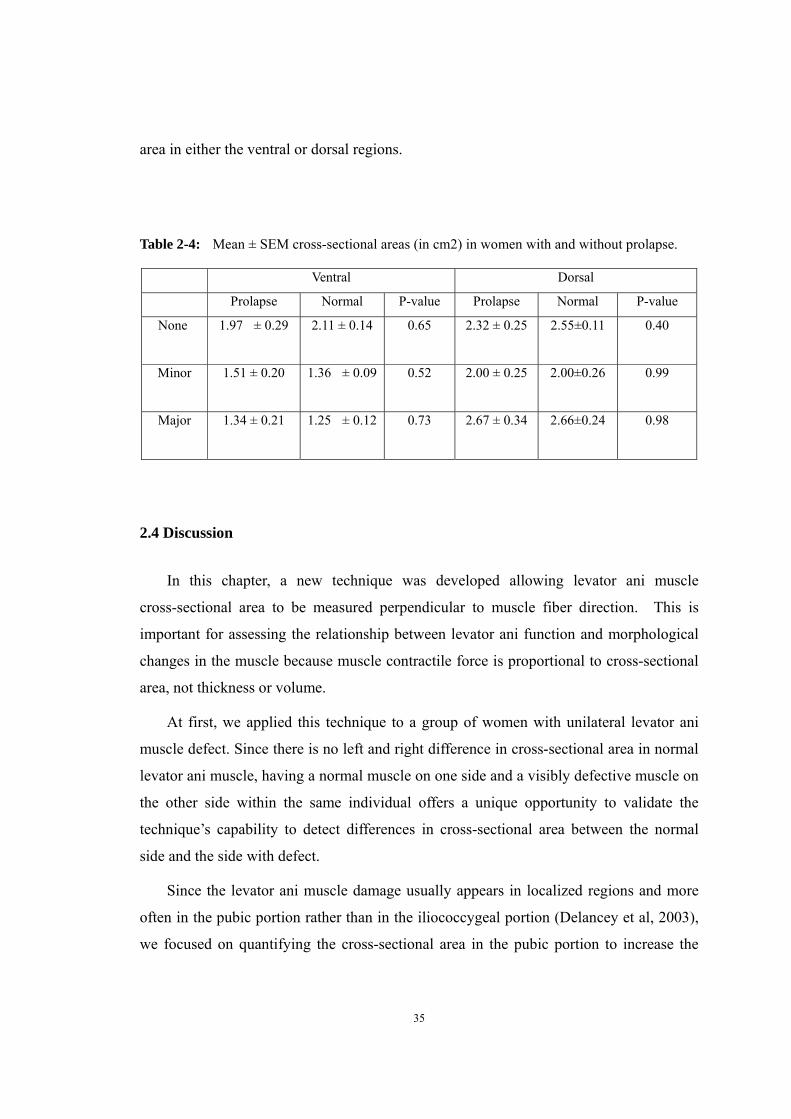
35
area in either the ventral or dorsal regions.
Table 2-4: Mean ± SEM cross-sectional areas (in cm2) in women with and without prolapse.
Ventral Dorsal
Prolapse Normal P-value Prolapse Normal P-value
None 1.97 ± 0.29 2.11 ± 0.14
0.65 2.32 ± 0.25 2.55±0.11 0.40
Minor 1.51 ± 0.20 1.36 ± 0.09
0.52 2.00 ± 0.25 2.00±0.26 0.99
Major 1.34 ± 0.21 1.25 ± 0.12
0.73 2.67 ± 0.34 2.66±0.24 0.98
2.4 Discussion
In this chapter, a new technique was developed allowing levator ani muscle
cross-sectional area to be measured perpendicular to muscle fiber direction. This is
important for assessing the relationship between levator ani function and morphological
changes in the muscle because muscle contractile force is proportional to cross-sectional
area, not thickness or volume.
At first, we applied this technique to a group of women with unilateral levator ani
muscle defect. Since there is no left and right difference in cross-sectional area in normal
levator ani muscle, having a normal muscle on one side and a visibly defective muscle on
the other side within the same individual offers a unique opportunity to validate the
technique’s capability to detect differences in cross-sectional area between the normal
side and the side with defect.
Since the levator ani muscle damage usually appears in localized regions and more
often in the pubic portion rather than in the iliococcygeal portion (Delancey et al, 2003),
we focused on quantifying the cross-sectional area in the pubic portion to increase the

36
sensitivity of the method for identifying muscle defects. The finding of smaller volume
in the pubic portion, but not in the iliococcygeal portion, shows that our method of
separating the two parts of the muscle was effective in isolating the defective area.
Once the two parts of the muscle had been separated, muscle fiber direction for the
pubic portion was determined independent of muscle presence by identifying muscle
origin and insertion. A smaller cross-sectional area was detected in the defective muscle
near the pubic origin corresponding to the anatomical location of the visible MR defect.
Since no visible defects were evident in the iliococcygeus muscle, calculations of its
cross-sectional area were omitted.
Several techniques have been used to quantify levator ani muscle morphology.
Bernstein used perineal ultrasonography to visualize and measure the thickness of levator
ani muscle (Bernstein et al, 1997). However, because image resolution is limited, it is not
clear which portion of the levator ani muscle was measured or what angle of fiber
direction was used. Aukee measured the thickness of the distal part of the
pubococcygeal in static axial MR image and found it to be significantly correlated with
EMG values during a maximal contraction (Aukee et al, 2004). This measurement only
reflects one dimension of the muscle and the relationship of this dimension to fiber
direction is not known. Hoyte et al quantified the levator ani muscle volume and levator
ani angle using 3-D reconstructed models (Hoyte et al, 2004). Although volumetric
techniques do provide a measurement of morphologic change, quantifying cross-sectional
area of the intact muscle perpendicular to its fiber direction, as done in this study, is more
appropriate from a biomechanical perspective because only then can the contractile force
developed by the muscle be estimated. The smaller the cross-sectional area of residual
muscle left by the defect, the smaller the contractile force it can develop.
Levator ani muscle shape is complex as evidenced in these 3-D reconstructions.
This complexity precludes useful measurements of the muscle being made in standard
MRI planes because slice angle variation in 2-D static MRI scans can cause measurement
variations of up to 15% (Hoytel et al, 2001). Also, as stated earlier, fiber directions do
not correspond to standard image acquisition planes and they can vary from subject to
subject. Therefore we conclude that 3D reconstruction and establishment of fiber

37
direction in 3-D space is preferred for cross-sectional area measurements meant to reflect
functional differences.
There were several challenges in developing this measurement method. The first
was in the technique for levator ani separation. There are some small regions of the
muscle where the iliococcygeal and the pubic portions overlap, for example, behind the
rectum. Therefore separation of the pubic and iliococcygeal portions of the muscle does
not preclude the possibility for inclusion of a small portion of the iliococcygeal muscle in
the pubic portion, and vice versa. In addition, subdivisions in the pubic portion, such as
the puborectalis and pubococcygeus, cannot be separated at the present time. Further
refinements in the technique may allow more accurate separations to be made in the
future.
Identification of muscle fiber direction is also a challenge. Although it is possible
with MRI to see fiber direction in coarse grained muscles such as the gluteus maximus, it
is not possible, at present, to consistently see individual fibers within the pubic portion of
the levator. The straight line used to approximate muscle fiber direction from the
muscle origin to insertion point allows us to circumvent this problem. However, some
muscle fibers do not follow this approximate fiber direction. For example, cross-sectional
areas calculated at location 4 are not strictly perpendicular to the fiber direction as some
fibers cross the midline at this point. This problem does not affect locations 1, 2 or 3.
We were concerned that a defect might also change the remaining fiber direction;
however, our calculations showed that the differences in measurements were not
statistically significant (Table 2-2).
Then we applied this technique to a larger group of women to investigate the muscle
loss in women with and with prolapse and different degree of levator ani muscle defect.
It is noteworthy that women with major defects exhibited a 36 % reduction in
cross-section area in the ventral portion of the levator ani muscle compared with women
without defects, whereas in the posterior portion of the muscle, women with major
defects exhibited a 9% larger cross-section area compared to those without defects.
While women with minor defects similarly exhibited a 29% smaller cross-section area in
the ventral portion of the muscle compared to those with no defects, they had a smaller

38
cross-section in the dorsal portion of the muscle.
The finding of smaller cross-section area in the ventral portion based on severity of
visible defects on MR images reinforces the hypothesis that defects in the levator ani is
localized to this area (DeLancey et al, 2003, Dietz et al, 2005). This region is where the
pubovisceral or pubococcygeal muscle (pubovaginal muscle, puboanal muscle and
puboperineal muscle) predominate. Comparing cross-sectional area of the muscle
between the groups begins the process of using morphological differences to explain
differences in muscle function. For a parallel-fibered, non-pennate muscle, the smaller
the cross-sectional area, the smaller the maximal force a muscle can generate.
What might explain the paradoxical finding of increased muscle cross-sectional area
in the dorsal region of the pubic portion in women with severe defects? In this region,
the fibers of the puborectalis muscle predominate and form a sling behind the rectum
(Kearney et al, 2004, Lawson et al, 1975). The increased cross-sectional area could
represent compensatory hypertrophy. Alternatively this increased posterior
cross-sectional area may represent disrupted muscle that has retracted dorsally; however,
if this muscle has retracted because of detachment of its origin or insertion, atrophy
should have occurred within months of the injury. Further research will be needed to
clarify these newly-identified issues.
In both ventral and dorsal regions of the pubic portion of the levator ani muscle,
cross-sectional area measurements did not show statistically significant differences when
women with prolapse were compared with women having normal support for each level
of defect. This does not mean that muscle defects are unimportant to the occurrence of
prolapse because muscle defects happen more often in the ventral levator ani of women
with prolapse 10 and differences in levator ani morphology have been observed between
women with prolapse and normal support (Hoyte et al, 2001, Singh et al, 2003).
However, when defects are present, the amount of muscle is the same regardless of
whether there is prolapse or not. In other words, a woman with prolapse and a defect in
the levator ani muscle had a similar levator cross-sectional area compared to a woman
with a similar severity of levator defect, but normal support. This is logical because the
pelvic organ support system consists of connective tissue, striated muscle, and smooth
39
muscle. Therefore, damage in any one of these systems will not explain all occurrences
of prolapse.
This study quantified differences in levator ani muscle cross-sectional area
perpendicular to the fiber direction in different patient populations. It should help
investigators assess the biomechanical role of levator ani muscle loss in causing pelvic
organ prolapse. The difference in cross-sectional area in the ventral and dorsal regions
of the muscle indicates that the levator ani muscle is affected in a nonuniform manner,
consistent with the fact that the levator ani is composed of several different component
muscles that are differentially affected by damage. Specific patterns of damage to
specific muscle elements may be important for the development of pelvic floor
dysfunction.

40
References Aukee P, Usenius JP, Kirkinen P. An evaluation of pelvic floor anatomy and function by
MRI. Eur J Obstet Gynecol Reprod Biol. 2004; 112(1):84-8.
Bernstein IT. The pelvic floor muscles: muscle thickness in healthy and
urinary-incontinent women measured by perineal ultrasonography with reference to the
effect of pelvic floor training. Estrogen receptor studies.Neurourol Urodyn.
1997;16(4):237-75.
Boreham MK et al. Morphometric analysis of smooth muscle in the anterior vaginal
wall of women with pelvic organ prolapse. Am J Obstet Gynecol 2002;187: 56-63.
Boreham MK et al. Morphometric properties of the posterior vaginal wall in women
with pelvic organ prolapse. Am J Obstet Gynecol 2002; 187: 1501-1509.
Boyles SH, Weber AM, Meyn L. Procedures for pelvic organ prolapse in the United
States, 1979-1997. Am J Obstet Gynecol 2003;188:108-15
Delete Boyles SH, Weber AM, Meyn L. Procedures for urinary incontinence in the
United States, 1979-1997. Am J Obstet Gynecol 2003;189:·70-5.
Bump RC, Mattiasson A, Bo K, Brubaker LP, DeLancey JO, Klarskov P, Shull BL, Smith
AR. The standardization of terminology of female pelvic organ prolapse and pelvic floor
dysfunction. Am J Obstet Gynecol. 1996; 175(1):10-7.
Chen L, Hsu Y, Ashton-Miller JA, DeLancey JOL. Measurement of the pubic portion of
the levator ani muscle in women with unilateral defects in 3D models from MR images.
Int J Gynaecol Obstet. 2006 Mar;92(3):234-41.
DeLancey JO, Kearney R, Chou Q, Speights S, Binno S. The appearance of levator ani
muscle abnormalities in magnetic resonance images after vaginal delivery. Obstet

41
Gynecol. 2003;101(1):46-53.
Dietz HP, Lanzarone V. Levator trauma after vaginal delivery. Am J Obstet Gynecol.
2005; 106(4): 707-12.
Fielding JR, Dumanli H, Schreyer AG, Okuda S, Gering DT, Zou KH et al. MR-based
three-dimensional modeling of the normal pelvic floor in women: Quantification of
muscle mass. Am J Radiology. 2000: 174; 657-60.
Hoyte L, Fielding JR, Versi E, Mamisch C, Kolvenbach C, Kikinis R Variations in levator
ani volume and geometry in women: the application of MR based 3D reconstruction in
evaluating pelvic floor dysfunction. Arch Esp Urol. 2001 Jul-Aug;54(6):532-9
Hoyte L, Schierlitz L, Zou K, Flesh G, Fielding JR. Two- and 3-dimensional MRI
comparison of levator ani structure, volume, and integrity in women with stress
incontinence and prolapse. Am J Obstet Gynecol. 2001; 185(1):11-9.
Hoyte L and Ratiu P. Linear measurements in 2-dimentional pelvic floor imaging:
The impact of slice tilt angles on measurement reproducibility. Am J Obstet Gynecol
2001;185:537-544.
Hoyte L, Jakab M, Warfield SK, Shott S, Flesh G, Fielding JR. Levator ani thickness
variations in symptomatic and asymptomatic women using magnetic resonance-based
3-dimensional color mapping. Am J Obstet Gynecol. 2004; 191:856-61.
Ikai M, Fukunaga T. Calculation of muscle strength per unit cross-sectional area of
human muscle by means of ultrasonic measurement. Int. Z. angew. Physiol. Einschl.
Arbeitsphysiol. 1968; 26(1):26-32.

42
Ikai M, Fukunaga T. A study on training effect on strength per unit cross-sectional area
of muscle by means of ultrasonic measurement. Int. Z. angew. Physiol. Einschl.
Arbeitsphysiol. 1970; 28(3):173-180
Janda S, van der Helm FC, de Blok SB. Measuring morphological parameters of the
pelvic floor for finite element modelling purposes. J Biomech. 2003; 36(6):749-57.
Kearney R, Sawhney R, DeLancey JO. Levator ani muscle anatomy evaluated by
origin-insertion pairs. Obstet Gynecol. 2004; 104(1):168-73.
Kearney R, Miller JM, Ashton-Miller JA, DeLancey JOL. Obstetric factors associated
with levator ani muscle injury after vaginal birth. Obstet Gynecol. 2006; 107(1):
144-9.
Kirschner-Hermanns R, Wein B, Niehaus S, Schaefer W, Jakse G. The contribution of
magnetic resonance imaging of the pelvic floor to the understanding of urinary
incontinence. Br J Urol 1993;72:715–8.
Kris Strohbehn, James H. Ellis, Judith A. Strohbehn, John O.L. DeLancey. Magnetic
resonance imaging of levator ani with anatomic correlation. Obstet Gynecol. 1996;
87(2):277-85.
Lawson JO. Pelvic anatomy. I. Pelvic floor muscles Ann R Coll Surg Engl
1974;54:244-52.
.
Smith ARD, Hosker GL, Warrell DW. The role of partial denervation of the pelvic floor
in the etiology of genitourinary prolapse and stress incontinence of urine: a
neurophysiologic study. Br J Obstet Gynaecol 1989;96:24-28 et al
Singh K, Reid WM, Berger LA. Magnetic resonance imaging of normal levator ani
anatomy and function. Obstet Gynecol. 2002; 99(3):433-8

43
Singh K, Jakab M, Reid WM, Berger LA, Hoyte L. Three-dimensional magnetic
resonance imaging assessment of levator ani morphologic features in different grades of
prolapse. Am J Obstet Gynecol. 2003; 188(4):910-5.
Takano CC et al. Analysis of collagen in parametrium and vaginal apex of women with
and without uterine prolapse. Int Urogynecol J 2002; 13(6):342-5.
Tunn R, Paris S, Fischer W, Hamm B, Kuchinke J. Static magnetic resonance imaging of
the pelvic floor muscle morphology in women with stress urinary incontinence.
Neurourol Urodyn. 1998;17(6):579-89.

44
Chapter 3 Geometrical Analyses of Anterior Vaginal Wall in
Women With and Without Prolapse
3.1 Vaginal Thickness, Cross-Sectional Area, and Perimeter in Women With and
Those Without Prolapse
ABSTRACT
OBJECTIVE: Use axial magnetic resonance imaging to test the null hypothesis that no difference
exists in apparent vaginal thickness between women with and those without prolapse.
METHODS: Magnetic resonance imaging studies of 24 patients with prolapse at least 2 cm beyond
the introitus were selected from an ongoing study comparing women with prolapse with normal
control subjects. The magnetic resonance scans of 24 women with prolapse (cases) and 24 women
without prolapse (controls) were selected from those of women of similar age, race, and parity. The
magnetic resonance files were imported into an experimental modeling program, and 3-dimensional
models of each vagina were created. The minimum transverse plane cross-sectional area, mid-sagittal
plane diameter, and transverse plane perimeter of each vaginal model were calculated.
RESULTS: Neither the mean age (cases 58.6 years +/- standard deviation [SD] 14.4 versus controls
59.4 years +/- SD 13.2) nor the mean body mass index (cases 24.1 kg/m(2)+/- SD 3.3, controls 25.7
kg/m(2)+/- SD 3.7) differed significantly between groups. Minimum mid-sagittal vaginal diameters
did not differ between groups. Patients with prolapse had larger minimum vaginal cross-sectional
areas than controls (5.71 cm(2)+/-
standard error of the mean [SEM] 0.25 versus 4.76 cm(2)+/- SEM 0.20, respectively; P = .005). The
perimeter of the vagina was also larger in the prolapse group (11.10 cm +/- SEM 0.24) compared with

45
controls (9.96 cm +/- SEM 0.22) P = .001. Subgroup analysis of patients with endogenous or
exogenous estrogen showed
prolapse patients had larger vaginal cross-sectional area (P = .030); in patients without estrogen group
differences were not significant (P = .099).
CONCLUSION: Vaginal thickness is similar in women with and those without pelvic organ prolapse.
The vaginal perimeter and cross-sectional areas are 11% and 20% larger in prolapse patients,
respectively. Estrogen status did not affect differences found between groups.
3.1.1 Introduction
Pelvic organ prolapse is a remarkably common problem, yet the disease mechanism
resulting in its occurrence remains poorly understood. There are competing hypotheses
that have been proposed to explain its cause. For example, 2 differing mechanisms have
been used to explain the formation of a cystocele: vaginal wall stretching versus vaginal
wall detachment. The first focuses on stretching of the fibromuscular vaginal tube (fascia)
as the disease mechanism of prolapse. This has also been referred to as a distention
cystocele (Nichols et al 1996). The distention cystocele implies that the vagina becomes
thin and attenuated in the formation of a cystocele. The other focuses more on the
connections of the vaginal tube relative to the pelvic sidewall( Richardson et al,
1976,1981). When these connections break, a paravaginal defect or a displacement
cystocele occurs (Nichols et al, 1996, Richardson et al, 2000). Similar considerations
have been voiced concerning support of the posterior vaginal wall (Hoyte et al, 2000).
Magnetic resonance imaging is a tool that can be used to study pelvic floor structures. On
axial magnetic resonance images, the vagina is a discreet structure with visible
boundaries. The outer border of the vagina is delineated by a dark line that represents the
fibromuscular wall of the vagina. Because the vagina is a potential space that is not filled

46
with fluid or air, the structure inside the dark fibromuscular circumference is made up of
the coapted walls of the vagina. This allows the overall thickness of the vaginal wall to be
measured and quantified.
To help gain insight regarding the role of each of the above hypotheses in explaining
pelvic organ prolapse, we used magnetic resonance imaging to test the null hypothesis
that no difference exists in apparent vaginal thickness between women with and those
without prolapse.
3.1.2 Materials and Methods
Axial magnetic resonance scans of 25 women with prolapse of a vaginal wall or
cervix at least 2 cm beyond the introitus were selected from an ongoing institutional
review board–approved study comparing women with prolapse with normal control
subjects. The prolapse patients were recruited through the University of Michigan
Urogynecology Clinic. The controls were recruited mainly through advertisements, as
well as through the Women's Health Registry, a list of women who expressed interest in
participating in women's health projects. Patients were excluded if they had previous
surgery for prolapse or incontinence, had genital anomalies, or had delivered in the past
year. Patients were enrolled between June 2001 and September 2003. The magnetic
resonance scans of 25 women with prolapse (cases) and 25 women without prolapse
(controls) were selected from those of women of similar age, race, and parity. One patient
in whom the prolapse was protruding at the time of magnetic resonance was excluded
because this created a double layer of vagina, which would have confounded results. A
control subject was therefore also excluded to produce 24 patients in each group for
analysis. Multiplanar 2-dimensional fast-spin proton density magnetic resonance images
(echo time 15 ms, repetition time 4,000 ms) of all pelvises were obtained by use of a 1.5
T superconducting magnet (Signa Horizon LX, General Electric, Milwaukee, WI) with
version 9.1 software. The fields of view in both axial and coronal images were 16 x 16
cm, and the field of view in the sagittal images was 20 x 20 cm. All 3 views had slice
thicknesses of 4 mm, with a 1-mm gap between slices.

47
The outer margin of the vagina was traced to include the fibromuscular wall by using
3-dimensional computer graphics and modeling software (Slicer 2b1; Massachusetts
Institute of Technology, Cambridge, MA). In subjects with a uterus and cervix, the vagina
was traced until the cervix could be seen (Figure 3 -1-1) to avoid including the cervix in
the vaginal wall measurements. The vagina was traced in all of the axial slices to the level
of the introitus, noted by the visibility of the vestibular bulbs (Figure 3 -1-1). Blinding of
the investigator was attempted but often not possible because of the visible nature of the
prolapse in many of the magnetic resonance images. Three-dimensional models based on
the axial magnetic resonance tracings were then constructed. The models were imported
into I-DEAS 9.0 (EDS, Hook, UK), an engineering computer-aided analysis and design
program (Figure 3-1-2), to make measurements perpendicular to the long axis of the
vagina to avoid 2-dimensional measurement errors (Figure 3-1-3A). The longitudinal axis
of the 3-dimensional vaginal models was determined as the midline of the vagina
contours in the mid-sagittal plane (Figure 3-1-3B). Five equally spaced points were
selected along the longitudinal axis of each model, and cross sections of the vagina
perpendicular to the longitudinal axis were made (Figure 3-1-3C). The minimum
diameter in mid-sagittal plane, cross-sectional area, and length of the perimeter of the
vagina were calculated at each cross section (Figure 3-1-3D). The perimeter of the
vaginal wall was measured as the circumferential length of the outer vaginal wall margin
on each cross section.
Figure 3-1-1. Axial slices at 5-mm intervals arranged caudal to cephalad starting from the image in the upper left (image 0). Vaginal tracings were made from above the level of the vestibular bulbs (VB), represented by asterisks (*), caudally (image 0) to below where the cervix (C) could be seen (image -4.0). U, urethra; V, vagina; R, rectum; B, bladder. © DeLancey 2004.

48
Descriptive statistics were generated, including the mean and standard error of the mean
(SEM). The measurements at each cross section were summed for the groups, and an
aggregated average was calculated. A repeated-measures analysis of variance was used to
test for group and level effects. Two-sided, 2-group, t tests were used to test group
differences. P < .05 was considered significant.
Figure 3-1-2. Selected 3-dimensional model as it appears in I-DEAS 9.0. The sacrum (Sac), pubic bone (PB), and pelvic organs have been shown for orientation. B, bladder; U, urethra; UT, uterus; V, vagina; R, rectum. © DeLancey 2004.

49
Figure 3-1-3. Steps in obtaining vaginal measurements: A. Threedimensional I-DEAS 9.0 vaginal model. B. Longitudinal axis determined in the mid-sagittal plane, with 5 equally spaced locations along the longitudinal axis marked. C.Sample cross sections: Location 1 is near the vaginal apex, and location 5 is near the hymen. D. Mid-sagittal diameter, perimeter, and cross-sectional area were calculated for each axial cross section. © DeLancey 2004.
3.1.3 Results
Subject groups had similar mean age and body mass index (Table 3-1-1). The analysis of
variance showed that mid-sagittal vaginal diameters did not differ by group. There was,
however, a significant difference by location (Table 3-1-2, Figure 3-1-4). The vaginal
cross-sectional areas differed significantly by group but not by level (Table 3-1-2). The
case group had mean cross-sectional areas that were 20% larger than those of controls
(5.71 cm2± SEM 0.25 versus 4.76 cm2± SEM 0.20, respectively; P = .005; Figure 3-1-5).
The perimeter of the vagina was significantly different by group as well as location
(Table 3-1-2). The perimeter was significantly longer in the case group than in the
controls (11.10 cm ± SEM 0.24 versus 9.96 cm ± SEM 0.22, respectively; P = .001;
Figure 3-1-6). Post hoc tests of statistical power were calculated for group differences in

50
mid-sagittal diameter, cross-sectional area, and perimeter and were found to be 5%, 83%,
and 92%, respectively.
Figure 3-1-4. Vaginal mid-sagittal diameter at each of the 5 vaginal locations. Refer to Figure 3-1-3 for vaginal locations. The aggregate mean of the 5 individual segments is also shown at right. Error bars indicate standard error of the mean.

51
Figure 3-1-5. Cross-sectional area at each of the 5 vaginal locations. The aggregate mean of the 5 individual segments is shown at right. Error bars indicate standard error of the mean.

52
Figure 3-1-6. Vaginal perimeter. The aggregate mean of the 5 individual segments is shown at right. Error bars indicate standard error of the mean.
A subanalysis was performed to examine the effect of estrogen status on vaginal
cross-sectional area and vaginal thickness. In the case group, 16 patients were either
premenopausal or on hormone replacement therapy, compared with 14 in the control
group. Eight patients in the case group and 10 in the control group were postmenopausal
and not on hormone replacement therapy. Comparing cases and controls who were
estrogenized, the case patients had 19% larger mean cross-sectional areas (5.90 cm2±
SEM 0.33) than the controls (4.96 cm2± SEM 0.25; P = .030). Among women without
estrogen, there was a trend toward the case group having larger mean cross-sectional
areas (case 5.33 cm2± SEM 0.34, controls 4.48 cm2± SEM 0.34; P = .099), but the
difference was not statistically significant. When mean mid-sagittal diameter was
examined based on hormonal status, there were no group differences in either women
with estrogen (case 1.31 cm ± SEM 0.08, control 1.35 cm ± SEM 0.07; P = .699) or those
without estrogen (case 1.28 cm ± SEM 0.09, control 1.21 cm ± SEM 0.09; P = .614). The
mean mid-sagittal vaginal diameters in the controls with (n = 14) and those without (n =
10) estrogen were compared, but no significant differences were found.
3.1.4 Discussion
As judged by its appearance on magnetic resonance scans, vaginal thickness in women
with prolapse was not different from that in women with normal support. There was less
than a 1% difference in the mid-sagittal diameter between the groups. Because the
mid-sagittal diameter is the sum of the anterior and the posterior vaginal walls, women
with prolapse do not appear to have thinner vaginas.
Women with prolapse do have a 20% larger mean vaginal cross-sectional area. Because
the mid-sagittal diameters of the 2 groups were similar, the larger cross-sectional area of
the prolapse group must be due to a larger vaginal width, which is represented by the
11% larger vaginal perimeter. These data indicate that there is more vaginal tissue in
women with prolapse than in women without prolapse. This contradicts the clinical
assumption that the vagina in women with prolapse is thin.

53
The fact that the same trends in cross-sectional area and mid-sagittal vaginal diameter
were maintained regardless of estrogen status confirms that hormonal status was not a
confounding variable in this study. Although estrogen status did not change the trends in
mean cross-sectional area and mid-sagittal diameter between the groups, it has been well
established that the presence of estrogen positively affects vaginal maturation.( Blakeman
et al, 2001, Vardy et al, 2003) Indeed, the 10% larger mid-sagittal vaginal diameter in
control patients with estrogen compared with controls without estrogen suggests that,
with a larger sample size, the difference in thickness might become statistically
significant.
Historically, pelvic surgeons have focused on attenuation of the "endopelvic fascia" as the
cause of prolapse. In 1954, Ricci performed definitive anatomical studies on pelvic
connective tissue and provided an excellent review of the origin of the myth of the
endopelvic fascia.(Vardy et al, 2003, Ricci et al, 1954) Repeated histologic examination
has failed to demonstrate a clear "fascial" layer. After performing a literature review and
performing their own histologic studies, Weber and Walters (Weber et al, 1997) described
the vagina as being made up of 3 layers: mucosa, muscularis, and adventitia. The
adventitial layer is a connective tissue layer of collagen and elastin that separates the
muscular wall of the vagina and the paravaginal tissues. The adventitia is variably
discrete and does not form a complete capsule surrounding the vagina as a true fascial
layer.( Weber et al, 1997) Because of the lack of discrete fascial covering, our tracing
outside the fibromuscular wall includes all the important structural layers of the vagina.
In a study of (Boreham et al, 2002) women with enteroceles, vaginal wall muscularis was
found between vaginal epithelium and peritoneum in all cases; this also suggests that it is
not a site-specific defect in the fibromuscular wall that leads to prolapse.(Tulikangas et al,
2002)
Although the site-specific defect theory for prolapse has become less popular because of
the lack of histologic evidence, a significant body of research remains focused on the
vaginal tube as the source of the problem. Boreham et al (Boreham et al, 2002) found that
the morphometry of anterior vaginal wall tissue obtained from women with prolapse was
significantly altered compared with that from women with normal support. Women with

54
prolapse had decreased fractional area of smooth muscle and disorganized smooth muscle
bundles with decreased -actin staining.( Boreham et al, 2002) In a separate
study,(Boreham et al, 2002) they found that the decreased fractional area of smooth
muscle was also present in the posterior vaginal wall and that women with prolapse had
smaller and fewer nerve bundles in the muscularis compared with controls. Boreham et al
(Boreham et al, 2001) also found that caldesmon, a protein that inhibits smooth muscle
contractility, had increased expression in the vaginal smooth muscle of women with
prolapse. A number of other studies have focused on collagen differences in the vaginal
tube of women with prolapse compared with controls. Although differences in collagen
content have been found, it is difficult to determine whether these differences resulted in
or are a result of prolapse.
The mechanical strength of the vaginal wall is determined by its composition, tissue
architecture, and thickness, all of which influence its material properties. Few studies
have examined the thickness of the vaginal wall in prolapse compared with controls.
Tulikangas et al (Tulikangas et al, 2002) found that the muscularis layer was thicker in
women with enteroceles compared with controls. Shrinkage due to formalin fixation and
differences between excised tissue and in situ tissues may help explain why vaginal
thickness in that study was approximately half that found in the present study. We are not
aware of any other studies that have quantified vaginal wall thickness in patients with
prolapse or controls. Our findings that vaginal wall thickness appears similar in both
groups suggest that it is not the fibromuscular tube of the vagina that is defective.
However, we are not able to comment on the vaginal tissue architecture or composition,
both of which can influence the material properties of the vagina.
A strength of this study is the development of a method to quantitatively describe the
anatomy of prolapse compared with normal women. Measurements done on
2-dimensional axial magnetic resonance images are inaccurate because they are not
usually acquired perpendicular to the longitudinal axis of the vagina. This is due to the
position of the patient in the magnetic resonance scanner as well as the natural sagittal
curvature of the vagina. The variations in slice angle can lead to systemic errors in the
measurements of the 2-dimensional magnetic resonance images.(Hoyte and Ratiul, 2001)
55
By varying the slice angle of magnetic resonance images, Hoyte and Ratiu (Hoyte and
Ratiu, 2001)found that 2-dimensional measurements can differ by up to 15%. To
circumvent this error, we created 3-dimensional models of the vaginas of our subjects.
This allowed for accurate comparisons of the vaginal tube of women with prolapse and
that of normal controls.
Although we found that the thicknesses of the vaginas between groups were not
statistically different, we cannot preclude the possibility that the material properties of the
vaginal wall might differ in their functional capacities. It has also been observed that
women with prolapse have dilated venules in the vaginal wall. (Boreham et al, 2002) led
to errors in measurements of vaginal wall thickness in the present study. In addition, the
study was performed on women in the supine posture when the gravity vector acts
posteriorly rather than caudally, a difference that may affect the tensile loading of the
vaginal wall in women with prolapse. This might have led to an underestimation of group
differences in the supine posture.
To date, a unifying theory explaining the cause of pelvic organ prolapse based on
objective scientific data does not exist. Different theories have been proposed, but data to
resolve these differences are not available. Magnetic resonance imaging allows us to
gather data that can be used to test the hypotheses concerning these long-debated issues.
Although the development of prolapse is likely the common end point of different disease
mechanisms, our study suggests that more attention should be focused on the connections
of the vagina to the pelvic sidewall rather than the vagina itself.

56
3.2 Anterior vaginal wall length and degree of anterior compartment prolapse seen
on dynamic MR images
ABSTRACT
The objective of the study was to determine the relationship between midsagittal vaginal wall
geometric parameters and the degree of anterior vaginal prolapse. We have previously presented data
indicating that about half of anterior wall descent can be explained by the degree of apical descent
present (Summers et al. 2006). This led us to examine whether other midsagittal vaginal geometric
parameters are associated with anterior wall descent. Magnetic resonance (MR) scans of 145 women
from the prior study were suitable for analysis after eight were excluded because of inadequate
visibility of the anterior vaginal wall. Subjects had been selected from a study of pelvic organ prolapse
that included women with and without prolapse. All patients underwent supine dynamic MR scans in
the midsagittal plane. Anterior vaginal wall length, location of distal vaginal wall point, and the area
under the midsagittal profile of the anterior vaginal wall were measured during maximal Valsalva. A
linear regression model was used to examine how much of the variance in cystocele size could be
explained by these vaginal parameters. When both apical descent and vaginal length were considered
in the linear regression model, 77% (R2 = 0.77, p < 0.001) of the variation in anterior wall descent was
explained. Distal vaginal point and a measure anterior wall shape, the area under the profile of the
anterior vaginal wall, added little to the model. Increasing vaginal length was positively correlated
with greater degrees of anterior vaginal prolapse during maximal Valsalva (R 2 = 0.30, p < 0.01)
determining 30% of the variation in anterior wall decent. Greater degrees of anterior vaginal prolapse
are associated with a longer vaginal wall. Linear regression modeling suggests that 77% of anterior
wall descent can be explained by apical descent and midsagittal anterior vaginal wall length.
Keywords Pelvic organ prolapse - Anterior prolapse - Cystocele - Apical descent - Vaginal
length - Dynamic MR images
3.2.1 Introduction
The anterior vaginal prolapse is the most common form of pelvic organ prolapse
(Hendrix et al, 2002) as well as the site with the highest rates of persistent and recurrent
support defects (Shull et al, 2000). Blinded follow-up in a randomized prospective study
of surgical techniques to correct anterior vaginal prolapse at an institution known for
excellence in urogynecologic surgery found that only 30–45% of patients had satisfactory

57
or optimal results at 24 months (Weber et al, 2001). The high rate of suboptimal
outcomes and the inability to predict which patients will fail surgery suggest a lack of
knowledge regarding the disease mechanism of anterior wall prolapse.
Dynamic magnetic resonance (MR) imaging in the midsagittal plane has given us the
ability to study the deformation of the anterior vaginal wall during Valsalva. Previous
analysis using this approach found that about half (R2 = 0.53) of anterior wall descent can
be explained by the degree of apical descent present(Summers et al, 2006). The fact that
apical descent only explains half of anterior wall descent raises the question of what other
changes are involved. This led us to investigate the relationship of other midsagittal
geometric factors, such as anterior vaginal wall length, displacement of the distal vagina,
and anterior vaginal wall shape, to the degree of anterior wall descent. We hypothesized
that these three factors would also predict a significant proportion of the variance in
anterior wall descent.
3.2.2 Materials and methods
A secondary analysis was performed on the sample described in our original report
(Summers et al, 2006). In brief, we recruited women representing varying degrees of
pelvic organ support as part of an on-going study at the University of Michigan in Ann
Arbor, MI. The original study is a case–control study where controls with vaginal points
at least 1 cm above the hymen were matched to cases with prolapse at least 1 cm beyond
the hymen (DeLancey et al, 2007). Pelvic support was determined using the pelvic organ
prolapse quantification system on clinical exam. Women were selected from this pool to
include women in whom the uterus was in situ, the cervix, bladder, and urethra were
visible in the dynamic sagittal images, and a correct Valsalva maneuver was performed as
judged by the movement of the abdominal wall and intestinal contents in a caudal
direction. Women were recruited from the Urogynecology clinic at the University of
Michigan and from advertisements. Women were excluded if they had a prior operation
for pelvic organ prolapse or urinary incontinence. This resulted in a sample of 153
women for the original analysis. The relationship of the apex, as measured by the cervical

58
os location, and the anterior wall descent, as measured by the most dependent bladder
point, was available in these women from the prior study ( Summers et al 2006).
Magnetic resonance (MR) scans of 145 women from the prior study were suitable for this
study with good visualization of the anterior vaginal wall in the dynamic images (mean ±
SD: age = 53.3 ± 12.5 years, parity = 2.7 ± 1.8, body mass index = 26.4 ± 4.5 kg/m2).
Eight scans from the original study were excluded because the complete vaginal wall
could not be adequately seen in sufficient detail for accurate tracing. Although the
original study included both cases and controls, our analysis concerned the relationship
between cervix location, bladder descent, and vaginal length and did not depend on group
status.
MRI was performed on a 1.5-T system (Signa, General Electric, Milwaukee, WI) using a
four-channel torso-phased array coil with the subject in the supine position. Before
starting the examination, the patient was instructed in regards to the straining maneuvers
to be performed during the examination, starting from minimal to maximal straining. For
dynamic imaging, a multiphase, single level image of the pelvis in the midsagittal plane
was obtained approximately every second for 23–27 s using a T2-weighted single-shot
fast spin-echo sequence (time at rest = 1,300 ms, time of excitation = 60 ms, slice
thickness = 6 mm, field of view = 32–36 cm, matrix = 256 × 160, one excitation and
half-Fourier acquisition). The time needed to acquire each of the images was determined
by the patients’ weight and was approximately a second. A set of 20 successive images
were acquired in 23–27 s during rest and a graded Valsalva effort as follows: The
operator instructed the subject to hold her breath in inspiration and initiated the scan and
after 5 s of imaging during rest, the operator instructed the subject to strain minimally for
5 s, moderately for 5 s, and maximally for 5 s, then to breath normally and relax for
another 5–7 s before ending the acquisition. Usually, three images were acquired at rest
during suspended inspiration, 12 during the graded Valsalva effort, and five during
post-Valsalva relaxation and normal breathing. These images were placed in a cine-loop
using RadPix (Version 3.15, Weadock Software, LLC, Ann Arbor, MI) for display as a
movie clip to evaluate the dynamics of prolapse.

59
The image at maximal Valsalva effort was selected for analysis (Figure 3-2-1). A local
coordinate system was created using the inferior pubic point as the origin, the
sacro-coccygeal inferior pubic point (SCIPP) line as the x-axis, and a line perpendicular
to the SCIPP line through the inferior pubic point as the y-axis (Figure 3-2-1). The
location of the external cervical os and the most dependent bladder point was previously
determined using this coordinate system (Summers 2006). Degree of anterior wall and
apical descent were determined by the location of the most caudal bladder point and
external cervical os, respectively.
Figure 3-2-1 MR image at maximal Valsalva showing anterior vaginal wall tracing (solid black line), distal vaginal wall (x), bladder location (triangle), cervical os location (circle), and coordinate system (dotted lines) To account for variability in patient size, we normalized all the subjects’ pelvises to a
SCIPP length of 10.5 cm, which was the mean SCIPP length for our sample. The anterior
vaginal wall was traced from the anterior vaginal fornix to the external urinary meatus. A
program was created using MatLab (the Mathwork, version 7.01 R14) to measure the
length of the vaginal tracings and the SCIPP line. The location of the most distal vaginal
point (the ventral end of the vaginal length tracing) and the area under the midsagittal
profile of the anterior vaginal wall were also analyzed using MatLab. Finally, the area
under the midsagittal anterior wall profile, from its proximal end to its distal end, was
measured as the absolute area between the profile and a straight line connecting the two
ends of the vaginal wall tracing (Figure 3-2-2). This parameter was a measure of the

60
complexity of the line shape of the vaginal wall tracing. Because these area calculations
are a measure of vaginal wall shape rather than a quantification of actual area,
non-normalized values were used.
Figure 3-2-2 Area under the anterior vaginal wall profile. Pubic bone, sacrum, and coccyx are traced. The anterior vaginal wall tracings are shown. A line (small dotted) is used to connect the two ends of the vaginal wall tracing to create an area (shown in gray). Examples aligned using horizontal large dotted reference line. a Minimal descent of most caudal bladder point (triangle). b Greater descent of the bladder point with longer vaginal wall length and larger area. c Similar vaginal wall length to B but smaller area and lesser descent of bladder point
A linear regression model was performed with the dependent variable being prolapse size
as measured by the most dependent bladder point and independent variables being the
three geometric parameters. We calculated the Pearson correlation coefficient for the
regression by comparing the previously obtained most dependent bladder point and the
above vaginal wall parameters at maximum Valsalva: p < 0.05 was considered
significant.
3.2.3 Results
Linear regression (Table 3-2-1) showed that 77% (R 2 = 0.77, p < 0.01) of midsagittal
anterior wall descent can be explained by the combination of apical position and vaginal
length. The exclusion of the five patients from the original study increased the correlation
between cystocele and apical position from R 2 = 0.53 to 0.60. Increasing vaginal length
was positively correlated with greater degrees of anterior vaginal prolapse during
maximal Valsalva (R 2 = 0.30, p < 0.01; Figure 3-2-3). Thus, 30% (R 2 = 0.30) of the
variation in anterior wall descent was determined by vaginal wall length alone. The area

61
under the vaginal wall profile and the distal urethral location were also investigated for
regression modeling but were found not to contribute much to the degree of anterior wall
descent.
Table 3-2-1 Linear regression modeling Cumulative R 2 R 2 added p value Apical 0.60 – <0.001+Vaginal length 0.77 0.17 <0.001+Distal point 0.78 0.01 <0.001+Area under vaginal profile 0.81 0.03 <0.001
Figure 3-2-3 Vaginal length during Valsalva and distance of the most caudal bladder point below normal. There is a linear correlation y = 0.69 x − 0.85, R 2 = 0.30 As would be expected from the correlation found between apical descent and anterior
wall descent, there were subjects who had uterine descent and large cystoceles
(Figure 3-2-4a). However, there were also subjects with relatively well-supported apical
compartments who had large cystoceles with long anterior vaginal walls (Figure 3-2-4b).
Other morphologic variants existed as well where there were examples of patients with
cystoceles with normal and short vaginal wall lengths (Figure 3-2-4c, d, respectively).

62
Figure 3-2-4 Subject examples showing relationship between apical support and vaginal length in determining the size of cystoceles. Top row: MR image with maximal Valsalva. Bottom row: Coordinate axis, vaginal tracings, as well as bladder and cervical locations. Images have been standardized for pelvic size and orientation. a Subject who had uterine descent and large cystocele. b Subject with relatively well-supported apical compartments who had large cystocele with a long anterior vaginal wall. c Subject with cystocele and a normal vaginal wall length. d Subject with cystocele with a short vaginal wall length
The relationship between apical descent and vaginal wall length was examined to see if
apical descent resulted in longer vaginal length. The correlation was R 2 = 0.36, p = 0.02.
3.2.4 Discussion
Linear regression modeling shows that 77% of anterior wall descent can be explained by
both vaginal length and apical descent measured on midsagittal dynamic MR images. A
positive correlation was found between anterior wall descent and anterior vaginal wall
length with 30% of variation in anterior wall descent being explained by the length of the
vaginal wall. These relationships suggest that the disease mechanism of anterior wall
prolapse is likely multifactoral resulting in different morphologic variants of cystocele.
Anterior vaginal support has been simplified to a trapezoidal vaginal wall with
connections at the top and laterally (DeLancey et al, 2002). Our previous work supports
the hypothesis that defects of the apical support are related to cystocele formation
(Summers et al, 2006). The weak correlation between apical descent and vaginal length

63
and the strong correlation between vaginal length and cystocele size suggest that
alterations in the actual vaginal wall itself may be involved in cystocele development.
Vaginal wall characteristics have been previously evaluated. The fraction of smooth
muscle in the anterior vaginal wall shows great variability among individuals (Morgan et
al, 2003), and its contractility is significantly decreased in women with pelvic organ
prolapse (Boreham et al, 2002, Boreham et al, 2002). Patients with prolapse have also
been found to have alterations in collagen ratios and turn over of collagen (Chen et al,
2002, Moalli et al, 2004, Norton et al, 1992). Findings regarding the collagen content of
these tissues have been inconsistent with some studies showing no change (Liapis et al,
2000, Liapis et al, 2001), and others increased content (Kokcu et al, 2002). Comparison
of 3D vaginal models of patients with and without prolapse showed similar vaginal
anterior–posterior thickness between groups suggesting that the vaginal wall of patients
with prolapse is not attenuated (Hsu et al, 2005). The shear strength of vaginal wall
specimens was lower in patients with pelvic floor dysfunction than normal controls
(Kondo et al, 1994), and great variability in the tensile and bending strength of samples
has also been observed (Cosson et al, 2004)
The vaginal apex has also been examined as the site of failure. One study reported that
collagen content was similar between prolapse patients and controls at the vaginal apex
but was lower in the parametrial tissue (Takano et al, 2002) . The resiliency of the apical
support structures such as the uterosacral ligaments has also been found to be
significantly reduced among women with symptomatic uterovaginal prolapse (Reay et al,
2003).
Dynamic MR imaging has been used for the evaluation and staging of pelvic organ
prolapse (Etlik et al, 2005, Lienemann et al, 1997, Singh et al, 2001). Ozasa et al. (Ozasa
et al, 1992) also used midsagittal dynamic MRI to asses changes in pelvic support in
women with prolapse. They qualitatively compared descent using the relationship of a
best-fit levator line and the pubic bone, however, did not perform quantitative
measurements. The current study has the advantage of quantifying midsagittal changes

64
that occur during Valsalva. These quantifications deepen our understanding of anterior
compartment prolapse mechanisms.
There are several limitations of this study. The dynamic sequence used is limited to a
midsagittal view, thereby not allowing the study of changes that may occur in the lateral
vaginal wall, which have been observed in anterior compartment prolapse (Richardson et
al, 1981). Therefore, we cannot comment on the presence or effects of paravaginal
defects. In addition, these sequences were acquired in the supine position, which may
limit the descent of the pelvic structures. We minimized this limitation by careful
coaching the woman to achieve the maximal prolapse and reviewed all the dynamic video
clips to make sure that Valsalva was performed correctly. In the past, researchers have
compared supine dynamic MR images with those performed in a sitting position in an
open configuration scanner and found supine scans during straining to be comparable in
documenting pelvic floor movement (Fielding et al, 1998, Bertsschinger et al, 2002). An
additional limitation is represented by the example in Figure 3-2-4d. This woman has
significant anterior wall prolapse and apical descent but yet has a short vaginal length.
Although clinically, this woman does not have a shortened wall, she appears to on
dynamic MR images because the anterior wall is folded in on itself like an accordion.
The association of increased midline vaginal length in anterior compartment prolapse
provides objective data to be considered in the clinical thinking and treatment of
cystoceles. Traditionally, anterior vaginal wall prolapse is attributed to either lateral
detachment of the anterior vaginal wall at the pelvic side wall, referred to as a
displacement “cystocele,” or as a central failure of the vaginal wall itself that results in a
distension “cystocele.” Whether length changes are due to a paravaginal defect, midline
defect, or are simply due to stretching of the vaginal wall once a cystocele becomes
present will require further research. The association seen in this study nevertheless raises
interesting clinical questions. For example, do traditional side-to-side plications address
excess vaginal length associated with anterior compartment prolapse?

65
References Bertsschinger KM, Hetzer FH, Roos JE, Treiber K, Marincek B, Hilfiker PR Dynamic
MR imaging of the pelvic floor performed with patient sitting in an open-magnet unit
versus with patient supine in a closed-magnet unit. Radiology 2002; 223(2):501–508
Blakeman PJ, Hilton P, Bulmer JN. Cellular proliferation in the female lower urinary tract
with reference to oestrogen status. BJOG 2001;108:813–6.
Boreham MK, Wai CY, Miller RT, Schaffer JI, Word RA. Morphometric properties of the
posterior vaginal wall in women with pelvic organ prolapse. Am J Obstet Gynecol
2002;187:1501–9.
Boreham MK, Miller RT, Schaffer JI, Word RA. Smooth muscle heavy chain and
caldesmon expression in the anterior vaginal wall of women with and without pelvic
organ prolapse. Am J Obstet Gynecol 2001;185:944–52.
Boreham MK, Wai CY, Miller RT, Schaffer JI, Word RA. Morphometric analysis of
smooth muscle in the anterior vaginal wall of women with pelvic organ prolapse. Am J
Obstet Gynecol 2002;187:56–63.
Chen BH, Wen Y, Li H, Polan ML. Collagen metabolism and turnover in women with
stress urinary incontinence and pelvic prolapse. Int Urogynecol J Pelvic Floor Dysfunct
2002;13(2):80–87
Cosson M, Lambaudie E, Boukerrou M, Lobry P, Crepin G, Ego A A biomechanical
study of the strength of vaginal tissues. Results on 16 post-menopausal patients
presenting with genital prolapse. Eur J Obstet Gynecol Reprod Biol 2004;112(2):201–205
DeLancey JOL. Fascial and muscular abnormalities in women with urethral
hypermobility and anterior vaginal wall prolapse. Am J Obstet Gynecol 2002;187:93–98

66
DeLancey JO, Morgan DM, Fenner DE, Kearney R, Guire K, Miller JM, Hussain H,
Umek W, Hsu Y, Ashton-Miller JA. Comparison of levator ani muscle defects and
function in women with and without pelvic organ prolapse. Obstet Gynecol
2007;109:295–302
Etlik O, Arslan H, Odabasi O, Odabasi H, Harman M, Celebi H et al. The role of the
MR-fluoroscopy in the diagnosis and staging of the pelvic organ prolapse. Eur J Radiol
2005;53:136–141
Fielding JR, Griffiths DJ, Versi E, Mulkern RV, Lee MLT, Jolesz FA (1998) MR imaging
of pelvic floor continence mechanisms in the supine and sitting positions. Am J
Roentgenol 171:1607–1610
Gitsch E, Palmrich AH. Gynelogical operative anatomy. Berlin, Germany: De Gruyter;
1977.
Hendrix SL, Clark A, Nygaard I, Aragaki A, Barnabei V, McTiernan A. Pelvic organ
prolapse in the women’s health initiative: gravity and gravidity. Am J Obstet Gynecol
2002;186(6):1160–1166
Hoyte L, Ratiu P. Linear measurements in 2-dimensional pelvic floor imaging: the impact
of slice tilt angles on measurement reproducibility. Am J Obstet Gynecol
2001;185:537–44.
Hsu Y, Chen L, DeLancey JOL, Ashton-Miller JA Vaginal thickness, cross-sectional area,
and perimeter in women with and those without prolapse. Obstet Gynecol
2005;105(5):1012–1017
Kokcu A, Yanik F, Cetinkaya M, Alper T, Kandemir B, Malatyalioglu E
Histopathological evaluation of the connective tissue of the vaginal fascia and the uterine
ligaments in women with and without pelvic relaxation. Arch Gynecol Obstet
2002;266(2):75–78

67
Kondo A, Narushima M, Yoshikawa Y, Hayashi H. Pelvic fascia strength in women with
stress urinary incontinence in comparison with those who are continent. Neurourol
Urodyn 1994;13(5):507–513
Liapis A, Bakas P, Pafiti A, Hassiakos D, Frangos-Plemenos M, Creatsas G. Changes in
the quantity of collagen type I in women with genuine stress incontinence. 2000;Urol Res
28(5):323–326
Liapis A, Bakas P, Pafiti A, Frangos-Plemenos M, Arnoyannaki N, Creatsas G. Changes
of collagen type III in female patients with genuine stress incontinence and pelvic floor
prolapse. Eur J Obstet Gynecol Reprod Biol 2001;97:76–9.
Lienemann A, Anthuber C, Baron A, Kohz P, Reiser M (1997) Dynamic MR
colpocystorectography assessing pelvic-floor descent. Eur Radiol 1997;7(8):1309–1317
Moalli PA, Talarico LC, Sung VW, Klingensmith WL, Shand SH, Meyn LA, Watkins SC.
Impact of menopause on collagen subtypes in the arcus tendineous fasciae pelvis. Am J
Obstet Gynecol 2004;190(3):620–627
Morgan DM, Iyengar J, DeLancey JO. A technique to evaluate the thickness and
density of nonvascular smooth muscle in the suburethral fibromuscular layer. Am J
Obstet Gynecol 2003;188(5):1183–1185
Nichols DH, Randall CL. Vaginal surgery. 4th ed. Baltimore (MD): Williams & Wilkins;
1996.
Norton P, Boyd C, Deak S. Collagen synthesis in women with genital prolapse or stress
urinary incontinence. Neurourol Urodyn 1992;11:300–1.
Ozasa H, Mori T, Togashi K (1992) Study of uterine prolapse by magnetic resonance
imaging: Topographical changes involving the levator ani muscle and the vagina.

68
Gynecol Obstet Invest 34:43–48
Reay Jones NH, Healy JC, King LJ, Saini S, Shousha S, Allen-Mersh TG Pelvic
connective tissue resilience decreases with vaginal delivery, menopause and uterine
prolapse. Br J Surg 2003;90(4):466–472
Ricci JV, Thom CH. The myth of a surgically useful fascia in vaginal plastic
reconstructions. Q Rev Surg 1954;11:253–61.
Ricci JV, Lisa JR, Thom CH, Kron WL. The relationship of the vagina to adjacent organs
in reconstructive surgery: a histologic study. Am J Surg 1947;74:387–410.
Richardson AC, Lyon JB, Williams NL. A new look at pelvic relaxation. Am J Obstet
Gynecol 1976;126:568–73.
Richardson AC, Edmonds PB, Williams NL. Treatment of stress urinary incontinence due
to paravaginal fascial defect. Obstet Gynecol 1981;57:357–62.
Richardson AC. Paravaginal repair. In: Hurt WG, editor. Urogynecologic surgery. 2nd ed.
Philadelphia (PA): Lippincott Williams & Wilkins; 2000. p. 71–80.
Richardson AC, DeLancey JOL. Anatomy of genital support. In: Hurt WG, editor.
Urogynecologic surgery. 2nd ed. Philadephia (PA): Lippincott Williams & Wilkins; 2000.
p. 21–35.
Shull BL, Bachofen C, Coates KW, Kuehl TJ .A transvaginal approach to repair of apical
and other associated sites of pelvic organ prolapse with uterosacral ligaments. Am J
Obstet Gynecol 2000;183:1365–1373
Singh K, Reid WM, Berger LA Assessment and grading of pelvic organ prolapse by use
of dynamic magnetic resonance imaging. Am J Obstet Gynecol 2001;185(1):71–77

69
Summers A, Winkel LA, Hussain HK, DeLancey JOL. The relationship between anterior
and apical compartment support. Am J Obstet Gynecol 2006;194:1438–1443
Takano CC, Girao MJ, Sartori MG, Castro RA, Arruda RM, Simoes MJ, et al. Analysis of
collagen in parametrium and vaginal apex of women with and without uterine prolapse.
Int Urogynecol J Pelvic Floor Dysfunct 2002;13:342–5.
Tulikangas PK, Walters MD, Brainard JA, Weber AM. Enterocele: is there a histologic
defect? Obstet Gynecol 2001;98:634–7.
Vardy MD, Landsay R, Scotti RJ, Mikhail M, Richart RM, Nieves J, et al. Short-term
urogenital effects of raloxifene, tamoxifen and estrogen. Am J Obstet Gynecol
2003;189:81–8.
Weber AM, Walters MD. Anterior vaginal prolapse: review of anatomy and techniques of
surgical repair. Obstet Gynecol 1997;89:311–8.
Weber AM, Walters MD, Piedmonte MR, Ballard LA Anterior colporrhaphy: a
randomized trial of three surgical techniques. Am J Obstet Gynecol 2001;185:1299–1304

70
Chapter 4
2D Conceptual Lumped Parameter Model
ABSTRACT
Objective: To use a biomechanical model to explore how impairment of the pubovisceral portion of
the levator ani muscle and/or the apical vaginal suspension complex might interact to affect anterior
vaginal wall prolapse severity.
Method: A lumped parameter biomechanical model of the anterior vaginal wall and its support
system was developed and implemented in Matlab. The anterior vaginal wall and its main muscular
and connective tissue support elements, namely the levator plate, pubovisceral muscle, cardinal and
uterosacral ligaments were included and their geometry was based on mid-sagittal plane magnetic
resonance scans. Material properties were based on published data. The change in the sagittal
profile of the anterior vaginal wall during a maximum Valsalva was then predicted for different
combinations of pubovisceral muscle and connective tissue impairment.
Results: Under raised intra-abdominal pressure, the magnitude of anterior vaginal wall prolapse was
shown to be a combined function of both pubovisceral muscle and uterosacral and/or cardinal
ligament (“apical supports”) impairment. Once a certain degree of pubovisceral impairment was
reached, the genital hiatus opened and a prolapse developed. The larger the pubovisceral impairment,
the larger the anterior wall prolapse became. A 90% impairment of apical support led to an increase
in anterior wall prolapse from 0.3 cm to 1.9 cm (a 530% increase) at 60% pubovisceral muscle
impairment, and from 0.7 cm to 2.4 cm (a 240% increase) at 80% pubovisceral muscle impairment.
Conclusions: These results suggest that a prolapse can develop as a result of impairment of the
muscular and apical supports of the anterior vaginal wall.

71
4.1 Introduction
Pelvic organ prolapse is a common disease that prevents women from enjoying a
full and active life. In the US, approximately 200,000 women (Boyles et al, 2003) have
surgery to repair prolapse annually with a cost to society that exceeds one billion dollars
per year (Subak et al, 2001). Anterior vaginal wall prolapse, clinically known as cystocele,
is the most common form of pelvic organ prolapse. (Hendrix et al, 2002)
At present, our understanding of anterior vaginal wall support mechanisms is
focused primarily on paravaginal attachments. (Richardson et al, 1976,DeLancey et al,
1992) Recently two additional observations have been made. First, levator ani muscle
damage is seen in women with prolapse (Tunn et al, 1998, Singh et al, 2003, Hoyte et al,
2001, Hoyte et al,2004). Second, anterior compartment prolapse is highly correlated (r =
0.73) with loss of apical support (Summers et al, 2006). How these observations help
explain anterior compartment failure has been unclear and is a goal of the present paper.
A common approach to analyze how a complex biological system works is to
represent the behavior of interest with a mathematical model. Such models yield can
useful mechanistic insights and even predict system responses with reasonable accuracy
(Alexander et al, 2003). One class of such models is the “lumped parameter” model in
which the relevant features of the biological system are divided into relatively few
subunits. Through simplifying assumptions, the overall properties of each subunit can
be approximated by an equation. Hence, the relationship between the tensile force and
length of the pubovisceral muscle can most simply be represented by a lumped parameter
representing the development of active contractile force and another representing the
passive resistance of the muscle to stretch. Overall system behavior is then predicted by
assembling and solving the system of equations that represent the various subunits and
how they physically interact with one another.
The aim of this study, therefore, was to develop and test a first-generation model
to investigate how changes in pelvic floor muscle support and apical connective tissue
72
support interact to affect anterior vaginal wall prolapse under conditions of raised
intra-abdominal pressure.
4.2 Methods
A sagittally-symmetric, lumped parameter, biomechanical model of the anterior
vaginal wall and its support system was developed based on our previous anatomical
work (DeLancey et al, 1992,DeLancey et al, 1994, DeLancey et al, 1999,DeLancey et al,
2002). As a first step, the dimensions and orientation of the anterior vaginal wall and
its support system were measured from mid-sagittal plane magnetic resonance scans of
10 healthy volunteers. This sample size was judged sufficient, based on the authors’
previous experience, to yield representative geometry. These women were recruited from
2001 to 2003 as controls in an case-control study, approved by University of Michigan
IRBMED, comparing findings in women with normal support to women with pelvic
organ prolapse. They denied having incontinence or prolapse symptoms and had
demonstrated normal support on POP-Q examination (Bump et al, 1996) (no vaginal wall
point lower than one centimeter above the hymen). These women had a mean age of
58.8 years (+ standard deviation of 12.2 years) and parity of 2.45 (+ 1.03). Axial,
sagittal and coronal magnetic resonance images of the pelvic floor region were taken at 5
mm intervals as previously described (Chou et al, 2001). The dimensions and orientation
of the anterior vaginal wall and levator plate were measured in the mid-sagittal plane at
rest. The mean length of the vaginal wall was 7.0 (± 1.0) cm, with a mean vaginal
inclination angle of 62.4 (± 7.8) o. The mean length of the levator plate was 10.4 ± 0.9 cm
with a mean levator inclination angle of 47.9 (± 4.8) o.
A 3-D model of the levator ani muscles, vagina, rectum, cardinal and uterosacral
ligaments (“apical supports”), pubic bone and sacrum was created from a representative
subject’s MR images using 3-D-Slicer version 2.1b1, as previously described (Chen et al
2005,Hsu et al, 2005). The attachments of the levator ani muscle to the pubic bone and
the lines-of-action of the apical supports were located based on 3-dimensional
reconstructions. A two-dimensional (2-D), sagittally-symmetric, lumped parameter,
biomechanical model was then created by projecting the 3-D geometry of anterior vagina

73
wall and its support system onto the mid-sagittal plane (Figure 4-1). The anterior vaginal
wall was modeled as a deformable and stretchable membrane lying on the rectum, which
was supported by the levator plate. The anterior vaginal wall was fixed at the perineal
membrane which was assumed to be stationary during Valsava. For simplicity, the
levator plate was modeled as a rigid “trapdoor” hinged on the sacrum (SAC). To isolate
the anterior vaginal wall effects, no relative motion was assumed to occur between the
rectum and the levator plate. The pubovisceral portion of the levator ani muscle (PVM)
was considered to control levator plate inclination with respect to the pelvis and was
modeled using both an active contractile element and a passive elastic spring element
(Fpvm =Factive+Fpassive)
Figure 4-1 Model Development. A: mid-sagittal MR image. B: modeled element traced or projected on mid-sagittal MR image. C: lumped parameter biomechanical model. Pubovisceral muscle ( PVM ) is modeled as a spring in parallel with an active force generator. PS: pubic symphysis; SAC: sacrum; PM: perineal membrane; LA plate: levator plate; R: rectum; V: vagina; CL: cardinal ligament spring; US: uterosacral ligament spring; B: bladder; UT: uterus. © Biomechanics Research Laboratory, University of Michigan, 2006

74
Apical support, provided to the vagina in Level I by the cardinal ligament and the
uterosacral ligament, was represented by two passive elastic springs (Figure 4-1) attached
to the top of the vaginal wall. An exponential relationship between force and elongation
for anterior vaginal wall membrane and all passive springs (including passive material
property of pubovisceral muscle and the apical supports) was assumed to present the
nonlinear (hyperelastic) material property of biological tissue, that is
)1(1)(2
0
0
−×=−
×lll
CeCF
where C1 and C2 are the material property parameters, l is the current length and l0 is the
initial length. The material property parameters of the vaginal wall were held constant
through these simulations to focus on the interaction of apical supports and levator
activity.
The vaginal wall, pubovisceral muscle and apical supports material properties
used were based on values from existing literature (Yamada et al 1970, Bartscht et al,
1988). Table 4-1 shows the dimension and material property of each model element.
Table 4-1: Dimension and material property of each element of the 2-D biomechanical model (* R is modeled as rigid spacer allowing no movement relative to the model levator ani plate. LA: levator ani; PVM: pubovisceral muscle)
Original
length (cm)
Original inclination (relative
to horizontal in degrees)
Equation representing material
properties
(F in Newton and l in cm)
Vaginal wall 7 62 )1(00.1)(6.5
0
0
−×=−
×lll
eF
LA plate (R*) 10 48 Rigid plate
PVM 9.4 152 )1(00.1)(7
0
0
−×=−
×lll
eF
Cardinal 7.6 81 )1(27.4)(61.0
0
0
−×=−
×lll
eF
Uterosacral 4.8 25 )1(27.4)(61.0
0
0
−×=−
×lll
eF

75
The model was implemented in MatlabR (The MathWorks Inc., Natick, MA). To
model a Valsalva maneuver, the model abdomen was pressurized with 70 cmH2O of
intra-abdominal pressure in order to represent a maximum Valsalva maneuver (Howard et
al, 2000). In a woman with normal support, clinical observations show that a maximum
Valsalva maneuver causes little displacement of the pelvic floor, if the pelvic floor
muscles are actively contracted so as to equilibrate the downward intra-abdominal
pressure acting on the levator plate (Shafik et al, 2003). Therefore, in our model we
assumed that the intact pubovisceral muscle can increase its contractile force sufficiently
above the baseline resting tone so as to maintain hiatus closure under increased
intra-abdominal pressure, as observed in women with normal support. Therefore, the
model anterior vaginal wall was considered to be completely supported by the rectum and
levator plate, without tension on the cardinal and uterosacral ligaments. The mean
maximum vaginal closure force was assumed to be 2.8 Newtons which is the average
value reported in the literature (Morgan et al, 2005, Morin et al, 2004) (Figure 4-2a).
Since the force exerted by the pubovisceral muscles holds the trap door or urogenital
hiatus closed, intra-abdominal pressure cannot induce inferior-superior tension in the
anterior vaginal wall because there is no pressure differential being generated.
To use the model to simulate the two mechanisms underlying prolapse, we modeled
the pubovisceral impairment (indicated by Defect%) by simulating loss of both the
pubovisceral muscle’s active contractile force (Factive) and also its passive spring constant
(derived its passive resistance to stretch in the uncontracted state), that is
))1(1(%)1()(2
' 0
0
activelll
C
pcm FeCDefectF +−××−=−
×
Impairment of the connective tissue apical support (indicated by Defect%) was modeled
as a decrease in their elastic properties, that is
)1(1%)1()(2
' 0
0
−××−=−
×lll
CeCDefectF

76
Model simulations were run with impairments of 0, 20, 40, 60, 80 % decrements
in the maximal force that the pubovisceral muscle could generate and 0, 50, 90%
increases in the elasticity of the apical support. Since we focused on the interaction
between pubovisceral muscle and apical supports, the material property of the vaginal
wall was held constant in all simulations. The primary outcome measure was the
change in anterior vaginal wall curvature showing anterior vaginal wall deformation, and
secondary outcome measures were the downward angular displacement of the levator
plate and the downward translation of the top of the anterior vaginal wall under the action
of 70 cmH2O intra-abdominal pressure. We used the descent of the most dependent
point of the vaginal wall as a measure of prolapse size, as shown in Figure 4-2b.
Figure 4-2. Force diagram showing the loading of the anterior vaginal wall and its support system. A: loading anterior vaginal wall with normal muscular support ; B: loaded pelvic floor with defective muscular support and part of vaginal wall exposed to intra-abdominal pressure (light grey arrows). IAP denotes intra-abdominal pressure; Fpvm: tensile force generated by pubovisceral muscle between the projection of its origin on the pelvic side wall and insertion on the levator plate; Tc and Tu: tensile forces generated by the cardinal and uterosacral ligaments; D: the decent of the most dependent point of vaginal wall from end of perineal membrane (PM) which is used as the measurement of prolapse size in the simulation. Note descent of the vaginal apex as well as vaginal wall protrusion. © Biomechanics Research Laboratory, University of Michigan, 2006

77
4.3 Results
General model behavior under load is shown in Figure 2b. When the system
with impaired muscle and connective tissue was loaded with maximum intra-abdominal
pressure (Valsalva), downward rotation of the levator plate occurred when the defective
pubovisceral muscle could no longer generate sufficient force to counterbalance the
abdominal pressure increase. In this situation, the model trap-door begins to ‘open’ such
that the lower part of the anterior vaginal wall is no longer supported by the levator ani
plate. The unsupported distal region of vaginal wall becomes the tensile structure that
separates a higher intra-abdominal pressure zone and a lower atmospheric pressure zone.
This pressure differential causes the downward ‘bulging’ (deformation) of the distal
anterior vaginal wall in the areas not supported by the levator ani muscle. This, in turn,
induces a superior-inferior tension force in the upper anterior vaginal wall. The apical
supports are now placed under tension as they resist the downward movement of the
upper vaginal wall until a new mechanical equilibrium is achieved in the system.
The specific simulation results with different combinations of pubovisceral and
apical support impairment are shown in Figure 4-3. Here, the degree of anterior vaginal
wall descent is shown as the distance below the perineal membrane, which lies at the
level of the hymenal ring. For the results in the top row (Figure 4-3 a, b, and c), the
apical supports had the normal material parameter constants. The bottom row shows the
results with 90% apical support impairment. In the first column (Figure 4-3 a and d),
the pubovisceral muscle has normal active contractile function and normal passive
material properties, while the second and third columns show the effects of increasing
pubovisceral muscle impairment by 60% and 90%, respectively.
When the pubovisceral muscle has normal properties (Figure 4-3a), no anterior
wall deformation is seen. With pubovisceral impairment (Figure 4-3b & c), some degree
of anterior vaginal prolapse occurs. With normal muscles, but impaired apical support
(Figure 4-3d), no displacement occurs because the vaginal wall is not subjected to a
pressure differential.
78
The interaction between pubovisceral muscle defect and apical support
impairment is shown in the bottom row (Figure 4-3e and f). When the apical support
impairment was superimposed on the pubovisceral muscle impairment there was a loss of
resistance to the descent of apical anterior vaginal wall, resulting in a much larger
prolapse. The prolapse size, D, defined as the largest descent of the most independent
point, is also shown in Figure 4-3. A 90% impairment of apical support led to an increase
in anterior wall prolapse from 0.3 cm to 1.9 cm (a 530% increase) at 60% pubovisceral
muscle impairment (Figure 4-3c vs. 3f), and from 0.7 cm to 2.4 cm (a 240% increase) at
80% pubovisceral muscle impairment (Figure 4-3b vs. 3e).
Figure 4-3. Simulated deformation of the model anterior vaginal wall, and its support system, under maximal Valsalva with various degrees of pubovisceral muscle (PVM) and cardinal and uterosacral ligament impairment (indicated in percent). D presents the size of prolapse measured as the decent of the most dependent point of vaginal wall from end of perineal membrane. © Biomechanics Research Laboratory, University of Michigan, 2006
The prolapse size is shown as a function of apical support impairment for
different degree of pubovisceral impairment in Figure 4-4. The size of the prolapse
79
increased exponentially with increasing apical support impairment.
To verify that the simulation results were reasonable approximations of the
interactions between connective tissue and muscular support of vaginal wall, these
findings were compared to a typical magnetic resonance image of a patient with cystocele
in both the resting state as well as under a maximum Valsalva (Figure 4-5). In the
resting state, the patient has a relatively normal configuration. But with increasing
intra-abdominal pressure associated with a Valsalva maneuver, the levator plate is pushed
posteriorly and downwards to a more vertical orientation, the anterior vaginal wall is
pushed inferiorly via the hiatus, while the uterus is pulled down by anterior vaginal wall.
This scenario matches well with our model simulation thereby helping to validate the
behavior of our model.
Figure 4-4: Prolapse size measured by the most dependent point on the vaginal wall as a function of apical support impairment for different degrees of pubovisceral muscle (PVM) impairment. © Biomechanics Research Laboratory, University of Michigan, 2006
4.4 Discussion
This paper presents the development of a simple 2-D model that was used to
investigate how anterior vaginal wall muscular and connective tissue supports affect the
size of anterior vaginal wall prolapse. The model is suitable for examining first-order
effects of the interaction between these supportive elements in the presence of
impairments in the pubovisceral muscle and apical support tissues. The model is

80
focused on anterior vaginal wall prolapse because it is the most common form of pelvic
organ prolapse (Hendrix et al, 2002) and a form that can be used to initiate meaningful
investigation into muscle/connective tissue interaction. We chose to focus on the apical
connective tissue supports as a result of recent data (Summers et al, 2006) showing a
strong correlation between apical descent and anterior compartment prolapse, recognizing
that further work will be needed to add other elements of the support system. This
model shows important qualitative results on how a combination of muscular and
connective tissue impairments affects prolapse magnitude. The resulting anterior wall
prolapses also mimic those seen clinically, thereby providing validity for our model.
Figure 4-5. Validation of the model. A: mid-sagittal MR image of resting status; B: mid-sagittal MR image at maximum Valsava; C: sample model simulation result having a similar configuration as in (b). In this figure PS denotes pubic symphysis; SAC: sacrum; PM: perineal membrane; PVM: pubovisceral muscle; LA plate: levator plate; R: rectum; V: vagina; CL: cardinal ligament; US: uterosacral ligament; B: bladder; and UT: uterus © Biomechanics Research Laboratory, University of Michigan, 2006

81
The clinical significance of this article lies in its demonstration of the interaction
between apical connective tissue support and the levator ani muscle impairments that
result in anterior vaginal wall prolapse. This links research showing that the levator
muscles are abnormal in women with pelvic organ prolapse (Tunn et al,1998, Singh et al,
2003, Hoyte et al, 2001, Hoyte et al, 2004) with observations of connective tissue
abnormalities in pelvic organ prolapse (Richardson et al, 1976,DeLancey et al, 2002,
Jackson et al, 1996). Our simulations also suggest that to some degree normal muscle
and normal connective tissue function can compensate for injury to the other system. It
is when both systems have impairments that the larger anterior vaginal wall prolapse is
predicted. This can partly explain why women with levator ani muscle defect are more
likely to have prolapse (Hoyte et al, 2004), but not all women with levator ani muscle
defects have developed anterior vaginal wall prolapse.
When the intact pubovisceral muscle maintains urogenital hiatus closure, there is
no tension in the vaginal wall because it is well supported inside the abdominal cavity by
the levator plate and therefore no pressure differential acts across it. This assumption is
based on clinical observations in nulliparous women that reveal minimal descent of the
pelvic floor during Valsalva when the muscles are contracted. When the pubovisceral
muscle is defective and its contractile force is reduced, then the model predicted that less
hiatal closure force is generated, which agrees with clinical measurements showing a
30% reduction in force among women with stress incontinence (Morin et al, 2004). At
a certain level of pubovisceral defect, the muscles are no longer able to maintain hiatal
closure, and the distal vagina is now exposed to a pressure differential as it is interposed
between the high abdominal pressure zone and lower atmospheric pressure. This
pressure differential deforms the vaginal wall, driving it inferiorly towards the low
pressure region. The behavior of our model extends previous theoretical work of the
concept of the “pelvic valve” (Porges et al, 1960).

82
It is important to recognize that there are inherent limitations in this type of
research. In this first simulation we chose to focus the analysis on the anterior vaginal
wall and have made some simplifying assumptions. For example, it was assumed there
is no deformation of levator plate or rectal movement relative to the levator plate.
Second, this model is focused on the interaction between muscular support and apical
suspension on anterior vaginal wall support. In this two-dimensional model, the
paravaginal supports of the anterior vaginal wall that attach laterally to the pelvic
sidewall were not specifically modeled because this requires a more complex,
3-dimensional, approach. From a structural mechanics point of view, paravaginal
support adds a reinforcing element to the mid-portion of the vaginal wall which will
reduce its descent through the hiatus. In our model, we found that we needed to adjust
the property of the vaginal wall tissue to be ten times stiffer than published experimental
results in order to obtain reasonable model results. This need may reflect the lack of
paravaginal support. Also, stretch is not necessarily uniform along each element of the
model as assumed; it can vary locally along and across the elements, especially if the
thickness varies. The effect of non-uniform stretch in these structures requires further
investigation, particularly if systematic regional variations in properties are found.
Finally, the elements in the model were assumed to have hyperelastic material properties,
with increasing resistance to stretch as is indeed found in many collagenous structures,
but it is a limitation that no time dependent behavior was represented. Despite these
simplifications, we believe this simple model captures the qualitative behavior of the
system and yields useful predictions. In the future, distributed parameter models, such
as finite element models, may prove to be more accurate and better for the
three-dimensional analyses that are needed.
This is a first attempt to use biomechanical modeling to study the mechanics of
pelvic organ support. The model offers an opportunity to analyze fundamental concepts
related to how injury of levator ani muscle and impairment of connective tissue can lead
to anterior vaginal wall prolapse.

83
References
Alexander RM. Modelling approaches in biomechanics. Phil Trans Roy Soc Lond B
Biol Sci. 2003; 358(1437):1429-35.
Bartscht KD, Delancey JOL. A technique to study the passive supports of the uterus.
Obstet Gynecol. 1988 Dec;72(6):940-3
Boyles SH, Weber AM, Meyn L. Procedures for pelvic organ prolapse in the United
States, 1979-1997, Am J Obstet Gynecol 2003;188:108-15
Bartscht KD, Delancey JOL. A technique to study the passive supports of the uterus.
Obstet Gynecol. 1988 Dec;72(6):940-3
Bump RC, Mattiasson A, Bo K, Brubaker LP, DeLancey JO, Klarskov P, Shull BL,
Smith AR. The standardization of terminology of female pelvic organ prolapse and
pelvic floor dysfunction. Am J Obstet Gynecol. 1996; 175(1):10-7.
Chen L, Hsu Y, Ashton-Miller JA, Delancey JO. Measurement of the pubic portion of
the levator ani muscle in women with unilateral defects in 3-D models from MR
images. Int J Gynaecol Obstet. 2006 92:234–41
Chou Q. DeLancey JO. A structured system to evaluate urethral support anatomy in
magnetic resonance images. Am J ObstetGynecol 2001; 185(1):44-50
DeLancey JOL. Anatomic aspects of vaginal eversion after hysterectomy. Am J
Obstet Gynecol 1992;166:1717-1728.
DeLancey JOL. Structural support of the urethra as it relates to stress urinary
incontinence: The hammock hypothesis. Am J Obstet Gynecol
1994;170:1713-1720.

84
DeLancey JOL. Structural anatomy of the posterior pelvic compartment as it relates
to rectocele. Am J Obstet Gynecol 1999;180:815-23.
DeLancey JOL. Fascial and muscular abnormalities in women with urethral
hypermobility and anterior vaginal wall prolapse. Am J Obstet Gynecol,
2002;187:93-8.
Hendrix SL, Clark A, Nygaard I, Aragaki A, Barnabei V, McTiernan A. Pelvic organ
prolapse in the Women's Health Initiative: gravity and gravidity. Am J Obstet
Gynecol. 2002 Jun;186(6):1160-6.
Howard D, Miller JM, DeLancey JOL, Ashton-Miller JA. Differential Effects of
Cough, Valsalva, and Continence Status on Vesical Neck Movement. Obstet Gyenecol
2000; 95: 535-540.
Hoyte L, Schierlitz L, Zou K, Flesh G, Fielding JR. Two- and 3-dimensional MRI
comparison of levator ani structure, volume, and integrity in women with stress
incontinence and prolapse. Am J Obstet Gynecol. 2001 Jul;185(1):11-9.
Hoyte L, Jakab M, Warfield SK, Shott S, Flesh G, Fielding JR. Levator ani thickness
variations in symptomatic and asymptomatic women using magnetic resonance-based
3-dimensional color mapping. Am J Obstet Gynecol. 2004 Sep;191(3):856-61.
Hsu Y, Chen L, Delancey JO, Ashton-Miller JA. Vaginal thickness, cross-sectional
area, and perimeter in women with and those without prolapse. Obstet Gynecol.
2005;105:1012-7.
Jackson SR, Avery NC, Tarlton JF, Eckford SD, Abrams P, Bailey AJ. Changes in
metabolism of collagen in genitourinary prolapse. Lancet 1996;347:1658-61.
85
Morgan DM, Kaur G, Hsu Y, Fenner DE, Guire K, Miller J, Ashton-Miller JA,
Delancey JO, Does vaginal closure force differ in the supine and standing positions?
Am J Obstet Gynecol. 2005 May;192(5):1722-8.
Morin M, Bourbonnais D, Gravel D, Dumoulin C, Lemieux MC. Pelvic floor muscle
function in continent and stress urinary incontinent women using dynamometric
measurements. Neurourol Urodyn. 2004;23(7):668-74.
Porges R, Porges J, Blinick G. Mechanisms of Uterine Support and the Pathogenesis
of Uterine Prolapse. Obstetrics and Gynecology 1960 Jun; 15(6):711-726
Richardson AC, Lyon JB, Williams NL. A new look at pelvic relaxation. Am J Obstet
Gynecol. 1976 Nov 1;126(5):568-73
Shafik A, Doss S, Asaad S. Etiology of the resting myoelectric activity of the
levator ani muscle: physioanatomic study with a new theory. World J Surg. 2003
Mar;27(3):309-14.
Singh K, Jakab M, Reid WM, Berger LA, Hoyte L. Three-dimensional magnetic
resonance imaging assessment of levator ani morphologic features in different grades
of prolapse. Am J Obstet Gynecol. 2003; 188(4):910-5.
Subak LL, Waetjen LE, van den Eden S, Thom DH, Vittinghoff E, Brown JS, Cost
of pelvic organ prolapse surgery in the United States. Obstet Gynecol 2002;
98:646-51
Summers A, Winkel LA, Hussain H, DeLancey JOL. The Relationship between
Anterior and Apical Compartment Support. Am J Obstet Gynecol 2006,
194:1438–43
Tunn R, Paris S, Fischer W, Hamm B, Kuchinke J. Static magnetic resonance imaging

86
of the pelvic floor muscle morphology in women with stress urinary incontinence and
pelvic prolapse. Neurourol Urodyn. 1998;17(6):579-89.
Yamada H. Strength of Biological Materials. Waverly Press, INC. Baltimore,
Maryland, 21202, USA. 1970. p. 205-270

87
Chapter 5
Development of a 3-D Finite Element Model of Anterior
Vaginal Wall Support to Evaluate Mechanisms Underlying
Cystocele Formation
ABSTRACT
Objectives: To use biomechanical computer modeling to study the complex structural mechanics of
anterior wall support. The first aim was to develop a 3D computer model of the anterior vaginal wall
and its supports. The second aim was to validate it and then use it to determine which combinations
of muscle and connective tissue defects could result in formation of a cystocele similar to those
observed on dynamic magnetic resonance imaging (MRI).
Methods: A subject-specific 3D model was developed based on MRI scans from a healthy nulliparous
woman using 3D Slicer (v. 2.6). An engineering graphics program, I-DEASTM, was then used to
simplify model geometry and include: 1) anterior vaginal wall, 2) levator muscle, 3) cardinal ligament,
4) uterosacral ligament, 5) arcus tendineus fascia pelvis, 6) arcus tendineus levator ani, 7) paravaginal
attachments, and 8) the posterior compartment. The 3D model was then imported into ABAQUSTM, a
finite element analysis program. Tissue properties were assigned from literature values. The effect of
different combinations of connective tissue and muscle impairments on cystocele formation were
studied as abdominal pressure was increased from rest to a maximum of 168 cmH2O. An iterative
process was used to refine anatomical assumptions until convergence was obtained between model
behavior and deformations observed on dynamic MRI.
Results: The resulting 3D finite element model predicted realistic cystocele formation in the presence
of impairment in levator ani muscle apical and/or mesenteric connective tissue, including apical and
paravaginal support. Simulated cystocele size was sensitive to both the magnitude of abdominal
pressure and the degree of impairment assigned to the connective tissue and muscle. Simulated
cystocele morphology was similar to that observed on dynamic MRI. Larger cystocele formed in the

88
presence of both muscular and mesenteric connective tissue support impairment compare to
impairment in either support element alone. Apical
impairment resulted in a larger cystocele compared to paravaginal impairment given the same
intra-abdominal pressure loading and levator ani muscle impairment. The results suggest that the
levator ani muscle is the key element; impairment in levator ani muscle caused larger hiatus size,
longer exposed vaginal length, larger apical descent and resulted in a larger cystocele size.
Conclusions: This 3D finite element model simulated the formation of a cystocele as seen on dynamic
MRI. Presence of a cystocele required a levator muscle impairment, an increase in abdominal
pressure, and apical and paravaginal support defects.
5.1 Introduction
The anterior vaginal wall prolapse, clinically known as cystocele, is the most common
form of pelvic organ prolapse (Hendrix et al., 2002). It is also the site with the highest
rate of persistent and recurrent support defects (Shull et al., 2000).
A growing number of studies have sought to improve our understanding of normal
anterior vaginal support mechanisms as well as how these supports ordinarily prevent
cystocele. Early studies were focused primarily on the anatomy of paravaginal
attachments and their failure (Richardson, 1976, DeLancey et al., 1992, 2002).
Subsequent investigations have revealed levator ani muscle damage in women with
anterior vaginal wall prolapse specifically (DeLancey et al., 2002) and prolapse in
general (Tunn et al., 1998, Singh et al., 2003, Hoyte et al., 2001,2004, DeLancey et al.,
2002). Recently dynamic MRI studies have revealed that anterior compartment prolapse
is also highly correlated (r=0.73) with loss of apical support (Summers et al., 2006).
Each of these observations concerns a particular aspect of anterior vaginal wall support

89
and failure. To begin to integrate these observations into a single disease model,we
developed a first generation, 2D lumped parameter model (Chapter 4 and Chen et al.,
2006). This model simulated realistic anterior vaginal wall deformation in mid-sagittal
plane and provided an important insight on the interaction between muscular support to
the anterior vaginal wall provided by the levator ani and apical connective tissue support
provided by the cardinal and uterosacral ligaments. However this 2D mid-sagittal model
had inherent limitations, most notably that the model did not include the paravaginal
attachments to the pelvic side wall, as well as the effects of geometries of these bilateral
attachments. Furthermore, the levator plate and rectum were modeled as rigid body.
To address those limitations, in this chapter we develop a more complex 3D finite
element model to investigate how different effects, such as muscular support, apical
defect, paravaginal defect and vaginal dead band effect, affect cystocele formation.
5.2 Methods
The first step was to select MR scans as a part of an institutional review board-approved
study of nulliparous pelvic anatomy. The subject happened to be a 34-year-old
nulliparous Caucasian woman. Axial, sagittal and coronal photon density magnetic
resonance images of the pelvic floor region were taken at 5-mm intervals, as previously
described (Strohbehn et al., 1996). The geometry of the woman’s bony pelvic floor
attachment points lay within one standard deviation of the mean size and shape of a
group of 278 women: this included a 75th percentile sagittal diameter (measured from the
midline of the arcuate pubic ligament to the center of the sacrococcygeal junction) and a
44th percentile lateral diameter (ischial spine separation distance) (Lien et al., 2003)
A 3-D volumetric model was rendered by lofting serial 4 mm-thick axial magnetic
resonance sections to establish the geometry of the anterior vaginal wall and surrounding
support tissues using 3D Slicer 2.1b1 (Slicer 2b1; Massachusetts Institute of Technology,
Cambridge, MA), as described by Hsu et al., 2005 & Chen et al., 2006. The geometric
model included the following anatomic structures:1) anterior vaginal wall (AVW), 2)
levator muscles (LA), 3) cardinal ligaments (CL), 4) uterosacral ligaments (US), 5) arcus
90
tendineus fascia pelvis (ATFP), 6) arcus tendineus levator ani (ATLA), 7) paravaginal
support (PS), and 8) the posterior compartment (PC) as shown in Figures 1A and B.
The volumetric model was imported into I-DEAS (Version 9.0, EDS, Hook, UK), an
engineering modeling software program, and the model geometry was simplified,
principally by smoothing the surfaces of the structures (Figure 5-1C). The simplified
model was then imported into ABAQUS (Version 6.6-1 ABAQUS, Inc), an engineering
finite element modeling program that allows one to create the finite element mesh that is
used to represent the anterior vaginal wall, levator ani muscles and posterior
compartment, and then to predict how the structures will deform under increases in
abdominal pressure. The program also predicts the resulting distributions in tissue
stresses and strains (Figure 1D). The anterior vaginal wall and levator ani muscles were
modeled in the program as deformable shell elements. The posterior compartment
including posterior vaginal wall and rectum were modeled as a deformable solid. Lastly,
the elements used to represent the ligamentous connections (CL, US, PS, ATFP, ATLA)
to the vaginal wall were 2D truss elements.
The soft tissue attachments to pelvis and stationary structures (known as “boundary
conditions”) are shown in Figure 1D. The origin of levator ani muscle from the pubic
bone and ATLA, and the points of attachments of the ligaments to the pelvic sidewall,
and distal end of the vagina were each assumed to allow rotational, but not translational,
movements.
All the model elements were assigned hyperelastic material properties based on values
from existing literature (Yamada et al., 1970, Bartscht et al., 1988) ( Figure 5-2).
Because this model was only used to simulate cystocele development during straining,
when patients were asked to increase abdominal pressure with their pelvic muscles
relaxed, the levator ani muscles were only considered to exhibit passive stretch and
therefore passive stiffness, without active contractile behavior.
An iterative process was used to refine anatomical assumption based on senior author’s

91
extensive dissection, clinical examination and surgical experience and dynamic MR
imaging observation (DeLancey et al., 1994, 2002, Summers et al., 2006). The
deformation behavior of the model under increasing abdominal pressure was then
examined and compared to that observed on dynamic MRI during Valsalva (Summers et
al., 2006). When the model behavior did not match with observed behavior, then iterative
changes were made to anatomical connections, boundary conditions, material properties,
and/or element type within the constraints of existing knowledge until the model behaved
in a reasonable manner (Figure 5-1C, D).
To simulate cystocele formation, we set model parameters to simulate impairments in the
various supportive components (i.e., CL, US, PS and PCM). An impairment was
simulated as an decrease in material property stiffness in ligaments, a strategy used
previously by Chen, et al (Chen et al., 2006). To simulate a impairment in levator ani
muscle, their stiffness was considered to be decreased by 60% from normal values,
consistent with the 60% decrease in maximum muscle strength observed in women with
prolapse and muscle impairment compared to those who have normal support and intact
muscle in the OPAL study (DeLancey et al., 2007). This assumption was made because
Blanpied et al. (Blanpied et al., 1993) showed a linear relationship between the
contractile force in a muscle and its tensile stiffness. Tissue adaptation is another
important factor. When a structure undergoes sustained stress over time, it can generate
either additional tissue and/or better quality tissue in order to reduce tissue stress.
Clinically we found that women with prolapse have a larger vaginal cross-sectional area
(Hsu et al., 2005). Loaded tissues can also change their properties over time, as in the
case of hysteresis and creep. To begin to simulate the effect of these types of changes
we simply shifted the stress and strain curve for vaginal properties incrementally to the
right, as shown in Figure 5-3, and re-executed the simulations.

92
P
R
U
V
CU
ATP
PC
IC
ATP
CL
U
IC
PC
AVW
PC
PS
IA
B
Figure 5-1 Model development. A: 3D volume rendered model of anterior support system including pubic bone;B: 3D volume-rendered model without pubic bone; C: Geometry simplified surface model; D: 3D finite element model with mesh, boundary condition (orange pin representing ligaments and muscle origin is pinned to pubic bone and pelvic sidewall), and abdominal pressure loading. PB: pubic bone; UT: uterus; V: vagina;R: rectum; CL: cardinal ligament; US: uterosacral ligament; ATFP: arcus tendineus fascia pelvis; ICM: iliococcygeus muscle; PCM: pubococcygeus muscle; AVW: anterior vaginal wall; PC: posterior compartment; PS: paravaginal support; IAP: abdominal pressure

93
Material Property
0
0.1
0.2
0.3
0.4
0.5
0.6
0.7
0 0.2 0.4 0.6 0.8 1
Strain (%)
Stress (106 Pa)
Vagina
Ligaments
LA
Figure 5-2 The material property of vagina, ligaments and levator ani muscle used in the model simulation,
Figure 5-3 Vaginal wall tissue material properties at different stage of tissue adaptation. The curve on the left most (status 0) is the original data from Yamada (Yamada, 1976) which is assigned as status 0. Status 3, vaginal tissue has the longest dead band.
0
0.1
0.2
0.3
0.4
0.5
0.6
0.7
0 0.2 0.4 0.6 0.8 1 1.2 1.4
Strain
Stre
ss (1
06 Pa
)
0
1
2
3

94
Simulations of the effects of abdominal pressure on model structures were handled in the
following manner. The abdominal pressure was considered to act perpendicular to the
surface of the anterior vaginal wall. In a previous study of 314 patients with prolapse,
the 5th percentile, 50th and 95th percentile values of maximum Valsalva pressure were
determined to be 60, 99 and 168 cmH2O respectively (DeLancey et al., 2007).
Therefore, the increase in abdominal pressure was simulated with the 20 increments of
the pressure time relationship shown in Figure 5-6 .
The outcome measurements from the model include the descent of the most
dependent point of the anterior vagina wall (d), apex descent (a) and hiatus size (h) as
well as exposed vaginal length at the maximum intra-abdominal pressure (Figure 5-4).
The maximum stress in the levator ani muscle and vaginal wall were also calculated.
The model was validated by comparing the mid-sagittal anterior vaginal wall
deformation under increasing abdominal pressure with that in the dynamic MRI of a
patient with Stage III cystocele performing the same maneuver, Figure 5-5. Under
current assumptions underlying the model’s functional anatomy, it not only correctly
predicted cystocele formation, but also correctly predicted the increase in size that occurs
with straining on midline dynamic MRI.
5.3 Results
When the intact model (without defects in the levator ani muscle, apical and
paravaginal support) was loaded with up to 100 cmH2O (50th percentile), a slight
cystocele occurred (Figure 5-6 A). This can be compared with a more typical simulated
cystocele formation (Figure 5-6B), in which cardinal, uterosacral ligament, and
paravaginal support was set to 50% impairment and the PCM was set to have a 60%
impairment. The sequential development of this cystocele with increasing abdominal
pressure is shown in Figure 5-7. Figure 5-8 shows the relationship between simulated
cystocele size and intra-abdominal pressure for this simulation. The best fit line for the

95
non-zero cystocele size data points was estimated. The compliance of anterior support
system was estimated to be 0.49 mm/cmH2O from the slope of the line.
Figure 5-4 Outcome measurements. The illustration is the model configuration at maximum abdominal pressure and shows the four outcome measurements: a: apical descent, middle of vagina apex displacement from its position at rest; h: hiatus size at maximum loading, measured as tip of posterior vaginal compartment to distal end of vaginal wall (fixed); d: Prolapse size, measured as the vertical descent of the most dependent point of the vagina to distal end of vagina; Exposed Vaginal Length measured as the length of vaginal wall unsupported by the posterior vaginal compartment (and therefore exposed to the pressure differential with intra-abdominal pressure acting on the proximal surface and atmospheric pressure acting on its distal surface).

96
Figure 5-5. Model validation. At left side is one model-generated simulation result with a similar cystocele formation to that seen clinically in the dynamic MRI on right side of the figure.
Figure 5-6 Lateral view of a mid-sagittal plane section of the 3D finite element model. Panel A: In this simulation, all support elements (levator ani muscle, cardinal uterosacral ligament, paravaginal support) have normal material properties. Panel B: In this simulation, the levator ani muscle was set to have a 60% reduction in its properties, and a 50% reduction in cardinal and uterosacral ligament and paravaginal support properties. LA denotes levator ani, CL: cardinal ligament, AVW: arterial vaginal wall, PC: posterior compartment, US: uterosacral ligament
A B
LA
AVW
PC
CL US

97
The size of the cystocele was found to vary depending on the maximal abdominal
pressure applied to the model (Figure 5-9). Cystocele size is sensitive to structure
impairments. At a 168cmH20 maximum intra-abdominal pressure, a levator ani muscle
impairment alone resulted in slightly larger cystocele than a mesenteric connective tissue
impairment alone. The model with the combined impairment had the largest simulated
cystocele size, as hypothesized.
Figure 5-7. Sequential development of a typical simulated cystocele. In this simulation, the levator ani muscle had a 60% impairment, apical and paravaginal support properties were set to having a 50% impairment,,. The abdominal pressure was then increased from zero to 100 cmH2O over time course (plotted on the vertical axis of the bottom illustration) at four different time points (seen on the horizontal axis of the bottom plot). The first row shows the three-quarter view, while the second row shows a sagittal section. The color map shows the stress distributions in the different regions, with red indicating a low stress region and blue indicating a high stress region.
Figure 5-10 shows the effect of levator ani muscle impairment alone on the cystocele
formation. The models with normal mesenteric connective tissue support and varying
degree of impairments in the pubic portion of the LA were loaded with 168 cmH2O
intra-abdominal pressure. With increasing muscle impairment, there is a systematically
increase in hiatus size, which allows a longer length of the vaginal wall to be exposed to a
pressure differential (high intra-abdominal pressure on the “upper” side and (low)

98
atmosphere pressure on the “lower” side). A larger stress builds up in the vaginal wall
and caused a larger apical descent (Figure 5-10). A larger cystocele size then results.
Investigations into effects of apical or paravaginal impairment to cystocele formation are
shown in Figure 5-11. Predominant apical impairment (varying apical impairment at 0%,
20%, 40%, 60%, 80% but with normal paravaginal support), predominant paravaginal
impairment (varying paravaginal impairment at 0%, 20%, 40%, 60%, 80% but with
normal apical support) are shown for 168 cmH2O maximal abdominal pressures and 60%
levator ani muscle impairment. All cystocele sizes were normalized to cystocele size at
normal apical and normal paravaginal support. The cystocele size was sensitive to the
degree of apical impairment with 20% remaining apical support stiffness; the cystocele
size increased 33% compared to the scenario with normal apical support. However there
was only a slight change in cystocele size with increasing degrees of paravaginal
impairment.
y = 0.4891x - 38.972R2 = 0.9022
0
2
4
6
8
10
12
14
0 20 40 60 80 100 120
Intra-abdominal Pressure (cmH2O)
Cys
toce
le S
ize,
d (m
m)
Figure 5-8 Relationship between cystocele size and intra-abdominal pressure in a simulated cystocele. In this simulation, the levator ani muscle had a 60% impairment, apical and paravaginal support were set to having a 50% impairment. The best fit line for non-zero cystocele size data points is plotted. The linear regression equation and coefficient of determination are shown in the illustration.
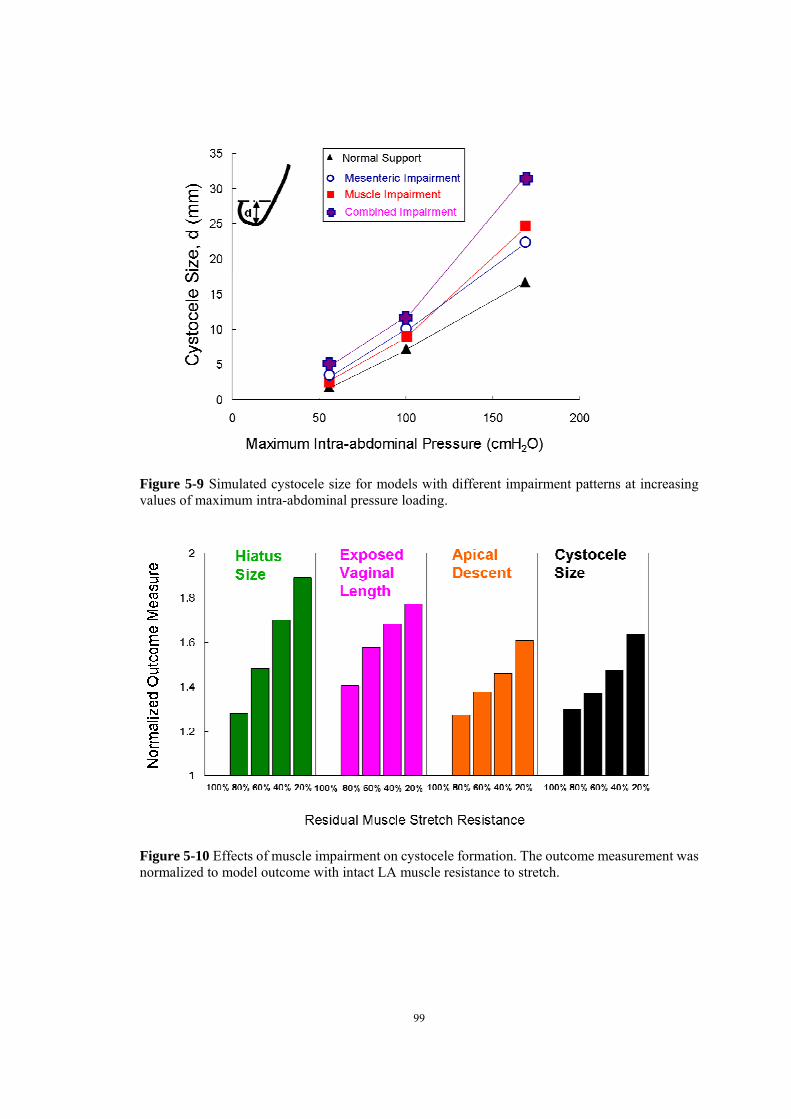
99
Figure 5-9 Simulated cystocele size for models with different impairment patterns at increasing values of maximum intra-abdominal pressure loading.
Figure 5-10 Effects of muscle impairment on cystocele formation. The outcome measurement was normalized to model outcome with intact LA muscle resistance to stretch.

100
0
0.2
0.4
0.6
0.8
1
1.2
1.4
100% 80% 60% 40% 20%
Remaining connective tissue stiffness
Nor
mal
ized
Cys
toce
le S
ize
Apical ImpairmentParavaginal Impairment
Figure 5-11 Effects of apical and paravaginal impairments on cystocele formation. Simulations had 60% levator ani muscle impairments and were loaded with 168cmH2O maximum intra-abdominal pressure. For apical impairment simulations, models had normal paravaginal support, but a varying degree of apical support impairment with remaining apical connective tissue stiffness ranging from from 20% to 100% of the normal value. For paravaginal impairment simulations, models had normal apical support but varying degree of paravaginal support impairment with remaining paravaginal connective tissue stiffness ranging from 20% to 100% of normal values.
Simulated cystocele sizes were also sensitive to the vaginal tissue properties (Figure
5-12). A longer dead band resulted in a larger cystocele size. The relationship between
cystocele size and vaginal tissue dead band status exhibited a non-linear (exponential)
relationship, especially for models with combined defects.

101
Figure 5-12 Relationship between vaginal tissue status and cystocele size. Vaginal tissue dead band status 0, 1, 2, 3 were as shown in figure 5-3.
5.4 Discussion
The significance of this study lays in its being the first 3D simulation of cystocele
formation. The model has realistic anatomical geometry from a living normal woman
with both connective tissue and muscular supports. It reproduces realistic cystocele
similar to those seen clinically, under physiological abdominal pressure loading (Figure
5-5). Also the estimated anterior compartment compliance from model simulation was
about 0.49 mm/cmH2O which is close to that measured in living women with prolapsed
(Chapter 6). By varying one parameter at a time, this validated finite element model
allows theoretical “what-if” analyses to be performed on the effect of specific parameter
variations on model behavior in a way that is impossible in living women.
The simulated cystocele size was found to be sensitive to maximum intra-abdominal
pressure, the presence of impaired structures (levator ani muscle, apical connective tissue,
paravaginal connective tissue, vaginal wall) and single vs multiple site impairments. The
finding that impairments in multiple domains (muscle impairment and mesenteric

102
connective tissue impairment, including both apical and paravaginal) result in larger
cystocele is similar to the result we found in the first generation model (Chapter 4, Chen
et al., 2006) where we noted that when both muscle and connective tissue impairments
were implemented in the model, larger cystoceles resulted than when only one or the
other impairment was present.
The model suggests that levator ani muscle impairment played a very important role
in cystocele formation. A decreasing in LA muscle resistance to stretch caused a larger
hiatus size, and allowed a longer length of vaginal wall to be exposed to the pressure
differential between high intra-abdominal pressure and low atmosphere pressure. This
caused tension to build up in the vaginal wall tissue, dragged the apex down and thereby
resulted in larger cystocele size.
The apex of vaginal wall was supported by apical connective tissue, including
cardinal and uterosacral ligament. Impairment in apical support is another important
factor of cystocele formation. An 80% impairment in apical support can result in a 33%
larger cystocele size than that with normal apical support. This agrees with our earlier
clinical findings that variation in apical support explained 60% of variation in prolapse
size in a group women with a wide spectrum of pelvic floor support (Summer et al.,
2006).
Restoring normal anatomy and function are common goals of reconstructive surgery.
At present, our ability to specifically determine the location and type of impairment
responsible for cystocele has been limited. By providing a specific analysis of regional
impairments in support the findings of this study can form the framework for new
imaging studies in women using ultrasound or magnetic resonance scans to make similar
observations in living women. It also provides the unique ability to experimentally
induce specific impairments and see what their effects are in ways that would not be
ethical in humans. This should help direct targeted investigations into anatomical
changes seen in women with cystourethrocele. Eventually, once we can determine the
exact nature of structural impairments, targeted operations customized for each patient

103
might be developed that maximize surgical success while minimizing compensating
distortion that can lead to postoperative problems with function.
It is important to recognize that there are still some inherent limitations in this model.
First, active contraction of levator ani muscle was not represented in this model. Even
though the subjects were asked to relax their LA muscles while performing Valsalva,
because the LA have a postural function they have a constant level of active muscle tone.
So the present model essentially the situation with a very low level of muscle activity in
this muscle. Second, this model still has simplified anatomic structures and geometry.
At the present time, there is no perineal body in the model, so the model constraint placed
at the distal end of vagina did not permit movement of the perineal body during Valsalva.
This might have tended to overconstrain the model and therefore resulted in a
conservative model prediction of cystocele size. Therefore the quantitative values of
tissue stresses predicted by the simulation are likely not accurate. However, the
qualitative behavior should be reasonable. The model simulations also showed that
cystocele size is not sensitive to paravaginal impairment, which might have resulted from
a poor understanding of paravaginal support anatomy and/or unrealistic model
assumption. The study of more detailed functional anatomy will provide more insights on
how to better model it in the future. Third, the model has simplified material properties in
that all elements were assumed to be hyperelastic. Any viscous, plastic or remodeling
changes in material properties that can occur over a longer period of time were not
considered in detail (except for the deadband simulation). In addition, the model was
loaded with a single loading cycle. To study how the loading rate and number of loading
cycles affect cystocele formation, more sophisticated visco-hyperelastic material
properties should be used. Finally, the model was set up based on our best
understanding of the essential nature of this highly complex anatomy. At present, we
have based our observations on the anatomy of an average woman with normal pelvic
floor support. How abnormal starting geometry and geometric variation in pelvic size
and shape among normal population would affect cystocele formation needs to be further
explored.
104
References
Bartscht KD, Delancey JO. A technique to study the passivesupports of the uterus. Obstet
Gynecol 1988;72:940–3.
Blanpied, P., Smidt, G.L.. The difference in stiffness of the active plantarflexors between
youngand elderly human females. J Gerontol 1993; 48, M58–M63.
Chen L, Hsu Y, Ashton-Miller JA, Delancey JOL. Measurement of the pubic portion of
the levator ani muscle in women with unilateral defects in 3-D models from MR images.
Int J Gynaecol Obstet 2006;92:234–41.
DeLancey JOL. Anatomic aspects of vaginal eversion after hysterectomy. Am J Obstet
Gynecol 1992;166:1717–24.
DeLancey JOL. Structural support of the urethra as it relates to stress urinary
incontinence: the hammock hypothesis, Am J Obstet Gynecol. 1994 Jun;170(6):1713-20.
Delancey JOL. Fascial and muscular abnormalities in women with urethral hypermobility
and anterior vaginal wall prolapse. Am J Obstet Gynecol. 2002 Jul;187(1):93-8.
DeLancey JOL, Morgan DM, Fenner DE, Kearney R, Guire K, Miller JM, Hussain H,
Umek W, Hsu Y, Ashton-Miller JA. Comparison of levator ani muscle defects and
function in women with and without pelvic organ prolapse. Obstet Gynecol. 2007
Feb;109:295-302.
Hendrix SL, Clark A, Nygaard I, Aragaki A, Barnabei V, McTiernan A. Pelvic organ
prolapse in the Women's Health Initiative: gravity and gravidity. Am J Obstet Gynecol
2002;186:1160–6.
Hsu Y, Chen L, Delancey JOL, Ashton-Miller JA. Vaginal thickness, cross-sectional area,

105
and perimeter in women with and those without prolapse. Obstet Gynecol
2005;105:1012–7.
Hoyte L, Schierlitz L, Zou K, Flesh G, Fielding JR. Two- and 3-dimensional MRI
comparison of levator ani structure, volume, and integrity in women with stress
incontinence and prolapse. Am J Obstet Gynecol 2001;185:11–9.
Hoyte L, Jakab M, Warfield SK, Shott S, Flesh G, Fielding JR. Levator ani thickness
variations in symptomatic and asymptomatic women using magnetic resonance-based
3-dimensional color mapping. Am J Obstet Gynecol 2004;191:856–61.
Hoyte L, Thomas J, Foster RT, Shott S, Jakab M, Weidner AC. Racial differences in
pelvic morphology among asymptomatic nulliparous women as seen on three-dimensional
magnetic resonance images. Am J Obstet Gynecol. 2005 Dec;193(6):2035-40.
Hsu Y, Summers A, Hussain HK, Guire KE, Delancey JOL. Levator plate angle in
women with pelvic organ prolapse compared to women with normal support using
dynamic MR imaging, Am J Obstet Gynecol. 2006 May;194(5):1427-33
Lien KC, Mooney B, DeLancey JOL, Ashton-Miller JA. Levator ani muscle stretch
induced by simulated vaginal birth. Obstet Gynecol. 2004 Jan;103(1):31-40
Richardson AC, Lyon JB, Williams NL. A new look at pelvic relaxation. Am J Obstet
Gynecol 1976;126:568–73.
Shull BL, Bachofen C, Coates KW, Kuehl TJ. A transvaginal approach to repair of apical
and other associated sites of pelvic organ prolapse with uterosacral ligaments Am J
Obstet Gynecol. 2000 Dec;183(6):1365-73.

106
Singh K, Jakab M, Reid WM, Berger LA, Hoyte L. Three-dimensional magnetic
resonance imaging assessment of levator ani morphologic features in different grades of
prolapse. Am J Obstet Gynecol 2003;188:910–5.
Strohbehn K, Ellis JH, Ashton-Miller JA, DeLancey JOL. Magnetic resonance imaging
of the levator ani with anatomic correlation. Obstet Gynecol 1996;87:277–85.
Summers A, Winkel LA, Hussain HK, DeLancey JOL. The Relationship between
Anterior and Apical Compartment Support. Am J Obstet Gynecol 2006;194:1438–43.
Tunn R, Paris S, Fischer W, Hamm B, Kuchinke J. Static magnetic resonance imaging of
the pelvic floor muscle morphology in women with stress urinary incontinence and pelvic
prolapse. Neurourol Urodyn 1998;17:579–89.
Yamada H. Strength of Biological Materials. Baltimore (MD): Williams & Wilkins; 1970.
p. 205–70

107
Chapter 6
In Vivo Assessment of Anterior Compartment Compliance and
Its Relation to Prolapse
ABSTRACT
Objective: We tested the null hypothesis that anterior compartment compliance does not differ
between women with and without prolapse and explored factors predicting variation in cystocele size.
Methods: Nineteen parous women with normal support (N=10) and varying degrees of anterior
compartment prolapse (N=9) were taken from an ongoing study [mean ± SD Age: controls = 62±10
yrs, cases = 53±12 (p=.101) Parity: controls = 3±2, cases = 3±1, (p=.565)]. A bladder catheter was
placed to measure abdominal pressure (Datascope®). Mid-sagittal pelvic MR images were obtained in
the supine position from rest to maximum Valsalva over a 20 second interval at approximately a 1 Hz
sampling rate. In each image, the distance from the most dependent bladder point to the average
bladder location in 20 nullipara was measured. The relationship between bladder descent and
abdominal pressure was examined for each subject using linear regression. The slope of the best-fit
line is a measure of the anterior compartment compliance. The hypothesis was tested using an
independent t-test. Multivariate analyses of the data from all subjects was also performed.
Results: Mean compliance was higher for cases (0.5 mm / cm H2O ± 0.06 SEM) than controls (0.3
mm / cm H2O ± .07, p=.039). Mean resting bladder point was lower in cases (2.4 ± 0.5 cm H20) than
controls (0.9±0.1 cm H2O, p= .024). Maximum bladder displacement correlated best with compliance
(R2=.75, p<.01), less well with resting bladder location (R2=.55, p<.01) but not with abdominal
pressure (R2=.15, p=.102). Linear regression modeling showed that resting bladder point explained
55% of the variation of maximum bladder displacement (p<.001). Adding the effect of compliance
increased it to 86% (p<.001) and adding maximum abdominal pressure increased it further to 93%

108
(p=.001).
Conclusion: The null hypothesis was rejected. Women with cystocele have 67% greater compliance
of their
support system compared to controls. However, resting bladder location was also an important
predictor of cystocele size. Comment: The anterior vaginal wall support system has been shown to
depend on the combined action of muscle and connective tissue. To our knowledge, these are the first
in vivo MR-based compliance measurements of this system in women, and especially those with and
without cystocele.
6.1 Introduction
The deterioration and weakening of anterior vaginal wall and/or its connective
tissue support have been hypothesized to underlie the development of anterior vaginal
prolapsed (Chapters 4 & 5).
The material properties of the anterior vaginal wall and its supportive connective
tissue have been studied in women with and without prolapse. For example, the shear
strength of vaginal wall specimens was found to be lower in patients with pelvic floor
dysfunction then normal controls (Kondo et al, 1994) and great variability in the tensile
and bending strength of samples has also been observed (Cosson et al, 2004). Women
with prolapse had more extensible vaginal skin and a lower stiffness index compared to
age-matched controls (Lei et al, 2006, Epstein et al, 2008). The resiliency of the apical
support structures such as the uterosacral ligaments has also been found to be
significantly reduced among women with symptomatic uterovaginal prolapse (Reay et al,
2003). However, those results contain a systematic bias in that the mechanical tests were
all conducted in vitro when the tissue samples already had lost their smooth muscle tone.
As we know, the pelvic floor organs, when removed from the body, exist only as
a limp and formless mass. Their shape and position in living women is determined by
their tensile attachments to the pubic bones, through the muscles, and the connective
109
tissues of the pelvis. The interactions of levator ani muscles, apical connective tissue in
the form of the cardinal and uterosacral “ligaments”, and the connective tissues forming
the anterior vaginal wall combine to form the anterior compartment support system.
The word ligaments is here placed in inverted commas because these are not ligaments in
the orthopedic sense of the word, but instead are comprised of mesenteric attachments
involving smooth muscle, nerve and vascular tissue, in addition to connective tissue.
Clearly, given the relative complexity of the anterior vaginal wall support
structures and the fact that in vitro tests may not really represent their behavior adequately,
it would be better to evaluate their load-displacement behavior in vivo if possible.
Previous biomechanical models have demonstrated how the combined action of
muscle and connective tissue contribute to anterior compartment support (Chapter 4 and
Chen et al 2006). The simulated model can reproduce a similar size and shape of
cystocele to that seen clinically under moderate intra-abdominal pressure. However, a
more sophisticated model requires validation using in vivo compliance measurements as
well.
Intra-abdominal pressures during cough and Valsalva have been measured during
clinical exam (Howard et al, 2000, DeLancey et al, 2007), and displacements were
measured during these activities have been quantified in vivo using ultrasound (Howard
et al, 2000, Peng et al, 2007). However, no simultaneous measurements of
intra-abdominal pressure and prolapse development have ever been made. So the
relationship between load and displacament remains to be elucidated. It is tempting to
use an inexpensive imaging modality such as clinical ultrasound to make such
measurements. But it is simply not feasible because contact pressure between the
ultrasound probe and the prolapse would distort the very measurements being made.
Dynamic MR imaging allows superior visualization of soft tissue movement
without direct contact pressure. As such it is ideal for looking at displacement of the
anterior compartment during abdominal loading or Valsalva. If we now add a novel
method for measuring intra-abdominal pressure synchronously to the dynamic MR
images being made, this permits simultaneous measurements of both abdominal pressure
and anterior wall shape and displacement. The ability to determine the amount of anterior
compartment displacement under a known level of intra-abdominal pressure loading

110
allows a calculation of compliance to be made.
It was therefore our objective to test the null hypothesis that anterior compartment
compliance does not differ between women with and without prolapse and to explore
biomechanical factors predicting variation in cystocele size.
6.2 Methods
Nineteen parous women with normal support (N=10) and varying degrees of
anterior compartment prolapse (N=9) were taken from an ongoing study [mean ± SD Age:
controls = 62 ± 10 yrs, cases = 53 ± 12 (p=.101) Parity: controls = 3 ± 2, cases = 3 ± 1,
(p=.565). A catheter was placed in the bladder and connected to a pressure monitoring
device (Datascope, Montvale, N.J.) to measure abdominal pressure. MRI was performed
on a 1.5-T system (Signa, General Electric, Milwaukee, WI) using a four-channel, torso
phased-array coil with the subject in the supine position. Before starting the examination,
the patient was instructed in regards to the straining maneuvers to be performed during
the examination, starting from minimal to maximal straining. For dynamic imaging, a
multiphase, single level image of the pelvis in the mid-sagittal plane was obtained
approximately every second over an interval 23 – 27 s using a T2-weighted, single-shot,
fast spin-echo sequence (Repetition time (TR) = 1,300 ms; Echo time (TE) = 60 ms; slice
thickness = 6 mm; field of view = 32 – 36 cm; matrix = 256 × 160; one excitation and
half-Fourier acquisition). The time needed to actually acquire each of the images was
determined by the patient’s weight and was approximately one second. A set of 20
successive images were acquired in 23 – 27 s during rest as well as a graded Valsalva
effort in the following manner. The operator instructed the subject to hold her breath in
inspiration and initiated the scan. After 5 s of imaging with the subject at rest the
operator instructed the subject to strain minimally for 5 s, moderately for 5 s, and
maximally for 5 s, then to breath normally and relax for another 5 – 7 s before ending the
acquisition. Usually, three images were acquired at rest during suspended inspiration, 12
during the graded Valsalva effort, and five during post-Valsalva relaxation and normal
breathing. The most dependent bladder point was plotted on each image (Figure 6-1). The
mean location of the normal resting bladder point has been previously determined in 20

111
nulliparous women (Summers et al, 2006). The displacement of the dynamic MR
bladder point relative to the normal location in nullipara was determined using MATLAB
v7.0 (MathWorks, Natick,MA). Abdominal pressure and bladder displacement was
plotted for each subject and best-fit lines for the loading portion of the curve to the
maximum displacement were obtained using linear regression (the line slope is a measure
of compliance)(Figure 6-1). Bivariate analysis (Student t-test) comparing cases and
controls and multivariate analysis of all subjects (correlation coefficients and linear
regression modeling) were performed.
Figure 6-1 The upper tracings were constructed from dynamic mid-sagittal images of the subject whose lines is marked with an asterix. Black dots represent the most dependent bladder point and black triangles the location of the normal bladder point in nullipara. The graph showed the relationship between intra-abdominal pressure and bladder location during loading (solid tracing) and unloading (dashed tracing) cycle. Straight line is the best fitted line for the loading curve.

112
6.3 Results
The mean (± SEM) compliance was higher for cases (0.5 ± 0.06 mm/cmH2O) than
controls (0.3 ± .07 mm/cmH2O, p=.039). The linear relationship of the loading curve was
demonstrated by coefficients of determination (R2) ranging from 0.21 to 0.98. There was,
however, variability in compliance (line slope) between subjects (range: 0.005 to 0.097
cm/cmH2O, Figure 6-2). The mean maximum displacement for the bladder was 4.6 cm.
The mean resting bladder point in cases (2.4 ± 0.5 cm) was more displaced relative to the
nullipara than controls (0.9 ± 0.1 cm, p= .024). The mean maximum pressure for controls
(70.0±23) was not significantly different than that for cases (87.0 ± 27) (p=.154). Pearson
correlation coefficient between maximal bladder displacement and 1) compliance was
0.86 (R2=.75, p<.001), 2) resting bladder point was 0.74 (R2=.55, p<.001), 3) maximum
abdominal pressure was 0.39 (R2=.15, p=.102). Linear regression modeling showed that
resting bladder point helps to explain 55% of the variation of maximum bladder
displacement (p<.001). Adding compliance of anterior compartment support increased it
to 86% (p<.001) and adding maximum abdominal pressure increased it further to 93%
(p=.001).
6.4 Discussion
We have developed a novel approach which allows us to quantify the compliance
and behavior of the anterior compartment support system under physiologic load. Using
this dynamic MR-based strategy, we were able to determine that patients with prolapse do
have a more compliant anterior compartment support system compared to controls.
Since compliance has an inverse relationship to stiffness, this corroborates earlier data
suggesting that women with prolapse have less stiff vaginal tissues (Lei et al, 2007,
Epstein et al, 2007). When we performed an analysis to determine the contribution of
factors to the development of anterior compartment prolapse, as expected we found that
compliance and abdominal pressure correlated strongly with descent of the anterior
vaginal wall.

113
Figure 6-2 Best fit lines for the loading curves for all subjects. Solid lines present data for women with prolapse, dashed line were the data for women with normal support.
This study extends the existing literature on the biomechanics of pelvic organ
prolapse in two important ways. The first is that it uses an in vivo material property
testing method to compare women with and without prolapse. Numerous investigators
have used in vitro testing method using uni-axial tensiometer to test the property of
vaginal biopsy specimens (Lei et al, 2007, Rubod et al, 2008), however those specimens
are lack of smooth muscle tone which exists in living women, also the loading applied to
those specimens during uni-axial testing is not resemble the physiological loading in
living women. Second, we were surprised to find that resting bladder point alone
explained 55% of the variation bladder wall descent. This finding that prior to loading,
the starting state of the bladder in women with prolapse differs from those with normal
support is intriguing. This may represent long term adaptation of the anterior support

114
system which we currently are not able to quantify. For example, stretching and
elongation of the connective tissue supports of the anterior compartment which has
occurred over time.
We encountered several challenges during this study. There tends to be variation in a
woman’s levator muscle activity during a Valsalva maneuver, despite similar instructions
being given. For example, during a pelvic examination women tend to contract their
muscle during Valsalva when they are afraid to pass gas, instead of relaxing their muscle
as instructed. Some may be less inhibited in the MR scanner since no one else is in the
room with them. Also the effort that women develop during Valsalva can vary from one
time to the next. The size of the cystocele may vary from one trial to another, even in
the same subject, despite careful coaching and training during an office visit that was
always conducted before the visit at which the dynamic MR exam was conducted. Lastly,
the 1 Hz data collection rate for the dynamic MR images precluded any meaningful
measurements from being made during a cough (during which the peak intra-abdominal
pressure can be reached in half a second). For this reason, we only studied Valsalva.
We used the displacement of the most dependant bladder point and the value of
intra-abdominal pressure required to achieve that displacement to estimate overall
support system compliance. Even though it is simple to measure and easy to interpret,
one landmark measurement hardly tells the whole story about system support properties
and using this technique we tend to lose any insights about how compliance varies from
one region to another. To address this limitation, we explored the feasibility of using a
non-rigid image registration method to estimate anterior vaginal wall deformation,
thereby assessing its support system compliance (see Appendix ‘B’). However, time did
not permit the full development of this technique for this application. However, the
preliminary results were promising and this is direction that future research might follow.

115
References
Cosson M, Lambaudie E, Boukerrou M, Lobry P, Crépin G, Ego A. A biomechanical
study of the strength of vaginal tissues. Results on 16 post-menopausal patients
presenting with genital prolapse. Eur J Obstet Gynecol Reprod Biol. 2004 Feb
10;112(2):201-5.
DeLancey JOL. Fascial and muscular abnormalities in women with urethral
hypermobility and anterior vaginal wall prolapse. Am J Obstet Gynecol,
2002;187:93-8.
Epstein LB, Graham CA, Heit MH. Systemic and vaginal biomechanical properties of
women with normal vaginal support and pelvic organ
prolapse. Am J Obstet Gynecol 2007;197:1-165.
Kondo A, Narushima M, Yoshikawa Y, Hayashi H. Pelvic fascia strength in women with
stress urinary incontinence in comparison with those who are continent. Neurourol
Urodynam 1994;13:507-13.
Hendrix SL, Clark A, Nygaard I, Aragaki A, Barnabei V, McTiernan A. Pelvic organ
prolapse in the Women's Health Initiative: gravity and gravidity. Am J Obstet Gynecol.
2002 Jun;186(6):1160-6
Howard D, Miller JM, Delancey JO, Ashton-Miller JA. Differential effects of cough,
valsalva, and continence status on vesical neck movement. Obstet Gynecol. 2000
Apr;95(4):535-40.
Lei L., Song Y., Chen R. Biomechanical properties of prolapsed vaginal tissue
in pre- and postmenopausal women. Int Urogynecol J, 2007;18:603–607

116
Peng Q, Jones R, Shishido K, Constantinou CE. Ultrasound evaluation of dynamic
responses of female pelvic floor muscles. Ultrasound Med Biol. 2007;33(3):342-52.
Reay Jones NH, Healy JC, King LJ, Saini S, Shousha S, Allen-Mersh TG. Pelvic
connective tissue resilience decreases with vaginal delivery, menopause and uterine
prolapse. Brit J Surg 2003;90:466-72.
Rubod C & Boukerrou M & Brieu M et al Biomechanical properties of vaginal tissue:
preliminary results Int Urogynecol J. 2008;19:811–816
Sze EH, Karram MM. Transvaginal repair of vault prolapse: a review. Obstet Gynecol
1997;89:466-75.
Shull BL, Bachofen C, Coates KW, Kuehl TJ. A transvaginal approach to repair of apical
and other associated sites of pelvic organ prolapse with uterosacral ligaments. Am J
Obstet Gynecol 2000;183:1365-73.
Singh K, Jakab M, Reid WM, Berger LA, Hoyte L. Three-dimensional magnetic
resonance imaging assessment of levator ani morphologic features in different grades of
prolapse. Am J Obstet Gynecol 2003;188:910-915.

117
Chapter 7
General Discussion
Anterior vaginal prolapse (AVP), clinically referred to as “cystocele,” is the most
common form of pelvic organ prolapse. Despite its common occurrence, its
pathomechanics remains poorly understood. This dissertation is a first attempt to
understand the mechanisms underlying an anterior vaginal wall prolapse from a
biomechanics point of view.
The approach was to first use advanced magnetic resonance (MR) imaging to
establish the normal geometry of anterior vaginal wall support system and compare
morphological differences between women with and without prolapse. Therefore, in
Chapter 2 a technique was developed to quantify levator ani muscle cross-sectional area
in women with and without visible muscle defect, and with and without prolapse. A
localized cross-sectional area decrease was found in the ventral pubic portion of the
levator ani muscle in women with defects. Surprisingly, in the dorsal pubic portion,
women with major defect had a slightly larger cross-sectional area compared to women
with intact muscle, which may imply compensational tissue hypertrophy in this region.
However muscle cross-sectional areas were not different between women with and
without prolapse when controlling for muscle status. This suggests that the muscle
impairment is an important factor associated with anterior vaginal wall prolapse, but not
the only factor.

118
In Chapter 3, we investigated how vaginal thickness and vaginal length associate with
prolapse. We found that women with prolapse have thicker and longer vaginal walls -- in
contrast to the common prevailing belief that it is a deterioration and thinning of vaginal
tissue that is the cause of anterior vaginal wall prolapse. We found that descent of the
apex of the vaginal wall and
vaginal wall length are two strong predictors for prolapse size; in fact they explained 77%
of variation among prolapse size. This provides the clinical evidence that apical support
and the vaginal wall itself are important support elements as well.
Therefore, the disease model we proposed is that the occurrence and magnitude of
AVP is not explained by any single mechanism, but involves a combination of connective
tissue support failure at one or more sites (including apical and/or paravaginal support)
and also involves an interaction with pubococcygeal muscle impairment.
We tested this idea using biomechanical computer models, including both a
theoretical 2D lumped parameter model (Chapter 4) and an anatomically more accurate,
3D, subject specific finite element model (Chapter 5). Those validated models allow us
to analyze the pathomechanics of anterior vaginal wall prolapse by examining “what-if”
scenarios, which include situations that are not amenable to experimentation in live
individuals for obvious ethical reasons.
Our simulation results suggest why the levator ani muscle plays an important role in
pelvic floor organ support, thus helping to explain the clinical observations of levator ani
muscle impairments in these patients. For example, Delancey and colleagues found that
women with prolapse have a larger hiatus on average (DeLancey et al. 1998), but why
this might be so was not understood at the time. Later they found that women with
prolapse are four times more likely to have levator ani muscle defect (DeLancey et al.
2007). Our MRI measurements (Chapter 2) showed that visible muscle defects on MR

119
images are directly associated with decreasing of muscle cross-sectional area. This in
turn has been associated with a decrease in the isometric force that this muscle can
generate and therefore the muscle’s ability to resist stretch. This can help to explain why
the hiatus may be larger in prolapsed women, but did not really explain why prolapse
occurs. Our model simulations suggest that the impairment in pubic portion of levator ani
muscle causes the enlarged hiatus which observed in these women. This allows a longer
length of vaginal wall to be exposed to the action of a pressure differential between high
intra-abdominal pressure (during physical activities such as straining, coughing, lifting,
etc) and low atmosphere pressure, resulting in an increase in larger vaginal tissue stress
and placing more load on connective tissue support. This increase stress drags down the
apex and results in cystocele formation. Our model (Chapters 4 and 5) provided
mechanistic insight in the relationship between muscle impairment and cystocele
formation helping to link the clinical findings reviewed above.
The models also help to explain the importance of apical support. With muscle
impairment present and the anterior vaginal wall subjected to a pressure differential
loading, with intraabdominal pressure acting on its superior surface, and atmospheric
pressure acting distally on its inferior surface, this tensile load has to be resisted by both
apical and paravaginal connective tissue supports. Our model suggested that apical
impairment resulted in a larger cystocele size compared to paravaginal impairment, a
result which agrees with Summers’ clinical finding (Summers et al. 2005).
This dissertation therefore extends the existing literature on pelvic organ prolapse
mechanism. We can see this by examining Figure 7-1 which shows the extant
understanding supported by scientific data at the time this dissertation research was
started in 2002. In this understanding intra-abdominal pressure loaded on anterior
compartment causes the tension in paravaginal support and vaginal wall itself.
Impairments in paravaginal connective tissue and/or the weakening of anterior vaginal
wall were thought to result in an abnormal vaginal elongation and in turn cause vaginal
bulging based on the action of its geometric constraints, such as at the apex, paravaginal
attachments and the distal location of vaginal wall. The biomechanical studies had

120
concentrated on the material properties changes observed in the vaginal wall and its
supporting connective tissue.
This dissertation is the first time the interaction between muscle, connective tissue
and anterior vaginal wall structures has been systematically investigated in the presence
and absence of structural defects. Figure 7-2 shows a conceptual (systems analysis)
model of our current understanding of the biomechanical mechanism underlying
cystocele formation. The black portion shows the existing understanding at the time this
dissertation started. The dark grey portion shows the contribution of this dissertation
work. The light grey portion shows hypotheses yet to be investigated in the future.
Figure 7-1 The understanding of cystocele formation supported by scientific data extant at the time this dissertation work started in the year 2002. IAP denotes intra-abdominal pressure; AVW: anterior vaginal wall; T: tension; and ε : strain.

121
Figure 7-2 A new conceptual (systems analysis) model for the mechanism of anterior vaginal wall prolapse showing the factors leading to the development of a cystocele of size ‘d’. The black ‘putative’ portion represents the historical understanding in the year 2002 (when this dissertation research was started). The dark grey ‘novel’ portion represents the contribution of this dissertation. In particular, the idea of focusing on the pressure differential acting on the exposed distal portion of vagina as the driving force to the development of prolapse (Chapter 4 & 5) is held to be a key contribution. The light grey ‘potential’ portion represents tissue adaptational mechanisms that could act over time and need to be investigated in the future. In this dissertation the effect of a single loading cycle, with different magnitudes of intra-abdominal pressure, IAP, was investigated, but the effect of multiple loading cycles should be investigated in the future. IAP denotes intra-abdominal pressure; PVM: pubovisceral muscle, pubic portion of levator ani muscle; AVW: anterior vaginal wall; α : active contraction of levator ani muscle; P0: atmosphere pressure; Δp : pressure differential ; T: tension; and ε : strain.
The core concept is that impairment weakening the levator ani muscle’s (box 5 in
Figure 7-2) resistance to stretch causes an enlarged genital hiatus, which exposes longer
the anterior vaginal wall (box 1) to a pressure differential, which causes abnormally
larger tensile stress being placed on the paravaginal support (box 4), the apical support
(box 7) and the anterior vaginal wall (box 2), causing the abnormal elongation in those
structures, eventually causing cystocele formation (model output, “d”).
There are some positive feedback mechanisms in this conceptual model which
provide insights that help to explain how cystocele can gradually develop over the years.
The exposed anterior vaginal wall causes the tension in vaginal tissue because of pressure
differential. This tension loads the apical support system and causes apical descent. Then

122
this apical descent causes a longer length of vagina to be exposed to the pressure
differential which in turn causes larger tension in vaginal wall and larger loading on
apical support until a new equilibrium is again established in the system. A second
positive feedback mechanism is caused by the anterior vaginal wall having a trapezoidal
shape - narrower at distal end than at the apex. As increasing vaginal length is exposed
to the pressure differential, the area of vagina exposed to the pressure differential will
increase non-linearly due to this trapezoidal shape, thereby leading to a non-linear
increase in the force dragging down the apex. Thirdly, an impairment during vaginal birth
or due to intrabdominal pressure overloading during activities like lifting, tripping or
slipping, could injure the apical support system and thereby decrease the stiffness of
apical support system material properties; this will cause an even larger apical descent,
and eventually a larger cystocele.
This conceptual model provides useful insights that help explain why vaginal parity
is the most important risk factor to predict prolapse and how insults to the pelvic floor
during vaginal birth in a young woman can cause cystocele formation later in the
woman’s life (usually starting to become symptomatic in their 50s or 60s).
In this dissertation, we did not directly consider the mechanisms of adaptation in
tissues loaded over longer periods of time (Figure 7-2: light grey “future” portion). Our
MR imaging studies showed that women with prolapse have slightly larger muscle
cross-sectional area in their dorsal portion of levator ani, they also tend to have larger
vaginal cross-sectional area and larger vaginal length. These findings suggest tissue can
slowly adapt to abnormally increased loading placed onto them as the result of muscle
impairment. This might be another reason for the delay we see in cystocele formation
over the years between vaginal delivery and when cystocele is first noticed.
There are several limitations to the approach used in this dissertation. First, all the
MRI measurements were landmark-based and relied on considerable anatomical expertise.
Second, subject’s levator ani muscle activity during Valsalva maneuver is difficult to
control. Even though we did carefully train subjects to relax their muscle when increasing

123
their intra-abdominal pressure, variation in Valsalva effort and activity of levator ani
muscle during a Valsalva can occur, cystocele formation during the Valsalva can be trial-
and subject specific. However the effect of active muscle contraction has yet to be
incorporated into our model simulations. Clearly, voluntary or involuntary increases in
levator activity would tend to stiffen the muscle by engaging more muscle cross bridges
in the strongly bound state, thereby increasing its resistance to stretch deformation, and
vice versa. So the higher the levator stiffness the more resistance there is to hiatal
expansion. Third, material properties were assumed to be classically hyper-elastic in
nature. Time-dependent factors such as a tissue’s viscous properties and the effects of
loading rate, number of loading cycles were not addressed in the model. It would
certainly have been better to have used visco-hyperelastic properties in the models had
they been available, which was not the case at the time of writing. Fourth, the tissue
failure criteria and the possibility of tissue adaptation (whereby a tissue loaded
repetitively over time might change its material properties such as stiffness by changing
its structure or density) were not considered in this model. Fifth, impairments in support
structures were simulated simply by decreasing their stiffness; the initial geometry
changes caused by impairment were also not considered at present time. In the case of
the apical support, the 50% decrease in stiffness was simply an arbitrary value. It
remains to be seen whether future experimental measurements show impairments of this
magnitude. Sixth, the anatomy of some regions, especially the paravaginal attachments,
and the attachments of the distal vagina remain to be defined in detail, so these need to be
studied in the future and incorporated into the model. For example, it is likely that the
distal end of the vagina is not fixed in every patient and its attachment can deform and
even translate distally under abdominal pressure loading in some patients. Seventh,
even though our models have been shown to be able to reproduce a similar size and shape
of cystocele as that of seen in the real patient, a more extensive, specific and quantitative
model validation method is still in the future. Also, we did not consider inertial loading
effects caused by any deceleration of abdominal content momentum by the apical support
and pelvic floor. Presumably these inertial effects are small during the slow movements
associated with a Valsalva. But they can be large during vigorous physical activity such
as jump landings.

124
Despite these limitations, we believe the model captured many of the important
features of cystocele formation and the results support the working hypothesis posited in
Chapter 1.

125
Chapter 8
Conclusions
This dissertation is a first attempt to understand the biomechanical mechanisms
underlying an anterior vaginal wall prolapse using MR imaging and biomechanical
modeling approach. We evaluated the effect of pathological changes in three components
of anterior vaginal wall support: 1) levator ani muscle, 2) vaginal wall, and 3) paravaginal
and apical suspension. The following conclusions were drawn:
1. Women with major defects exhibited a smaller (i.e., 50% less than women without
defect ) cross-section area in the ventral portion of the levator ani muscle, whereas
in the posterior portion of the muscle, women with major defects exhibited a slightly
larger (17%) cross-section area compared to those without defects. However
cross-sectional area measurements did not show statistically significant differences
between women with and without prolapse for each level of defect. There was
evidence of compensatory muscle adaptation and hypertrophy in the region of the
levator ani adjacent to the defect site.
2. Using a similar technique, vaginal cross-sectional area was larger for women with
prolapse compared to women with normal support. Positive correlations were
found between anterior vaginal wall descent, cystocele size, and anterior vaginal
wall length. Combined with apical descent, these parameters explained 77% of
cystocele size.
126
3. A 2-D, sagittal plane, lumped parameter model showed that a combined impairment
in both muscular and connective tissue support of the anterior vaginal wall was
needed to produce
4. the largest cystocele. A 90% impairment of apical support led to a 530% increase in
anterior wall prolapse in the presence of a 60% pubovisceral muscle impairment.
4. A 3-D, subject-specific, anatomically accurate, finite element model demonstrated
that realistically-shaped and -sized cystoceles can develop due to a levator defect.
This allows a pressure differential to act across the distal vaginal wall, thereby
tensioning the vaginal wall and its apical supports, which in turn causes the
prolapse to form in the distal vagina. This sequence of events helps to explain the
clinical observations of hiatal size and muscle weakness in women with AVP.
5 By simultaneously measuring intra-abdominal pressure as the displacement of the
most dependent bladder point, the compliance of the anterior vaginal wall support
system in women with prolapse was estimated as 0.5 mm / cm H2O, or 67% higher
than was found in healthy age-matched controls. This suggests that in women with
prolapse, apical support compliance is increased relative to controls.
127
Chapter 9
Suggestions for Future Research
This dissertation provides useful insights into biomechanical mechanisms underlying
an anterior vaginal wall prolapse. We focused on the interplay among: 1) levator ani
muscle, 2) anterior vaginal wall, and 3) apical and paravaginal connective tissue support.
We also investigated the mechanical factors resulting from the alterations in these
supports that are involved in the development of prolapse. There are many factors that
remain to be investigated, such as the effect of vaginal childbirth, the effect of aging on
tissues, the effect of occupations involving heavy lifting and chronic coughing which
both heavily load the pelvic floor, and the effects of collagen and elastin disorders,
neuromuscular dysfunction, hormonal effects as well as tissue adaptation over time.
These effects are all worthwhile investigating in the future.
The initial geometry used in the present model was based on the anatomy of a single
woman with normal support. How abnormal initial geometry might affect the stress
distributions in different support structures and lead to cystocele formation remains to be
investigated. Also the morphological variation in the anterior vaginal wall support system
that exists in a population needs to be delineated, as do how those variations affect the
formation of the cystocele.
The present 3D model has a simplified structure and geometry. The model can be
improved by incorporating the perineal body and its support, and a separated posterior
vaginal wall and rectum, so that organ competition during the development of
128
prolapse can be studied. Also in some regions, the functional anatomy of the
paravaginal support needs to be further clarified and implemented in the model.
Studies are needed to provide the model with more accurate material properties.
Because most tissues are highly anisotropic, biaxial test data will be needed along with
muscle fiber and collagen fiber mapping. The lack of representation of striated levator
and smooth muscle tone and activity also needs to be remedied. Finally, data are needed
on the visco-hyperelastic behavior and injury criteria of the salient tissues. Once
available, the effects of different pressure and inertial loading rates can usefully be
examined. Finally a more specific and extensive model validation technique is needed for
future models that take into account any inter-individual and ethnic morphological
differences.

129
Appendices
130
Appendix A
Cardinal and Uterosacral Ligament Load-Sharing Depends on Their Relative Orientations
ABSTRACT Objective: The aim of this project is to use a 2-D biomechanical model to investigate how variation in
cardinal and uterosacral ligament inclinations affect the tension in each ligament as it supports the
pelvic viscera (“pelvic load”) in static equilibrium. Data for the 2-D model was derived from 3-D
models of the cardinal and uterosacral ligaments of women with normal pelvic support.
Methods: Supine MRI scans of volunteers with normal support on POP-Q (all points at least 1 cm
above the hymen) examination were obtained from a study of pelvic organ support. 3-D models
were constructed from a convenience sample of 15 women in whom axial and coronal proton density
MR scans clearly showed ligament anatomy that could be reconstructed using the 3-D Slicer©
software. Each model was segmented into equal parts using I-DEASTM software, whereupon the
centroid of each model segment was found. The 3-D lines-of-action of the four ligaments were then
determined either using these centroids or their approximate origin and insertion points. The angles
between the ligaments (U-C) and of each ligament relative to the cranio-caudal body axis (C, U) were
measured. We represented the averaged actions of the left and right uterosacral ligaments in the
sagittal plane by a single cable (whose tension is Tu) and, similarly, the left and right cardinal
ligaments by a second cable [tension: Tc]. A “pelvic load” (arbitrarily set at 1 Newton [N]) was
suspended from each ligament and deflected by the levator plate whose angle was set using MRI
measurements. Tu and Tc were then calculated for each individual in the upright posture using their
measured angles.
131
Results: Tc was 51% greater than Tu (P=0.0002). However, the variability (range×100%/mean
tension) of Tu was greater (98%) than the variability of Tc (36%). The variance in angle C was
larger than the other two angles.
Conclusion: Biomechanical model analysis using data from women with normal support suggests that
the cardinal ligaments may carry more tension than the uterosacral ligaments. However, the
variability in uterosacral tension is greater across individuals. Comment: Individual differences in
ligament geometry might predispose a certain woman to ligament injury under conditions of increased
ligament load (e.g. loss of pelvic muscle support).
Introduction
The cardinal and uterosacral ligaments have long been credited with contributing to
utero-vaginal support. Varying anatomists have studied these structures from cadaveric
dissections and cross-sectional anatomy (Blaisdell 1917, Campbell 1950, Range 1964,
DeLancey 1992). These studies have provided some understanding of the structures’
histologic content and structural arrangement. However, a biomechanical understanding
of how the ligaments function to provide pelvic organ support has been lacking. The
biomechanical relationship of the ligaments can be simplified as being analogous to a
light suspended by two cables. In this example, the light represents the pelvic viscera
and provides the “load” or force placed on the cables. The cables are the cardinal and
uterosacral ligaments. The angles of inclination of the cables or the ligaments affect the
tension placed on each ligament as it supports the pelvic viscera. These angles can be
estimated from 3-D models of the cardinal and uterosacral ligaments constructed from
magnetic resonance images. These calculations can then be used to develop 2-D
biomechanical models to investigate how variation in inclination of the cardinal and
uterosacral ligaments affect the tension in each ligament as it supports the pelvic viscera
(“pelvic load”) in static equilibrium.
Materials and Methods
Supine MRI scans of 15 volunteers with normal support (all points at least 1 cm above
the hymen) on POP-Q examination and clearly defined cardinal and uterosacral ligament

132
anatomy were selected from a larger study of over 300 women with and without normal
pelvic organ support. All MR scans were obtained as multiplanar two-dimensional fast
spin proton density MR images (echo time 15 ms, repetition time 4000 ms) using a 1.5 T
superconducting magnet (General Electric Signa Horizon LX) with version 9.1 software.
The field of view in axial and coronal images are both 16x16 cm and the field of view in
the sagittal images is 20x20 cm. All three views had slice thicknesses of 4 mm with a 1
mm gap between slices.
Axial and coronal MR-images were imported into a three-dimensional (3-D) imaging
program (3-D Slicer, version 2.1b1) and aligned using anatomic landmarks. The
uterosacral ligament was traced on axial MR images (Figure A-1) and the cardinal
ligament was identified and traced on coronal MR images (Figure A-2).
0 0.5
1.0 1.5 2.0
B
C
U
R
-0.5 0 0.5
1.0 1.5 2.0
CM
Figure A-1. Tracings of the uterosacral ligament on axial MR images.

133
R
1.5
UO
V
ICM
0 0.5 1.0
2.0 2.51.5
Figure A-2. Tracings of the cardinal ligament on coronal MR images.
Figure A-3. Left lateral view of 3-D cardinal and uterosacral ligament models. Arrows demonstrate the line of action of the ligaments. C: cardinal ligament; US: uterosacral ligament PS:pubic symphysis; U: uterus; V: vaginal;
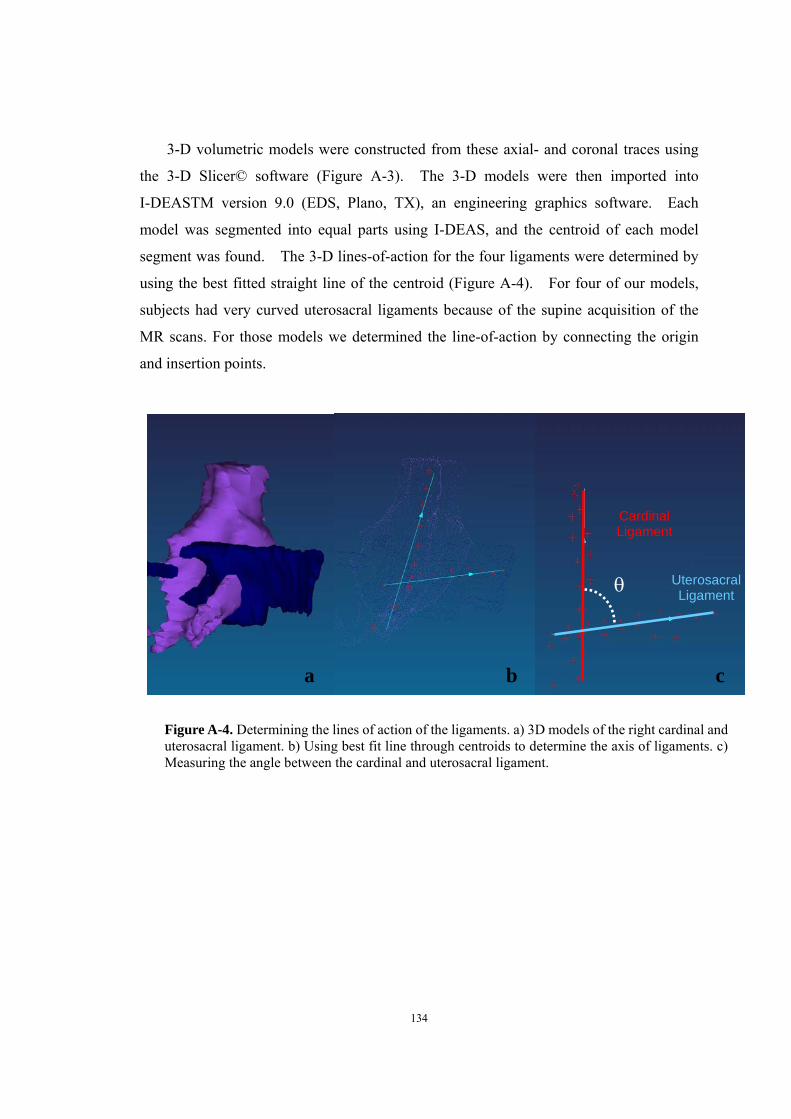
134
Figure A-4. Determining the lines of action of the ligaments. a) 3D models of the right cardinal and uterosacral ligament. b) Using best fit line through centroids to determine the axis of ligaments. c) Measuring the angle between the cardinal and uterosacral ligament.
θ
Cardinal Ligament
Uterosacral Ligament
a b c
3-D volumetric models were constructed from these axial- and coronal traces using
the 3-D Slicer© software (Figure A-3). The 3-D models were then imported into
I-DEASTM version 9.0 (EDS, Plano, TX), an engineering graphics software. Each
model was segmented into equal parts using I-DEAS, and the centroid of each model
segment was found. The 3-D lines-of-action for the four ligaments were determined by
using the best fitted straight line of the centroid (Figure A-4). For four of our models,
subjects had very curved uterosacral ligaments because of the supine acquisition of the
MR scans. For those models we determined the line-of-action by connecting the origin
and insertion points.

135
UU-C
C
Leva
tor P
late
Body Axis
Cardinal
Uterosacral
PelvicLoad
Body Axis
Tu
Tc
UU-C
C
Leva
tor P
late
Body Axis
Cardinal
Uterosacral
PelvicLoad
Body Axis
Tu
Tc
Figure A-5: Suspension model
The angles between the uterosacral and cardinal ligaments (U-C) and of each ligament
relative to the cranio-caudal body axis (C, U) were measured in 3-D space. These
angles were then projected onto the sagittal plane and used for the angles in the 2-D
biomechanical model (Figure A-5). In this model, we represented the averaged actions
of the left and right uterosacral ligaments in the sagittal plane by a single cable (whose
tension is Tu) and, similarly, the left and right cardinal ligaments are represented by a
second cable (Tc). A “pelvic load” (arbitrarily set at 1 Newton [N]) was suspended from
the ligaments and deflected by the levator plate (Figure A-1) whose angle was set at 45o
from the horizontal (using MRI measurements of women with normal support). We
calculated the tension placed on the cardinal and uterosacral ligaments using these
parameters. Secondary analysis was performed using levator plate angle (LPA) of 54o
based on measurements of prolapse patients. Tu and Tc were then calculated for each
individual in upright posture using their measured angles.
Results The variance in angle C was larger than the other two angles. Using the levator plate
angle of women with normal support (45o), the tensions in the cardinal and the
uterosacral ligaments were almost the same. Changes in the levator plate angle caused
changes in the tension on the ligaments. If the levator plate was changed to 54o as in

136
prolapse geometry, Tc (0.74 N) was 51% greater than Tu (0.49 N) (P=0.0002). However,
the variability (range×100% / mean tension) of Tu was greater (98%) than the variability
of Tc (36%).
Table A-1 Result
Discussion
The geometry of the cardinal and uterosacral ligaments and their orientation relative to
the direction of the force placed upon them affects their tension. Changing the angles of
the ligaments relative to the body axis also changes their angles relative to the loading
force thereby changing ligament tension. The ligament which is more aligned to the
loading direction will have a greater tension than the ligament that is less aligned.
Finally, changing the levator plate angle from 45o (normal women) to 54o (prolapse
women) increases the difference between the angles of the ligaments relative to the load,
thereby increasing the difference between Tc and Tu. The cardinal ligaments then carry
more tension than the uterosacral ligaments because they are better aligned with the
pelvic load force than the uterosacral ligament. Moreover, inter-individual variation in
the calculated tension in the uterosacral and the cardinal ligaments varies widely.
Therefore, there may be certain individuals who, because of their geometry, have
ligaments subjected to greater tension for any given pelvic load.
The uterosacral and cardinal tissues are critical components of Level I support and
provide support for the vaginal apex (DeLancey et al 1992). The cardinal ligaments are
oriented in a relatively vertical axis (in the standing posture) while the uterosacral
Mean ± SD Min Max C (o) 25.0 ± 8.6 13.2 47.0 U (o) 81.0 ± 5.9 69.0 92.5 U-C (o) 73.5 ± 8.1 59.0 80.6 Tc (N) LPA=45o 0.62± 0.09 0.47 0.77
Tu (N) LPA=45o
0.63±0.120.12 0.36 0.77
Tc (N) LPA=54o 0.74 ±0.08 0.63 0.89
Tu (N) LPA=54o 0.49 ±0.13 0.19 0.67

137
ligaments are more dorsal in their orientation. Neither are true ligaments in the sense of
a skeletal ligament that is composed of dense regular connective tissue similar to knee
ligaments. They are “visceral ligaments” that are similar to bowel mesentery. They
are made of blood vessels, nerves, smooth muscle, and adipose tissue intermingled with
irregular connective tissue. They have a supportive function in limiting the excursion of
the pelvic organs much as the mesentery of the small bowel limits the movement of the
intestine. When these structures are placed on tension, they form condensations that
surgeons refer to as ligaments (Campbelln 1950, Range et al 1964).
Both the cardinal and the uterosacral ligaments are visible from pelvic MR images. The
cardinal ligament is a mass of retroperitoneal areolar connective tissue in which blood
vessels predominate; it also contains nerves and lymphatic channels (Range et al 1964).
It has a configuration similar to that of “chicken wire” or a fishing net in its natural state
but when placed under tension assumes the appearance of a strong cable as the fibers
align along the lines of tension (Range et al 1964). Because of it relatively vertical
orientation, it is best seen on the coronnal MR images. It is demarcated by the vessels
and lymphatic elements lateral to the pelvic organs (Figure A-2). The 3-D models of the
cardinal ligaments often have an amorphous “cloud-like” appearance which at times
made approximations of their lines of action challenging.
The uterosacral ligaments are bands of tissue running under the rectovaginal peritoneum
composed of smooth muscle, loose and dense connective tissue, blood vessels, nerves,
and lymphatics (Campbell 1950). They originate from the postero-lateral aspect of the
cervix at the level of the internal cervical os and from the lateral vaginal fornix
(Campbell 1950). Because of their relatively antero-posterior orientation, they are best
seen in the axial scan images. While macroscopic investigation observed insertion of
the ligament to the levator ani, coccygeus, and the presacral fascia (Blaisdell 1917), MRI
examination showed the uterosacral ligaments overlie the sacrospinous ligament and
coccygeus in 82% of the cases and over the sacrum in only 7% of the cases (Umeck et al
2003). The difference between the appearance of these structures in MRI and on
dissection may have to do with the tension placed on the structures during dissection and
will require further research to clarify. The 3-D models from the tracings showed the
uterosacral ligaments to have a “band-like” appearance.
138
This study is unique in its attempt to understand how the orientation of the cardinal and
uterosacral ligaments affects load sharing. It also nicely demonstrates the important
contribution of the levator plate angle to this arrangement. Small changes to the levator
plate angle in the 2-D model changed the tensions on both of the ligaments. The
technique developed in this study of using 3-D measurements and applying them to
simplified biomechanical models is an important tool in furthering our understanding of
pelvic organ support. The limitation is that these are preliminary results which will
likely need refinement. We hope to continue this work in the future.

139
References Blaisdell FE. The anatomy of the sacro-uterine ligaments. Anat Record 1917;
12:1-42.
Campbell, R. M.: The anatomy and histology of the sacrouterine ligaments. American
Journal of Obstetrics & Gynecology, 1950;59: 1
DeLancey, J. O.: Anatomic aspects of vaginal eversion after hysterectomy. American
Journal of Obstetrics & Gynecology, 1992;166: t
Range, R. L. and Woodburne, R. T.: The gross and microscopic anatomy of the transverse
cervical ligaments. American Journal of Obstetrics & Gynecology, 1964;90: 460
Umek WH, Morgan DM, Ashton-Miller JA, DeLancey JO. Quantitative analysis of
uterosacral ligament origin and insertion points by magnetic resonance imaging. Obstet
Gynecol. 2004 Mar;103(3):447-51

140
Appendix B
Vaginal Wall Deformation Estimation Using Non-Rigid Image Registration
ABSTRAT
Anterior compartment support system composed of a variety of structures: levator ani muscle, apical
and paravaginal connective tissue and anterior vaginal wall itself. The unique mechanical properties of
each of these structures form the composite compliance of anterior compartment support in living
women. It would be helpful to be able to associate anterior vaginal wall deformation pattern under
intra-abdominal pressure loading with structural impairment. In this chapter, we present an approach
toward the quantification of anterior vaginal wall deformation via non-rigid registration of serial
dynamic MR images when women perform Valsalva using the framework implemented in the Insight
toolkit. Demons registration method was shown to perform well. This lay the groundwork for more
sophisticated validation of biomechanical modeling using the finite element method.
Introduction The interactions of levator ani muscles, apical connective tissue in the form of the
cardinal and uterosacral ligaments and the connective tissues forming the anterior vaginal
wall combine to form a complicated anterior compartment support system.
By observing from mid-sagittal dynamic MR sequence during Valsalva, we noticed that
the deformations of pelvic floor region are distinguished between women with normal
support and women with AVP. Even within the women with AVP, the deformation
patterns are very different in some from the others.
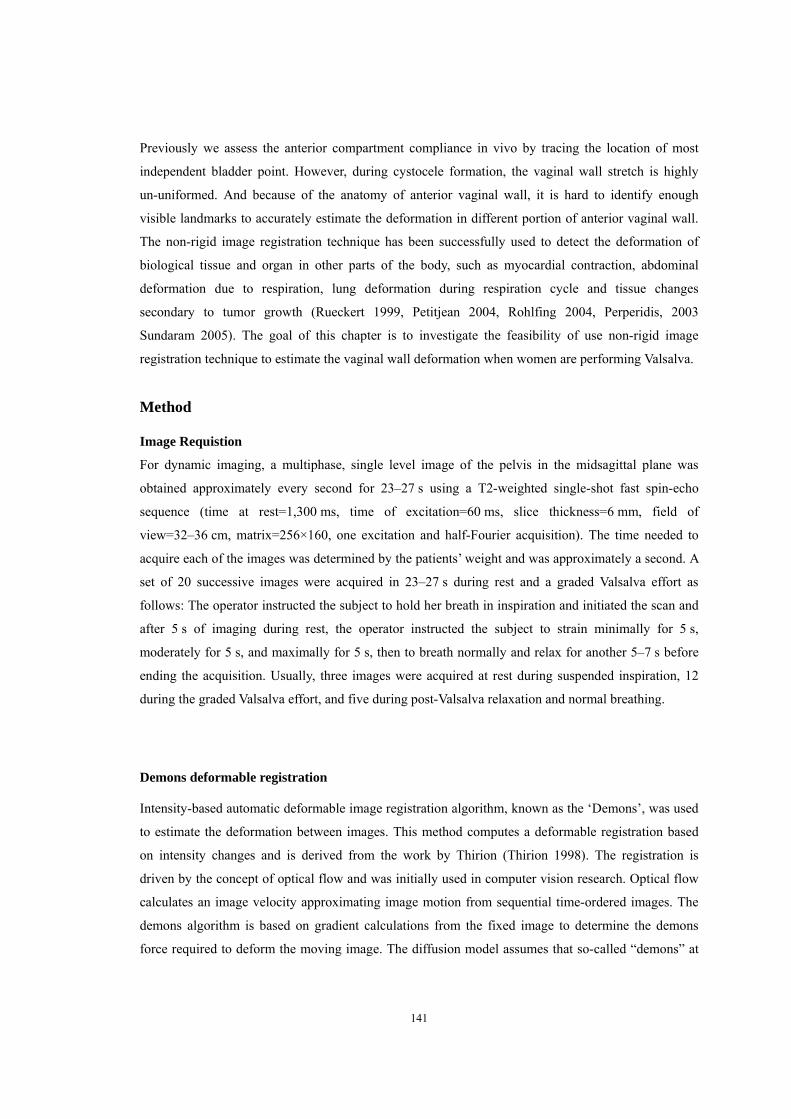
141
Previously we assess the anterior compartment compliance in vivo by tracing the location of most
independent bladder point. However, during cystocele formation, the vaginal wall stretch is highly
un-uniformed. And because of the anatomy of anterior vaginal wall, it is hard to identify enough
visible landmarks to accurately estimate the deformation in different portion of anterior vaginal wall.
The non-rigid image registration technique has been successfully used to detect the deformation of
biological tissue and organ in other parts of the body, such as myocardial contraction, abdominal
deformation due to respiration, lung deformation during respiration cycle and tissue changes
secondary to tumor growth (Rueckert 1999, Petitjean 2004, Rohlfing 2004, Perperidis, 2003
Sundaram 2005). The goal of this chapter is to investigate the feasibility of use non-rigid image
registration technique to estimate the vaginal wall deformation when women are performing Valsalva.
Method Image Requistion
For dynamic imaging, a multiphase, single level image of the pelvis in the midsagittal plane was
obtained approximately every second for 23–27 s using a T2-weighted single-shot fast spin-echo
sequence (time at rest=1,300 ms, time of excitation=60 ms, slice thickness=6 mm, field of
view=32–36 cm, matrix=256×160, one excitation and half-Fourier acquisition). The time needed to
acquire each of the images was determined by the patients’ weight and was approximately a second. A
set of 20 successive images were acquired in 23–27 s during rest and a graded Valsalva effort as
follows: The operator instructed the subject to hold her breath in inspiration and initiated the scan and
after 5 s of imaging during rest, the operator instructed the subject to strain minimally for 5 s,
moderately for 5 s, and maximally for 5 s, then to breath normally and relax for another 5–7 s before
ending the acquisition. Usually, three images were acquired at rest during suspended inspiration, 12
during the graded Valsalva effort, and five during post-Valsalva relaxation and normal breathing.
Demons deformable registration Intensity-based automatic deformable image registration algorithm, known as the ‘Demons’, was used
to estimate the deformation between images. This method computes a deformable registration based
on intensity changes and is derived from the work by Thirion (Thirion 1998). The registration is
driven by the concept of optical flow and was initially used in computer vision research. Optical flow
calculates an image velocity approximating image motion from sequential time-ordered images. The
demons algorithm is based on gradient calculations from the fixed image to determine the demons
force required to deform the moving image. The diffusion model assumes that so-called “demons” at

142
every voxel from the fixed (reference) image are applying forces that push the voxels of the moving
image into matching up with the fixed image. The inputs to the registration are a moving image m and
a fixed image f. The optical flow velocity can then be written as
(7-1)
v is the displacement during the time
interval between the two image frames.
Represents the relationship between the neighboring points in the fixed image (such as an dege), K is
the reciprocal of the diagonal of a pixel and the (m-f) term represents the differential force of the
interaction between the fixed and the moving images. Equation (7-1) is calculated iteratively; after
each iteration, the optical flow computation is followed by regularization of the deformation field
using a Gaussian filter. This method was implemented in ITK. Figure 7-1 showed the framework of
image registration.
Figure B-1 Image registration framework implemented using ITK
Fixed Image
Moving Image
Increment Computation
Interpolator
Resampler Transform
PDE Solver
DeformationField
Moving Registered

143
Result Sequential MR images during one Valsalva loading cycle were registered using Demons algorithm. The previous image was set to be moving image and was registered toward image at later time point. Deformation field was calculated and represented as deformed grid. To validate the registration, anterior vaginal wall at first image was traced. And it was deformed according to calculated deformation field between first and second image, 2’ was the deformation result. As you can see that anterior vaginal wall in 2’ matches well with that in MR image 2. Then sequentially 3’,4’, 5’ was generated by deform anterior vaginal wall based on calculated deformation field. They all match well with that in original MR images.
Figure B-2 First row are the sequential MR images during Valsalva loading cycle. Second role are the calculated deformation field between adjacent images. For example 1-2 means deformation field between image 1 and 2. Third role, first image is the tracing of anterior vagina wall at first image. 2’, 3’, 4’ and 5’ are the calculated location of anterior vaginal wall. Discussion for future work This chapter provided a framework to estimated deformation field of anterior vaginal wall support
system using demons deformable image registration technique. We can assess the system compliance
in different support structure by analyzing the deformation in different region associated with
intra-abdominal pressure. This lay the groundwork for more sophisticated validation of biomechanical
modeling using the finite element method.

144
References
Perperidis, D., Rao, A., Mohiaddin, R., Rueckert, D., 2003. Non-rigid
spatio-temporal alignment of 4D cardiac MR images. In: Gee, J.C.,
Maintz, J.B.A., Vannier, M.W. (Eds.), Proceedings of the 2nd International WBIR, LNCS
2717, pp. 191–200.
Petitjean, F.P.C., Rougon, N., 2004. Building and using a statistical 3d
motion atlas for analyzing myocardial contraction in MRI. In: Proceedings SPIE
Conference on Image Processing – SPIE International Symposium Medical Imaging_04,
San Diego, CA, vol. 5370.
Rohlfing, T., O_Dell Jr., C.R.M.W.G., Zhong, J., 2004. Modeling liver motion and
deformation during the respiratory cycle using intensity-based nonrigid registration of
gated MR images. Med. Phys. 31, 427–432.
Rueckert, D., Sonoda, L.I., Hayes, C., Hill, D.L.G., Leach, M.O.,
Hawkes, D.J., 1999. Nonrigid registration using free-form deformations:
application to breast MR images. IEEE TMI 18 (8), 712–
721.
Sundaram TA, Gee JC. Towards a model of lung biomechanics: pulmonary kinematics
via registration of serial lung images. Medical Image Analysis 2005;9: 524–537
Thirion JP, Image matching as a diffusion process: an analogy with Maxwell's demons,
Medical Image Analysis 1998;2(3):243-60.