Embed Size (px)
Citation preview
Biomass Pretreatment:
What do we really know?
Bradley A. Saville, Ph.D., P.Eng
University of Toronto
Department of Chemical Engineering and Applied Chemistry

Initiated > 100 years ago for P&P
Initially acid pretreatment, followed by steaming
and steam explosion (1920s – Masonite steam
gun)
Pretreatment of cotton with alkaline agents
(Mercerization)
Continuous steam explosion (1970s)
Organosolv (1970s)
Ammonia pretreatment (1970s)
Pretreatment: Role and History

Results in a high recovery of all carbohydrates, with a minimum of degradation products
Low capital and operating cost
Produces a highly digestible solids fraction amenable to enzyme hydrolysis
Minimizes the need for pre- or post-processing, either due to mechanical size reduction or downstream detoxification
Operates at a sufficiently high solids loading to avoid dilution of sugars and ethanol
Able to process a wide variety of feedstocks
Trade-offs required!
Desirable Pretreatment Features

Most of what we “know” about pretreatment comes from small scale batch tests
Often reported as a severity factor:
Log(Ro) = log [t*exp((T – Tref)/14.75)]
Assumes linear kinetics for xylan hydrolysis from aspen, isothermal operation, and no exogenous catalysts
Used widely, and often used incorrectly
More General/Accurate Measure:
Pretreatment “Benchmarks”

The rate of chemical reaction (e.g., xylan
hydrolysis) is controlled by heat and mass
transfer.
HT and diffusion more critical at large scale, and for
larger (or less porous) fibers/chips
Gases more efficient than liquids
But HT, MT, chip size aren’t in “severity factors”
Realistic version accounts for MT, porosity, etc.:
Challenges with Scale-up
pH
T
o eR
10 timeDiffusion
nt timePretreatme 7.14100

Lignin type and structure
Lignin removal
DP of cellulose and hemicellulose
Type of hemicellulose
Acetylation; presence of glucuronic acids, galacturonic acids
Surface area
Cellulose crystallinity
Cellulose activation/reactivity
Key Factors
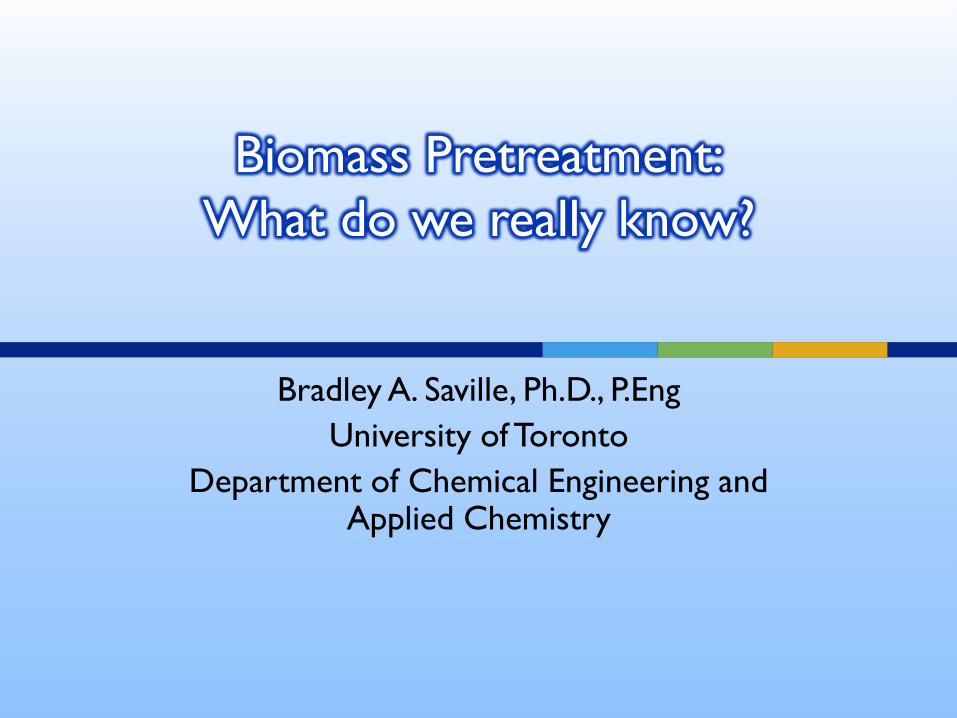
High Severity vs. Low Severity Treatment
PT Affects Fiber Size
Higher Severity
(Fine Fiber)
Lower Severity
(Coarse Fiber)

Effect of Steam PT on Surface Area
and Enzyme Accessibility

Objective
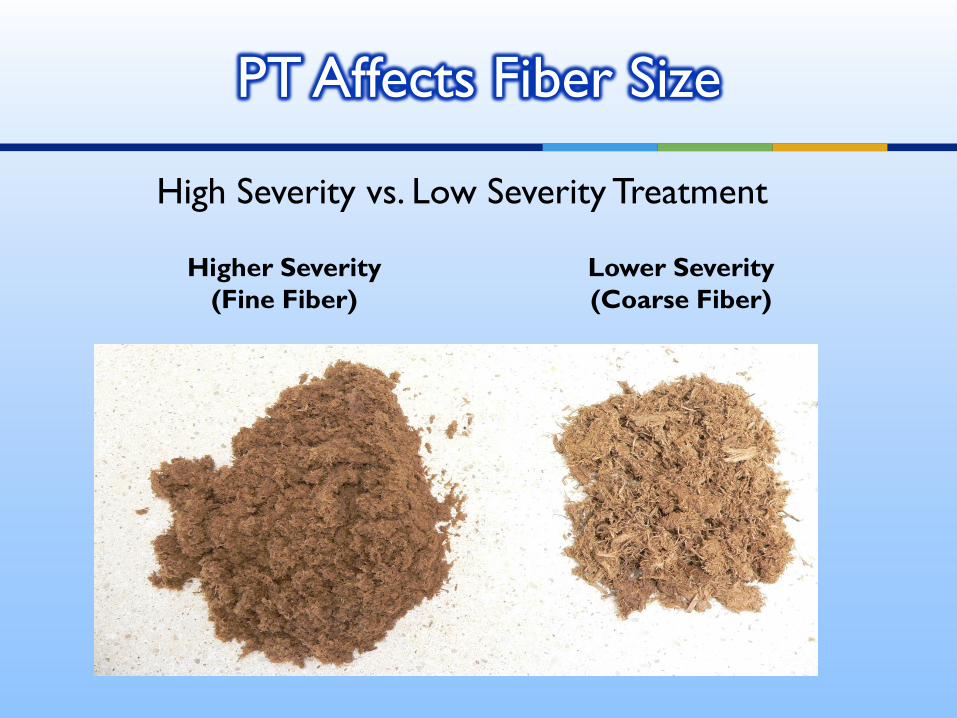
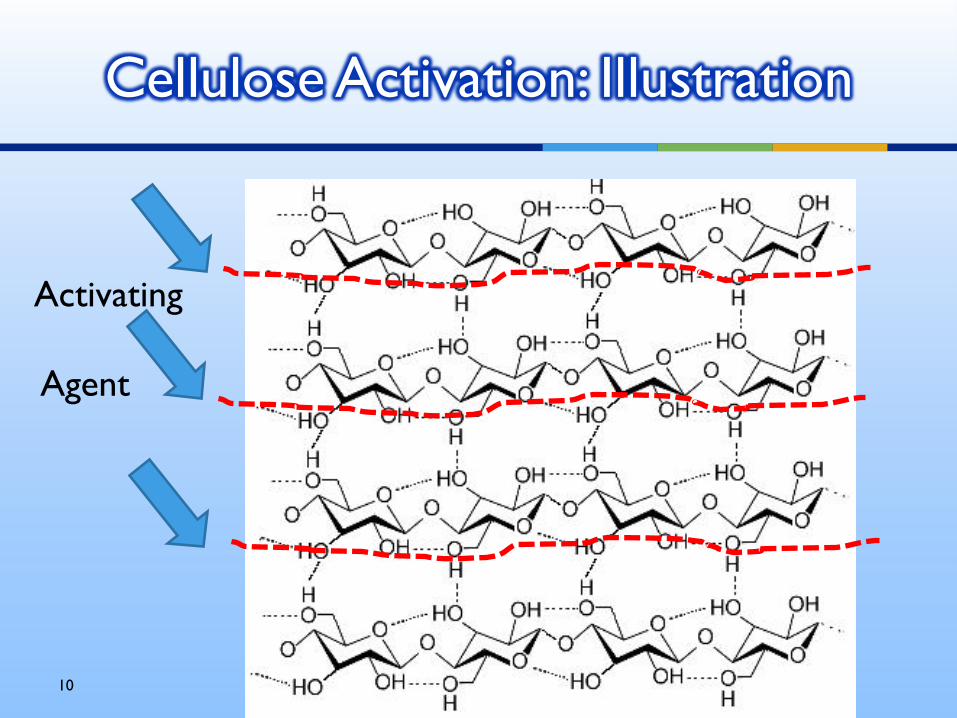
To increase the accessibility to cellulose
supramolecular structure
Means
Inter and intramolecular penetration of
activating agents that disrupt the strong water
mediated H-bonds of the natural cellulose
Cellulose Activation: Definition
10
Cellulose Activation: Illustration
Activating
Agent

Agent-mediated
Ammonia > NaOH > Steam > Hot water
Solvent-mediated
Heat-mediated
Radiation-mediated
Mechanically-mediated
11
Cellulose Activation: Methods
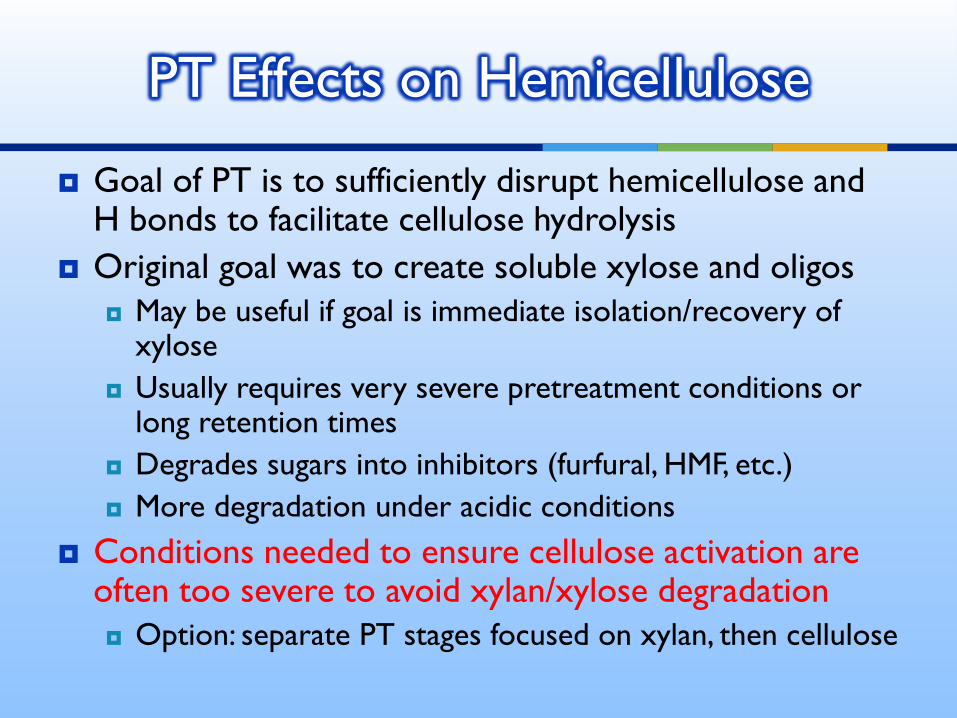
Goal of PT is to sufficiently disrupt hemicellulose and H bonds to facilitate cellulose hydrolysis
Original goal was to create soluble xylose and oligos
May be useful if goal is immediate isolation/recovery of xylose
Usually requires very severe pretreatment conditions or long retention times
Degrades sugars into inhibitors (furfural, HMF, etc.)
More degradation under acidic conditions
Conditions needed to ensure cellulose activation are often too severe to avoid xylan/xylose degradation
Option: separate PT stages focused on xylan, then cellulose
PT Effects on Hemicellulose
13
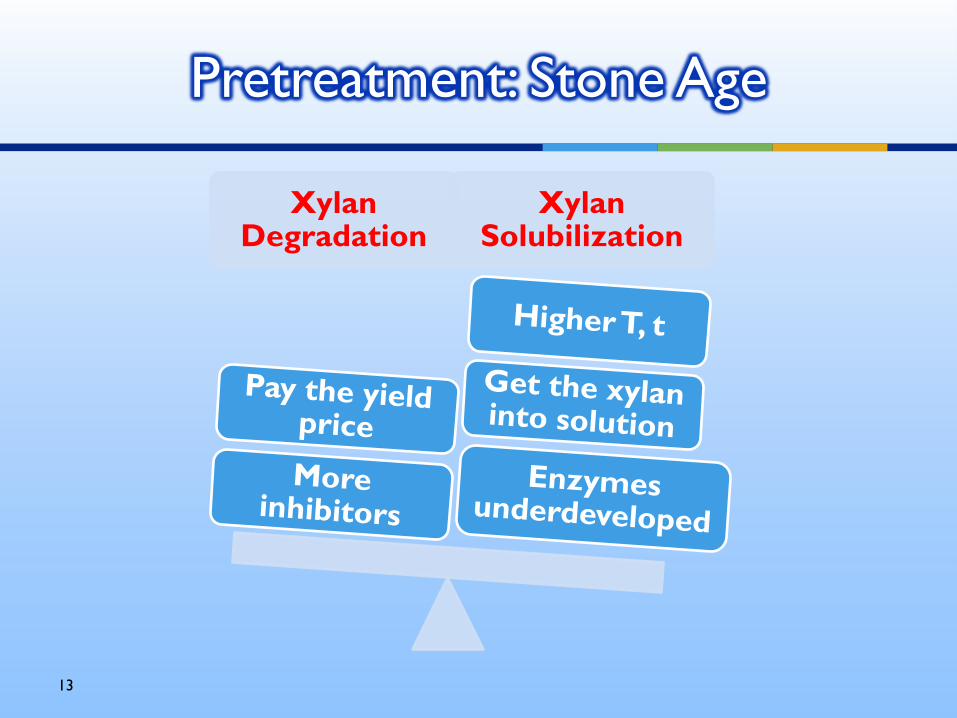
Pretreatment: Stone Age
XylanDegradation
XylanSolubilization

14
Pretreatment: Modern Age
XylanPreservation
XylanHydrolysis

0
2
4
6
8
10
12
14
16
18
20
20
5 -
5.5
20
5 -
4.0
20
0 -
5.5
19
0 -
5.0
18
0 -
5.0
Xy
lan
co
nte
nt
(% D
M)
Xylan
solubles before dAH
solubles after dAH
pretreated material
PT Effects on C5 Solubilization
Pretreatment performance is linked to all
other downstream steps
Cannot be measured in isolation
Need to consider trade-offs in PT vs. trade-offs in
hydrolysis and fermentation to identify a “global”
optimum
PT impacts process in ways that cannot be
analyzed by composition or enzyme hydrolysis,
e.g., slurry viscosity and process hydraulic load
PT Performance

PT Effects on Overall Process
What are the Key Metrics?

PT Trade-offs:
No Free Lunch
Pretreatment Enzyme UseChemical
UseInhibitors
PT
Materials/equipment
costs
Dilute AcidLow to
moderateHigh high High
Ammonia moderatemoderate to
highlow moderate to high
Autohydrolysis
(steam explosion)
Low to
moderateNil low to moderate Moderate
Steam Explosion
with SO2
Low to
moderateHigh moderate to high moderate to high
Solvent Extractionlow to
moderateHigh moderate low to moderate
Hot Water high Nil low low to moderate

PT affects slurry viscosity:
Normal Severity SE
0
0.5
1
1.5
2
2.5
3
3.5
4
00
:00
02
:10
03
:00
03
:50
04
:40
05
:30
06
:20
07
:10
08
:00
08
:50
09
:40
10
:30
11
:20
12
:10
13
:00
13
:50
14
:40
15
:30
16
:30
17
:20
18
:10
19
:00
19
:50
20
:40
21
:30
22
:20
23
:10
Mix
er
Torq
ue
Hydrolysis Time, h
Viscosity Reduction Under Standard Pretreatment Severity
Cocktail A
Cocktail F
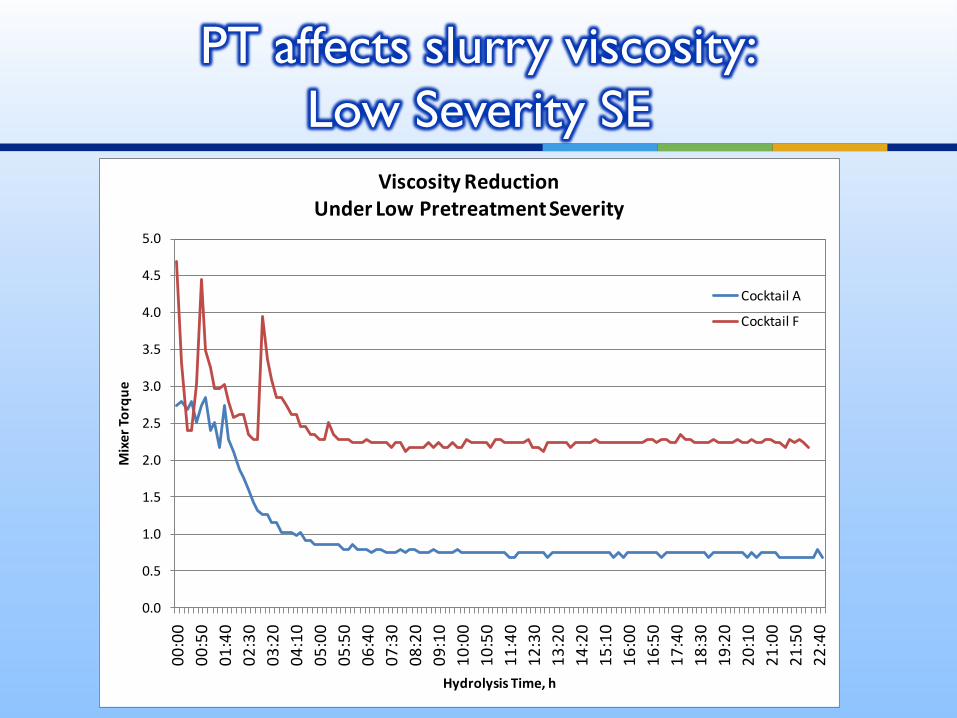
PT affects slurry viscosity:
Low Severity SE
0.0
0.5
1.0
1.5
2.0
2.5
3.0
3.5
4.0
4.5
5.0
00
:00
00
:50
01
:40
02
:30
03
:20
04
:10
05
:00
05
:50
06
:40
07
:30
08
:20
09
:10
10
:00
10
:50
11
:40
12
:30
13
:20
14
:20
15
:10
16
:00
16
:50
17
:40
18
:30
19
:20
20
:10
21
:00
21
:50
22
:40
Mix
er
Torq
ue
Hydrolysis Time, h
Viscosity Reduction Under Low Pretreatment Severity
Cocktail A
Cocktail F

0.0
0.5
1.0
1.5
2.0
2.5
3.0
Dilute acid Hot water AFEX ARP Lime Steam Explosion
kWh
/USG
PT Impact on Overall Process
Electricity Use

PT Impact on Overall Process Thermal
Energy Demand
0
20,000
40,000
60,000
80,000
100,000
120,000
140,000
160,000
Dilute acid Hot water AFEX ARP Lime Steam Explosion
BTU
/USG
Effect of Pretreatment Technology on Thermal Energy
Demand for Cellulosic Ethanol

-20%
0%
20%
40%
0 20 40 60 80 100
Av
era
ge
An
nu
na
l R
OI
Feedstock Price ($/tonne)
Ag Residue Steam Explosion Ag Residue Acid
Ag Residue Ammonia
PT affects Process Economics
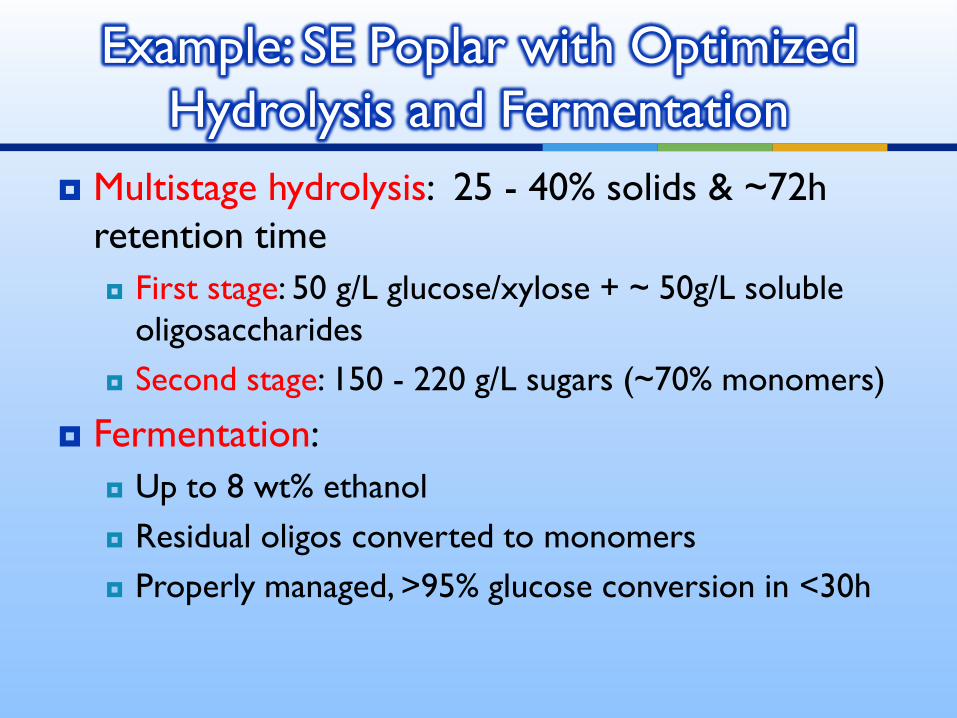
Multistage hydrolysis: 25 - 40% solids & ~72h
retention time
First stage: 50 g/L glucose/xylose + ~ 50g/L soluble
oligosaccharides
Second stage: 150 - 220 g/L sugars (~70% monomers)
Fermentation:
Up to 8 wt% ethanol
Residual oligos converted to monomers
Properly managed, >95% glucose conversion in <30h
Example: SE Poplar with Optimized
Hydrolysis and Fermentation

Multitude of PT Options under development
Match to process/product/co-product objectives
Still a lot to be learned
Not easy to translate lab results into pilot performance
Need to use overall process metrics – consider downstream effects
Consider trade-offs between cost, chemical use, enzyme use, rate and yield
Avoid extra “clean-up” steps if possible
Summary
Scale and solids loading are critical
Pre-treatment:
affects slurry viscosity
affects xylan solubilization and xylose degradation
affects yield
affects enzyme use and hydrolysis rate
affects ethanol titer
Affects ECONOMICS!
Implications for Pretreatment

Thank You!
Questions?
Should be a means to account for heat
transfer, mass transfer, diffusion, solubility and
substrate reactivity – all factors that dictate
the effectiveness of a pretreatment
Simplified models exclude key parameters
For example, chip size is not present in any of
the severity factor equations, yet it is well
known that larger chips require a “more
severe” pretreatment than smaller chips
What is a severity factor, really?

Log(Ro) = log [t*exp((T – Tref)/14.75)]
Ro = “reaction ordinate”
14.75 = constant based on reaction and species
t = reaction time, min
T = temperature
Tref = reference temperature (100C)
Assumes linear reaction kinetics, isothermal
operation, and no exogenous catalysts
Used most often, and often used incorrectly
PT Severity Factor

wo = characteristic reaction parameter
= RTref/EA = w/T
Activation energy (EA) is depends on substrate, desired reaction, and presence of catalysts or solvents
T can now vary with time – important for batch processes with heat-up and cool-down time (reactions continue!)
PT Severity Factor: V2

w = 14.75 for hemicellulose solubilization
from hardwoods
w = 10 for lignin solubilization during acid-
catalyzed organosolv PT of aspen
w = 11 for xylan solubilization during acid-
catalyzed organosolv PT of aspen
Changing w from 14.75 to 11 increases Ro ten-
fold, and log(Ro) by 1
MUST adapt w to pretreatment process and
feedstock
PT Severity Factor: V2

Versions thus far assume biomass is homogeneous (really!)
Account for this with a heterogeneity parameter, g, based upon the shape/distribution of the activation energy curves for the heterogeneous feedstock
g = 1 for a homogeneous system
g depends on feedstock, reaction, presence of catalysts, etc.
PT Severity Factor: V3

See Hosseni and Shah (cited earlier)
Considered time-dependent gradients, diffusional
effects, reaction kinetics
Applies Fick’s law, Re, Sc, Gr, and fundamental
kinetics
Includes porosity of fiber
Suggested modified severity factor considering
time constants for diffusion and pretreatment
Alternate view on pretreatment
severity
pH
T
o eR
10 timeDiffusion
nt timePretreatme 7.14100
Proliferation of incorrectly developed severity
factors makes it an unreliable means to
compare pretreatment processes, feedstocks,
the impact or value of catalysts or solvents
Severity factors
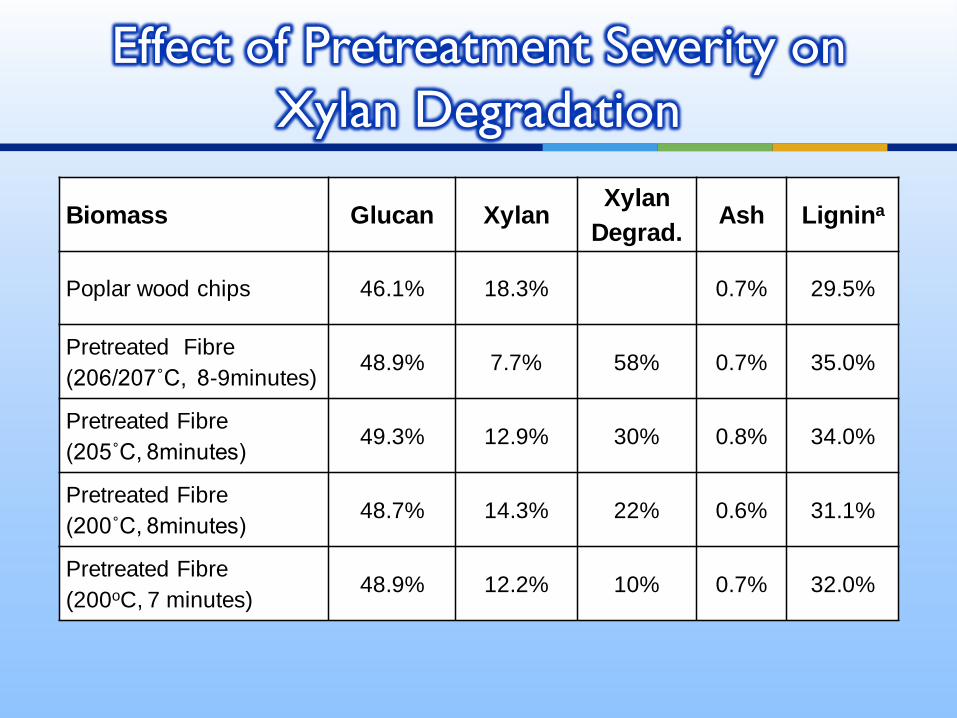
Biomass Glucan XylanXylan
Degrad.Ash Lignina
Poplar wood chips 46.1% 18.3% 0.7% 29.5%
Pretreated Fibre
(206/207˚C, 8-9minutes)48.9% 7.7% 58% 0.7% 35.0%
Pretreated Fibre
(205˚C, 8minutes)49.3% 12.9% 30% 0.8% 34.0%
Pretreated Fibre
(200˚C, 8minutes)48.7% 14.3% 22% 0.6% 31.1%
Pretreated Fibre
(200oC, 7 minutes)48.9% 12.2% 10% 0.7% 32.0%
Effect of Pretreatment Severity on
Xylan Degradation
References:
L. da Costa Sousa et al., Curr. Opin. Biotechnol., 2009, vol 20, 339-347
Hendriks and Zeeman, 2009, Bioresource Technolvol 100, 10-18
Hosseini and Shah, 2009, Bioresource Technol, 100, 2621-2628
G. Hu et al., Bioresources, 2008, vol 3(1), 270-254.
B.A. Saville, in Plant Biomass Conversion, Ch 9; (Hood, Nelson, Powell (eds)
Yang and Wyman, BioFPR, 2008, vol 2, 26-40
Pretreatment: References