Embed Size (px)
Citation preview

C4
00
U2
01
01
ADDITIONAL MATERIALS
In addition to this examination paper you will require, a calculator and a ruler. A Resource Booklet for use with Section B.
INSTRUCTIONS TO CANDIDATES
Use black ink or black ball-point pen.Write your name, centre number and candidate number in the spaces at the top of this page.Answer all questions.Write your answers in the spaces provided in this booklet.
INFORMATION FOR CANDIDATES
This paper is in 2 sections, A and B.Section A: 45 marks. Answer all questions. You are advised to spend about 50 minutes on this section.Section B: 15 marks. Read the article in the resource booklet carefully then answer all questions. You are advised to spend about 25 minutes on this section.The number of marks is given in brackets at the end of each question or part-question.The assessment of the quality of extended response (QER) will take place in question 5(b).
VP*(S19-C400U20-1)© WJEC CBAC Ltd.
Surname
Other Names
CandidateNumber
0
CentreNumber
GCSE
C400U20-1
BIOLOGY – Component 2Applications in Biology
FOUNDATION TIER
FRIDAY, 7 JUNE 2019 – AFTERNOON
1 hour 15 minutes
S19-C400U20-1
For Examiner’s use only
Question MaximumMark
MarkAwarded
Section A 1. 7
2. 10
3. 10
4. 10
5. 8
Section B 6. 15
Total 60

2
(C400U20-1)
Examineronly
© WJEC CBAC Ltd.
SECTION A
Answer all questions.
1. The photograph below shows a cross section through an artery and a vein taken through a microscope.
X
Y
Artery
Vein
(a) (i) Complete the plan drawing below by completing the wall of the artery. The vein has been done for you. [1]

(C400U20-1) Turn over.
C4
00
U2
01
03
3Examiner
only
© WJEC CBAC Ltd.
(ii) Explain how the structure of the artery, as shown in the photograph, is adapted for its function in the circulatory system. [2]
(iii) State the name of the structures inside the veins, not shown in the photograph, which enable veins to function in the circulatory system. [1]
. . . . . . . . . . . . . . . . . . . . . . . . . . . . . . . . . . . . . . . . . . . . . . . . . . . . . . . . . . . . . . . . . . . . . . . . . . . . . . . . . . . . . . . . . . . . . . . . . . . . . . .
(b) (i) Measure the width of the vein along the line X – Y in the photograph. [1]
. . . . . . . . . . . . . . . . . . . . . . . . . . . . . . . . . . . . . . . . . . . . . . . . . . . mm
(ii) The actual width of the vein shown in the photograph is 0.4 mm. Using this and your measurement for X – Y, calculate the magnification of the photograph. [2]
Magnification of the photograph = × . . . . . . . . . . . . . . . . . . . . . . . . . . . . . . . . . . . . . . . . . . . . . . . . . . .
7

4
(C400U20-1)© WJEC CBAC Ltd.
2. (a) Some students extracted DNA from a sample of living plant cells.
The flow diagram summarises the method the students used.
Stage 1
Select a sample of living plant material and break down the cells and tissues in the sample.
Stage 2
Add an extraction liquid to extract the DNA in the sample.
Stage 4
Add ethanol to the filtrate and observe the result.
Stage 3
Filter the sample
filter funnel
residuefilter paper
conical flask
filtrate
(C400U20-1) Turn over.
C4
00
U2
01
05
5Examiner
only
© WJEC CBAC Ltd.
(i) Describe a method they could use in stage 1 to break down the cells of the plant material and state why this would be necessary. [2]
(ii) State what is added to a solution of salt to make up the extraction liquid used in stage 2. [1]
(iii) State the purpose of filtering the sample in stage 3. [1]
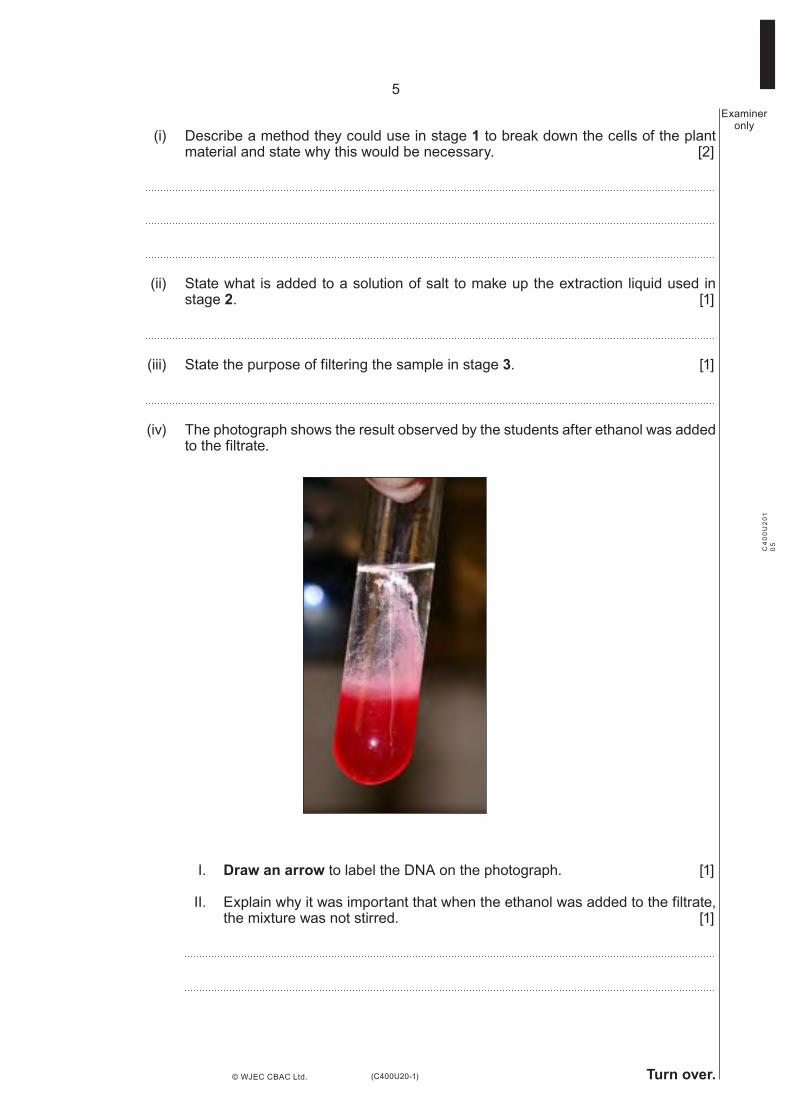
(iv) The photograph shows the result observed by the students after ethanol was added to the filtrate.
I. Draw an arrow to label the DNA on the photograph. [1]
II. Explain why it was important that when the ethanol was added to the filtrate, the mixture was not stirred. [1]
6
(C400U20-1)
Examineronly
© WJEC CBAC Ltd.
10
(b) Explain why DNA can be obtained from white blood cells but not from red blood cells. [2]
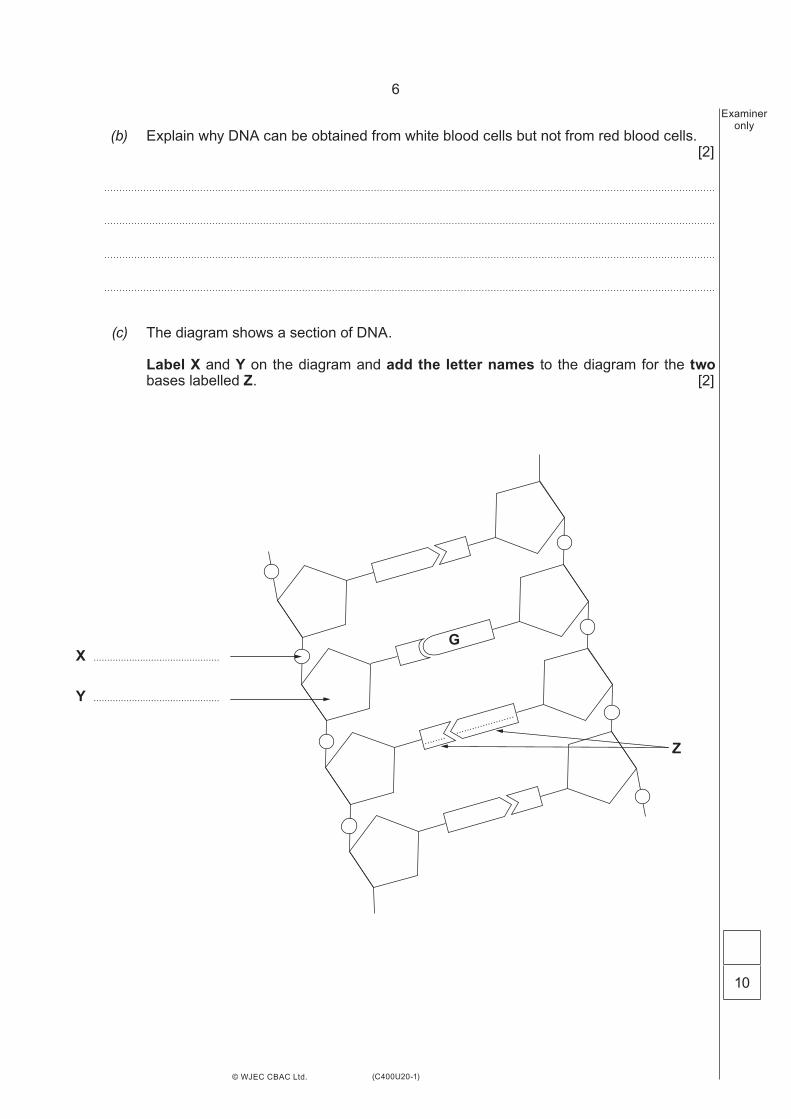
(c) The diagram shows a section of DNA.
Label X and Y on the diagram and add the letter names to the diagram for the two bases labelled Z. [2]
X . . . . . . . . . . . . . . . . . . . . . . . . . . . . . . . . . . . . . . . . . . . . . .
Y . . . . . . . . . . . . . . . . . . . . . . . . . . . . . . . . . . . . . . . . . . . . . .
Z
G
.. . . . . .. . . . . . .
. . . . . . ..
. . . . . . ..

(C400U20-1) Turn over.
C4
00
U2
01
07
7
© WJEC CBAC Ltd.
BLANK PAGE

8
(C400U20-1)© WJEC CBAC Ltd.
Examineronly
3. Decomposers in the soil produce the enzyme urease and cause decay. Urease breaks down urea to ammonia. An indicator solution can be used to show this.
urea ammoniaurease
indicator colour RED indicator colour BLUE
Some students investigated the effect of temperature on the activity of urease, using the apparatus shown in the diagram, at a range of temperatures between 30 °C and 70 °C.
They added red indicator solution and recorded the time taken for the colour to become blue. From this they were able to calculate the rate of urease activity.
thermometer
beaker of water
boiling tube with 2.5 cm3 urea solution 10 cm3 urease solution
(a) State the name of the laboratory apparatus used by the students to measure the time taken, in seconds, for the indicator to change colour. [1]
. . . . . . . . . . . . . . . . . . . . . . . . . . . . . . . . . . . . . . . . . . . . . . . . . . . . . . . . . . . . . . . . . . . . . . . . . . . . . . . . . . . . . . . . . . . . . . . . . . .
(b) The results of the investigation are shown in the table below.
Temperature(°C) Rate of activity of urease (a.u.)
30 3840 6550 9060 9965 4270 12

(C400U20-1) Turn over.
9Examiner
only
© WJEC CBAC Ltd.
50
0
10
20
30
40
60
70
80
90
100
20 30 40 50 60 70 80
(i) Draw a graph of the results on the grid below by:
I. plotting the results; [2]
II. joining your plots with a suitable line. [1]
Temperature (°C)
Rate of Urease activity(a.u.)
C4
00
U2
01
09

10
(C400U20-1)
Examineronly
© WJEC CBAC Ltd.
10
Use your graph to answer the questions.
(ii) Describe the effect of increasing temperature on the activity of urease. [1]
(iii) State the optimum temperature for urease and explain your answer. [2]
(iv) State one way in which the students could have improved their investigation to make sure it was a fair test. [1]
(c) (i) Describe one way in which the students could increase the strength of the evidence in their results. [1]
(ii) Suggest one improvement they could make to enable them to control the independent variable in the investigation more effectively. [1]

(C400U20-1) Turn over.
11
© WJEC CBAC Ltd.
Examineronly
4. For her school project, Sonja investigated reaction times in a group of 16-year-old students using a 30 cm ruler. She thought their reactions would become better with practice.
She asked each of them to place their right forearm on a table in a quiet room as shown in the diagram. They placed their fingers and thumbs a short distance away from the ruler which she was holding.
ruler
When Sonja dropped the ruler, the student’s task was to catch it as quickly as possible. She noted the point where the student caught the ruler to the nearest centimetre, (the catching distance).
The shorter the catching distance the shorter the reaction time would be.
(a) State the hypothesis that Sonja was testing in her investigation. [1]

12
(C400U20-1)
Examineronly
© WJEC CBAC Ltd.
(b) Suggest the number of students Sonja should involve in her investigation and how many attempts at the task each student should have, giving reasons. [2]
(i) Number of students . . . . . . . . . . . . . . . . . . . . . . . . . . . . . . . . . . . . . . . . . . . . . . . . . . . . . . . . . . . . . . . . . . . .
Reason . . . . . . . . . . . . . . . . . . . . . . . . . . . . . . . . . . . . . . . . . . . . . . . . . . . . . . . . . . . . . . . . . . . . . . . . . . . . . . . . . . . . . . . . . . . . . . . . . . . . . . . . . . . . . . . . . . . . . . . . . . . . . . . . . . . . . . . . . . . . . . . . . . . . . . . . . . . . . . . . . . . . . . . . . . . .
(ii) Number of attempts at the task . . . . . . . . . . . . . . . . . . . . . . . . . . . . . . . . . . . . . . . . . . . . . . . . . . . . . . . . . . . . . . . . . . . .
Reason . . . . . . . . . . . . . . . . . . . . . . . . . . . . . . . . . . . . . . . . . . . . . . . . . . . . . . . . . . . . . . . . . . . . . . . . . . . . . . . . . . . . . . . . . . . . . . . . . . . . . . . . . . . . . . . . . . . . . . . . . . . . . . . . . . . . . . . . . . . . . . . . . . . . . . . . . . . . . . . . . . . . . . . . . . . .
(c) The diagrams show an attempt by one student.
01
23
45
6
01
23
45
68
910
7 Point from where measurement was taken
BEFORE ruler was dropped AFTER ruler was caught
(i) State the catching distance, shown in the photograph. [1]
. . . . . . . . . . . . . . . . . . . . . . . . . . . . . . . . . . . . . . . . . . . . . . . . . . . . . . . . . cm
(ii) Give one source of error in the way Sonja used the ruler for her measurements. [1]

(C400U20-1) Turn over.
13Examiner
only
© WJEC CBAC Ltd.
10
(d) The sketch graph below shows the results for a similar investigation of reaction time, carried out by sports scientists with students aged 19 – 25.
(i) Complete the sketch graph by adding a dashed line, as shown in the key, for the catching distance in the investigation. [1]
(ii) Evaluate whether these results support Sonja’s hypothesis. Explain your answer. [2]
(e) The fastest reactions in the human body are reflexes. State one property of reflexes, other than speed and give one example of a reflex action. [2]
Property . . . . . . . . . . . . . . . . . . . . . . . . . . . . . . . . . . . . . . . . . . . . . . . . . . . . . . . . . . . . . . . . . . . . . . . . .
Example . . . . . . . . . . . . . . . . . . . . . . . . . . . . . . . . . . . . . . . . . . . . . . . . . . . . . . . . . . . . . . . . . . . . . . . . . . . . . . . . . . . . . . . . . . . . . . . . . . . . . . . . . . . . . . . . . . . . . . . . . . . . . . . . . . . . . . . . . . . . . . . . . . . . . . . . . . . . . . . . . . . . . . . . . . . . . . . . . . . . . . .
Speed of reaction
Catching distance
Keyspeed of reactioncatching distance
Number of attempts at the task

14
(C400U20-1)
Examineronly
© WJEC CBAC Ltd.
5. Sea holly (Eryngium maritimum) grows in coastal areas and on beaches in many areas of the UK. Insects feed on nectar from its flowers and like many other coastal species, the sharp spines and thick leaf cuticles deter herbivores.
Iqbal investigated the abundance of sea holly on a beach. He compared an exposed area of the beach with a sheltered area, both of which measured 45 m × 40 m.
(a) Iqbal carried out a risk assessment of this investigation before he began the work.
Complete the table below to identify one of the hazards which he should take into account. [2]
Hazard Risk Control measure
.. . . . . . . . . . . . . . . . . . . . . . . . . . . . . . . . . . . . . . . . . . . . . . . . . . . . . . . . . . . . . . . . . . . . . . . . . . . . . . . . . . . . . . . . . . . . . . . . . . . . . . . . . . . . . . . . . . . . . . . . . . . . . . . . . . . . . . . . . . . . . . . . . . . . . . . . . . . . . . . . . . . . . . . . . . . . . . . . . . . . . . . . . . . . . . . . . . . . . . . . . . . . . . . . .

(C400U20-1) Turn over.
15Examiner
only (b) Describe how he could carry out his investigation using 1 m2 quadrats. [6 QER]
© WJEC CBAC Ltd.
8

16
(C400U20-1)
Examineronly
SECTION B
Read the article in the resource booklet carefully and answer all the questions that follow.
6. (a) (i) State what is meant by biodiversity. [1]
(ii) Give two examples of why biodiversity is important to humans. [2]
(iii) Give an example of how biodiversity can be protected. [1]
(b) (i) Explain how algae provide energy for coral polyps. [2]
(ii) Suggest why corals can survive for a while after the algae have been expelled. [1]
(iii) Using information from the map, calculate the number of coral reefs in the Northern sector of the Queensland coast which were severely bleached in April 2016. [2]
Number of reefs = . . . . . . . . . . . . . . . . . . . . . . . . . . . . . . . . . . . . . . . . . . . . . . . . .
© WJEC CBAC Ltd.

(C400U20-1)
17Examiner
only (iv) Using the diagram and graph, suggest why coral bleaching has occurred more
often since 2000 compared to before 1980. [3]
(v) Suggest why it is important that scientists monitor sea temperatures over a long period of time. [1]
(c) State what is meant by ‘alien weeds’ and explain why they ‘blanketed the wetland and squeezed out native species’. [2]
END OF PAPER
© WJEC CBAC Ltd.
15

BLANK PAGE
(C400U20-1)
18
© WJEC CBAC Ltd.

BLANK PAGE
(C400U20-1)
19
© WJEC CBAC Ltd.

VP*(S19-C400U20-1A-R1)© WJEC CBAC Ltd.
GCSE
C400U20-1A
BIOLOGY – Component 2Applications in Biology
FOUNDATION TIER
FRIDAY, 7 JUNE 2019 – AFTERNOON
RESOURCE BOOKLET for use in Section B
S19-C400U20-1A-R1

(C400U20-1A-R1)
2
© WJEC CBAC Ltd.
Coral Bleaching and the Great Barrier Reef
A coral reef is an area of coral that lies beneath the surface of water. Coral reefs provide a habitat for a third of all marine biodiversity. They also provide coastal protection from big waves, storms and floods.
A coral reef is made up of many polyps. Polyps are sac-like animals each with a set of tentacles surrounding a central mouth opening. The polyps secrete a hard shell-like outer skeleton that over time forms the reef. Most corals obtain approximately 90% of their energy, from algae that live inside their tissues.
Coral bleaching occurs when coral polyps expel the algae that live inside their tissues. Bleached corals continue to live, but will soon starve unless they are re-colonised by algae. Before 1980 coral bleaching occurred once every 25-30 years. It now occurs approximately every six years.
Coral bleaching may be caused by a number of factors such as:
• increased water temperatures • increased sedimentation (silt from costal run-off) • bacterial infection • ocean acidification due to increased atmospheric carbon dioxide levels • pesticide run-off from farms • fertiliser run-off from farms.
Diagram showing effects of changing sea temperature on coral.
Water temperature rises above the mean for a long period of time
Water temperature returns to the mean
Healthy coral Bleached coral
Algae incoral tissue
Algae expelled fromcoral tissue
Days - Weeks
Weeks - Months
Keyalgae
coral polyp

(C400U20-1A-R1)
3
© WJEC CBAC Ltd.
+ 2°
+ 1.5°
+ 1°
+ 0.5°
0°
- 0.5°
- 1°
- 1.5°1900 1920 1940 1960 1980 2000 2016
Temperatureabove mean
Temperaturebelow mean
Year
Mean temperature
Cooler or warmer than average (°F)
The Great Barrier Reef is located 20 km off the Queensland coast of Australia.About 10 million tonnes of sediment from farms wash on to the reef each year. In recent years, efforts have been made to restore coastal wetlands because they filter out the sediments before they reach the sea.
One example of wetland restoration has been carried out at Mungalla Station, a cattle farm on the north-eastern Queensland coast. A section of the farm along the coast has been allowed to grow wild. Conservationists also removed a sea wall, built in the 1940s to stop the tide from coming in. Alien weeds, that had blanketed the wetlands and squeezed out native species, now could not tolerate the salinity of the incoming seawater and died. Water quality has improved because there are fewer bacteria feeding on the rotting weeds and so the oxygen content of the water has increased. Fish and crocodiles are now beginning to return to the wetlands of Mungalla station.
Northern Sector: 522 reefs surveyed81% severely bleached;<1% not bleached.
Central Sector: 226 reefs surveyed33% severely bleached;<10% not bleached.
Southern Sector: 163 reefs surveyed1% severely bleached;<25% not bleached.
Queensland
Australia
Graph – Comparison of sea temperature in March around the Great Barrier Reef compared to the annual mean sea temperature from 1900 to 2016
Map – Great Barrier Reef showing results of aerial surveys for 911 reefs in April 2016.