Embed Size (px)
Citation preview

University of Birmingham
Biological variation of measured and estimatedglomerular filtration rate in patients with chronickidney diseaseRowe, Ceri; Sitch, Alice; Barratt, Jonathan; Brettell, Elizabeth; Cockwell, Paul; Dalton, Neil;Deeks, Jonathan; Eaglestone, Gillian; Pellatt-Higgins, Tracy; Kalra, Philip A.; Khunti,Kamlesh; Loud, Fiona; Morris, Frances; Ottridge, Ryan; Stevens, Paul E.; Sharpe, Claire C;Sutton, Andrew; Taal, Maarten W.; Lamb, Edmund J.; eGFR-C study groupDOI:10.1016/j.kint.2019.02.021
License:Creative Commons: Attribution-NonCommercial-NoDerivs (CC BY-NC-ND)
Document VersionPeer reviewed version
Citation for published version (Harvard):Rowe, C, Sitch, A, Barratt, J, Brettell, E, Cockwell, P, Dalton, N, Deeks, J, Eaglestone, G, Pellatt-Higgins, T,Kalra, PA, Khunti, K, Loud, F, Morris, F, Ottridge, R, Stevens, PE, Sharpe, CC, Sutton, A, Taal, MW, Lamb, EJ &eGFR-C study group 2019, 'Biological variation of measured and estimated glomerular filtration rate in patientswith chronic kidney disease', Kidney International, vol. 96, no. 2, pp. 429-435.https://doi.org/10.1016/j.kint.2019.02.021
Link to publication on Research at Birmingham portal
General rightsUnless a licence is specified above, all rights (including copyright and moral rights) in this document are retained by the authors and/or thecopyright holders. The express permission of the copyright holder must be obtained for any use of this material other than for purposespermitted by law.
•Users may freely distribute the URL that is used to identify this publication.•Users may download and/or print one copy of the publication from the University of Birmingham research portal for the purpose of privatestudy or non-commercial research.•User may use extracts from the document in line with the concept of ‘fair dealing’ under the Copyright, Designs and Patents Act 1988 (?)•Users may not further distribute the material nor use it for the purposes of commercial gain.
Where a licence is displayed above, please note the terms and conditions of the licence govern your use of this document.
When citing, please reference the published version.
Take down policyWhile the University of Birmingham exercises care and attention in making items available there are rare occasions when an item has beenuploaded in error or has been deemed to be commercially or otherwise sensitive.
If you believe that this is the case for this document, please contact [email protected] providing details and we will remove access tothe work immediately and investigate.
Download date: 14. Jun. 2020
brought to you by COREView metadata, citation and similar papers at core.ac.uk
provided by University of Birmingham Research Portal

Accepted Manuscript
Biological variation of measured and estimated glomerular filtration rate in patientswith chronic kidney disease
Ceri Rowe, Alice J. Sitch, Jonathan Barratt, Elizabeth A. Brettell, Paul Cockwell,R Neil Dalton, Jon J. Deeks, Gillian Eaglestone, Tracy Pellatt-Higgins, Philip A.Kalra, Kamlesh Khunti, Fiona C. Loud, Frances S. Morris, Ryan S. Ottridge, Paul E.Stevens, Claire C. Sharpe, Andrew J. Sutton, Maarten W. Taal, Edmund J. Lamb, onbehalf of the eGFR-C study group
PII: S0085-2538(19)30274-1
DOI: https://doi.org/10.1016/j.kint.2019.02.021
Reference: KINT 1561
To appear in: Kidney International
Received Date: 28 November 2018
Revised Date: 13 February 2019
Accepted Date: 21 February 2019
Please cite this article as: Rowe C, Sitch AJ, Barratt J, Brettell EA, Cockwell P, Dalton RN, Deeks JJ,Eaglestone G, Pellatt-Higgins T, Kalra PA, Khunti K, Loud FC, Morris FS, Ottridge RS, Stevens PE,Sharpe CC, Sutton AJ, Taal MW, Lamb EJ, on behalf of the eGFR-C study group, Biological variationof measured and estimated glomerular filtration rate in patients with chronic kidney disease, KidneyInternational (2019), doi: https://doi.org/10.1016/j.kint.2019.02.021.
This is a PDF file of an unedited manuscript that has been accepted for publication. As a service toour customers we are providing this early version of the manuscript. The manuscript will undergocopyediting, typesetting, and review of the resulting proof before it is published in its final form. Pleasenote that during the production process errors may be discovered which could affect the content, and alllegal disclaimers that apply to the journal pertain.

MANUSCRIP
T
ACCEPTED
ACCEPTED MANUSCRIPT
CONCLUSION:
Biological variation of measured and estimated glomerular filtration rate in patients with chronic kidney disease
For estimated GFR an approximately 14% decline would be considered significant (95% certainty), compared to an approximately 18% decline in measured GFR Rowe et al, 2019
one78% (105)
20 CKD G3 patientsnephrology outpatients10 female, 10 malemedian age 71 years
Log
conc
entr
atio
n
Time after injection
Co
k
GFR= k x Co
Measured (iohexol) and estimated GFR over 4 consecutive weeks
Measured or estimated GFR
Within-subject biological variability
Iohexol clearance 6.7%
MDRD 5.0%
CKD-EPIcreatinine 5.3%
CKD-EPIcystatinC 5.3%
CKD-EPIcreatinine+cystatinC 5.0%

MANUSCRIP
T
ACCEPTED
ACCEPTED MANUSCRIPT
1
[QUERY TO AUTHOR: title and abstract rewritten by Edito rial Office – not subject to change] Biological variation of measured and estimated glomerular filtration rate in patients with chronic kidney disease.
Ceri Rowe,1* Alice J Sitch,2, 3* Jonathan Barratt,4 Elizabeth A Brettell,5 Paul Cockwell,6 R
Neil Dalton,7 Jon J Deeks,2, 3, 5 Gillian Eaglestone,8 Tracy Pellatt-Higgins,9 Philip A Kalra,10
Kamlesh Khunti,11 Fiona C Loud,12 Frances S Morris,8 Ryan S Ottridge,5 Paul E Stevens,8
Claire C Sharpe,13 Andrew J Sutton,14 Maarten W Taal,15 Edmund J Lamb,1** on behalf of
the eGFR-C study group.
*joint first authors
**corresponding author
1Clinical Biochemistry, East Kent Hospitals University NHS Foundation Trust, Canterbury,
Kent, CT1 3NG, UK, 2Test Evaluation Research Group, University of Birmingham,
Birmingham B15 2TT, UK, 3NIHR Birmingham Biomedical Research Centre, University of
Birmingham and University Hospitals Birmingham NHS Foundation Trust, B15 2TT, UK
4University Hospitals of Leicester, 5Birmingham Clinical Trials Unit, Institute of Applied
Health Research, University of Birmingham, Birmingham B15 2TT UK, 6Renal Medicine,
Queen Elizabeth Hospital Birmingham and Institute of Inflammation and Ageing,
University of Birmingham, Birmingham B15 2TT UK, 7Evelina London Children’s Hospital,
London SE1 7EH, 8Kent Kidney Care Centre, East Kent Hospitals University NHS
Foundation Trust, Canterbury, Kent, CT1 3NG, UK, 9Centre for Health Services Studies,
University of Kent, Canterbury, CT2 7NF, UK, 10Salford Royal NHS Foundation Trust,
Salford, M6 8HD, UK 11University of Leicester, 12Kidney Care UK, 3 The Windmills, Turk
Street, Alton, Hampshire, GU34 1EF, UK, 13King's College London & King's College
Hospital NHS Foundation Trust, London, SE5 9RJ, 14Leeds Institute of Health Sciences,
University of Leeds, Leeds, LS2 9JT, 15Royal Derby Hospital, Uttoxeter Road, Derby,
DE22 3NE, UK.

MANUSCRIP
T
ACCEPTED
ACCEPTED MANUSCRIPT
2
Address correspondence to: Dr Edmund Lamb, Consultant Clinical Scientist, Clinical
Biochemistry, East Kent Hospitals University NHS Foundation Trust, Kent and Canterbury
Hospital, Canterbury, Kent, UK, CT1 3NG. Telephone: 01227 864112, Facsimile: 01227
783077, E-mail: [email protected]
Source of support: This study was funded by the NIHR Health Technology Assessment
Programme (HTA 11/103/01).
Running header: Biological variation of GFR
Word count (including abstract excluding references ): 3957
Word count of abstract: 250
Significance statement of key findings
In this prospective study we have simultaneously, under controlled conditions, established
the biological and analytical variability of glomerular filtration rate (GFR) and estimates of
GFR in patients with moderate chronic kidney disease. Biological variability of estimates
of GFR using the Modification of Diet in Renal Disease (MDRD) Study and Chronic
Kidney Disease Epidemiology (CKD-EPI) equations were similar to each other, but slightly
lower than that of GFR measured using iohexol clearance. Consequently estimated GFR
would need to decline by approximately 14% for that change to be considered significant
with 95% certainty, compared to an approximately 18% decline in measured GFR for the
same degree of certainty. The data presented can be used to assist an objective
understanding of GFR changes in clinical practice. Estimates of GFR are at least as
reliable as measured GFR for monitoring changes over time but measured GFR should
continue to be regarded as the preferred method when an accurate assessment of GFR is
required.
MANUSCRIP
T
ACCEPTED
ACCEPTED MANUSCRIPT
3
Abstract
When assessing changes in glomerular filtration rate (GFR) it is important to differentiate
pathological change from intrinsic biological and analytical variation. GFR is measured
using complex reference methods (e.g. iohexol clearance). In clinical practice
measurement of creatinine and cystatin C are used in the Modification of Diet in Renal
Disease [MDRD] or Chronic Kidney Disease Epidemiology Collaboration [CKD-EPI])
equations to provide estimated GFR. Here we studied the biological variability of
measured and estimated GFR in twenty nephrology outpatients (10 male, 10 female;
median age 71, range 50-80 years) with moderate CKD (GFR 30-59 mL/min/1.73 m2).
Patients underwent weekly GFR measurement by iohexol clearance over four consecutive
weeks. Simultaneously, GFR was estimated using the MDRD, CKD-EPIcreatinine, CKD-
EPIcystatinC and CKD-EPIcreatinine+cystatinC equations. Within-subject biological variation
expressed as a percentage [95% confidence interval] for the MDRD (5.0% [4.3-6.1]),
CKD-EPIcreatinine (5.3% [4.5-6.4]), CKD-EPIcystatinC (5.3% [4.5-6.5]), and CKD-
EPIcreatinine+cystatinC (5.0% [4.3-6.2]) equations were broadly equivalent. The within-subject
biological variation for MDRD and CKD- EPIcreatinine+cystatinC estimated GFR were each
significantly lower than that of the measured GFR (6.7% [5.6-8.2]). Reference change
values, the point at which a true change in a biomarker in an individual can be inferred to
have occurred with 95% probability were calculated. By the MDRD equation, positive and
negative reference change values were 15.1% and 13.1% respectively. If an individual’s
baseline MDRD estimated GFR (mL/min/1.73 m2) was 59, significant increases or
decreases would be to values over 68 or under 51 respectively. Within-subject variability
of estimated GFR was lower than measured GFR. Reference change values can be used to
understand GFR changes in clinical practice. Thus, estimates of GFR are at least as reliable
as measured GFR for monitoring patients over time.
Keywords: biological variation, creatinine, cystatin C, glomerular filtration rate, iohexol,
kidney disease, MDRD, CKD-EPI

MANUSCRIP
T
ACCEPTED
ACCEPTED MANUSCRIPT
4
Introduction
Chronic kidney disease (CKD) is prevalent in the general population1-4 and is commonly
identified using estimation of glomerular filtration rate (GFR). The aim of disease detection
is to make decisions on therapeutic interventions, and to identify and manage those most
likely to progress to kidney failure and/or those at high risk of morbidity and mortality. The
ability of tests to identify which individuals with CKD are at high risk of progressive or fatal
disease is a crucial issue. However, what constitutes progressive kidney disease has
been variably defined. Furthermore, a significant problem has been the ability of GFR
measurements and estimations to identify progression of kidney disease against
background age-related change in GFR and the biological and measurement variability of
both reference and estimated GFR.5
Ideally, for accuracy GFR would be measured using either inulin clearance or one of
several surrogate ‘reference methods’ in specialist clinical use (e.g. plasma clearance of
iothalamate, iohexol or 51Cr ethylenediaminetetraacetic acid). However, these techniques
are somewhat complex and time-consuming. Pragmatic estimates of GFR, based on
serum creatinine or cystatin C measurement, or both, are widely used. As with any
physiological measurement, GFR, whether measured or estimated, has an intrinsic within-
subject biological variability (CVI). Knowledge of this variability is critical to appreciation of
disease-related change. Using a variety of reference markers, earlier studies have
reported within-subject coefficients of variation (CV%) for the biological variation of GFR
ranging between 5.5% and 12.1%.6-12 Whilst forming a useful basis for comparison, many
of these previous estimates did not follow an appropriate construct for a biological
variation study and do not permit comparison of measured and estimated GFR.13
An understanding of biological variation of disease markers is essential to the
interpretation of changes in response to disease events. Critical evaluation of the

MANUSCRIP
T
ACCEPTED
ACCEPTED MANUSCRIPT
5
significance of changes in results obtained on analysis of serial specimens can be
performed only by consideration of CVI and analytical (CVA) variation.14 These data
enable the derivation of the reference change value (RCV), the point at which a true
change in a biomarker in an individual can be inferred to have occurred with a stated
degree of probability: typically 95% probability is chosen as this is conventionally regarded
as significant.14,15
The aim of the present study is to define under standardised conditions the normal
biological variability of measured GFR and hence derive mathematically the RCV. A
subsidiary question is whether the CVI and RCV are the same if estimated instead of
measured GFR is used.
Results
Characteristics of the study subjects are shown in Table 1. Medications were held
constant during the four weeks of the study, except that two patients received a one week
course of amoxicillin (500 mg tds) due to chest infection.
All 20 patients attended all four iohexol clearance procedures excepting one patient who
missed one appointment. Results from five iohexol clearances (five separate patients)
were excluded before analysis, as the dose given was not fully administered or it was
given subcutaneously. Application of Cochran and Reed’s tests led to the exclusion of
between one and three duplicate measurements for measured or estimated GFR and to
the exclusion of one outlying within-subject measurement for iohexol clearance
(Supplementary Table S1). Overall, no patient was completely excluded and all
calculations of biological variation for measured and estimated GFRs were based on a
minimum of three weeks data in all individuals.

MANUSCRIP
T
ACCEPTED
ACCEPTED MANUSCRIPT
6
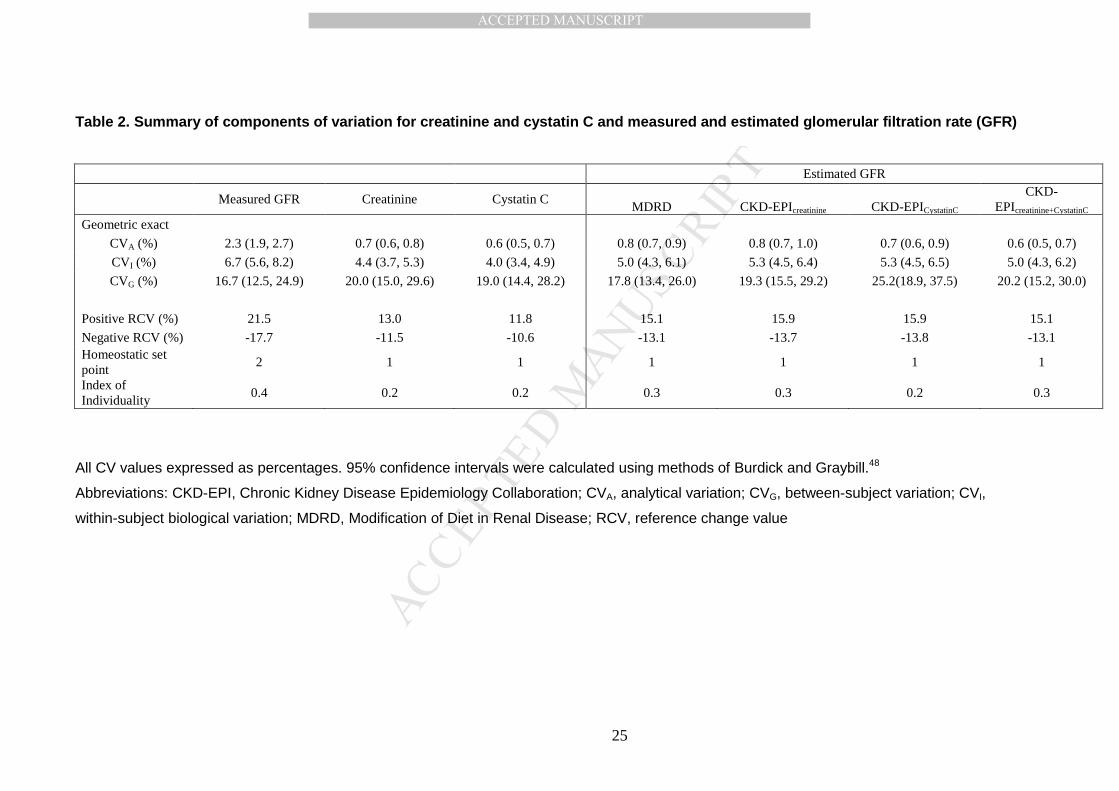
Estimates of components of biological variation are given in Table 2. The geometric exact
CVI value [95% CI] for measured GFR was 6.7% [5.6-8.2]. CVI values for the estimated
GFR equations were broadly equivalent: MDRD 5.0% [4.3-6.1], CKD-EPIcreatinine 5.3% [4.5-
6.4], CKD-EPIcystatinC 5.3% [4.5-6.5], and CKD-EPIcreatinine+cystatinC 5.0% [4.3-6.2] to each
other. Modelling to investigate differences showed the CVI for MDRD and CKD-
EPIcreatinine+cystatinC estimated GFRs to be significantly (at 5% level) lower than for measured
GFR (difference -1.8%, p=0.027 and difference -1.8%, p=0.022 respectively, see
Supplementary Table S2). Using the MDRD equation, positive and negative RCVs were
15.1% and 13.1% respectively. For example, if baseline MDRD GFR (mL/min/1.73 m2) in
an individual is 59, significant increases or decreases would be to values >68 or <51
respectively.
Sensitivity analyses were carried out without outlier detection and deletion. Data were
similar to those obtained following outlier removal, with analyses after outlier removal
estimating slightly reduced CVs (Supplementary Table S3).
Modelling to identify any trends over time resulted in non-significant slopes (coef=-0.005;
95% CI (-0.020, 0.009); p=0.488), thus providing no evidence of a change in disease state
(kidney function) over the duration of the study.
Discussion
To our knowledge, this is the first study to simultaneously establish the biological variation
of measured and estimated GFR in patients with CKD. Following a recommended study
design,13 in a prospective study we observed the within-subject biological variation of
measured GFR to be 6.7%, with similar, although in some cases significantly lower,
biological variation of estimated GFR (5.0%, 5.3%, 5.3% and 5.0% for the MDRD, CKD-
EPIcreatinine, CKD-EPIcystatinC and CKD-EPIcreatinine+cystatinC equations respectively). Taking
MANUSCRIP
T
ACCEPTED
ACCEPTED MANUSCRIPT
7
analytical and within-subject biological variability into account produced RCVs (%,
positive/negative) of 21.5/-17.7 (measured GFR), 15.1/-13.1 (MDRD), 15.9/-13.7 (CKD-
EPIcreatinine), 15.9/-13.8 (CKD-EPIcystatinC) and 15.1/-13.1 (CKD-EPIcreatinine+cystatinC).
Although there have been several previous studies of the biological variation of GFR, few
have followed the rigour of design required of a biological variation study.13,14
Nevertheless, several of these earlier studies report biological variability of measured
GFR of a similar magnitude to that observed here, despite a variety of techniques and
study designs; 4.5% (healthy individuals, plasma iohexol clearance),16 5.7% (CKD
patients, plasma iohexol clearance),7 6.3% (CKD patients, renal 125I-Iothalamate
clearance),8 5.5% (CKD patients with GFR >30 mL/min/1.73 m2, plasma 51Cr-
ethylenediaminetetraacetic acid [EDTA] clearance),6 with some authors reporting higher
estimates; 9.8% (CKD patients, plasma 51Cr-EDTA clearance)10 and 8.0% (CKD patients,
99mTe-DTPA clearance).9 Some of the differences observed may reflect the underlying
level of kidney function in the groups studied: both Levey et al8 and Brochner-Mortensen
et al6 report higher variation estimates in individuals with GFR<30 mL/min/1.73 m2. Other
factors including length of time between repeat procedures (10 months) and total study
duration (12 years),10 inattention to hydration status, fasting and exercise before and
during the test9 may also have increased the variability reported in some studies.
When considering any change in a patient’s results, healthcare practitioners need to be
able to distinguish true change (‘signal’) from the ‘noise’ of variability. In clinical practice,
biological variation is best considered in terms of the RCV, which takes both biological
and analytical variation of measured GFR into account: the positive and negative RCVs of
measured GFR were 21.5% and -17.7% respectively. Definitions of progressive kidney
disease vary but it is important to consider whether, in the clinical context, the variability of
measured GFR allows for detection of progressive kidney disease over a useful time
frame. Reported ‘normal’ mean age-related decline in GFR of 1 mL/min/1.73 m2/year,17 or
MANUSCRIP
T
ACCEPTED
ACCEPTED MANUSCRIPT
8
reported rates of decline of 3.6 mL/min/1.73 m2/year and 2.8 mL/min/1.73 m2/year
respectively in male and female community dwelling older adults with diabetes and
moderate CKD18 could not be detected in individuals by annual GFR measurement. It is
possible that reported annual mean GFR declines of 7.0 mL/min/1.73 m2/year amongst
proteinuric (greater than 1 g/24 h) patients could be detected by annual monitoring of
individual patient’s GFR.19 Importantly, based on the data presented here, monitoring of
GFR will permit detection of progressive kidney disease as defined by recent guideline
recommendations from Kidney Disease Improving Global Outcomes (KDIGO) and the
National Institute for Health and Care Excellence (NICE). Both guidelines define a certain
drop in GFR as an increase in disease category (e.g. G3a [GFR 45-59 mL/min/1.73 m2] to
G3b [GFR 30-44 mL/min/1.73 m2]) accompanied by a fall in GFR of greater than or equal
to 25% between two serial results. Alternatively, they define a significant change as a
decrease in GFR of 15 mL/min/1.73 m2 or more per year.5,20 For example: if baseline
measured GFR in an individual is 59 mL/min/1.73 m2, significant increases or decreases
would be to values >72 or <48 mL/min/1.73 m2. Given the lower CVI and CVA of estimated
GFR, slightly lower RCVs may be applied when monitoring patients using GFR estimating
equations (e.g. if an individual’s baseline MDRD estimated GFR was 59, significant
increases or decreases would be to values >68 or <51 mL/min/1.73 m2 respectively).
However, it must be remembered that our biological variation estimates are obtained
under idealised conditions, with optimisation of preanalytical variables and precise
laboratory methods. In an uncontrolled operational clinical environment, it is likely that
biological and analytical variation, and hence RCVs, would increase.
The within-subject biological variation of serum creatinine we have observed (4.4%) is in
broad agreement with values reported in other studies in both healthy (4.1% to 7.6%,16,21-
28) and diseased (5.7% to 9.9%23,29-31) cohorts. Enzymatic creatinine methods are less
prone to interference than Jaffe methods and the use of an enzymatic assay in the
present study improves confidence in the estimate of biological variation we have

MANUSCRIP
T
ACCEPTED
ACCEPTED MANUSCRIPT
9
reported. Whilst calculation of CVI excludes any contribution due to CVA, it cannot account
for biological variability of non-creatinine chromogens (e.g. bilirubin, glucose, ketones,
protein, and certain drugs) that are known to interfere in Jaffe methods of creatinine
measurement. Similarly, our reported within-subject biological variation of cystatin C
(4.0%) is similar to most (3.1%,32 4.1%,25 4.5%16,27 and 4.8%29) but not all (6.8%,28 8.6%23
and 13.3%24) previous estimates. As for measured GFR, differences in study design and
data analysis may account for differences in reported estimates of variation: for example,
most of these studies did not report their approach to outlier detection; the time interval
between repeat sampling was prolonged in some studies.28
Depending on the equation used, estimated GFR is based on the concentration of
creatinine, cystatin C or both. Therefore estimated GFR will have a similar CVI to
creatinine or cystatin C, mathematically inflated by the power function in the respective
equation. The point estimates for CVI of the four studied equations lie between 5.0% and
5.3% and have overlapping confidence intervals.
It is uncertain why the CVI of estimated GFR should be lower than that of measured GFR.
Probably the complexity of the iohexol clearance procedure, involving multiple
measurements and blood samplings, contributes to a higher CVI for measured than
estimated GFR. However, it is also possible that the variability of estimated GFR is
somewhat attenuated compared to physiological fluctuations in measured GFR, as noted,
in an extreme example, following renal insult in acute kidney injury where there is a delay
between the fall in GFR and the consequent rise in blood creatinine concentration.
These data have implications for the use of measured versus estimated GFR in clinical
practice and research. Within-subject biological variation of measured GFR was similar to
that of estimated GFR, implying no disadvantage to the use of simple estimates of GFR
when monitoring patients over time. The main priority for monitoring GFR is to detect

MANUSCRIP
T
ACCEPTED
ACCEPTED MANUSCRIPT
10
change and for this purpose estimated GFR is at least as reliable as measured GFR. This
is important because measurement of GFR is time consuming and more costly than
estimated GFR. However, this should not be interpreted as an indication that estimated
GFR should replace measured GFR when an accurate assessment of GFR is required.
Reference techniques are considered more accurate than estimated GFR primarily
because they are not influenced by the non-GFR determinants of endogenous filtration
markers. Reference GFR measurements will remain important as the benchmark in
clinical research studies and to inform clinical situations in which more accurate
knowledge of GFR is important. These situations include certain chemotherapies (e.g.
carboplatin); the use of any drug that is nephrotoxic or renally-excreted and has a narrow
therapeutic margin; the assessment of potential living related kidney donors; the
assessment of GFR in patients with muscle-wasting disorders, including spina bifida and
paraplegia; those undergoing nephrectomy or partial nephrectomy; and in certain
paediatric renal patients.
The strengths of this study include the use of an enzymatic creatinine assay and a three-
point iohexol clearance procedure with the final sample being taken at 4 h postinjection,
which is considered suitable for patients with GFR>30 mL/min/1.73 m2.33 The study was
adequately powered34 and followed a strict design to minimise preanalytical variation and
investigator bias (Supplementary Table S4).13 Outliers were excluded using a formal
exclusion protocol: sensitivity testing was undertaken using excluded data to confirm that
presented results were representative. Estimation of components of variation was derived
using a nested ANOVA approach, which takes into account analytical variation for
estimation of within-subject biological variation. The studied patient group represents a
major population in which monitoring of kidney function to detect worsening disease is
regularly undertaken and which is mandated in international guidance.5,20 Prescribed
medication was unaltered during the study, with the exception of two patients who
received a course of amoxicillin. No patients showed significant trends in GFR during the
MANUSCRIP
T
ACCEPTED
ACCEPTED MANUSCRIPT
11
study period, confirming that the variation we have reported is physiological and not
pathological in nature.
Our study has some limitations. The cohort studied was recruited from a single centre and
was exclusively Caucasian: biological variability estimates may not be transferable to
other ethnic groups. Although the study was adequately powered to answer the primary
question, we were unable to investigate whether variability is higher at differing levels of
GFR or albuminuria. Although previous studies have observed statistically significant
differences in CVI when individuals are stratified for level of GFR/albuminuria29 such
effects are unlikely to be of practical importance.25 Our measured GFR data was based on
a plasma iohexol clearance procedure. Whilst constant infusion urinary inulin clearance
would be considered the reference measure of GFR, single-bolus plasma clearance of
iohexol demonstrates good agreement with this technique and is widely used in clinical
practice.35 In terms of CVI, plasma clearance techniques are likely to produce lower values
than urinary clearance techniques due to problems of inaccurate urine collection. We have
chosen to calculate RCVs representing 95% probability, as is conventional. However, if a
lower probability was considered clinically acceptable, then the RCV would be smaller.22
In clinical practice, in the setting of CKD identification of deterioration of kidney function
tends to be based not upon two consecutive results but on multiple observations obtained
over a period of time. Traditional RCV calculations only allow comparison between two
consecutive measurements. When multiple measurements are available then use of RCV
values as described herein will be susceptible to the effect of repeated testing, where the
probability of a false-positive result increases with the number of results available.
Because of this, in general terms RCV values increase with the number of observations
available (i.e. a larger change is required compared to the baseline value to be deemed
significant). Adjustments to the RCV calculation dependent on the number of results have
been published but are relatively complex.36,37 Because of this, and also because our

MANUSCRIP
T
ACCEPTED
ACCEPTED MANUSCRIPT
12
patients were being studied within relatively controlled conditions as discussed above, the
RCV values we have reported should be considered minimum values: in clinical practice,
for the same certainty of change, larger RCVs may be required.
In conclusion we describe the biological variability of measured and estimated GFR in a
carefully designed study. The data generated have implications for monitoring of patients
with CKD and clinical ability to detect CKD progression, both in clinical practice and in
clinical trials, whether using measured or estimated GFR. Within-subject biological
variation of measured GFR is similar to that of estimated GFR and, in terms of variability,
suggests no real advantage to the use of measured GFR when monitoring patients over
time. Nevertheless, measurement of GFR should continue to be regarded as the optimal
approach when an accurate assessment of GFR is required. Most importantly, the
information presented provides an evidence-base allowing clinicians to have meaningful
discussions with their patients about the implications of changes in their GFR results.
Methods
Chronic kidney disease patients (n=20) with MDRD estimated GFR between 30 and 59
mL/min/1.73 m2 sustained over at least 90 days were recruited at the Kent Kidney Care
Centre, UK between August 2014 and July 2015.38 Patients with diabetes and proteinuria
(ACR >30 mg/mmol) were included in the study. Patients who had a history of reaction to
iodinated contrast media, who were pregnant, who had an episode of acute kidney injury
within the last six months, amputees and those with an inability to consent due to
cognitive impairment were excluded from the study. Patients provided written informed
consent and the study had ethical approval (South-East Coast-Surrey Research Ethics
Committee of the National Research Ethics Service reference number 13/LO/1349). The
study conforms to the internationally agreed checklist for the reporting of studies of
biological variation (Supplementary Table S4).13

MANUSCRIP
T
ACCEPTED
ACCEPTED MANUSCRIPT
13
The sample size was based on the precision of CVI, which was estimated to be 10%. With
twenty participants recruited, tested on four occasions and assayed in duplicate and
assuming data are log-normally distributed, an approximate 95% confidence interval (CI)
for CVI has limits ±2% (absolute).
Measurement and estimation of GFR
Patients underwent four iohexol reference measures of GFR in four successive weeks,
with standardisation for time of day and day of week. Participants were asked to follow a
permitted food list from 22:00 the night before the procedure, being permitted a light
breakfast with no high protein foods on the morning of the procedure. Demographic data,
comorbidity information and prescription histories were recorded and blood pressure,
weight and height documented. Blood samples were taken immediately prior to iohexol
injection for serum creatinine and cystatin C measurement. Blood samples were collected
using standard venepuncture procedures, including the use of a tourniquet, into gel-
separator (for serum cystatin and creatinine) and lithium heparin (for plasma iohexol)
containing VacuetteTM tubes (Greiner Bio-One International) following manufacturer’s
recommended order of draw. Plasma/serum was separated by centrifugation within 4 h of
venepuncture and sample aliquots were stored at -80°C pending analysis. All analyses
were undertaken within 9 months of venepuncture at a central laboratory.
A 5 mL bolus of Omnipaque 240 (518 g/L iohexol corresponding to 240 g/L iodine, GE
Healthcare www.gelifesciences.com) followed by 10 mL physiological saline was injected
into the antecubital vein. A blood sample was taken at 5 minutes from the opposite arm to
confirm that the iohexol had been administered intravenously. Further blood samples were
collected at 120, 180 and 240 minutes after injection. Exact times of blood draws in
relation to injection time were recorded. During the procedure individuals were allowed
MANUSCRIP
T
ACCEPTED
ACCEPTED MANUSCRIPT
14
free access to fluids (no carbonated drinks), but asked to refrain from protein intake and
excessive exercise.
Detailed laboratory methods are available in the supplementary file. Briefly, iohexol was
measured using electrospray isotope dilution tandem mass spectrometry. Iohexol
concentrations were log transformed (natural log) and plotted as a function of time. GFR
was calculated from the slope-intercept method using a single compartment model,
GFR (mL/min) = 0.693 x iohexol volume of distribution (L) x 1000/half-life of iohexol (min).
GFR was adjusted for body surface area (BSA)39 and then corrected for the fast
exponential.40
Serum creatinine was measured using an enzymatic assay standardised to the reference
material, NIST SRM 967 and 914. Between-day imprecision (coefficient of variation, %)
was 0.8%, 0.3% and 0.4% at concentrations of 75, 176 and 760 umol/L respectively.
Cystatin C was measured by a turbidimetric immunoassay calibrated against the
international certified reference material ERM-DA471/IFCC for cystatin C.41 GFR was
estimated using the simplified isotope dilution mass-spectrometric (ID-MS) traceable
version of the MDRD equation42 and the three CKD-EPI equations: CKD-EPIcreatinine, CKD-
EPIcystatinC and CKD-EPIcreatinine-cystatinC.43,44
Statistical analysis
Data were log-transformed and normality tests were performed using the Shapiro-Wilk
test. Outliers between duplicate measurements and of within-subject variance were
excluded using Cochran’s test and outliers amongst mean values of subjects were
excluded using Reed’s test as advocated by Fraser and Harris.14 Sensitivity analyses
were also performed without exclusion of identified outliers. Log transformation was used
to simplify calculation and because it improved the normality of the data as assessed by

MANUSCRIP
T
ACCEPTED
ACCEPTED MANUSCRIPT
15
an increase in Shapiro–Wilk W statistic and visual examination of the distributions
(Supplementary Figure S1 and Table S5).
Terminology used was as proposed by Simundic et al.45 Analytical (CVA), CVI and
between-subject (CVG) components of variation were calculated using standard
approaches14 of linear random effects modelling with restricted maximum likelihood
estimation (allowing for the clustering of observations within time points and repeated
observations per patient) (Stata version 15). Exact geometric CVs [�exp�S� − 1 ×
100,46,47] were calculated. Confidence intervals for SDs and CVs were estimated as
described by Burdick and Graybill.48 Differences in measures of CV, comparing the
estimated GFR measures to measured GFR were investigated using multilevel models
accounting for the clustering of test observations within individuals, using unstructured
covariance matrices, in addition to the clustering of test results (multiple results per
person, observation points and assessments). The RCV for a change in GFR between
two results with 95% probability was calculated using the approach for log-normal data
giving a negative and positive limit.49 The number of specimens (n) required to produce a
precise estimate of the homeostatic set-point with 95% confidence within +10% was
calculated as:
n = [1.96⋅(CVI2 + CVA
2)1/2/10]2
For each biomarker the index of individuality (II) was calculated as:
II = (CVI2 + CVA
2)1/2/CVG
To confirm kidney function was stable across the study period, the iohexol GFR measures
were modelled to identify trend with time using a multilevel linear regression model

MANUSCRIP
T
ACCEPTED
ACCEPTED MANUSCRIPT
16
(allowing for clustering of assessments within time points and observations within
individuals).
Abbreviations:
ACR: Albumin to creatinine ratio; ANOVA; analysis of variance; BSA: body surface area;
CI: confidence interval; CKD: chronic kidney disease; CKD-EPI: Chronic Kidney Disease-
Epidemiology Consortium; CV: coefficient of variation; CVA: analytical coefficient of
variation; CVG: between-subject biological variation; CVI: within-subject biological
variation; CVT: total coefficient of variation; EDTA, ethylendiaminetetraacetic acid; eGFR:
estimated glomerular filtration rate; GFR: glomerular filtration rate; ID-MS: isotope dilution
mass spectrometry; KDIGO: Kidney Disease Improving Global Outcomes; MDRD:
Modification of Diet in Renal Disease; mGFR: measured glomerular filtration rate; NICE:
National Institute for Health and Care Excellence; RCV: reference change value
Disclosure:
All authors declare no competing interests.
Acknowledgements:
This study was funded by the NIHR Health Technology Assessment Programme (HTA
11/103/01). The NIHR Research Design Service South-East contributed to the
development of this study including comments from the patient and public involvement
unit. AS and JJD are supported by the NIHR Birmingham Biomedical Research Centre at
the University Hospitals Birmingham NHS Foundation Trust and the University of
Birmingham. The NIHR CRN portfolio study number is 15268. The study is registered as
ISRCTN42955626 and on clinical trials.gov as NCT02433002. Further information may be
found on the study website

MANUSCRIP
T
ACCEPTED
ACCEPTED MANUSCRIPT
17
http://www.birmingham.ac.uk/research/activity/mds/trials/bctu/trials/renal/egfr-c/index.aspx
(accessed 23rd July 2018).
Author’s contributions:
All authors contributed to the intellectual content and have met the following requirements:
(a) significant contributions to the concept, (b) drafting or revising the article for intellectual
content and (c) reading and approval of the final manuscript. Specific contribution: CR and
ASi carried out the statistical analyses and reported the results.
Department of Health Disclaimer:
The views expressed are those of the authors and not necessarily those of the NHS, the
NIHR or the Department of Health and Social Care.
Supplementary material:
Supplementary methods
Figure S1. Effect of log transformations on distributions
Table S1. Identification of outliers by Cochran’s and Reed’s criterion.
Table S2. Differences between measures using each GFR estimate compared with
measured GFR (calculated as eGFR-mGFR).
Table S3. Summary of components of variation for creatinine and cystatin C and
measured and estimated glomerular filtration rate (GFR) without outlier detection and
removal
Table S4. Critical appraisal checklist for studies of biological variation
Table S5. Shapiro-Wilk normality test p-values before and after log transformation.
Supplementary information is available at Kidney International's website
MANUSCRIP
T
ACCEPTED
ACCEPTED MANUSCRIPT
18
References:
1. Carter JL, Stevens PE, Irving JE, Lamb EJ. Estimating glomerular filtration rate:
comparison of the CKD-EPI and MDRD equations in a large UK cohort with particular
emphasis on the effect of age. QJM 2011; 104(10): 839-47.
2. Coresh J, Astor BC, Greene T, Eknoyan G, Levey AS. Prevalence of chronic
kidney disease and decreased kidney function in the adult US population: Third National
Health and Nutrition Examination Survey. Am J Kidney Dis 2003; 41(1): 1-12.
3. Stevens PE, O'Donoghue DJ, de Lusignan S, et al. Chronic kidney disease
management in the United Kingdom: NEOERICA project results. Kidney Int 2007; 72(1):
92-9.
4. Roth M, Roderick P, Mindell J. Chapter 3: Kidney Disease and renal function in
Health Survey for England 2009: NHS Information Centre; 2010 Available from:
http://www.ic.nhs.uk/statistics-and-data-collections/health-and-lifestyles-related-
surveys/health-survey-for-england.
5. National Institute for Health and Care Excellence. Chronic kidney disease. Early
identification and management of chronic kidney disease in adults in primary and
secondary care. 2014: http://www.nice.org.uk/nicemedia/live/13712/66658/.pdf.
6. Brochner-Mortensen J, Rodbro P. Selection of routine method for determination of
glomerular filtration rate in adult patients. Scand J Clin Lab Invest 1976; 36(1): 35-43.
7. Gaspari F, Perico N, Matalone M, et al. Precision of plasma clearance of iohexol
for estimation of GFR in patients with renal disease. J Am Soc Nephrol 1998; 9(2): 310-3.
8. Levey AS, Greene T, Schluchter MD, et al. Glomerular filtration rate
measurements in clinical trials. Modification of Diet in Renal Disease Study Group and the
Diabetes Control and Complications Trial Research Group. J Am Soc Nephrol 1993; 4(5):
1159-71.
9. Wilkinson J, Fleming JS, Waller DG. Effect of food and activity on the
reproducibility of isotopic GFR estimation. Nucl Med Commun 1990; 11(10): 697-700.

MANUSCRIP
T
ACCEPTED
ACCEPTED MANUSCRIPT
19
10. Blake GM, Roe D, Lazarus CR. Long-term precision of glomerular filtration rate
measurements using 51Cr-EDTA plasma clearance. Nucl Med Commun 1997; 18(8): 776-
84.
11. Perrone RD, Steinman TI, Beck GJ, et al. Utility of radioisotopic filtration markers
in chronic renal insufficiency: simultaneous comparison of 125I-iothalamate, 169Yb-
DTPA, 99mTc-DTPA, and inulin. The Modification of Diet in Renal Disease Study. Am J
Kidney Dis 1990; 16(3): 224-35.
12. Kwong YT, Stevens LA, Selvin E, et al. Imprecision of urinary iothalamate
clearance as a gold-standard measure of GFR decreases the diagnostic accuracy of
kidney function estimating equations. Am J Kidney Dis 2010; 56(1): 39-49.
13. Bartlett WA, Braga F, Carobene A, et al. A checklist for critical appraisal of studies
of biological variation. Clin Chem Lab Med 2015; 53(6): 879-85.
14. Fraser CG, Harris EK. Generation and application of data on biological variation in
clinical chemistry. Crit Rev Clin Lab Sci 1989; 27(5): 409-37.
15. Fraser CG, Hyltoft Petersen P, Libeer JC, Ricos C. Proposals for setting generally
applicable quality goals solely based on biology. Ann Clin Biochem 1997; 34: 8-12.
16. Delanaye P, Cavalier E, Depas G, Chapelle JP, Krzesinski JM. New data on the
intraindividual variation of cystatin C. Nephron Clin Pract 2008; 108(4): c246-8.
17. Lindeman RD, Tobin J, Shock NW. Longitudinal studies on the rate of decline in
renal function with age. J Am Geriatr Soc 1985; 33(4): 278-85.
18. Hemmelgarn BR, Zhang J, Manns BJ, et al. Progression of kidney dysfunction in
the community-dwelling elderly. Kidney Int 2006; 69(12): 2155-61.
19. Ruggenenti P, Perna A, Remuzzi G. ACE inhibitors to prevent end-stage renal
disease: when to start and why possibly never to stop: a post hoc analysis of the REIN
trial results. Ramipril Efficacy in Nephropathy. J Am Soc Nephrol 2001; 12(12): 2832-7.
20. Kidney Disease Improving Global Outciomes. Clinical Practice Guideline for the
Evaluation and Management of Chronic Kidney Disease. Kidney International 2013; 3:
(Suppl.): 1-150.

MANUSCRIP
T
ACCEPTED
ACCEPTED MANUSCRIPT
20
21. Gowans EM, Fraser CG. Biological variation of serum and urine creatinine and
creatinine clearance: ramifications for interpretation of results and patient care. Ann Clin
Biochem 1988; 25: 259-63.
22. Carobene A, Marino I, Coskun A, et al. The EuBIVAS Project: within- and
between-subject biological variation data for serum creatinine using enzymatic and
alkaline picrate methods and implications for monitoring. Clin Chem 2017; 63(9): 1527-36.
23. Reinhard M, Erlandsen EJ, Randers E. Biological variation of cystatin C and
creatinine. Scand J Clin Lab Invest 2009; 69(8): 831-6.
24. Keevil BG, Kilpatrick ES, Nichols SP, Maylor PW. Biological variation of cystatin C:
implications for the assessment of glomerular filtration rate. Clin Chem 1998; 44(7): 1535-
9.
25. Waikar SS, Rebholz CM, Zheng Z, et al. Biological Variability of Estimated GFR
and Albuminuria in CKD. Am J Kidney Dis 2018; 72: 538-546.
26. Toffaletti JG, McDonnell EH. Variation of serum creatinine, cystatin C, and
creatinine clearance tests in persons with normal renal function. Clin Chim Acta 2008;
395(1-2): 115-9.
27. Bandaranayake N, Ankrah-Tetteh T, Wijeratne S, Swaminathan R. Intra-individual
variation in creatinine and cystatin C. Clin Chem Lab Med 2007; 45(9): 1237-9.
28. Selvin E, Juraschek SP, Eckfeldt J, Levey AS, Inker LA, Coresh J. Within-person
variability in kidney measures. Am J Kidney Dis 2013; 61(5): 716-22.
29. Carter JL, Parker CT, Stevens PE, et al. Biological variation of plasma and urinary
markers of acute kidney injury in patients with chronic kidney disease. Clin Chem 2016;
62(6): 876-83.
30. Podracka L, Feber J, Lepage N, Filler G. Intra-individual variation of cystatin C and
creatinine in pediatric solid organ transplant recipients. Pediatr Transplant 2005; 9(1): 28-
32.
31. Tan GD, Lewis AV, James TJ, Altmann P, Taylor RP, Levy JC. Clinical usefulness
of cystatin C for the estimation of glomerular filtration rate in type 1 diabetes:

MANUSCRIP
T
ACCEPTED
ACCEPTED MANUSCRIPT
21
reproducibility and accuracy compared with standard measures and iohexol clearance.
Diabetes Care 2002; 25(11): 2004-9.
32. Hoek FJ, Kemperman FA, Krediet RT. A comparison between cystatin C, plasma
creatinine and the Cockcroft and Gault formula for the estimation of glomerular filtration
rate. Nephrol Dial Transplant 2003; 18(10): 2024-31.
33. Fleming JS, Nunan TO. The new BNMS guidelines for measurement of glomerular
filtration rate. Nucl Med Commun 2004; 25(8): 755-7.
34. Roraas T, Petersen PH, Sandberg S. Confidence intervals and power calculations
for within-person biological variation: effect of analytical imprecision, number of replicates,
number of samples, and number of individuals. Clin Chem 2012; 58(9): 1306-13.
35. Soveri I, Berg UB, Bjork J, et al. Measuring GFR: a systematic review. Am J
Kidney Dis 2014; 64(3): 411-24.
36. Lund F, Petersen PH, Fraser CG, Soletormos G. Calculation of limits for significant
bidirectional changes in two or more serial results of a biomarker based on a computer
simulation model. Ann Clin Biochem 2015; 52(Pt 4): 434-40.
37. Lund F, Petersen PH, Fraser CG, Soletormos G. Calculation of limits for significant
unidirectional changes in two or more serial results of a biomarker based on a computer
simulation model. Ann Clin Biochem 2015; 52(Pt 2): 237-44.
38. Lamb EJ, Brettell EA, Cockwell P, et al. The eGFR-C study: accuracy of
glomerular filtration rate (GFR) estimation using creatinine and cystatin C and albuminuria
for monitoring disease progression in patients with stage 3 chronic kidney disease--
prospective longitudinal study in a multiethnic population. BMC Nephrol 2014; 15(1): 13.
39. Haycock GB, Schwartz GJ, Wisotsky DH. Geometric method for measuring body
surface area: a height-weight formula validated in infants, children, and adults. J Pediatr
1978; 93(1): 62-6.
40. Brochner-Mortensen J. A simple method for the determination of glomerular
filtration rate. Scand J Clin Lab Invest 1972; 30(3): 271-4.
MANUSCRIP
T
ACCEPTED
ACCEPTED MANUSCRIPT
22
41. Grubb A, Blirup-Jensen S, Lindstrom V, Schmidt C, Althaus H, Zegers I. First
certified reference material for cystatin C in human serum ERM-DA471/IFCC. Clin Chem
Lab Med 2010; 48(11): 1619-21.
42. Levey AS, Coresh J, Greene T, et al. Using standardized serum creatinine values
in the modification of diet in renal disease study equation for estimating glomerular
filtration rate. Ann Intern Med 2006; 145(4): 247-54.
43. Levey AS, Stevens LA, Schmid CH, et al. A new equation to estimate glomerular
filtration rate. Ann Intern Med 2009; 150(9): 604-12.
44. Inker L, Schmid CH, Tighiouart H, et al. Estimating glomerular filtration rate from
serum creatinine and cystatin C. N Engl J Med 2012; 367:20-9.
45. Simundic AM, Kackov S, Miler M, Fraser CG, Petersen PH. Terms and symbols
used in studies on biological variation: the need for harmonization. Clin Chem 2015; 61(2):
438-9.
46. Cole TJ. Sympercents: symmetric percentage differences on the 100 log(e) scale
simplify the presentation of log transformed data. Statistics in medicine 2000; 19(22):
3109-25.
47. Koopmans LH, Owen DB, Rosenblatt JI. Confidence intervals for the coefficient of
variation for the normal and log normal distributions. Biometrika 1964; 51(1-2): 25-32.
48. Burdick RK, Graybill FA. Confidence Intervals on Variance Components: Taylor &
Francis; 1992.
49. Fokkema MR, Herrmann Z, Muskiet FA, Moecks J. Reference change values for
brain natriuretic peptides revisited. Clin Chem 2006; 52(8): 1602-3.

MANUSCRIP
T
ACCEPTED
ACCEPTED MANUSCRIPT
23
Table 1. Characteristics of the study population. Values for continuous data are shown
as median (range). Anthropometric data is based on baseline measurements. Estimated
and measured* GFR, creatinine and cystatin C data are calculated using all values over
the four weeks.
n 20
Age, y 71 (50-80)
M:F 10:10
Caucasian (n) 20
Height, cm 170.5 (154-194)
Weight, kg 79.5 (47.1-118.1)
Body surface area, m2 1.99 (1.42-2.47)
Body mass index, kg/m2 28.2 (19.6-40.9)
Medication record (n) Thiazide diuretic (3), loop diuretic (3), potassium sparing diuretic (2), beta-
blocker (7), calcium antagonist (4), ACE inhibitor (8), angiotensin 2 receptor
blocker (6), alpha-blocker (1), isosorbide mononitrate (1), HMG CoA reductase
inhibitor (13), allopurinol (4), antiplatelet drugs (7)
Comorbidity (n) Type 2 diabetes mellitus (3), ischaemic heart disease (7), angina (1), heart
failure (2)
Smoker – current/former (n) 1/10
Urine albumin concentration <3 mg/mmol (n) 9
Urine albumin concentration 3-30 mg/mmol (n) 7
Urine albumin concentration >30 mg/mmol (n) 4
Serum creatinine, µmol/L 124 (79-182)
Serum cystatin C, mg/L 1.67 (1.01-2.30)
Measured GFR, mL/min/1.73 m2 49.0 (30.8-71.6)*
MDRD, mL/min/1.73 m2 42.2 (31.5-61.4)

MANUSCRIP
T
ACCEPTED
ACCEPTED MANUSCRIPT
24
CKD-EPIcreatinine, mL/min/1.73 m2 43.0 (30.8-62.8)
CKD-EPIcystatinC, mL/min/1.73 m2 36.8 (23.5-67.1)
CKD-EPIcreatinine+cystatinC, mL/min/1.73 m2 38.2 (27.2-65.4)
Abbreviations: ACE, angiotensin converting enzyme; CKD-EPI, Chronic Kidney Disease
Epidemiology Collaboration; HMG, hydroxymethyl glutaryl; MDRD, Modification of Diet in
Renal Disease
*Excludes data from five failed iohexol procedures (five separate patients).
MANUSCRIP
T
ACCEPTED
ACCEPTED MANUSCRIPT
25
Table 2. Summary of components of variation for cre atinine and cystatin C and measured and estimated g lomerular filtration rate (GFR)
Estimated GFR
Measured GFR Creatinine Cystatin C
MDRD CKD-EPIcreatinine CKD-EPICystatinC CKD-
EPIcreatinine+CystatinC Geometric exact
CVA (%) 2.3 (1.9, 2.7) 0.7 (0.6, 0.8) 0.6 (0.5, 0.7) 0.8 (0.7, 0.9) 0.8 (0.7, 1.0) 0.7 (0.6, 0.9) 0.6 (0.5, 0.7)
CVI (%) 6.7 (5.6, 8.2) 4.4 (3.7, 5.3) 4.0 (3.4, 4.9) 5.0 (4.3, 6.1) 5.3 (4.5, 6.4) 5.3 (4.5, 6.5) 5.0 (4.3, 6.2)
CVG (%) 16.7 (12.5, 24.9) 20.0 (15.0, 29.6) 19.0 (14.4, 28.2) 17.8 (13.4, 26.0) 19.3 (15.5, 29.2) 25.2(18.9, 37.5) 20.2 (15.2, 30.0)
Positive RCV (%) 21.5 13.0 11.8 15.1 15.9 15.9 15.1
Negative RCV (%) -17.7 -11.5 -10.6 -13.1 -13.7 -13.8 -13.1 Homeostatic set point
2 1 1 1 1 1 1
Index of Individuality
0.4 0.2 0.2 0.3 0.3 0.2 0.3
All CV values expressed as percentages. 95% confidence intervals were calculated using methods of Burdick and Graybill.48
Abbreviations: CKD-EPI, Chronic Kidney Disease Epidemiology Collaboration; CVA, analytical variation; CVG, between-subject variation; CVI,
within-subject biological variation; MDRD, Modification of Diet in Renal Disease; RCV, reference change value

MANUSCRIP
T
ACCEPTED
ACCEPTED MANUSCRIPT
26


![Glomerular Function and Structure in Living Donors ... · glomerular filtration rate (SNGFR) and glomerular capillary hydraulic pressure (P GC)[3]. Further insights into glomerular](https://img.dokumen.tips/doc/110x75/5ed58c3d3f40d10acd516aa6/glomerular-function-and-structure-in-living-donors-glomerular-filtration-rate.jpg)

![Variation of fluxes of RR Tel emission lines measured in …arXiv:0811.4557v1 [astro-ph] 27 Nov 2008 Variation of fluxes of RR Tel emission lines measured in 2000 with respect to](https://img.dokumen.tips/doc/110x75/60d5cc16040a5c7bbf062244/variation-of-iuxes-of-rr-tel-emission-lines-measured-in-arxiv08114557v1-astro-ph.jpg)