Embed Size (px)
Citation preview
BJR © 2017 The Authors. Published by the British Institute of Radiology
Received:1 June 2016
Revised:30 January 2017
Accepted:9 February 2017
https://doi.org/10.1259/bjr.20160477
Cite this article as:Costa Ferreira B, Sa-Couto P, Khouri L, Lopes MC. Biological dose-escalated definitive radiation therapy in head and neck cancer. Br J Radiol2017; 90: 20160477.
FULL PAPER
Biological dose-escalated definitive radiation therapy inhead and neck cancer
1,2BRIGIDA COSTA FERREIRA, PhD, 3PEDRO SA-COUTO, PhD, 4LEILA KHOURI, MD and5MARIA DO CARMO LOPES, PhD
1Department of Physics, Aveiro University, Aveiro, Portugal2School of Allied Health Technologies, Polytechnic of Porto, Porto, Portugal3Department of Mathematics, Center for Research and Development in Mathematics and Applications, Aveiro University, Aveiro, Portugal4Department of Radiation Therapy, Portuguese Oncology Institute of Coimbra Francisco Gentil (IPOCFG), Coimbra, Portugal5Department of Medical Physics, Portuguese Oncology Institute of Coimbra Francisco Gentil, Coimbra, Portugal
Address correspondence to: Brigida da Costa FerreiraE-mail: [email protected]
Objective: To compare treatment outcome of patients
with head and neck (HN) tumours treated with definitive
radiation therapy that, mainly owing to differences in the
fractionation scheme used with simultaneous integrated
boost techniques, resulted in a different biological dose.
Methods: 181 patients with HN cancer, prescribed to
about 70.2Gy in the primary tumour, were included in
this study. Population cohort was divided into Group
,70 and Group $70 when the mean dose converted to
a 2Gy fractionation in the primary tumour was less or
higher than 70.2Gy, respectively. The probability of local
control (LC), locoregional control (LRC), disease-free
survival (DFS) and overall survival (OS) was determined
for both groups. The incidence of acute and late compli-
cations was compared between the two groups.
Results: At 24 months for Groups ,70 and $70, LC was
83.2% and 87.5%, LRC was 79.5% and 81.6%, DFS was
56.3% and 66.8% and OS was 63.9% and 71.5% p5ns,
respectively. The incidence of acute dysphagia, odyno-
phagia and pain, and late mucositis was significantly
higher in Group $70 than in Group ,70. The rate of
xerostomia, dysphonia, radiodermatitis, alopecia, dental
complications, hypoacusia and weight loss was compa-
rable between the two groups.
Conclusion: The biological dose escalation was safe, but an
increase in the incidence of the acute side effects: dysphagia,
odynophagia and pain and late mucositis, was obtained.
Advances in knowledge: Despite the significant biological
dose escalation, within the range of doses delivered to this
cohort, no clear dose–response effect was observed.
INTRODUCTIONWith increased knowledge on tissue response to radiationtherapy (RT), fractionation schedules may be optimized foreach tumour type. Fractionation optimization aimed at in-creasing tumour cure, by minimizing tumour proliferation,or at reducing adverse effects by allowing normal tissuedamage to repair between fractions. A reduction in overalltreatment time (OTT) through accelerated RT, comparedwith conventional fractionation, resulted in a significantimprovement in locoregional control (LRC).1 However,significant clinical benefits in terms of LRC and overallsurvival (OS) were obtained with hyperfractionated RTcompared with accelerated regimens without increasinglate toxicity.2,3
With the clinical implementation of intensity-modulatedradiation therapy (IMRT) simultaneous integrated boosttechniques or simultaneous modulated accelerated RT,using a dose per fraction larger than conventional in the
primary tumour, were widely adopted in the clinicalroutine.4 The integration of different prescription doselevels in the same plan is straightforward with inversetreatment planning. Reducing the number of plansper patient was a necessity to decrease the workloadrequired with pre-treatment patient-specific IMRTverifications. Theoretically, both a reduction in OTT andan increase in dose per fraction should result in a ther-apeutic gain in terms of the probability of tumourcontrol. Interestingly, an increase in the average weeklydose had a significant impact on LRC for patients withsquamous cell cancer of the head and neck (HN) receivingRT alone, but not for those undergoing concurrentchemotherapy.5
Inversely optimized IMRT was implemented in 2008 atIPOCFG and simultaneously integrated boost plans, withat least two prescription dose levels per plan, were usedas much as possible. This fractionation methodology
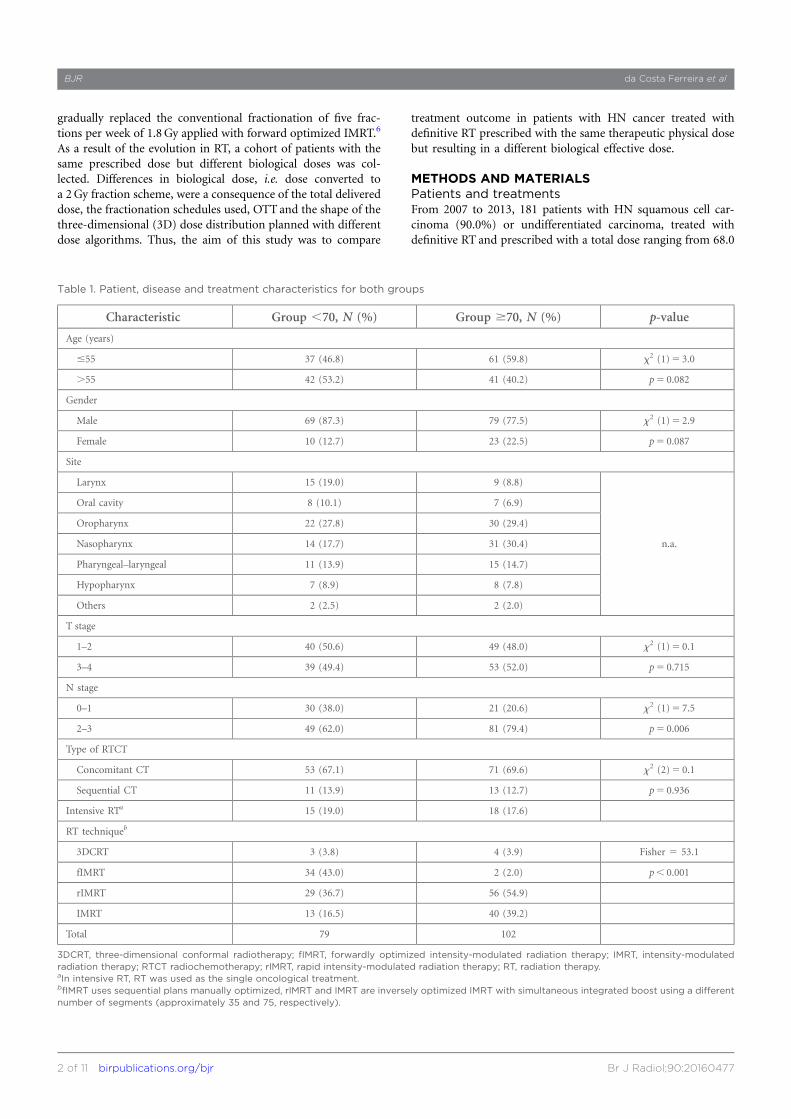
gradually replaced the conventional fractionation of five frac-tions per week of 1.8Gy applied with forward optimized IMRT.6
As a result of the evolution in RT, a cohort of patients with thesame prescribed dose but different biological doses was col-lected. Differences in biological dose, i.e. dose converted toa 2Gy fraction scheme, were a consequence of the total delivereddose, the fractionation schedules used, OTT and the shape of thethree-dimensional (3D) dose distribution planned with differentdose algorithms. Thus, the aim of this study was to compare
treatment outcome in patients with HN cancer treated withdefinitive RT prescribed with the same therapeutic physical dosebut resulting in a different biological effective dose.
METHODS AND MATERIALSPatients and treatmentsFrom 2007 to 2013, 181 patients with HN squamous cell car-cinoma (90.0%) or undifferentiated carcinoma, treated withdefinitive RT and prescribed with a total dose ranging from 68.0
Table 1. Patient, disease and treatment characteristics for both groups
Characteristic Group ,70, N (%) Group $70, N (%) p-value
Age (years)
#55 37 (46.8) 61 (59.8) x2 (1)5 3.0
.55 42 (53.2) 41 (40.2) p5 0.082
Gender
Male 69 (87.3) 79 (77.5) x2 (1)5 2.9
Female 10 (12.7) 23 (22.5) p5 0.087
Site
Larynx 15 (19.0) 9 (8.8)
n.a.
Oral cavity 8 (10.1) 7 (6.9)
Oropharynx 22 (27.8) 30 (29.4)
Nasopharynx 14 (17.7) 31 (30.4)
Pharyngeal–laryngeal 11 (13.9) 15 (14.7)
Hypopharynx 7 (8.9) 8 (7.8)
Others 2 (2.5) 2 (2.0)
T stage
1–2 40 (50.6) 49 (48.0) x2 (1)5 0.1
3–4 39 (49.4) 53 (52.0) p5 0.715
N stage
0–1 30 (38.0) 21 (20.6) x2 (1)5 7.5
2–3 49 (62.0) 81 (79.4) p5 0.006
Type of RTCT
Concomitant CT 53 (67.1) 71 (69.6) x2 (2)5 0.1
Sequential CT 11 (13.9) 13 (12.7) p5 0.936
Intensive RTa 15 (19.0) 18 (17.6)
RT techniqueb
3DCRT 3 (3.8) 4 (3.9) Fisher 5 53.1
fIMRT 34 (43.0) 2 (2.0) p, 0.001
rIMRT 29 (36.7) 56 (54.9)
IMRT 13 (16.5) 40 (39.2)
Total 79 102
3DCRT, three-dimensional conformal radiotherapy; fIMRT, forwardly optimized intensity-modulated radiation therapy; IMRT, intensity-modulatedradiation therapy; RTCT radiochemotherapy; rIMRT, rapid intensity-modulated radiation therapy; RT, radiation therapy.aIn intensive RT, RT was used as the single oncological treatment.bfIMRT uses sequential plans manually optimized, rIMRT and IMRT are inversely optimized IMRT with simultaneous integrated boost using a differentnumber of segments (approximately 35 and 75, respectively).
BJR da Costa Ferreira et al
2 of 11 birpublications.org/bjr Br J Radiol;90:20160477
to 70.6 Gy to the primary tumour, delivered with a dose perfraction varying from 1.8 to 2.15Gy, were included in this study.The clinical data electronically stored during the routine RTmedical appointments were used in this retrospective study.7
Patients were divided into two groups depending on whether thevalue of the mean dose converted to a 2Gy fractionation in theprimary tumour was inferior or superior to 70.2 Gy (Group,70and Group$70, respectively). The reasons for selecting the dosedelivered to the primary tumour were threefold: first, recur-rences occurred mostly in the vicinity of the primary tumour;8
second, the biological dose escalation, through an increase indose per fraction, was mostly applied to this volume; and third,reducing OTT resulted in clinical benefits in controlling thegross tumour but had little effect on the control of necknodes.2,9 A dose–response effect, resulting from the biologicaldose escalation obtained by an increase in dose per fraction andreducing OTT, would thus be more evident in the primary tu-mour. Patient, disease and treatment characteristics for bothgroups are summarized in Table 1.
Treatment details are described elsewhere.6,8 In summary, targetvolume delineation followed Gregoire et al.10 Prescription dose toprimary tumour volume and large adenopathies was around70.2Gy and to high- and low-risk lymph nodes, it ranged from50.4 to 59.4Gy. The main organs at risk included in plan opti-mization were: spinal cord, brainstem, mandible, parotid glands,thyroid and others considered relevant for each pathology.
Planning was performed in the treatment planning systemsOncentra® (Nucletron; Elekta, Stockholm, Sweden) and de-livery was performed in ONCOR™ Avant-Garde from Siemens(Germany) (step-and-shoot technique for inverse IMRT).During the time frame of this study, i.e. 2007–2013, simplertarget volumes were irradiated with 3D conformal treatmenttechniques (3DCRT, i.e., a simplified version of forward op-timized IMRT), using up to 10 beams and a daily fraction of1.8 Gy. More complex cases were irradiated with IMRT. From2007–2012 forwardly optimized IMRT (fIMRT) was used.This technique used 5–7 gantry directions with a total of15–25 segments manually optimized. Dose fractionationschedule was also based on the delivery of five fractions of1.8 Gy per week. This technique was replaced by inverselyoptimized IMRT using 30–55 segments (rIMRT) (rapidintensity-modulated radiation therapy) or 70–80 segments(IMRT) for more complex targets and when the patient couldsustain longer irradiation times. With inversely optimizedIMRT, dose integration of at least two prescription dose levelsper plan was made. Therefore, in most cases, the first targetvolume, generally low-risk lymph nodes, was being irradiatedwith a minimum daily fraction of 1.8 Gy and the second orthird with a maximum daily fraction of 2.15 Gy.
Although in this population cohort, different delivery techniqueswere used for treatment, it is the delivered dose distribution thatshould be related to the outcome. Therefore, in this study, the
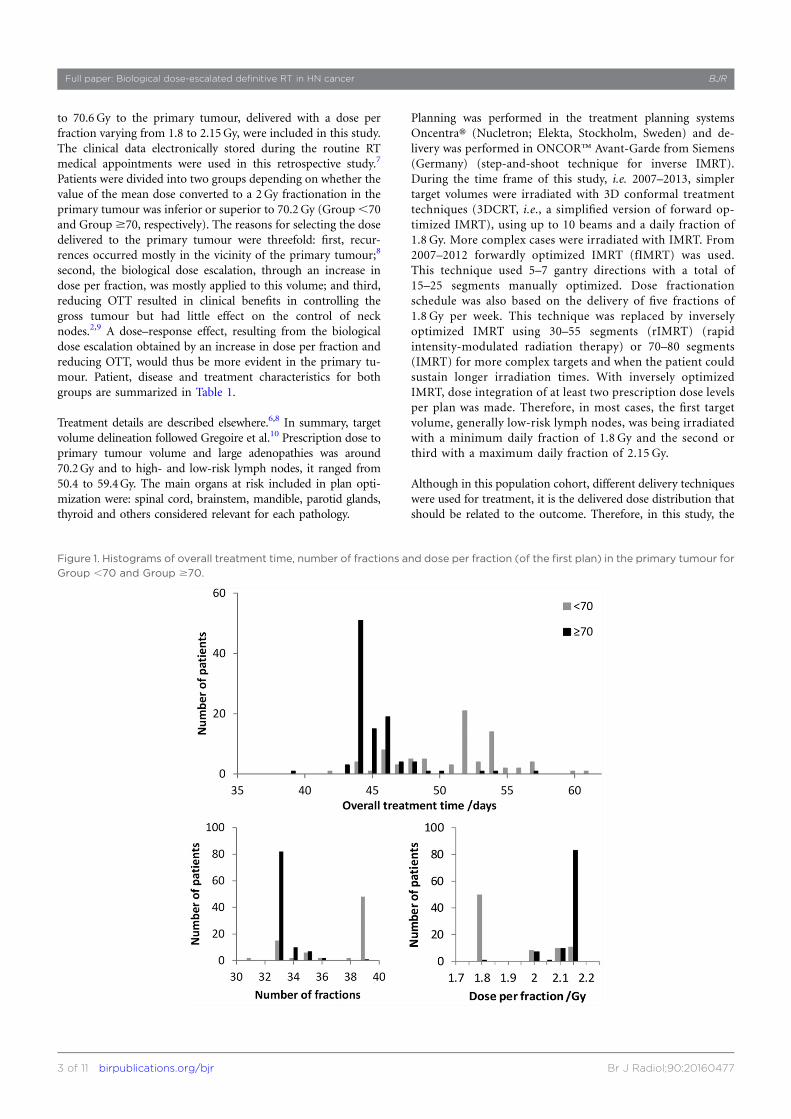
Figure 1. Histograms of overall treatment time, number of fractions and dose per fraction (of the first plan) in the primary tumour for
Group ,70 and Group $70.
Full paper: Biological dose-escalated definitive RT in HN cancer BJR
3 of 11 birpublications.org/bjr Br J Radiol;90:20160477

analysis was based on the information gathered from the 3Ddose matrix aiming to minimize the dependency on the deliverytechnique. Dose was calculated using collapsed cone as the dosecomputation algorithm for all patients. Plans made using thepencil beam dose algorithm were restored in the treatmentplanning system and recalculated using the most recent dosealgorithm. For patients with significant anatomic deviationsrelatively to the planning CT, replanning was performed and thetotal accumulated dose was used for dosimetric assessment.Image co-registrations between different CTs were made usingVelocity AI 2.7 (Varian).
Using the planned 3D dose matrices of each patient (from one tothree sequential plans), total dose was converted to a 2Gyfractionation scheme, in each structure of interest and/or voxel,using the Biological Effective Dose (BED) concept and themethodology described in detail in Ferreira et al.6
BED5+Np
i
�Di
�11
dia=b
��2
ln2
aTpotmaxð0;T2TkÞ
5D2Gy
�11
2
a=b
�2
ln2
aTpotmax
�0;T2Gy 2Tk
�; (1)
where Np is the number of plans and Di is the total nominal orphysical dose in each voxel delivered in plan i in fractions of sizedi. a/b is the ratio of the linear quadratic model. Tpot is thetumour potential doubling time, T is the real OTT for theprescribed treatment and Tk is the time at which repopulationbegins. D2Gy is the total dose converted into a fractionation of2Gy, delivered during T2Gy days, which results in the same bi-ological effect. In this study, for HN tumours, an a/b of 10,a potential doubling time of 3 days and a kick-off time forrepopulation of 28 days were used.11 For the organs at risk, therepopulation term was disregarded and an a/b of 3 was used.
Concomitant chemotherapy was mainly cisplatin based.Patients unable to undergo this scheme were evaluated tocetuximab. In the sequential protocol, RT was administeredbetween cycles of chemotherapy using mostly docetaxel cisplatinand Fluorouracil (TPF) or cisplatin and fluorouracil (PF).
During treatment, all patients attended a weekly medicalappointment at the RT department. After that, follow-upoccurred with 3-month intervals during 2 years, after whichperiodicity was reduced to every 6 months. At each follow-upvisit, a complete physical examination, CT and/or MRI,assessment of radiation-induced secondary effects wasperformed. Radiation Therapy Oncology Group/EuropeanOrganisation for Research and Treatment of Cancer guide-lines were mostly used to score observed complications.12
Routine blood tests and thyroid function assessment alsomade part of the clinical follow-up protocol. Mean follow-uptime for Groups ,70 and $70 was 27.8 months [95% con-fidence interval (CI): 23.9–31.7 months] and 18.9 months(95% CI: 16.4–21.4 months), respectively. Median follow-uptime for Groups ,70 and $70 was 24.8 months (95% CI:21.5–28.0 months) and 17.6 months (95% CI: 13.7–21.4 months), respectively.
Statistical analysisLocal control (LC) and LRC were defined from the time completetumour response to the initial treatment protocol was obtained.Disease-free survival (DFS) was defined from the time of completetumour response to the therapy up to the time of recurrence,metastasis, second tumour or death. Time to distant metastasis(DM) and OS were calculated from the start of RT. LC, LRC, DFS,distant metastasis (DM) and OS were calculated using theKaplan–Meier method. Log-rank test was used to test the equalityof the survival distributions between both groups.
Summary statistics were reported as mean and standard de-viation values for continuous variables and as counts and per-centages for categorical variables. Comparisons between patientcharacteristics and groups were evaluated using x2 test forcontingency tables (when the expected cell count assumption isverified) or Fisher’s exact test (otherwise). The dose statistics inthe primary tumour: prescribed dose, the physical dose and thedose converted for 2Gy fractions were compared for bothpatients groups using the independent t-test (normality as-sumption verified by Kolmogorov–Smirnov test) or using theMann–Whitney U test (otherwise). For the difference betweentwo independent proportions, a z-test was used.
Figure 2. Comparison between the prescribed dose (Dpresc),
the nominal mean dose in the primary target volume (Dmean)
and the mean dose converted to 2Gy (Dmean_2Gy) for patients
with a mean biological dose in the primary tumour inferior and
superior to 70.2Gy.
BJR da Costa Ferreira et al
4 of 11 birpublications.org/bjr Br J Radiol;90:20160477

The incidence of complications in the salivary glands (xero-stomia), oesophagus (dysphagia), pharynx (odynophagia), larynx(dysphonia), skin (radiodermatitis), hair (alopecia), mucousmembrane (mucositis), teeth and ear (hypoacusia), as well as painand weight loss, for both patient groups was compared at the timemaximum severity of RT side effects was observed, at 7 weeks(43.063.2 days), at 1264 months and 246 5 months after RT,selecting the closest medical appointment from the period underevaluation. x2 test for contingency tables or Fisher’s exact test wasused for this comparison. For the longitudinal analysis of patientresponse to RT, the information gathered in all RT appointmentswas grouped into time intervals of increasing extent, as follow-uptime became longer, i.e. as the numbers of patients significantlydecreased with increasing follow-up time, even larger timeintervals had to be considered for analysis.
Potential prognostic factors (hazard ratios and 95% CIs) asso-ciated with LC, LRC, DFS and OS were explored in univariateand multivariate analyses performed using the Cox regressionmodels. These were: age, gender, tumour site (hypopharynx,pharyngeal–laryngeal, larynx vs oropharynx vs oral cavity vsnasopharynx), T stage (1–2 vs 3–4) and N stage (0–1 vs 2–3),mean dose converted to 2Gy in the primary tumour (,70 vs$70Gy), dose per fraction (#2 vs . 2Gy) and OTT. The var-iable dose per fraction and OTT were excluded from the mul-tivariate analysis owing to high correlation with the mean doseconverted to 2Gy in the primary tumour. Cox regression wasperformed using a forced entry method (all the consideredvariables are entered into the equation in one step).
All statistical analyses were performed using SPSS® Software,v. 20.0 (IBM Corp., New York, NY; formerly SPSS Inc., Chicago,IL), and p-values under 0.05 were considered significant.
RESULTSFigure 1 shows the histograms for OTT, the number of fractionsand the dose per fraction for Groups ,70 and $70. 60.8% ofthe patients of Group ,70 were irradiated with 39 fractions of1.8 Gy, while 79.4% of the patients of Group $70 were irradi-ated in the primary tumour with 33 fractions of around 2.13Gy.For this population cohort, 65.7% of the patients received RT asplanned. Mean OTT for Group ,70 was 51.26 3.9 days (range:42–61 days) and for Group $70, it was 45.16 2.2 days (range:39–57 days) (p, 0.001). The percentage of treatment breaks dueto different causes was similar between the two groups, exceptfor interruptions due to holidays. Major cause for prolongationof OTT was RT toxicity and intercurrent disease (26.6% and21.9%, respectively). Possibly, owing to the longer treatmentprescribed to Group ,70, breaks due to holidays were 31.3%compared with 21.9% in Group $70.
In Figure 2, the frequency distribution of the prescribed dose,the mean physical dose and the dose converted to 2Gy fractions,or biological dose, in the primary tumour for both patientgroups is shown. The average nominal mean doses in the pri-mary tumour for Group ,70 and Group $70 were 68.761.9 Gy and 70.26 1.6Gy (p, 0.001), respectively, and the av-erage mean doses converted to 2Gy were 62.76 4.2 Gy and73.16 2.7Gy (p, 0.001), respectively. Other dose statistics inthe primary tumour may be seen in Table 2. For the parotidglands, a statistically significantly larger average mean dose wasdelivered in Group ,70 than in Group $70 (p# 0.015).
For Groups ,70 and $70, complete tumour response wasobtained in 70.9% and 72.5% of the patients (p5 0.81), re-spectively; partial tumour response was obtained in 19.0% vs15.7% of the patients (p5 0.56), respectively, and tumour
Table 2. Dose statistics for Groups ,70 and $70 for the planning target volume of the primary tumour (PTV-T) and theparotid glands
Group
Physical dose/GyAverage6 SD
(minimum–maximum)
Dose converted to 2Gy fractions/GyAverage6 SD
(minimum–maximum)
,70 $70 Statistics ,70 $70 Statistics
PTV-T
D98%64.26 3.2(48.1–68.9)
65.36 1.9(60.1–70.9)
t(179)523.0p5 0.005
54.26 4.7(36.8–63.5)
63.76 3.4(54.6–74.2)
t(179)5215.8p, 0.001
Dmean68.76 1.9(62.4–72.4)
70.26 1.6(68.4–77.5)
t(179)525.8p, 0.001
62.76 4.2(52.1–69.9)
73.16 2.7(70.0–87.4)
t(179)5220.2p, 0.001
D2%71.76 1.9(66.9–77.3)
73.36 1.9(70.4–81.1)
t(179)525.9p,0.001
68.46 5.1(55.9–79.5)
79.36 3.5(73.9–95.7)
t(179)5217.0p,0.001
Contralateral parotid
Dmean36.56 8.3(0.8–58.0)
34.26 6.0(13.6–55.1)
t(174)5 2.1p50.035
31.56 8.3(0.5–53.7)
28.86 5.9(9.5–50.1)
t(174)5 2.5p50.015
Ipsilateral parotid
Dmean41.36 9.6(0.9–67.2)
37.16 5.9(19.1–56.8)
t(175)5 3.6p, 0.001
36.26 9.6(0.5–63.7)
31.86 6.1(14.6–52.4)
t(175)5 3.7p, 0.001
Dmean, mean dose in the primary target volume; SD, standard devaition.D2% and D98% are the maximum and minimum significant doses.
Full paper: Biological dose-escalated definitive RT in HN cancer BJR
5 of 11 birpublications.org/bjr Br J Radiol;90:20160477
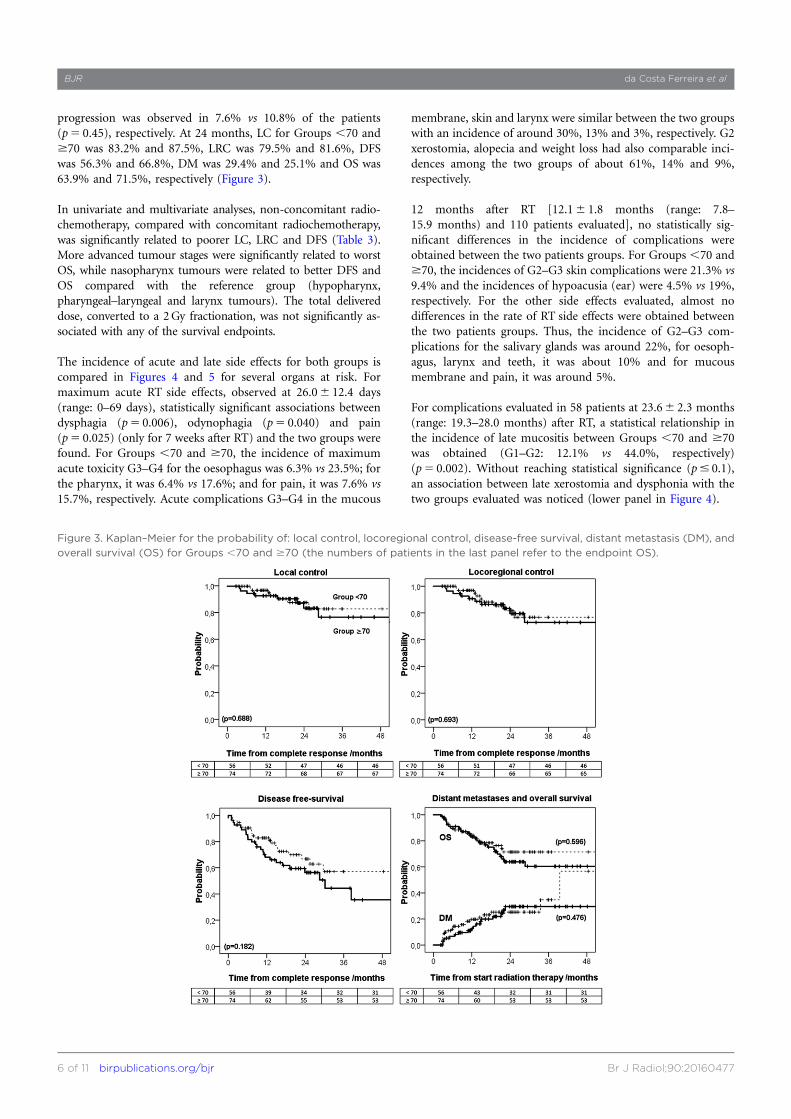
progression was observed in 7.6% vs 10.8% of the patients(p5 0.45), respectively. At 24 months, LC for Groups ,70 and$70 was 83.2% and 87.5%, LRC was 79.5% and 81.6%, DFSwas 56.3% and 66.8%, DM was 29.4% and 25.1% and OS was63.9% and 71.5%, respectively (Figure 3).
In univariate and multivariate analyses, non-concomitant radio-chemotherapy, compared with concomitant radiochemotherapy,was significantly related to poorer LC, LRC and DFS (Table 3).More advanced tumour stages were significantly related to worstOS, while nasopharynx tumours were related to better DFS andOS compared with the reference group (hypopharynx,pharyngeal–laryngeal and larynx tumours). The total delivereddose, converted to a 2Gy fractionation, was not significantly as-sociated with any of the survival endpoints.
The incidence of acute and late side effects for both groups iscompared in Figures 4 and 5 for several organs at risk. Formaximum acute RT side effects, observed at 26.06 12.4 days(range: 0–69 days), statistically significant associations betweendysphagia (p5 0.006), odynophagia (p5 0.040) and pain(p5 0.025) (only for 7 weeks after RT) and the two groups werefound. For Groups ,70 and $70, the incidence of maximumacute toxicity G3–G4 for the oesophagus was 6.3% vs 23.5%; forthe pharynx, it was 6.4% vs 17.6%; and for pain, it was 7.6% vs15.7%, respectively. Acute complications G3–G4 in the mucous
membrane, skin and larynx were similar between the two groupswith an incidence of around 30%, 13% and 3%, respectively. G2xerostomia, alopecia and weight loss had also comparable inci-dences among the two groups of about 61%, 14% and 9%,respectively.
12 months after RT [12.16 1.8 months (range: 7.8–15.9 months) and 110 patients evaluated], no statistically sig-nificant differences in the incidence of complications wereobtained between the two patients groups. For Groups ,70 and$70, the incidences of G2–G3 skin complications were 21.3% vs9.4% and the incidences of hypoacusia (ear) were 4.5% vs 19%,respectively. For the other side effects evaluated, almost nodifferences in the rate of RT side effects were obtained betweenthe two patients groups. Thus, the incidence of G2–G3 com-plications for the salivary glands was around 22%, for oesoph-agus, larynx and teeth, it was about 10% and for mucousmembrane and pain, it was around 5%.
For complications evaluated in 58 patients at 23.66 2.3 months(range: 19.3–28.0 months) after RT, a statistical relationship inthe incidence of late mucositis between Groups ,70 and $70was obtained (G1–G2: 12.1% vs 44.0%, respectively)(p5 0.002). Without reaching statistical significance (p# 0.1),an association between late xerostomia and dysphonia with thetwo groups evaluated was noticed (lower panel in Figure 4).
Figure 3. Kaplan–Meier for the probability of: local control, locoregional control, disease-free survival, distant metastasis (DM), and
overall survival (OS) for Groups ,70 and $70 (the numbers of patients in the last panel refer to the endpoint OS).
BJR da Costa Ferreira et al
6 of 11 birpublications.org/bjr Br J Radiol;90:20160477
DISCUSSIONTwo or three sequential plans were commonly used in confor-mal RT of HN tumour cases. With IMRT and the high workloadrequired with this treatment technique, both in treatmentplanning and patient-specific quality control, a reduction in thenumber of plans made for each patient was mandatory. Simul-taneous integrated boost techniques in the IMRT context werefirst suggested by Butler et al in 1999,13 later discussed by Mohanet al in 200014 and widely implemented by the clinical commu-nity. This represents the delivery of a dose per fraction in thedifferent target volumes ranging from 1.6 to 2.5Gy.6,15,16 Theconventional fractionation of 2Gy was historically embraced be-cause it represents the optimal balance between tumour cell killand late side effects. Increasing the dose per fraction, relatively tothis standard fractionation, should result in higher probability oftumour control. With the protective effect obtained with IMRT,by reducing both total delivered dose and the dose per fraction inthe organs at risk, the levels of toxicity may be reduced or at leastmaintained if a dose escalation approach was adopted. Acceptableclinical results with simultaneous integrated boost techniques inHN cancer were already reported by several.15–18
In this study, the population cohort was divided into two groupsdepending on the biological dose delivered to the primary tumour.The heterogeneity in the values of the biological dose resultedmainly from differences in the fractionation schedule and the doseassessed by different dose algorithms at the time of planning.Group ,70 was mainly composed of patients treated with 39fractions of 1.8Gy in 52–54 days, while Group $70 was mostlycomposed of patients treated with inverse IMRT in 44 days witha dose per fraction of 2.13Gy in the primary tumour (Figure 1). Inthis cohort, 20% of the patients were planned using pencil beams(up to 2010). Thus, for Group ,70, differences between the pre-scribed dose and the planned physical dose, recalculated with thecollapsed cone algorithm in here, were obtained (Figure 2).
Physical dose was converted into biological dose so that thecomparison between the outcomes of patients treated with
Table 3. Multivariate results from Cox’s regression for theendpoints: local control (LC), locoregional control (LRC),disease-free survival (DFS) and overall survival (OS). Gender(male) was excluded from multivariate analysis owing to poorestimation. Dose per fraction and overall treatment time werealso excluded owing to high correlation with mean doseconverted to 2Gy in the primary tumour (Dmean).
Variables HR 95% CI p-value
LC
Age 1.00 (0.96; 1.05) 0.88
Tumour site
Hypo1Ph/la1 Lar 1 – –
Oral cavity 3.05 (0.51; 18.13) 0.22
Oropharynx 0.70 (0.20; 2.53) 0.59
Nasopharynx 0.29 (0.05; 1.58) 0.15
T stage (3–4) 2.81 (0.80; 9.87) 0.11
N stage (2–3) 0.96 (0.29; 3.23) 0.95
Non-concomitant RT 3.70 (1.09;12.50) 0.04
Dmean ($70Gy) 1.14 [0.39; 3.31] 0.82
LRC
Age 1.02 [0.98; 1.06] 0.43
Tumour site
Hypo1Ph/la1 Lar 1 -- --
Oral cavity 2.56 [0.45; 14.39] 0.29
Oropharynx 0.57 [0.18; 1.78] 0.33
Nasopharynx 0.34 [0.08; 1.41] 0.14
T stage (3–4) 2.47 [0.83; 7.35] 0.10
N stage (2–3) 0.88 [0.30; 2.60] 0.82
Non-concomitant RT 4.78 [1.61;14.13] 0.005
Dmean ($70Gy) 1.18 [0.46; 3.04] 0.73
DFS
Age 1.00 [0.97; 1.03] 0.80
Tumour site
Hypo1Ph/la1 Lar 1 – –
Oral cavity 1.21 [0.34; 4.34] 0.77
Oropharynx 0.55 [0.26; 1.13] 0.10
Nasopharynx 0.28 [0.11; 0.69] 0.006
T stage (3–4) 1.29 [0.67; 2.48] 0.45
N stage (2–3) 0.88 [0.44; 1.76] 0.72
Non-concomitant RT 2.00 [1.03; 3.86] 0.04
Dmean ($70Gy) 0.95 [0.51; 1.79] 0.88
OS
Age 1.02 [0.99; 1.05] 0.15
Gender (male) 0.64 [0.25; 1.64] 0.36
(Continued)
Table 3. (Continued)
Variables HR 95% CI p-value
Tumour site
Hypo1Ph/la1 Lar 1 – –
Oral cavity 1.92 [0.80; 4.64] 0.15
Oropharynx 0.97 [0.46; 2.06] 0.94
Nasopharynx 0.24 [0.08; 0.72] 0.01
T stage (3–4) 2.07 [1.01; 4.27] 0.048
N stage (2–1) 2.12 [0.89; 5.02] 0.09
Non-concomitant RT 0.75 [0.36; 1.55] 0.43
Dmean ($70Gy) 1.02 [0.55; 1.91] 0.94
CI, confidence interval; Dmean, mean dose in the primary target volume;HR, hazard ratio; RT, radiation therapy.Hypo 1 Ph/Lar 1 Lar is the group of patients with hypopharynx,pharyngeal-laryngeal and larynx tumours.Variables in bold have p#0.05.
Full paper: Biological dose-escalated definitive RT in HN cancer BJR
7 of 11 birpublications.org/bjr Br J Radiol;90:20160477

different fractionation schedules could be made using the well-established BED concept. The real OTT, the number of fractionsdelivered and the planned 3D dose distribution were thus takeninto account in the calculation of the biological effective dose.Owing to the influence of these factors in the biological effect,the curve of the biological dose, in Figure 2, is more spread outthan the curve of the physical dose. For the patients included inGroup $70, the curve showing the biological dose moved to-wards higher values than the physical dose owing to the positiveeffect of shortening OTT and increasing dose per fraction,compared with the reference fraction dose of 2Gy, while theopposite happens to Group ,70. As a consequence of all thesefactors, the dose delivered to Group$70 was significantly higherthan the dose delivered to Group ,70 (Table 2).
A trend for better survival outcome in Group $70, comparedwith Group ,70, was noticed. A 10% difference in DFS andalmost 8% in OS between the two groups was obtained. Thedifference in DFS was also related to the higher incidence ofsecond neoplasias in Group ,70 compared with Group $70(6% vs 1%, respectively). By contrast, the higher DM in Group$70, compared with Group ,70, may be related to the higherrate of N2–3 tumour cases in this group (Table 1). At shortfollow-up times, the difference in LC and LRC between the twogroups was negligible, becoming more pronounced 30 monthsafter RT (Figure 3). Although the level of evidence of this ret-rospective study is low, similar results were obtained by Miahet al18 and Leclerc et al15 for larynx and hypopharynx tumourcases. Differences in LRC, and OS, of around 10% were obtained
Figure 4. Incidence of acute and late side effects to radiation therapy (RT) for patients of Group ,70 and Group $70 (first and
second bars, respectively). The star indicates the RT side effects that resulted in statistically significant differences between the two
groups. MucMembr, mucosal membrane; SalGland, salivary gland; Oesoph, oesophagus.
BJR da Costa Ferreira et al
8 of 11 birpublications.org/bjr Br J Radiol;90:20160477
only 2 years after RT when escalating the dose from 63Gy to67Gy, delivered in 28 fractions, and from 69Gy to 72Gy, de-livered in 30 fractions, respectively. In this study, despite thelarger dose delivered with the new fractionation schedule, nostatistically significant survival differences between the twogroups were obtained. Thus, it is not possible to concludewhether these differences are potentially due to the biologicaldose escalation, as it would be expected, and significance waslost by the lack of statistical power of the study (small sample,small number of events in each category and short follow-uptime), or whether the heterogeneity of this cohort, groupingtumour cases that may respond differently to fractionation, re-duced the steepness of the dose–response curve, and no signif-icant dose effect actually happens at such dose levels. With theavailability of new treatment regimens based on improved
knowledge of risk factors and radiobiology, therapies will beincreasingly personalized.19,20 Survival and radiobiologicalstudies are therefore needed, ideally, grouping tumour cases byfactors that affect patient response to radiation such as: generalhealth status, living habits, normal tissues and tumour biologicalparameters, tumour microenvironment features etc.20–23 Dose–response models on tumour response to radiation certainly needto be investigated more.
With simultaneous integrated boost IMRT, organ sparing isachieved through the highly conformal dose distributions pro-duced by intensity-modulated beams and by avoiding the ad-ditional dose delivered by multiple plans. Thus, although thetotal dose in the primary tumour was larger in Group $70,compared with the Group ,70, the total dose in the parotid
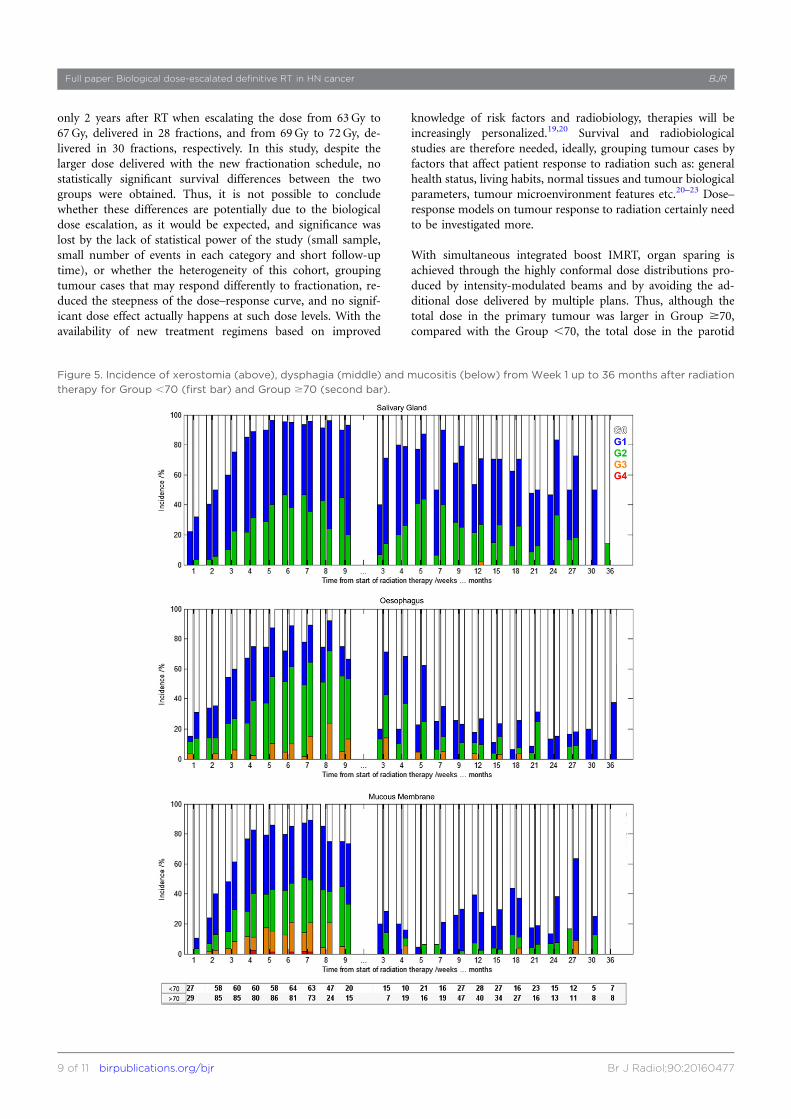
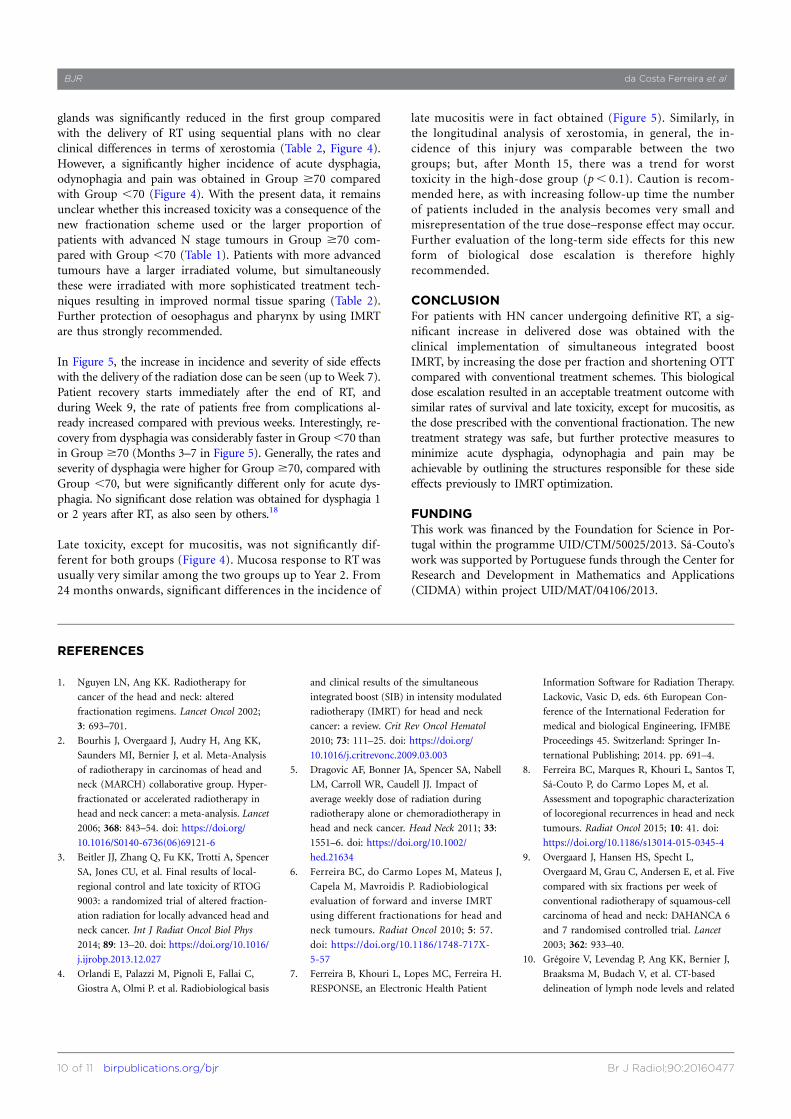
Figure 5. Incidence of xerostomia (above), dysphagia (middle) and mucositis (below) from Week 1 up to 36 months after radiation
therapy for Group ,70 (first bar) and Group $70 (second bar).
Full paper: Biological dose-escalated definitive RT in HN cancer BJR
9 of 11 birpublications.org/bjr Br J Radiol;90:20160477
glands was significantly reduced in the first group comparedwith the delivery of RT using sequential plans with no clearclinical differences in terms of xerostomia (Table 2, Figure 4).However, a significantly higher incidence of acute dysphagia,odynophagia and pain was obtained in Group $70 comparedwith Group ,70 (Figure 4). With the present data, it remainsunclear whether this increased toxicity was a consequence of thenew fractionation scheme used or the larger proportion ofpatients with advanced N stage tumours in Group $70 com-pared with Group ,70 (Table 1). Patients with more advancedtumours have a larger irradiated volume, but simultaneouslythese were irradiated with more sophisticated treatment tech-niques resulting in improved normal tissue sparing (Table 2).Further protection of oesophagus and pharynx by using IMRTare thus strongly recommended.
In Figure 5, the increase in incidence and severity of side effectswith the delivery of the radiation dose can be seen (up to Week 7).Patient recovery starts immediately after the end of RT, andduring Week 9, the rate of patients free from complications al-ready increased compared with previous weeks. Interestingly, re-covery from dysphagia was considerably faster in Group,70 thanin Group $70 (Months 3–7 in Figure 5). Generally, the rates andseverity of dysphagia were higher for Group $70, compared withGroup ,70, but were significantly different only for acute dys-phagia. No significant dose relation was obtained for dysphagia 1or 2 years after RT, as also seen by others.18
Late toxicity, except for mucositis, was not significantly dif-ferent for both groups (Figure 4). Mucosa response to RT wasusually very similar among the two groups up to Year 2. From24 months onwards, significant differences in the incidence of
late mucositis were in fact obtained (Figure 5). Similarly, inthe longitudinal analysis of xerostomia, in general, the in-cidence of this injury was comparable between the twogroups; but, after Month 15, there was a trend for worsttoxicity in the high-dose group (p, 0.1). Caution is recom-mended here, as with increasing follow-up time the numberof patients included in the analysis becomes very small andmisrepresentation of the true dose–response effect may occur.Further evaluation of the long-term side effects for this newform of biological dose escalation is therefore highlyrecommended.
CONCLUSIONFor patients with HN cancer undergoing definitive RT, a sig-nificant increase in delivered dose was obtained with theclinical implementation of simultaneous integrated boostIMRT, by increasing the dose per fraction and shortening OTTcompared with conventional treatment schemes. This biologicaldose escalation resulted in an acceptable treatment outcome withsimilar rates of survival and late toxicity, except for mucositis, asthe dose prescribed with the conventional fractionation. The newtreatment strategy was safe, but further protective measures tominimize acute dysphagia, odynophagia and pain may beachievable by outlining the structures responsible for these sideeffects previously to IMRT optimization.
FUNDINGThis work was financed by the Foundation for Science in Por-tugal within the programme UID/CTM/50025/2013. Sa-Couto’swork was supported by Portuguese funds through the Center forResearch and Development in Mathematics and Applications(CIDMA) within project UID/MAT/04106/2013.
REFERENCES
1. Nguyen LN, Ang KK. Radiotherapy for
cancer of the head and neck: altered
fractionation regimens. Lancet Oncol 2002;
3: 693–701.
2. Bourhis J, Overgaard J, Audry H, Ang KK,
Saunders MI, Bernier J, et al. Meta-Analysis
of radiotherapy in carcinomas of head and
neck (MARCH) collaborative group. Hyper-
fractionated or accelerated radiotherapy in
head and neck cancer: a meta-analysis. Lancet
2006; 368: 843–54. doi: https://doi.org/
10.1016/S0140-6736(06)69121-6
3. Beitler JJ, Zhang Q, Fu KK, Trotti A, Spencer
SA, Jones CU, et al. Final results of local-
regional control and late toxicity of RTOG
9003: a randomized trial of altered fraction-
ation radiation for locally advanced head and
neck cancer. Int J Radiat Oncol Biol Phys
2014; 89: 13–20. doi: https://doi.org/10.1016/
j.ijrobp.2013.12.027
4. Orlandi E, Palazzi M, Pignoli E, Fallai C,
Giostra A, Olmi P. et al. Radiobiological basis
and clinical results of the simultaneous
integrated boost (SIB) in intensity modulated
radiotherapy (IMRT) for head and neck
cancer: a review. Crit Rev Oncol Hematol
2010; 73: 111–25. doi: https://doi.org/
10.1016/j.critrevonc.2009.03.003
5. Dragovic AF, Bonner JA, Spencer SA, Nabell
LM, Carroll WR, Caudell JJ. Impact of
average weekly dose of radiation during
radiotherapy alone or chemoradiotherapy in
head and neck cancer. Head Neck 2011; 33:
1551–6. doi: https://doi.org/10.1002/
hed.21634
6. Ferreira BC, do Carmo Lopes M, Mateus J,
Capela M, Mavroidis P. Radiobiological
evaluation of forward and inverse IMRT
using different fractionations for head and
neck tumours. Radiat Oncol 2010; 5: 57.
doi: https://doi.org/10.1186/1748-717X-
5-57
7. Ferreira B, Khouri L, Lopes MC, Ferreira H.
RESPONSE, an Electronic Health Patient
Information Software for Radiation Therapy.
Lackovic, Vasic D, eds. 6th European Con-
ference of the International Federation for
medical and biological Engineering, IFMBE
Proceedings 45. Switzerland: Springer In-
ternational Publishing; 2014. pp. 691–4.
8. Ferreira BC, Marques R, Khouri L, Santos T,
Sa-Couto P, do Carmo Lopes M, et al.
Assessment and topographic characterization
of locoregional recurrences in head and neck
tumours. Radiat Oncol 2015; 10: 41. doi:
https://doi.org/10.1186/s13014-015-0345-4
9. Overgaard J, Hansen HS, Specht L,
Overgaard M, Grau C, Andersen E, et al. Five
compared with six fractions per week of
conventional radiotherapy of squamous-cell
carcinoma of head and neck: DAHANCA 6
and 7 randomised controlled trial. Lancet
2003; 362: 933–40.
10. Gregoire V, Levendag P, Ang KK, Bernier J,
Braaksma M, Budach V, et al. CT-based
delineation of lymph node levels and related
BJR da Costa Ferreira et al
10 of 11 birpublications.org/bjr Br J Radiol;90:20160477

CTVs in the node-negative neck:
DAHANCA, EORTC, GORTEC, NCIC,
RTOG consensus guidelines. Radiother Oncol
2003; 69: 227–36.
11. Fowler JF. Optimum overall times II: ex-
tended modelling for head and neck radio-
therapy. Clin Oncol (R Coll Radiol) 2008; 20:
113–26. doi: https://doi.org/10.1016/j.
clon.2007.11.003
12. Cox JD, Stetz J, Pajak TF. Toxicity criteria of
the Radiation Therapy Oncology Group
(RTOG) and the European Organization for
Research and Treatment of Cancer (EORTC).
Int J Radiat Oncol Biol Phys 1995; 31: 1341–6.
doi: https://doi.org/10.1016/0360-3016(95)
00060-C
13. Butler EB, Teh BS, Grant WH 3rd, Uhl BM,
Kuppersmith RB, Chiu JK, et al. Smart
(simultaneous modulated accelerated radia-
tion therapy) boost: a new accelerated
fractionation schedule for the treatment of
head and neck cancer with intensity modu-
lated radiotherapy. Int J Radiat Oncol Biol
Phys 1999; 45: 21–32.
14. Mohan R, Wu Q, Manning M, Schmidt-
Ullrich R. Radiobiological considerations in
the design of fractionation strategies for
intensity-modulated radiation therapy of
head and neck cancers. Int J Radiat Oncol
Biol Phys 2000; 46: 619–30.
15. Leclerc M, Maingon P, Hamoir M, Dalban C,
Calais G, Nuyts S, et al. A dose escalation
study with intensity modulated radiation
therapy (IMRT) in T2N0, T2N1, T3N0
squamous cell carcinomas (SCC) of the
oropharynx, larynx and hypopharynx using
a simultaneous integrated boost (SIB) ap-
proach. Radiother Oncol 2013; 106: 333–40.
doi: https://doi.org/10.1016/j.
radonc.2013.03.002
16. Franzese C, Fogliata A, Clerici E,
Franceschini D, Villa E, D’Agostino G, et al.
Toxicity profile and early clinical outcome for
advanced head and neck cancer patients
treated with simultaneous integrated boost
and volumetric modulated arc therapy.
Radiat Oncol 2015; 10: 224. doi: https://doi.
org/10.1186/s13014-015-0535-0
17. Lauve A, Morris M, Schmidt-Ullrich R, Wu
Q, Mohan R, Abayomi O, et al. Simultaneous
integrated boost intensity-modulated radio-
therapy for locally advanced head-and-neck
squamous cell carcinomas: II—clinical
results. Int J Radiat Oncol Biol Phys 2004;
60: 374–87.
18. Miah AB, Bhide SA, Guerrero-Urbano MT,
Clark C, Bidmead AM, St Rose S, et al.
Dose-escalated intensity-modulated radio-
therapy is feasible and may improve locore-
gional control and laryngeal preservation in
laryngo-hypopharyngeal cancers. Int J Radiat
Oncol Biol Phys 2012; 82: 539–47. doi:
https://doi.org/10.1016/j.ijrobp.2010.09.055
19. Kelly JR, Husain ZA, Burtness B. Treatment
de-intensification strategies for head and
neck cancer. Eur J Cancer 2016; 68: 125–33.
doi: https://doi.org/10.1016/j.
ejca.2016.09.006
20. Biau J, Chautard E, Miroir J, Lapeyre M.
Radioresistance parameters in head and neck
cancers and methods to radiosensitize. [In
French.] Cancer Radiother 2015; 19: 337–46.
21. Bol V, Gregoire V. Biological basis for
increased sensitivity to radiation therapy in
HPV-positive head and neck cancers. Biomed
Res Int 2014; 1–6. doi: https://doi.org/
10.1155/2014/696028
22. Becker-Schiebe M, Sperling M, Pinkert U,
Hoffmann W. Impact of p16 alterations and
pretreatment anemia on toxicity in head and
neck cancer patients undergoing definitive
radiochemotherapy. Oncol Res Treat 2015; 38:
570–6. doi: https://doi.org/10.1159/
000441344
23. Swartz JE, Pothen AJ, Stegeman I, Willems
SM, Grolman W. Clinical implications of
hypoxia biomarker expression in head and
neck squamous cell carcinoma: a systematic
review. Cancer Med 2015; 4: 1101–16. doi:
https://doi.org/10.1002/cam4.460
Full paper: Biological dose-escalated definitive RT in HN cancer BJR
11 of 11 birpublications.org/bjr Br J Radiol;90:20160477