Embed Size (px)
Citation preview

BIOLOGICAL DEGRADATION OF AZO DYES
IN AN ANAEROBIC SYSTEM
by
Cynthia Mary Carliell
Submitted in fulfilment of the academic requirements for the degree of
Master of Science in Engineering
in the Department of Chemical Engineering, University of Natal.
Pollution Research Group
Department of Chemical Engineering
University of Natal
Durban December 1993

DECLARATION OF CANDIDATE
I, Cynthia Mary Carliell, declare that unless indicated, this dissertation is my own work and that it
iii
ACKNOWLEDGEMENTS
The Water Research Commission for the funding of the project.
The Foundation for Research Development (FRD) for financial assistance during the course of the degree.
Prof C. A. Buckley for his encouragement, patience and advice.
Prof E. Senior for his co-supervision and advice on the microbiological aspects of the project, and for use ofthe facilities at the International Centre for Waste Technology (Africa), University of Natal.
Dr B.S. Martincigh of Physical Chemistry, Department of Chemistry, for the use of the spectrophotometer,and for help with chemical aspects of the project.
Dr D Mulholland of Organic Chemistry, Department of Chemistry, for help with the identification of dyemetabolic products.
Mr Nessan Naidoo of the Department of Chemistry, for identifying the degradation products of Procion RedHE-7B, and general advice on chemical aspects of the project.
Ms Susan Barclay of the Pollution Research Group, for polarography work, advice and editing this thesis.
Ms Beth Duvel and Ms Deirdre Harrison of the Department of Chemical Engineering for assistance withchemical analyses, supplying equipment at short notice and generally making a plan.
The workshop staff of the Department of Chemical Engineering for the construction and fixing of equipment.
Mr J. Pernell (Water Affairs) for collecting samples from Umzinto Waste Water Treatment Works.
The staff at Umbilo WasteWater Treatment Works for suppling inoculum used in the project.
My parents for their support, encouragement and interest in everything I have done.
iv

SUMMARYWastewater discharges from textile dyehouses are complex, variable, and highly coloured, generallycontaining dyes at concentrations of 10 to 200 mg/M, depending on the dyeing proces in operation. Although dilution of the effluent can, and does occur, colour is discernible at concentrations as low as1 mg/M. Dilution of dyehouse effluent therefore tends to compound the treatment problem, byincreasing the volume of coloured effluent.
Conventional treatment processes presently in use at waste water treatment works do not usuallyachieve satisfactory colour removal, resulting in coloured effluent being discharged from the treatmentworks. Consequently, downstream use of the treated water is limited, and the highly visible nature ofthe pollution source often gives rise to public concern.
Solutions to treatment problems are being sought through exploration of chemical, physical andbiological treatment options. Chemical treatment processes such as the use of Fentons Reagent, andphysical treatment such as the removal of dyes by filtration (reverse osmosis, crossflowmicrofiltration) are successful in removing colour. However, by-products such as possible dyeintermediates (Fentons reagent) or dye concentrates (filtration) are alternative pollution sources whichmust be treated or disposed of.
Research into specialised biological treatment of dye-containing wastewater has shown potential for acomplete treatment system ie. mineralisation of organic dye compounds, to inorganic constituents suchas carbon dioxide, methane, and water.
Degradation of simple azo dyes by aerobic microorganisms has been reported in the literature,however, factors such as the restricted substrate specificity and highly bred nature of the bacteria, hasrendered these processes impractical for large-scale waste treatment. In contrast to the substratespecificity demonstrated by aerobic dye-degrading microorganisms, anaerobic populations showpotential for non-specific colour removal, although the nature of the decolourisation process, and theability of anaerobic populations to mineralise intermediary dye metabolites, is uncertain.
Anaerobic treatment of dyes was chosen as the target of this research, and was investigated in twophases : (i) the ability of anaerobic microorganisms (enriched from digester sludge) to decolourise areactive red dye viz. Procion Red HE-7B, and (ii) the ability,if any, of this anaerobic population todegrade/mineralise any dye metabolites originating from decolourisation of Procion Red HE-7B.
Research to date has been conducted in the form of batch studies in anaerobic serum bottles. Factorssuch as the order of decolourisation, and subsidiary rate limiting factors, have been addressed in theinitial studies. The order of decolourisation of Procion Red HE-7B has been found to be first-orderwith respect to dye concentration, however, the decolourisation of Procion Red HE-7B does notappear to be a result of a catabolic pathway, and for this reason it is possible that the rate ofdecolourisation is pseudo-first order ie. factors other than dye concentration are indirectly responsiblefor the shape of the decolourisation curve. The literature favours the theory that decolourisation ofazo dyes by anaerobic microorganisms is the result of dye reduction by reduced flavin nucleotides inthe electron transport chain. To test this theory, competitive electron acceptors, such as nitrate andsulphate, are added to the assay bottles. To date only nitrate addition has been completed, and hasbeen found to effectively inhibit decolourisation. This collaborates the above hypothesis, as nitrate ismore favourable thermodynamically, and is therefore reduced preferentially in the electron transportchain.
Possible rate-limiting factors for decolourisation of Procion Red HE-7B, are as diverse as cellpermeability, redox potential of the dye, and nature and concentration of an additional carbon source. The latter has been investigated by addition of glucose (non-limiting concentration) to the bottles inwhich decolourisation takes place. This has been found to result in an approximate 15-fold increasein decolourisation of Procion Red HE-7B. Alternate cabon rich sources that may be applicable in awastewater treament system are currently being investigated. Microorganisms are being acclimated toutilise the carbon sources present in cotton scouring effluents, and preliminary results indicate the

ability of these microorganisms to decolourise Procion Red HE-7B at a rate comparable to that in thestandard assay bottles.
Phase II ie. the mineralisation of resultant dye metabolites, will be investigated via BiochemicalMethane Potential (BMP) tests, and through identification of dye metabolites, with the aim ofdetermining the fate of these metabolites.
In addition, toxicity trials are to be conducted to assess the concentration of dye (and metabolites) that

ABSTRACT
Decolourisation of a reactive azo dye, Procion Red HE-7B was studied using serum bottle assays. Inoculum
for the assays was obtained from laboratory digesters in which anaerobic digester sludge was incubated with
Procion Red HE-7B for 4 months.
A standard set of operating conditions were developed to study the anaerobic decolourisation of Procion Red
HE-7B. The rate of decolourisation in the standard assay system was determined to be first-order with
respect to dye concentration, but was inversely proportional to the initial dye concentration in the system.
This was not in agreement with first-order kinetics and was attributed to microbial inhibition, either due to
increasing concentrations of Procion Red HE-7B and/or metabolites. These results were compared with those
in literature and probable rate-limiting factors for decolourisation were identified as the rate of permeation of
Procion Red HE-7B into the microbial cells, and the presence of supplemental carbon and/or additional
electron acceptors.
Dye permeation was investigated using permeabilised biomass. Increased permeation of the dye into the
microbial cells was found to inhibit decolourisation, suggesting that decolourisation occurred extracellularly.
The rate of Procion Red HE-7B decolourisation was measured in the presence and absence of a supplemental
carbon source (glucose 1 g/M) and was found to be limited in the absence of glucose. The addition of nitrate
(as a competitive electron acceptor) to the assay system inhibited decolourisation for a period of time
proportional to the concentration of nitrate in the system. In contrast the addition of sulphate to the system
was shown to have no marked effect. It was proposed that nitrate reduction was preferential to Procion red
HE-7B reduction which, in turn, was preferential to sulphate reduction. The role of system redox potential in
the anaerobic decolourisation of Procion Red HE-7B was therefore investigated. It was found that a strictly
anaerobic system was conducive to decolourisation.
The chemical reaction responsible for decolourisation was investigated using ultraviolet scanning.
Decolourisation was found to be caused by reduction of the azo bonds and subsequent destruction of the dye
chromophore. The fate of the ensuing metabolites was investigated with respect to their mineralisation
potential in the anaerobic system, however, neither acclimated nor unacclimated biomass showed any
capacity for mineralisation of Procion Red HE-7B.
The toxicity of Procion Red HE-7B to the anaerobic biomass was investigated by means of an anaerobic
toxicity assay. Total gas production was monitored and maximum rate ratios were calculated to determine the
level of inhibition. Acclimated biomass did not show significant inhibition at any of the test concentrations,
however, unacclimated biomass was significantly inhibited at the higher dye concentrations.
Abiotic decolourisation of Procion Red HE-7B in the standard assay system was found to be caused by
adsorption of the dye to the biomass (approximately 17 %) and decolourisation by the mineral salts medium
(approximately 35 %). Adsorption isotherms developed for Procion Red HE-7B with anaerobic digester
sludge as the adsorbent conformed to Freundlich and Langmuir isotherms.
ii

A treatment process was investigated using organic-rich textile scouring effluents as carbon sources during
decolourisation of Procion Red HE-7B. This system showed potential for decolourisation of the dye and for
the reduction of the organic carbon in the scouring effluent.
iii
Respiration in which the final electron acceptoris an inorganic molecule (nitrate or sulphate)other than molecular oxygen.
Anaerobic respiration
A fixed film anaerobic digester which retainsthe microorganisms in the voids created by thepacking media.
Anaerobic filter
A microorganism capable of growing ormetabolizing in the absence of free oxygen ie.an anaerobic or anoxic environment. Thesemicroorganisms may be facultative orobligative, the latter will perish in the presenceof free oxygen.
Anaerobe
Organisms that perform oxygenicphotosynthesis and possess chloroplasts. Maybe single- or multi-cellular organisms.
Algae
A microorganism capable of growing andmetabolizing in the presence of free oxygen ie.in an aerobic environment.
Aerobe
The condition of living or acting only in thepresence of molecular oxygen.
Aerobic
Binding of dye compounds to surfaces such asmicrobial cells or activated carbon, usuallythrough electrostatic interaction between thecharged support and the charged cell.
Adsorption (dye)
A change in the microbial community thatincreases the rate of transformation of a testcompound, as a result of prior exposure to thattest compound.
Adaptation
A mixed association of prokaryotic andeukaryotic microorganisms, which aerobicallydecompose waste in an activated sludgeeffluent treatment system.
Activated sludge
The adaptation of a microbial community todegrade a previously recalcitrant compound,through prior exposure to that compound.
Acclimation
GLOSSARYv

The outer layers of bacterial cells comprise thecell wall. The cell wall functions to protect thebacterial cell from osmotic lysis in hypotonicenvironments, determines cell shape, and playsa role in movement and division.
Cell wall
Dye which contain a positive charge, eithercentered on one atom (usually nitrogen), ordelocalized over many atoms.
Cationic dyes
The dissimilation of complex organicmolecules, generally for the purpose ofobtaining energy or simple compounds neededfor synthesis of other organic matter.
Catabolism
Cancer-causing.Carcinogenic
The procedure, other than by scouring only, ofimproving the whiteness of textile material bydecolourising it from the grey state, with orwithout the removal of natural colouring and orextraneous substances.
Bleaching
A property which allows the microbialdecomposition of an organic compound toinorganic molecules such as carbon dioxide,methane and inorganic salts.
Biodegradable
Dyes prepared from derivatives of the aromaticdiamine benzidine (a carcinogen).
Benzidine dyes
A closed culture environment in whichconditions are continuously changing accordingto the metabolic state of the microbial culture.
Batch culture
Single-cell, prokaryotic microorganisms.Bacteria
The enzyme that catalyses the reduction of azobonds.
Azo reductase
Dyes which contain at least one azo group(-N=N-), and can contain up to four azo groups.
Azo dyes
Dyes based on the structure of9,10-anthraquinone, with powerful electrondonor groups in one or more of the four alphapositions.
Anthraquinone dyes
An environment where oxygen is present in theform of compounds such as nitrate or sulphate.
Anoxic
vi

A property that enables microorganisms totolerate relatively high sodium chlorideconcentrations in their environment.
Halophilic
A staining technique that enables thedifferentiation of all bacteria into two basicgroups viz. Gram negative or gram positive.
Gram stain
Bacteria that appear dark purple when Gramstained.
Gram positive
Bacteria that appear pink/red when Gramstained.
Gram negative
A diverse group of nonphotosynthetic,coenocytic microorganisms which usually havea vegetative structure known as a mycelium.
Fungi
The dehydration of frozen material (biological,pharmaceutical or foodstuffs) throughsublimation.
Freeze-drying
Selection of microorganisms with certaincharacteristics, from a mixed culture, throughmanipulation of culture conditions.
Enrichment
A chain of carrier molecules with fixedorientation in the cell membrane, through whichelectrons are transported and ATP generated.
Electron transport (respiratory) chain
Chemicals used in the dyeing process to aid thedyeing of the cloth/yarn.
Dyeing auxillaries
A textile finishing process in which size isremoved from the cloth or yarn to be treated.
Desizing
A single or double stranded macromolecularchain of nucleotides, the sequence of whichdetermines the genetic code.
Deoxyribosenucleic acid (DNA)
Microbial reduction of nitrates to free nitrogen,commonly observed with certain types oforganisms utilizing anaerobic respiration.
Denitrification
A small non-protein inorganic component of anenzyme, frequently a metallic ion such asmagnesium, zinc, copper or iron.
Co-factors
A continuous culture system in which staticconditions are maintained and the bacterialculture is kept in the logarithmic stage ofgrowth.
Chemostat
vii

A change in the sequence of bases in thebacterial genome, as a consequence of normalchromosomal replication, or exposure tomutagens.
Mutation
Certain chemical or physical agents that causemutations to occur.
Mutagens
Culture consisting of two or more types ofmicroorganisms.
Mixed culture
Microbial decomposition of an organiccompound to inorganic constituents such ascarbon dioxide, methane and water.
Mineralisation
A mixed population of microorganisms whichachieve mineralisation of organic compoundsthrough cooperative metabolism.
Microbial association
Intermediate compounds formed during dyecatabolism.
Metabolites
The physiochemical transformations throughwhich foodstuffs are synthesized into complexelements, complex substances are rendered intosimple ones, and energy is made available foruse by the organism.
Metabolism
Mixture of nutrient substances required by cellsfor growth and metabolism.
Medium
The waste liquid which comes from scouringcotton with alkali, in specially constructedvessels known as kiers.
Kier liquor
The compounds used to synthesise dyes.Intermediates (dye)
Insertion of a dye between two base pairs in theDNA chain, which may give rise to error inDNA replication, and consequently, mutations.
Intercalation
Enzymes that are not normally present in themicrobial cell, but are synthesised in thepresence of an inducer substrate.
Inducible enzymes
viii

A collection of processes in which rawcloth/yarn is cleaned and prepared for dyeingand printing.
Textile finishing
The final electron and hydrogen acceptor in theelectron transport chain.
Terminal electron acceptor
Bacteria that use sulphate as an electronacceptor during anaerobic respiration.
Sulphate-reducing bacteria
Gelatinous film-forming substances that areapplied to the individual yarns during weavingin order to coat and protect the yarns from theabrasive effects of the filling yarns, as these arepositioned by the shuttle action of the weavingloom.
Sizing Agents (size)
A textile finishing process in which cottoncloth/yarn is scoured with hot alkali to removenatural waxes and pectins from the cotton,together with the spinning oils.
Scouring
The oxidative breakdown and release of energyfrom nutrient molecules by reactions withmolecular oxygen (aerobic respiration) orinorganic molecules such as nitrate (anaerobicrespiration).
Respiration
A single or double stranded macromolecularchain of nucleotides, the sequence of which canspecify the order of amino acids in polypeptidesynthesis.
Ribonucleic acid (RNA)
Resistant to microbial degradation.Recalcitrant
Reactive dyes are coloured components capableof forming a covalent bond between the dyemolecule and the fibre.
Reactive dyes
A covalently closed circular molecule of DNAthat is extrachromosomal, autonomous andself-replicating.
Plasmid
The plasma membrane binds the protoplast, andis the cells principal osmotic barrier. Itconsists of a bilayer of phospholipids intowhich the membrane proteins are intercalated.
Plasma membrane
ix

A compound not found in nature.Xenobiotic
Contain a xanthene chromophore in which twoaryl nuclei are linked by oxygen to form apyrone ring. Similar terminal groupings(amino, hydroxy, or both) are usually present.
Xanthene dyes
x

2-152.3.3. Decolourisation of dyes with mixed populations of microorganisms inanaerobic digester sludge
2-122.3.2. Anaerobic decolourisation of azo dyes by single microbial species
2-112.3.1. Degradation of azo dyes by microflora of the mammalian intestine
2-102.3. Decolourisation of azo dyes in an anaerobic system
2-102.2.5. Degradation of azo dyes by algae
2-92.2.4. Degradation of azo dyes by fungi
2-72.2.3. Adaptation of microorganisms to degrade simple azo dyes
2-62.2.2. Degradation of azo and triphenylmethane dyes in aerobic aquaticenvironments
2-42.2.1. The fate of textile dyes in the activated sludge process.
2-32.2. Biological degradation of dyes in aerobic systems
2-12.1. Physical decolourisation by adsorption of dyes to microbial cells
Chapter Two : Biological options for the treatment of textile effluent
1-81.5 Thesis outline
1-61.4 Project outline
1-51.3.1 Effluent reduction/treatment options for dye-containing effluents
1-51.3 Dye-containing effluent
1-31.2 Legislation for discharge of textile effluent
1-11.1 The textile finishing industry
Chapter one : Introduction
xxiiiNomenclature
xxiiList of abbreviations
xxList of tables
xviiList of figures
viGLOSSARY
TABLE OF CONTENTSxii

2-252.7. Conclusions
2-242.6.2. Pretreatment of textile effluent with ozone and fentons reagent followed byaerobic biological treatment
2.6.1. Chemical reduction and oxidation combined with aerobic biodegradation 2-23
2-232.6. Combined chemical-biological processes for the treatment of textile effluent
2-212.5. A combination of anaerobic and aerobic biological systems for the degrada-tion of textile dyes
2-202.4.2. Degradation of sulphonated metabolites of water-soluble dyes
2-182.4.1. The Potential of specialised anaerobic microorganisms to degradearomatic compounds structurally similar to azo dye metabolites
2-162.4. The fate of dye metabolites in biological treatment systems
3-63.7. Conclusions
3-53.6. Structural effects regarding placement of substituent groups on the azo dye
3-53.5. The effect of competitive electron acceptors on anaerobic azo reduction
3-43.4.2 Extracellular azo reduction
3-43.4.1 Intracellular azo reduction
3-33.4. The site of microbial azo reduction
3-23.3. The role of soluble flavins in microbial azo reduction
3-13.2. The role of enzymes in microbial azo reduction
3-13.1. Introduction
Chapter Three : Proposed mechanisms of azo reduction in anaerobic / anoxicsystems
4-24.1.2. Biological decolourisation by anaerobic microorganisms
4-14.1.1. The effect of prior exposure of anaerobic biomass to Procion Red HE-7B onthe efficiency of azo reduction
4-14.1. Introduction
Chapter Four : Decolourisation of Procion Red HE-7B in an anaerobic system
xiii
4-434.5. Conclusions
4-414.4.3. Abiotic decolourisation of Procion Red HE-7B in a biological anaerobicsystem
4-384.4.2. Biological decolourisation in an anaerobic system
4-344.4.1. Prior exposure of anaerobic microorganisms to Procion Red HE-7B
4-344.4. Discussion
4-304.3.5. Inhibitory effects of Procion Red HE-7B on an anaerobic microbialpopulation
4-284.3.4. Identification and fate of Procion Red HE-7B degradation products
4-264.3.3. Abiotic decolourisation of Procion Red HE-7B
4-194.3.2. Biological decolourisation of Procion Red HE-7B
4-194.3.1. The effect of prior exposure of anaerobic biomass to Procion Red HE-7B onthe rate of decolourisation
4-194.3. Results
4-164.2.5. Inhibitory effects of Procion Red HE-7B on an anaerobic microbialpopulation
4-154.2.4. Identification and fate of Procion Red HE-7B degradation products
4-144.2.3. Abiotic decolourisation
4-104.2.2. Biological decolourisation of Procion Red HE-7B
4-94.2.1. The effect of prior exposure to Procion Red HE-7B on the efficiency of azoreduction
4-94.2. Experimentation
4-74.1.5. Inhibitory effects of Procion Red HE-7B on an anaerobic microbiall ti
4-54.1.4. Identification and fate of Procion Red HE-7B breakdown products
4-34.1.3. Abiotic decolourisation
5-15.1.1. Textile finishing processes and effluents
5-15.1. Introduction
Chapter Five : Process combination : anaerobic digestion of cotton finishing efflu-ents and decolourisation of Procion Red HE-7B
xiv

C-2C.2.1. Materials
C-2C.2. Experimentation
C-1C.1. Introduction
Appendix C : Standard assay conditions for measurement of Procion Red HE-7Bdecolourisation
B-1Appendix B : List of dyes referred to in literature review
A-3A.2. Dyes in the textile industry
A-1A.1. The colour index
Appendix A : Classification of dyes
R-1References
6-1Chapter Six : Conclusions and Recommendations
5-175.5. Conclusions
5-155.4. Discussion
5-135.3.2. Decolourisation of Procion Red HE-7B combined with anaerobic digestionof cotton scouring effluent
5-125.3.1. Enrichment of microbial populations to tolerate and degrade cotton scour-ing effluent
5-115.3. Results
5-105.2.2. Decolourisation of Procion Red HE-7B combined with anaerobic digestionof cotton scouring effluent
5-75.2.1. Enrichment of microbial populations capable of anaerobically digestingcotton scouring effluent
5-75.2. Experimentation
5-65.1.3. Anaerobic digestion of cotton scouring effluent as an energy source fordecolourisation of Procion Red HE-7B
5-35.1.2. Treatment / pre-treatment of cotton finishing effluent by anaerobicdigestion
xv

G-4G.2. Combination of anaerobic digestion of John Grant scouring effluent anddecolourisation of Procion Red HE-7B
G-1G.1. Data from enrichment schemes
Appendix G : Chapter five; experimental data
F-2F.2. Experimental data from the anaerobic toxicity assay
F-1F.1. Theoretical gas volume calculations
Appendix F : Data for sections 4.3.4 and 4.3.5
E-2E.3. Decolourisation of Procion Red HE-7B in mineral salts medium
E-1E.2. Procion Red HE-7B adsorption isotherm
E-1E.1. Adsorption of Procion Red HE-7B in mineral salts medium and salinesolution
Appendix E : data for section 4.3.3.
D-7D.3.5. The role of redox potential in the microbial decolourisation of Procion RedHE-7B
D-5D.3.4. Rate of decolourisation of Procion Red HE-7B in the presence of additionalelectron acceptors
D-4D.3.3. Rate of decolourisation of Procion Red HE-7B as a sole carbon source
D-3D.3.2. Procion Red HE-7B decolourisation with permeabilised cells
D-2D.3.1. The order of Procion Red HE-7B decolourisation with respect to dyeconcentration
D-1D.3. Biological decolourisation of Procion Red HE-7B
D-1D.2. Experimental data : comparison of decolourisation rates for Procion RedHE-7B by acclimated and unacclimated biomass
D-1D.1. Introduction
Appendix D : Data for sections 4.3.1 and 4.4.2
C-4C.2.3. Analytical procedure
C-3C.2.2. Experimental procedure
xvi

LIST OF FIGURES
4-23Procion Red HE-7B decolourisation in the presence of 0, 1, 5 and10 mM nitrate showing lag phases before the onset of exponentialdecolourisation, the duration of which corresponds to the concentrationof nitrate.
Fig 4.9
4-22Decolourisation of Procion Red HE-7B (100 mg/M) with asupplemental carbon source (glucose 1g/M) and without supplementalcarbon.
Fig 4.8
4-21Decolourisation of Procion Red HE-7B (100 mg/M) with inoculumconsisting of : cells permeabilised and suspended in phosphate buffer,cells permeabilised and suspended in perm. solution andnon-permeabilised cells in phosphate buffer.
Fig 4.7
4-20ln (Ct/Co) versus time (h) is plotted for initial dye concentrations of100, 150 and 200 mg/M confirming that Procion Red HE-7Bdecolourisation could be first-order with respect to dye concentration.
Fig 4.6
4-20Exponential regression of Procion Red HE-7B (mg/M) versus time (h)
Decolourisation is shown with initial dye concentration of 100, 150 and200 mg/M.
Fig 4.5
4-19Rate constants for decolourisation of Procion Red HE-7B by acclimatedand unacclimated biomass with standard assay conditions.
Fig 4.4
4-13System for on-line measurement of redox potential in an anaerobicdigester containing Procion Red HE-7B.
Fig 4.3
4-6Decolourisation of Procion Red HE-7B to yield dye intermediates.Fig 4.2
4-3Schematic representation of an electron transport chain with an azo dyeas a terminal electron acceptor.
Fig 4.1
3-2Proposed mechanism of catalysis by azo reductase and NADPH.Fig 3.1
2-22Proposed pathway for degradation of the azo dye Mordant Yellow 3(MY3) by a mixed microbial population (Haug et al., 1991).
Fig 2.3
2-20Oxygenolytic cleavage of naphthalene-2-sulphonic acid and thesubsequent liberation of sulphite.
Fig 2.2
2-18Fate of Acid Red 88 metabolites in an anaerobic system.Fig 2.1
Page no.TitleFigure no.
xvi
4-31Rates of gas production (unacclimated biomass) calculated for the timeperiod when gas production rates were linear, i.e. before substrateconcentration became limiting.
Fig 4.25
4-31Rates of gas production (acclimated biomass) calculated for the timeperiod when gas production rates were linear, i.e. before substrateconcentration became limiting.
Fig 4.24
4-31Cumulative gas production for serum bottles inoculated withunacclimated biomass and fed with acetate, propionate and glucose.Control bottles contain no Procion Red HE-7B and assay bottlescontain 20, 50, 100, 200 and 500 mg/M dye.
Fig 4.23
4-31biomass and fed with acetate, propionate and glucose. Control bottlescontain no Procion Red HE-7B and assay bottles contain 20, 50, 100,200 and 500 mg/M dye.
Fig 4.22
4-30Total gas produced by acclimated and unacclimated biomass during52 d of incubation.
Fig 4.21
4-29Scans of samples from serum bottles containing Procion Red HE-7B,before and after decolourisation.
Fig 4.20
4-28Decolourisation of Procion Red HE-7B from initial dye concentrationsof 100, 150 and 200 mg/M.
Fig 4.19
4-28Analysis of adsorption data for Procion Red HE-7B using the log-logplot of the Langmuir adsorption isotherm.
Fig 4.18
4-28Analysis of adsorption data for Procion Red HE-7B using the log-logplot of the Freundlich adsorption isotherm.
Fig 4.17
4-27Procion Red HE-7B adsorbed per mass of sludge adsorbent is plottedversus the equilibrium concentration of Procion Red HE-7B in solutionto give a typical monolayer adsorption plot.
Fig 4.16
4-27Adsorption of Procion Red HE-7B to inactivated (autoclaved) biomassin saline solution and mineral salts medium respectively.
Fig 4.15
4-25Redox potentials (mV) measured in an anaerobic digester containingsulphate (5 mM) and Procion Red HE-7B (100 mg/M).
Fig 4.14
4-25Redox potential (mV) measured in an anaerobic digester containingnitrate (20 mM) and Procion Red HE-7B (100 mg/M).
Fig 4.13
4-24Redox potential (mV) measured in an anaerobic digester duringdecolourisation of Procion Red HE-7B (approximately 5 h) and for 20 hsubsequent to the completion of decolourisation.
Fig 4.12
4-23Decolourisation of Procion Red HE-7B in the presence of 0, 5 and10 mM sulphate.
Fig 4.11
4-23ln (Ct/Co) versus time is plotted for decolouisation of Procion RedHE-7B in the presence of 0, 1, 5 and 10 mM nitrate. Time zero wastaken as the sampling time recorded directly before the onset ofdecolourisation.
Fig 4.10
xvii

C-4Calibration curve of Procion Red HE-7B (mg/M) versus absorbancemeasured at 520 nm.
Fig C.1
5-15Decolourisation of Procion Red HE-7B in the presence and absence of3 mM nitrate, incubated with 50 % John Grant effluent.
Fig 5.9
5-15Gas production in bottles incubated with 50 % John Grant scouringeffluent prior to the addition of Procion Red HE-7B.
Fig 5.8
5-14Decolourisation of Procion Red HE-7B in uninoculated John Grantscouring effluent (sterile and non-sterile).
Fig 5.7
5-14Procion Red HE-7B decolourisation with John Grant scouring effluent(50 and 100 %) and glucose as carbon sources for anaerobic digestion.
Fig 5.6
5-13DOC (mg/M) and pH for the digester in semi-continuous mode,showing gradual increase in residual DOC over time.
Fig 5.5
5-13DOC removal (cumulative) and digester gas production (cumulative)for the digester in semi-continuous mode, showing a constant rate ofDOC removal.
Fig 5.4
5-13DOC consumption and digester gas production shown for the 80 dstart-up period. Digester in batch-mode.
Fig 5.3
5-13Cumulative digester gas production (mM) from inoculum incubatedwith 0 % (control), 10 %, 50 % and 100 % Smith & Nephew kierliquor. Inoculum contains residual organics.
Fig 5.2
5-10Calibration curve for total carbon using potassium biphthalatestandards.
Fig 5.1
4-33Methane content (%) of digester gas produced in anaerobic toxicityassay with unacclimated biomass.
Fig 4.28
4-33Methane content (%) of digester gas produced in anaerobic toxicityassay with acclimated biomass.
Fig 4.27
4-32Maximum rate ratios for anaerobic toxicity assay with Procion RedHE-7B. A MRR of less than 0,95 is considered to indicate possible
Fig 4.26
xviii
LIST OF TABLES
E-2Adsorption data for Procion Red HE-7B with anaerobicbiomass as the adsorbent, represented by the Langmuirisotherm.
Table E.3
E-1Representation of Procion Red HE-7B adsorption databy the Freundlich isotherm.
Table E.2
E-1Data from experiment to determine the extent ofadsorption of Procion Red HE-7B to a sludge adsorbent,measured in mineral salts medium and saline solution.
Table E.1
D-7Data for measurement of Procion Red HE-7Bdecolourisation in the presence of sulphate.
Table D.7
D-6Data for measurement of the rates of decolourisation ofProcion Red HE-7B in the presence of nitrate.
Table D.6
D-5Data for measurement of Procion Red HE-7Bdecolourisation in the presence of 1,5 and 10 mM nitrate.
Table D.5
D-4Experimental data for decolourisation of Procion RedHE-7B as a sole carbon source.
Table D.4
D-3Experimental data for decolourisation of Procion RedHE-7B by permeabilised and non-permeabilisedmicroorganisms.
Table D.3
D-2Experimental data used to determine the order of ProcionRed HE-7B decolourisation, with respect to dyeconcentration.
Table D.2
D-1Data from experiment to compare rates ofdecolourisation of Procion Red HE-7B by acclimatedand unacclimated biomass.
Table D.1C-3Instructions for preparation of defined medium.Table C.2C-2Stock solutions for preparation of mineral salts medium.Table C.1A-2C.I. classification of colourants.Table A.2A-1The structure of some common dye chromophores.Table A.1
5-15pH values during the pre-incubation of enrichedinoculum in 50 % John Grant effluent and after thedecolourisation of Procion Red HE-7B.
Table 5.2
5-7Carbon content and pH of effluents used in theenrichment programme.
Table 5.1
4-32Maximum rate ratios (MRR) for an anaerobic toxicityassay with Procion Red HE-7B.
Table 4.3
4-30Theoretical gas volumes for mineralisation of ProcionRed HE7B in assay bottles.
Table 4.2
4-21Gas production (cumulative) from permeabilised andnon-permeabilised cells.
Table 4.1
2-5The extent of bioelimination/degradation of 18water-soluble azo dyes in the activated sludge process.
Table 2.22-3Decolourisation of textile wastewaters by M. verrucaria.Table 2.1
Page no.TitleTable no.
xix

G-5Decrease in Procion Red HE-7B concentration (mg/l) ininoculated serum bottles containing 100 mg/l of dye (D1to 3) and inoculating serum bottles containing 100 mg/lof dye and 3 mM nitrate (N1 to 3). John Grant scouringeffluent (50 %) was the substrate for this experiment.
Table G.6
G-4Decolourisation data from sterilised and non-sterilisedJohn Grant scouring effluent (uninoculated).
Table G.5
G-4Data from experiment to determine the order and rate ofdecolourisation of Procion Red HE-7B in 50 and 100 %John Grant scouring effluent (inoculated).
Table G.4
G-3Data from the John Grant digester operating insemi-continuous mode.
Table G.3
G-2Data for the John Grant enrichment digester during batchoperation.
Table G.2
G-1Gas production for Smith and Nephew serum bottleenrichments.
Table G.1
F-4Methane production (%) values for acclimated andunacclimated biomass, during the toxicity assay.
Table F.5
F-3Methane production rates for acclimated biomass in theanaerobic toxicity assay.
Table F.4
F-3Digester gas volumes for assay bottles containingunacclimated biomass.
Table F.3
F-2Digester gas volumes for assay bottles containingacclimated biomass.
Table F.2
F-2Theoretical gas volumes for mineralisation of ProcionRed HE-7B in assay bottles.
Table F.1
E-2Data from experiment to measure the extent ofdecolourisation caused by incubation of Procion RedHE-7B in sterile mineral salts medium.
Table E.4
xx

LIST OF ABBREVIATIONS
ADMI American Dye Manufacturers Institute
ATP Adenosine triphosphate
ASP Activated sludge process
CI Colour Index
CMC Carboxymethyl cellulose
COD Chemical oxygen demand
DNA Deoxyribonucleic acid
DOC Dissolved Organic Carbon
EPA Environmental Protection Agency
ETAD Ecological and Toxicological Association of the Dyestuffs
Manufacturing Industry
FAD Flavinadenine nucleotide
FMN Flavin mononucleotide
IC Inorganic carbon
IC50 Inhibition concentration
MRR Maximum rate ratio
NAD+ Nicotinamide-adenine-dinucleotide (oxidised form)
NADH Nicotinamide-adenine-dinucleotide (reduced form)
NADP+ Nicotinamide-adenine-dinucleotide-phosphate (oxidised form)
NADPH Nicotinamide-adenine-dinucleotide-phosphate (reduced form)

OC Organic carbon
OD Optical density
PAAB p-Aminoazobenzene
PSB Purple non-sulphur bacteria
PVA Polyvinyl alcohol
RBC Rotating biological contactor
RNA Ribonucleic acid
SMA Specific methanogenic activity
sp species
spp species (plural)
TOC Total organic carbon
UV Ultraviolet
xxii

NOMENCLATURE
c Equilibrium concentration of dye in solution (mg/M)
Co Concentration of dye at time zero (mg/M)
Ct Concentration of dye at time t (mg/M)
k Rate constant for first-order reaction kinetics (/h)
n Number of moles
P Pressure (Pa)
R Gas constant (J/mol/K)
t Time (h)
T Temperature (Kelvin)
V Volume (kM)
x Amount of dye adsorbed per unit mass of sludge solids (mg/g)
K, k Empirical constants
xxiii

CHAPTER ONE
INTRODUCTION
Increasingly strict environmental legislation, both in Europe and the United States of America, has led
to textile finishing industries being labelled high priority industries with respect to pollution (Licis et
al., 1991). The textile industry was one of 17 industries in the United States of America to be selected
for a pollution prevention programme implemented by the Environmental Protection Agency (EPA)
in 1991 (Licis et al., 1991). Similarly in Europe, environmental legislation has necessitated
increasingly green textile processing. This has, and is being achieved, through recycling of chemicals
and water, production and use of biodegradable textile chemicals and dyes, as well as efficient
effluent treatment (Mohr, 1992). This green approach has initiated the discussion of quality labels for
European textiles. This quality assurance label would be awarded on the basis of internationally
recognised criteria and test methods with special focus on the ecological and physiological aspects of
clothing (Mohr, 1992).
A recent article in the International Dyer (April 1993) referred to a new set of trade principles adopted
by both United States of America (USA) and European textile leaders in December 1992. These trade
principles were designed to ensure that trade was fair and that no country profited from slave or child
labour, or polluting the environment. That is, countries exporting raw or finished textile products to
Europe or the USA will have to comply with the legislation stated in these trade principles, regardless
of the legislation (or lack of) in the country of origin. Therefore, South African textile manufacturers
with an export market in Europe or the USA must comply with European regulations in order to
compete with other export markets (Mohr, 1991). In addition, public pressure as a result of growing
environmental awareness, and upgrading of environmental legislation in South Africa, necessitates an
increasingly environmentally-conscious approach to textile finishing.
1.1 THE TEXTILE INDUSTRY
In order to comprehend the effluent problems facing the textile industry it is neccessary to be familiar
with the processes which result in effluent production. Fig 1.1 is a schematic representation of the
main stages involved in the processing of natural fibres ( wool and cotton) and synthetic fibres
(Barnes et al., 1992), with E marking those processes giving rise to effluent requiring treatment.

Fig 1.1 : effluents requiring treatment.
Wool
Scouring
Dyeing
Carding
Fulling
Washing
Dyeing andfinishing
E
E
E
Synthetics
Scouring
Dyeing
Scouring and Bleaching
Finishing
E
E
E
E
E
Cotton
Weaving
Desizing
Scouring
Bleaching
Mercerising
Dyeing andFinishing
E
E
E
E
E
Knitting
As effluents emanating from the wet processing of cotton are the focus of this project, these processes
are described in more detail below:
a) Desizing. This process is commonly the first wet stage in the processing of cotton. It involves
the removal of size from the cotton fabric (using enzymes, acid or alkali) to ensure that
subsequent chemical finishing processes function correctly. The cotton threads were initially
coated with size to prevent breakages and impart a smooth finish during weaving. Sizes are
organic compounds such as starch or starch-derivatives, cellulose-derivatives, polyacrylates
and polyvinyl alcohol (PVA). Thus, desizing effluent generally has a high organic load and is
characterised by high chemical oxygen demand (COD) values.
b) Scouring. Subsequent to desizing, any remaining natural impurities (i.e. organic components
other than cellulose) are scoured from the cotton by a process of prolonged boiling in alkaline
solutions, either in closed vessels known as kiers (Trotman, 1968) or in continuous reaction
vessels. Scouring effluent is, therefore, characterised by high COD and pH values, and a strong
yellow-brown colour.
c) Bleaching. This is used to improve the whiteness of the textile fabric and can be achieved with
either oxidising or reducing agents. Bleaching effluents do not usually contain high
concentrations of organics, however, where hypochlorite is used as a bleaching agent the
presence of halogens in the effluent neccessitates a form of treatment.
1-2Chapter 1
d) Mercerising. Mercerising is the treatment of cellulosic fibres with a concentrated solution of
sodium hydroxide, which swells the fibres and increases the strength and dye affinity of the
fabrics. Mercerising effluent is characterised by high pH values.
e) Dyeing. Dyes used for the dyeing of cotton are direct, fibre reactive, sulphur and vat dyes
(Refer to Appendix A for the classification and application of textile dyes). Fibre reactive dyes
are rapidly replacing direct dyes (Burkinshaw, 1990) and are usually the principle dyes used
for colouring cotton. Different dye classes require specific dyeing procedures, however, a
common factor is that water is required for all forms of dyeing, either as a solvent or transport
medium and, therefore, effluent is generated by all dyeing processes. The volume and
characteristics of the effluent are determined by the type of dyeing process and the class of dye
used.
Dyeing can either be performed in discontinuous batch dye machines or in a continuous range.
The volume of dye-containing effluent resulting from batch dyeing is far greater than that
resulting from continuous dyeing, as between four and ten rinses are required after batch
dyeing to produce acceptable quality goods. The total volume of effluent emanating from a
dyeing process is determined by the liquor ratio, i.e. the volume of dye solution required to dye
a kilogram of goods. Liquor ratio values range from 8 : 1 to 20 : 1, with 10 : 1 being a
convenient average (Buckley, 1992). The concentration of dye in the effluent is determined by
the dye exhaustion properties, i.e. the proportion of the dye that is fibre substantive, and ranges
from 95 to 98 % for acid, basic and disperse dyes, through 60 to 80 % for reactive dyes and 40
to 60 % for the balance of the dyes (Buckley, 1992). After discharging a batch dyebath 1 M of
solution is usually retained per kg of goods i.e. 90 % of the unreacted dyes and auxiliary
chemicals are present in the first drop (exhausted dyebath) giving rise to a low volume,
concentrated, highly coloured form of effluent. Subsequent rinses become more dilute giving
rise to large volumes of coloured effluent with a low organic load.
f) Finishing. This refers to any processes used to improve the quality of the fabric after dyeing.
1.2 LEGISLATION FOR DISCHARGE OF TEXTILE EFFLUENT
The Federal Republic of Germany (FRG), which has some of the most stringent effluent regulations
in the world, ranks the following textile effluent characteristics/components in order of priority
(personal communication, Envirocare division, Ciba Geigy):
a) colouration of the effluent;
b) toxicity of the effluent;
c) total organic carbon (TOC) content of the effluent;
d) adsorbable organic halogens in the effluent;
e) metals in the effluent; and
f) the salt content of the effluent.
1-3Chapter 1

This has resulted in the following textile effluents being forbidden to be discharged to a waste-water
treatment works without pre-treatment :
a) no untreated washing water from printing;
b) no surplus of dye padding and finishing liquors;
c) no synthetic sizes with less than 80 % biodegradability; and
d) no chrome, arsenic or mercury.
Although legislation in the Republic of South Africa is not as stringent as that cited for the FRG, the
following priority ranking is given to textile effluent characteristics in RSA (personal communication,
L. Gravelet-Blondin, Department of Water Affairs and Forestry) :
a) colouration of the effluent;
b) salts, which increases in priority for inland textile mills; and
c) Toxicity.
Therefore, it can be seen that effluent colouration is of priority status in both Europe and South
Africa. Legislation in South Africa states that discharged effluent must adhere to a general standard of
zero colour, however, in practise the measurement of colour is complicated by inadequate analytical
methods as well as natural colouration and suspended solids in receiving water bodies. Traditional
analytical methods for measurement of water colour are calibrated against a yellow-brown standard
(Hazen units) which is satisfactory for measuring the natural colour of water due to dissolved organic
acids, but is unrelated to the spectrum of colours associated with dyeing. A method developed by the
American Dye Manufacturers Institute (ADMI) has the advantage that it is independant of hue and
can, therefore, be related to colour imparted by textile dyes. However, these colour measurements are
still complicated by interfering solids (which must be removed by filtration) and insoluble colour
bodies which contribute to the overall colour perception of the water but which are removed by
filtration (Barnes et al., 1992). In addition, when colour is undesirable for aesthetic reasons it is
extremely difficult to correlate analytical colour measurements with colour perception by the human
eye. Therefore, in practise the zero colour standard may be modified so that the impact of the coloured
effluent on the receiving water body is such that the total colour in the water is acceptable to all
existing and potential downstream users.
No stringent limits are set for effluent TOC and COD in RSA, allowing textile mills to discharge high
organic content effluents to a waste-water treatment works. However, the effluent charges are
calculated on the organic load of the effluent (usually measured by COD) and, therefore, the
discharge of desizing and scouring effluents usually results in extremely high effluent charges which
could be dramatically reduced if pre-treatment of these effluents was implemented. Although the
principle focus of this project was the removal of colour from textile effluents, COD reduction of high
organic strength textile effluents has been considered as an aid to biological decolourisation, and is
described in Chapter Five.
1-4Chapter 1
1.3 DYE-CONTAINING EFFLUENTS
Dye-containing waste waters became a source of concern in the 1970's when some azo food dyes
were implicated as being carcinogenic. This initiated concern about non-food dyes which led to two
associations being formed to investigate environmental problems: The ADMI (American Dye
Manufacturers Institute) and ETAD (Ecological and Toxicological Association of the Dyestuffs
Manufacturing Industry). Textile dyes were evaluated for environmental impact by both these
associations (Meyer, 1981) and, although the findings varied according to the class of dye tested, it
was concluded that dyes and pigments would not be considered hazardous chemicals in general.
However, colour is noticeable at dye concentrations of approximately 1 mg/M and, therefore, textile
dyehouse effluent is highly visual even when diluted. Thus, the concentration and volume of
dyehouse effluent discharged from textile industries every day often exceed the assimilative capacity
of recieving water bodies, resulting in visible colour in this water. This results in aesthetic problems
which initiates public concern, and moreover restricts the downstream applications of this water. The
latter is extremely serious in water-restricted countries such as the Republic of South Africa (RSA)
which rely on the extensive recycling of water to fulfill the ever increasing demand for water by the
agricultural, industrial and domestic sectors.
1.3.1 Effluent Reduction / Treatment Options for Dye-Containing Effluents
Two phases are involved in reducing the pollution load of the dyeing process, waste minimisation and
waste treatment. Waste minimization (clean technology) aims to decrease the concentration and
volume of dye-containing effluent by recycling dyes, auxillaries and water, and reducing overall
chemical consumption. Waste treatment involves the ultimate disposal of compounds that cannot be
recycled.
Recycling of water can be achieved by removing dyes and auxillaries from solution, usually by
physical methods such as filtration or adsorption. Suitable filtration techniques are reverse osmosis or
cross-flow microfiltration. Adsorption of the dye compounds to activated carbon or other cellulosic
low cost materials transfers the coloured component of the effluent to a solid form which can then be
disposed of in a landfill site. In addition, chemical flocculants may be used to flocculate the dyes
which are then removed from solution as a sludge. In some dyeing processes, re-use of the reclaimed
dyes may be feasible, however, many textile manufacturers are reluctant to risk the quality of the
dyeing process by using recycled dyes. In other cases, such as the recovery of cotton reactive dyes,
re-use of the dye solutions is impossible due to hydrolysis of these dyes in the dye bath. This reaction
also accounts for the relatively poor exhaustion encountered with this class of dye, resulting in highly
coloured effluents emanating from reactive dyeing. In this case, waste treatment of the concentrated
dye solutions must be implemented.
Waste treatment (with respect to the decolourisation of dye-containing effluent) can be divided into
chemical or biological processes. Chemical treatment processes usually consist of oxidative
1-5Chapter 1

techniques such as ozonation which cleaves the conjugated bridges of the dyes, and ultraviolet
irradiation combined with hydrogen peroxide, which cleaves the azo groups of azo dyes.
Options for the biological treatment of textile dyeing effluent may be single-phase aerobic or
anaerobic processes, or multi-phase systems combining both aerobic and anaerobic processes. To date
traditional aerobic biological systems, such as activated sludge processes, have not been effective in
decolourising textile effluent. In fact, research has shown that very little decolourisation of
anthraquinone or azo dyes occurs in these systems as a result of biodegradation (Meyer, 1981).
However, other researchers demonstrated that aerobic microorganisms could be adapted to degrade
simple azo dyes (Kulla, 1981) although the highly bred nature and stringent substrate specificity of
those particular adapted microorganism led the reasearchers to conclude that they were not suitable
for practical waste-water treatment. By contrast, anaerobic biological systems have demonstrated
considerable potential for non-specific decolourisation of azo dyes (Brown and Laboureur, 1983a) but
do not appear to have the ability to mineralise the resulting dye metabolites. Recent research (Haug et
al., 1991) has shown that the combination of anaerobic and aerobic phases results in a biological
treatment system that is capable of decolourising and mineralising a mordant textile dye.
The primary advantage of biological systems in comparison to chemical systems is that they are
usually more economical in day to day running costs. Biological systems are essentially self-sufficent
subsequent to initiation, whereas chemical systems require the constant input of chemicals such as
flocculants or hydrogen peroxide.
When comparing the economic merits of various biological systems it can be seen that aerobic
systems are disadvantaged by the high energy requirements of aeration, and the production of large
volumes of waste sludge. Anaerobic systems are extremely economical with respect to running costs
as aeration is not required, and the volume of waste sludge produced is minimal. Moreover, methane
gas produced as an end-product of anaerobic digestion is sufficient to fulfill the energy requirements
of pumping and heating, rendering the process self-sufficient. Therefore, anaerobic processes are
becoming increasingly popular for waste water treatment and are replacing the traditional aerobic
systems in a number of applications.
1.4 PROJECT OUTLINE
The objectives of this research project were to investigate the feasibility of biological anaerobic
treatment for the decolourisation of dyes, with respect to the mechanism/s and rate-controlling factors
of decolourisation, and the fate of the dye metabolites in an anaerobic system. The following approach
was adopted to achieve these aims.
The project was divided into a number of interleading phases, the first phase involved the researching
of retrospective and current literature which was compiled into the relevant literature reviews.
Subsequent to reviewing the literature, decisions were made regarding the type of process and class of
dye to be investigated.
1-6Chapter 1

An anaerobic biological system was chosen for investigation, primarily because anaerobic
microorganisms show a greater ability for non-specific decolourisation of textile dyes than aerobic
microorganisms, making this process more suited to the treatment of diverse effluents. Moreover,
anaerobic treatment systems are better suited to the working schedule of a textile mill as they are able
to survive periods of dormancy such as during the annual shutdown of the mill.
Due to uncertainty in the literature with respect to the mechanism of biological anaerobic
decolourisation, it was decided to investigate anaerobic decolourisation in a controlled laboratory
environment in order to elucidate the processes responsible for decolourisation. It was, therefore,
neccessary to choose a target (representative) dye with which these fundamental studies could be
performed.
The target dye was required to be representative of a dye class that was known to be problematic with
respect to both loading and treatability. The literature reported that most decolourisation in an
activated sludge plant is achieved through adsorption of the dye compounds to the sludge (Shaul et al.
,1986). Therefore, treatment problems arise when the dyes are extremely water soluble, and are not
adsorbed to the sludge. In a report investigating the issue of colour removal at a publicly owned
treatment works (McCurdy et al., 1991) it was stated that the treament plant had no trouble treating
the textile wastewater until the mills started using reactive dyes. This stands to reason as reactive dyes
are hydrophilic and, therefore, have a low affinity for the biological sludge, remaining in solution and
causing the treated effluent to be coloured. Moreover, as stated previously, reactive dyes have
relatively poor exhaustion properties in comparison to other classes of dyes, which results in highly
coloured effluents.
It was, therefore, decided that the target dye for the initial research in this project would be chosen
from the class of cotton reactive dyes. Furthermore, the reactive dye would have an azo chromophore,
as azo dyes account for 60 to 70 % of all dyestuffs made, and are the most common class of
chromophore for reactive dyes. Finally, a red dye was chosen, as this hue has been found to give rise
to aesthetic problems at low concentrations, and is difficult to remove from treated water (data taken
from the Umbilo Waste Water Treatment Works). For these reasons and because this dye was known
to be commonly used in textile factories in the Pinetown and Hammarsdale textile regions, Procion
Red HE-7B was chosen as the target dye for fundamental studies. Subsequent to the selection of this
dye, a paper by Chadraborty (1990) confirmed that reactive HE dyes are slowly biodegraded in water
in comparison to conventional reactive dyes due to the orientation of the two reactive groups at the
different positions of the dye molecule and, therefore, that these dyes are problematic in waste-water
treatment works.
The first experimental stage to be implemented consisted of enrichment programmes to yield
microorganisms capable of fulfilling the requirements of the biological treatment process. As the
requirement of the decolourisation process for additional organic substrate was uncertain, allowance
was made for the fulfilment of this requirement at a later stage, through enrichment of
microorganisms capable of utilising the organic content of textile finishing streams such as scouring
1-7Chapter 1

and desizing effluent. The rationale behind this approach was the possibility of an on-site treatment
plant. Enrichment programmes were also implemented to select for dye tolerant anaerobic
microorganisms with the ability to decolourise Procion Red HE-7B.
Once the enrichment programme was completed anaerobic decolourisation of Procion Red HE-7B
was investigated with the aim of elucidating the mechanism responsible for decolourisation. This was
undertaken by experimentally determining the kinetic order of decolourisation, and subsequently
identifying probable rate-controlling factors for decolourisation. These rate-controlling factors were
investigated with the dual objectives of: determining the mechanism of decolourisation; and
identifying the factors that would be revelant to a waste-water treatment system. The fate and effect of
Procion Red HE-7B in the anaerobic system was determined by measuring the toxicity of Procion Red
HE-7B to the anaerobic microbial population, and investigating the fate of the dye metabolites in the
anaerobic system by measuring their mineralisation potential.
Finally, microorganisms capable of degrading the organic content of a textile scouring effluent were
tested for the ability to decolourise Procion Red HE-7B with the aim of developing a combined
system for on-site treatment of textile effluent.
1.5 THESIS OUTLINE
The thesis begins with a review of current and retrospective literature on the subject of biological
treatment of dye-containing effluents, which is presented in Chapter Two. Chapter Three is a
discursive literature review presenting proposed mechanisms of azo reduction (anaerobic
decolourisation of azo dyes) and aiming to identify a general accepted mechanism which could apply
to the anaerobic decolourisation of Procion Red HE-7B. Chapter Four presents the results of the
investigation into the decolourisation of Procion Red HE-7B, and is written in the form of a paper
with the first section being an introduction, followed by the experimentation section, results,
discussion and conclusions. Chapter Five follows the format of the preceding chapter and presents
the results of the experimental work in which a combined process was developed involving the
degradation of a scouring effluent with concomittant decolourisation of Procion Red HE-7B. The
thesis is concluded with Chapter Six, a summary of the experimental work presented, and includes
recommendations for future research.
1-8Chapter 1
CHAPTER TWO
BIOLOGICAL OPTIONS FOR THE TREATMENT
OF DYE-CONTAINING EFFLUENTS
Traditional biological methods of waste-water treatment are not usually successful in decolourising
dye-containing effluents from textile industries. This chapter presents a review of the literature with
respect to traditional and alternative biological methods for decolourising and degrading dyes. All
dyes mentioned in this chapter are listed in Appendix B, together with the chemical structures of the
dyes where available.
2.1 PHYSICAL DECOLOURISATION BY ADSORPTION OF DYES TOMICROBIAL CELLS
It is possible to physically remove dyes from solution by means of low cost adsorbents. The saturated
adsorbents can then be regenerated or disposed of in a landfill site. Low cost adsorbents are usually
a form of cellulosic waste such as wood shavings, corn husks or bagasse, although, researchers have
also investigated the use of microbial cells as adsorbents for water soluble dyes.
Hu (1992) investigated the adsorption of eleven reactive dyes by 22 strains of yeast and 25 strains of
bacteria isolated from soil samples and the sludge of a textile waste-water treatment plant. The
reactive dyes tested were 4 blue dyes , 3 red dyes (of which Procion Red G, CI 44 was one), 2 violet
dyes and 2 yellow dyes. The names of these dyes were not given in the paper. Of the 47 strains of
microorganisms tested, only 15 had the ability to reduce the colour of Procion Red G (by adsorption)
within 8 d. The rest of the strains had no decolourising ability. A certain bacterial strain, identified as
an Aeromonas sp, was found to decolourise Procion Red G within 6 d and was subsequently used for
all tests. A reactive blue, yellow and another red dye were found to be partially decolourised by
adsorption to the Aeromonas sp biomass, although, the remaining seven dyes were only slightly
adsorbed.
The specific adsorption capacity of the microbial cells was found to be greatest during the early
growing stages which, therefore, excluded the use of extracellular polysaccharides (usually produced
in the stationary phase) as a means of adsorption. Hu (1992) therefore proposed that the principal site
of adsorption of Procion Red G was the microbial cell walls of the Aeromonas biomass. The specific
adsorption capacity of the biomass for Procion Red G was 27,41 mg dye/gram dried cell, and the
percentage colour removal was 60,3 %.
It was concluded by Hu (1992) that adsorption of reactive dyes by bacterial cells appeared feasible
but that further research, utilising raw textile waste water, was required to determine the applicability
2-1

of this process to waste-water treatment. The regeneration of spent adsorbents would also be
investigated.
Fungal species, in particular Myrothecium verrucaria, have also shown promise for adsorption of
dyes (Mou et al., 1991; Brahimi-Horn et al., 1992). The ability of this fungus to adsorb 3 dyes,
Orange II, RS (H/C) and 10 B (H/C) was tested in static and shaking culture (Mou et al., 1991). It
was found that adsorption was enhanced in static culture and no advantage was gained by shaking
and/or aerating during the biodecolourisation process. Through visual inspection it was observed
that initial dye adsorption was rapid, as indicated by the rapid coloration of the fungal mass. It was
confirmed by spectrophotometric measurements that more than 50 % of the dye (for the RS red dye)
was removed in the first few minutes after contact, and that equilibrium for optical density (OD)
reduction was reached in about 10 h. The capacity of the fungal cells for RS dye molecules was
found to be 4 g of dye adsorbed by 1 kg of wet mycelial cells. After adsorption of the dye to the
mycelial mass was complete, the cell bound colour was then observed to either gradually disappear
over a period of a week or longer, or to remain bound to the cell. This indicated that cell-bound
colour loss was due to biodegradation of the dyes, the extent of which was probably related to dye
structure. However, experiments with autoclaved cells showed that these cells were equally effective
in decolourising the RS dye solution, which was viewed as a strong indication of adsorption over
degradation as the primary mechanism of colour removal.
The mechanism by which the dyes became bound to M. verrucaria was investigated by
Brahimi-Horn et al. (1992). They reported that the integrity of the microbial cells was important to
retain optimal binding capacity, which indicated that some of the dye was internalised, although the
bulk of the adsorbed dye was probably bound externally. The site of external binding was proposed
to be the chitin component of the fungal cell walls. As chitin has a similar structure to cellulose, it is
feasible that dyes (such as reactive dyes) may bind to chitin in a similar manner to cotton. However,
it must be noted that reactive dyes in waste water are usually hydrolysed and have therefore lost the
ability to bind with cellulose, and that these dyes may not be adsorbed successfully by the fungal
mass. The addition of surfactants to the medium was found to reduce the binding efficiency of the
cells which was suggested to result from a modification of the hydrophobic/hydrophilic environment
which influenced cell binding rather than from a direct modification of the cell membrane structure.
Re-generation of the mycelial adsorbent was achieved by extraction with methanol and the cells were
re-cycled for further dye removal. The adsorption capacity of the cells was found to be slightly
diminished subsequent to re-generation.
Laboratory scale tests were also performed by Mou et al. (1991) to determine the decolourising
ability of M. verrucaria with respect to dye-containing waste water. Of particular interest is the
comparison of decolourisation of a reactive red-dye containing waste liquor (from a dye
manufacturing plant) by activated sludge biomass or by the bioagent (M. verrrucaria) over a 2 week
incubation period. The bioagent showed 94 % reduction in sample OD whereas the activated sludge
showed only 30 % reduction, proving that the fungal bioagent had an increased ability to adsorb the
2-2

reactive dye. It is not known whether the reactive dye in this waste water was hydrolysed or still in
its reactive form.
The following waste-water
a) basic dye waste water from yarn dyeing, pH 4,5, dark blue;
b) direct dye waste water from yarn dyeing, pH 9,8, dark red;
c) T/R oxidative desizing and disperse dye waste water from yarn dyeing, pH 8,2, black;
d) reactive dye waste water, pH 11, dark red;
e) nylon acid dye waste water, pH 9,3, bright red;
f) sulphur dye : reactive/vat dye = 1:4, pH 10,2, black.
The results obtained when these waste waters were incubated statically for 2 weeks with 5 d old
mycelia, are given in Table 2.1.
844381789893% OD reduction
fedcbaWastewaters
Table 2.1 : Decolourisation of textile waste waters by M. verrucaria
Acid dye waste water exhibited the poorest decolourisation. Basic and direct dye-containing waste
waters showed 93 and 98 % OD reduction, respectively. The reactive dye waste water (which
presumably contained hydrolysed reactive dye) also showed considerable decolourisation (81 %
reduction in OD). As reactive dyes are usually not adsorbed to the activated sludge in waste water
treatment works, these results are particularly interesting in demonstrating that the bioagent,
M. verruacaria, had an enhanced ability for adsorption of reactive dyes.
Although the results presented in this section have been promising with respect to treatment of
dye-containing waste waters by physical removal of the dyes, it must be remembered that the
ultimate disposal of the dye-contaminated adsorbent still remains a problem, unless regeneration of
the adsorbent can be achieved. In fact, adsorption of dyes to adsorbents, although removing the dyes
from solution, results in the production of large quantities of dye-contaminated material and
therefore, effectively increases the volume of waste to be disposed.
2.2 BIOLOGICAL DEGRADATION OF DYES IN AEROBIC SYSTEMS
An important property of textile dyes, which manufacturers and users have striven for, is resistance
to oxidation. A garment saturated with water or perspiration and well inoculated with
microorganisms is an excellent culture medium. Only compounds resistant to biochemical/oxidative
degradation under these conditions will be fast and, thus, acceptable as stable dyes (Straley, 1984).
The above criterion clarifies why many commercial dyes are recalcitrant to oxidative microbial
breakdown and, therefore, why existing forms of aerobic waste water treatment are not usually
effective against dyehouse effluent.
2-3

2.2.1 The Fate of Textile Dyes in the Activated Sludge Process
The Ecological and Toxicological Association of the Dyestuffs Manufacturing Industry (ETAD)
investigated the possibility of commercial dyestuffs being susceptible to aerobic degradation in an
activated sludge plant, as part of their continuing programme of investigation into the environmental
fate of dyestuffs (Pagga and Brown, 1986). The test simulated the conditions of an adapted activated
sludge unit and was considered satisfactory for indicating the inherent biodegradability's of the test
substances. It was acknowledged that the test could not always distinguish between true
biodegradation and bioelimination (flocculation or adsorption onto the sludge), although, it was
stated that if significant elimination was detected within the initial 3 h of the test, this was attributed
to physical processes. No conclusion was forthcoming as to whether the substances removed by
physical processes were subsequently biodegraded. In order to decrease the possibility of physical
elimination of the dyestuffs, readily water-soluble dyestuffs were selected for this programme on the
basis that they were less likely to be adsorbed to the sludge. In total, 87 commercial dyes were
chosen to be tested (these were not listed in the paper), at a standard test concentration of 100 mg/M.
The duration of the test was 42 d and the analytical methods used to determine dye degradation were
extinction at the absorption maxima of the individual dyestuffs and dissolved organic carbon (DOC).
The results of the test yielded the following conclusions : that, even with adapted inoculum, no
dyestuff tested showed any convincing evidence of genuine biodegradation; that some dyes did
contain biodegradable components (biodegradation measured by DOC removal) but that these were
not the chromophores; and finally, that partial colour removal was achieved by adsorption of the
dyes to the sludge (even though they were water soluble) and subsequent removal by flocculation.
A project by the United States Environmental Protection Agency (EPA) titled Fate of Water Soluble
Azo Dyes in the Activated Sludge Process (Shaul et al., 1986; 1988) investigated the partitioning of
water soluble azo dyes in the activated sludge process (ASP). This was achieved by spiking specific
azo dyes, at concentrations of 1 and 5 mg/M, into pilot-scale treatment systems and analysing liquid
and sludge samples for residual dye. A total of 18 dyes were tested which are listed according to their
fate in the activated sludge process, in Table 2.2.
2-4

CI Direct Yellow 4
CI Acid Yellow 151
CI Acid Yellow 49
CI Acid Yellow 23
CI Acid Yellow 17
CI Acid Red 337
CI Acid Red 18
CI Direct Yellow 28CI Acid Red 14
CI Acid Red 88CI Direct Violet 9CI Acid Red 1
CI Acid Orange 8CI Acid Red 151CI Acid Orange 10
CI Acid Orange 7CI Acid Blue 113CI Acid Black 1
Group Three Dyes biodegraded in
ASP
Group TwoElimination of dyes
by adsorption
Group OneDyes passing through
ASP untreated
Table 2.2 : The extent of bioelimination/degradation of 18 water solubleazo dyes in the activated sludge process (ASP).
The relatively high sulphonic acid substitution of the dyes in Group one was thought to hinder their
removal by either adsorption or biodegradation in the ASP. The degree of sulphonation of an azo dye
is known to increase the water solubility of that compound and consequently decrease the ability of
that compound to adsorb to and penetrate microbial cell walls, thus limiting the chance of aerobic
biodegradation.
The positioning of the sulphonic acid functional group(s) and the molecular weight of the compound
was also speculated to have an effect on bioelimination. The compounds in Group Two were
adsorbed to the sludge despite being highly sulphonated, which was attributed to the higher
molecular weights of these compounds in comparison to those in Group One. The three remaining
azo dyes tested were found to be biodegraded in the ASP, however, it was not known whether these
compounds were mineralised in the system.
Shaul et al. (1986) developed adsorption isotherms for seven dyestuffs viz., CI Acid Blue 113, CI
Acid Orange 7, CI Acid Red 1, CI Acid Red 88, CI Acid Red 151, CI Acid Red 337 and CI Acid
Yellow 151. In all cases adsorption of the dyes to activated sludge conformed to the Freundlich
isotherm equation.
It was concluded from this project that the structure of the dye compound determined the fate of the
dyestuff in the activated sludge system, with high water solubility being the major factor in
preventing an azo dye compound from being either adsorbed or biodegraded by the ASP. No trend
could be found between adsorption and biodegradation of the dyes although sorption of the dye
molecules was acknowledged to play a principal role in colour removal in the ASP. From these
conclusion it can be deduced that water soluble azo dyes are not successfully treated in an activated
sludge system. The recommendations for future reasearch included more tests to define relationships
2-5

between physical and chemical properties of the dyestuffs, and the fate of the compounds in the
activated sludge process.
The fate of the reactive azo dyes, Reactive Black 5 and Navy 106, the latter being a mixture of three
azo dyes, was investigated in a laboratory simulated activated sludge plant (Ganesh et al., 1992).
The vinyl sulphone and hydrolysed forms of Reactive Black 5, and a Navy 106 washwater, were
investigated for degradation by activated sludge. A rapid initial decrease in colour was measured
upon addition of the vinylsulphone form of Reactive Black 5, which was attributed to sorption of the
dye to the biomass. No significant evidence of biodegradation was observed for this dye and sorption
was concluded to be the principal mechanism of colour removal. The hydrolysed form of Reactive
Black 5 did not show evidence of sorption or biodegradation in a nine day study, i.e. very little
colour removal is likely to be achieved in an activated sludge plant treating hydrolysed Reactive
Black 5. As waste reactive dyes are hydrolysed, activated sludge plants are, therefore, probably not
suitable for treatment of reactive dye waste water. Little colour removal was observed with the Navy
106 washwater.
The inhibitory effects of dyes on activated sludge microorganisms
As a number of dyes were found to be recalcitrant in the activated sludge process, concern arose as to
the toxicity of these compounds to the waste-water bacteria. A screening method was developed by
the ETAD (Brown et al., 1981) to determine the possible inhibitory effects of dyestuffs on aerobic
waste water microorganisms. There were 202 dyestuffs screened for inhibitory effects and the results
were reported as Inhibition Concentration (IC50) values. The dyes chosen from the classes of acid,
direct, disperse, reactive (including Reactive Red 141 (Procion Red HE-7B)), vat, mordant, pigment
and solvent dyes all yielded IC50 values greater than 100 mg/M. That is, these dyes were not
considered inhibitory to the waste-water microorganisms. However, a high percentage of the basic
dyes tested were found to have IC50 values of less than 100 mg/M, which is in agreement with the
findings of Ogawa et al. (1989) that basic dyes are inhibitory to microorganisms. It was concluded
from these tests that the results agree with the general experience of the ETAD, that is, although dyes
may give concern at sewage works due to their colour, they should not give rise to concern
regarding toxicity.
2.2.2 Degradation of Azo and Triphenylmethane Dyes in Aerobic Aquatic Environments
The transformation rates of 2 triphenylmethane dyes (Basic Violet 1, Basic Violet 3) and an azo dye
(Acid Orange 6) were measured in an aerobic system using field-collected and laboratory microbial
cultures (Michaels and Lewis, 1986). The aim of this study was to determine the potential
degradation of these compounds in an aquatic environment. Transformation of the Basic Violet dyes
followed four phases, namely, initial sorption, initial sorption equilibrium, transformation
(presumably degradation) and terminal equilibrium (i.e. the dyes were not completely transformed).
The azo dye Acid Orange 6 did not show any measurable transformation which is consistent with the
literature, i.e. that reductive cleavage of azo bonds occurs readily under anaerobic conditions, but the
aerobic transformation is limited (Meyer, 1981).
2-6

It was concluded from these studies that some dyes may be slowly degraded by aerobic aquatic
microbial populations, but that the toxicity of the persistent dyes may decrease the overall
mineralisation of organic compounds in the aquatic environment by causing a reduction in
concentration and species diversity of heterotrophic bacterial communities, unless these dyes are
rapidly degraded by anaerobic populations.
2.2.3 Adaptation of Microorganisms to Degrade Simple Azo Dyes
Although tests with activated sludge showed that little degradation of azo dyes could be expected
with aerobic microorganisms, a group of researchers at the Swiss Federal Institute of Technology
aimed to breed aerobic azo-degrading microorganisms using simple azo compounds.
Kulla (1981) reported on the isolation of bacteria capable of utilising azo compounds as sole sources
of carbon, nitrogen and energy. A simple azo compound, 4,4'- dicarboxyazobenzene, was initially
used to isolate a Flavobacterium species capable of using this compound as a sole carbon, nitrogen
and energy source. Adaptation of this bacterium to utilise various derivatives of Orange II (a
commercially used textile dye) was then attempted in batch culture, however, no success was
achieved and a chemostat system was developed to facilitate rapid selection of adapted
microorganisms. The conditions in the chemostat were not sterile and gradually the Flavobacterium
sp was outcompeted by a Pseudomonas-like organism, referred to as KF4. The breakthrough to
growth with Orange II carboxy as sole carbon, nitrogen and energy source occurred after
approximately 400 generations, during which time the characteristics of the pseudomonads did not
change. The authors, therefore, proposed that the microorganisms capable of utilising Orange II
carboxy as a sole carbon source (strain KF44) were direct descendants of strain KF4. Another
Pseudomonas-like organism (K22) which was also capable of degrading Orange I carboxy was
isolated after 100 generations.
When attempts were made to extend the substrate specificity of the two cultures (KF44 and K22), it
was found that KF44 always retained the capability to metabolise the original substrates, although
adapting to degrade more complex substrates, while K22 appeared to shift its specificity. As K22
contained no plasmids, it was postulated that one or more genes coding for the degradation of
Orange II carboxy in KF44 was plasmid-borne, thereby allowing KF44 to retain its ability to degrade
this compound.
Although a microorganism capable of mineralising the dye of choice was successfully developed, it
was concluded that the strains KF44 and K22 were too highly bred to survive in waste-water
treatment plants and, that the fairly stringent substrate specificity of the strain was not feasible for
practical waste-water treatment.
Zimmermann et al. (1982) continued this research by isolating and characterising Orange II
azoreductase, the enzyme initiating azo dye degradation by Pseudomonas KF44. The purpose of the
study was to elucidate the substrate requirements of the enzyme and the following generalisations
were found with respect to the structural features required of substrates:
2-7
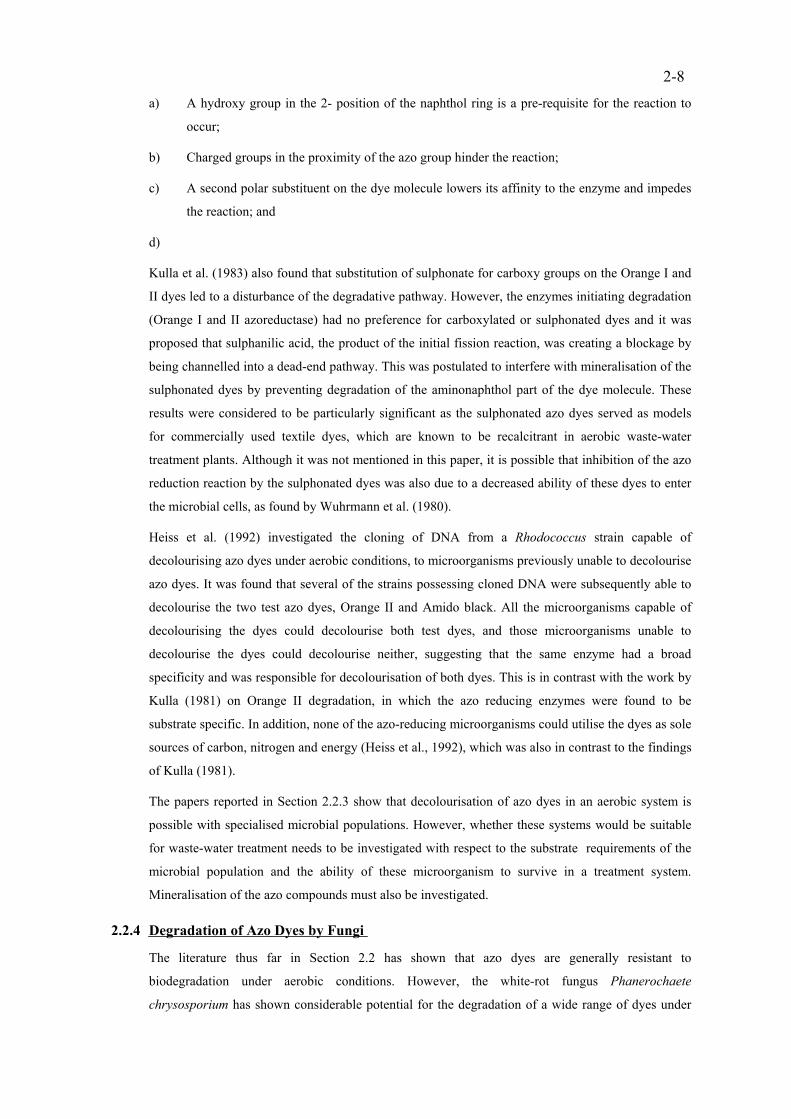
a) A hydroxy group in the 2- position of the naphthol ring is a pre-requisite for the reaction to
occur;
b) Charged groups in the proximity of the azo group hinder the reaction;
c) A second polar substituent on the dye molecule lowers its affinity to the enzyme and impedes
the reaction; and
d)
Kulla et al. (1983) also found that substitution of sulphonate for carboxy groups on the Orange I and
II dyes led to a disturbance of the degradative pathway. However, the enzymes initiating degradation
(Orange I and II azoreductase) had no preference for carboxylated or sulphonated dyes and it was
proposed that sulphanilic acid, the product of the initial fission reaction, was creating a blockage by
being channelled into a dead-end pathway. This was postulated to interfere with mineralisation of the
sulphonated dyes by preventing degradation of the aminonaphthol part of the dye molecule. These
results were considered to be particularly significant as the sulphonated azo dyes served as models
for commercially used textile dyes, which are known to be recalcitrant in aerobic waste-water
treatment plants. Although it was not mentioned in this paper, it is possible that inhibition of the azo
reduction reaction by the sulphonated dyes was also due to a decreased ability of these dyes to enter
the microbial cells, as found by Wuhrmann et al. (1980).
Heiss et al. (1992) investigated the cloning of DNA from a Rhodococcus strain capable of
decolourising azo dyes under aerobic conditions, to microorganisms previously unable to decolourise
azo dyes. It was found that several of the strains possessing cloned DNA were subsequently able to
decolourise the two test azo dyes, Orange II and Amido black. All the microorganisms capable of
decolourising the dyes could decolourise both test dyes, and those microorganisms unable to
decolourise the dyes could decolourise neither, suggesting that the same enzyme had a broad
specificity and was responsible for decolourisation of both dyes. This is in contrast with the work by
Kulla (1981) on Orange II degradation, in which the azo reducing enzymes were found to be
substrate specific. In addition, none of the azo-reducing microorganisms could utilise the dyes as sole
sources of carbon, nitrogen and energy (Heiss et al., 1992), which was also in contrast to the findings
of Kulla (1981).
The papers reported in Section 2.2.3 show that decolourisation of azo dyes in an aerobic system is
possible with specialised microbial populations. However, whether these systems would be suitable
for waste-water treatment needs to be investigated with respect to the substrate requirements of the
microbial population and the ability of these microorganism to survive in a treatment system.
Mineralisation of the azo compounds must also be investigated.
2.2.4 Degradation of Azo Dyes by Fungi
The literature thus far in Section 2.2 has shown that azo dyes are generally resistant to
biodegradation under aerobic conditions. However, the white-rot fungus Phanerochaete
chrysosporium has shown considerable potential for the degradation of a wide range of dyes under
2-8

strictly aerobic conditions (Glenn and Gold, 1983; Cripps et al., 1990; Capalash and Sharma, 1992;
Paszczynski et al., 1992; Pasti-Grigsby et al., 1992).
Glenn and Gold (1983) reported that P. chrysosporium degraded and decolourised 3 polymeric dyes
(Poly B, Poly R and Poly Y) by means of secondary metabolic processes. A number of parallels were
drawn between lignin degradation (which is also a secondary metabolic process) and decolourisation
of the polymeric dyes. Firstly, decolourisation was repressed by nutrient nitrogen and only
commenced after all the nitrogen in the cultures had been consumed and, secondly, oxygen appeared
to be required to both induce and activate the catalytic system responsible for dye decolourisation.
Both of these factors are valid for lignin degradation by P. chrysosporium. In addition, mutants
lacking phenol oxidase and ligninolytic activity were not able to decolourise the dyes, whereas a
phenotypic revertant strain was able to regain this capacity. From this evidence it was suggested that
a single catalytic system was responsible for the degradation of lignin and the dyes but that specific
reactions were likely to be dependent on the chemical and physical properties of the substrate.
Cripps et al. (1990) reported that P. chrysosporium could decolourise three azo dyes (Tropeolin O,
Orange II and Congo Red) and a heterocyclic dye (Azure B). The structure of the dye was found to
influence the extent of decolourisation, with the heterocyclic dye being readily degraded by the
fungus while Congo Red, the largest and most complex dye, was not completely decolourised even
after 12 d of incubation. These researchers agreed with Glenn and Gold (1983) that decolourisation
of the dyes occurred via ligninolytic enzymes, and suggested that a number of enzymes or enzyme
systems, which are expressed at the onset of the idiophase, must be involved in the degradation of the
dyes.
Capalash and Sharma (1992) reported that degradation of the azo reactive dye, Reactofix Golden
Yellow, as measured by decolourisation, occurred via the non-specific lignin degrading system of
P. chrysosporium. The first step in dye degradation was suggested to be extracellular, due to the size
of the compounds, and to be catalysed by enzymes such as lignin peroxidase. Paszczynski et al.
(1992) and Pasti-Grigsby (1992) also suggested that peroxidase enzymes are involved in the initial
azo dye biodegradation process when investigating the degradation of a number of sulphonated azo
dyes by P. chrysosporium. They reported that all the dyes investigated were mineralised by the
fungus and that the substitution pattern of the dyes did not significantly influence the susceptibility of
the dyes to degradation.
Thus, the treatment of textile effluent with the fungus P. chrysosporium could be an effective means
of colour and COD removal. However, disadvantages of this system compared with an anaerobic
system could be high sludge production and high energy requirements for aeration, as the process is
strictly aerobic.
2.2.5 Degradation of Azo Dyes by Algae
Jinqui and Houtian (1992) tested the ability of Chlorella pyrenoidosa, C. vulgaris and Oscillateria
tenuis, to degrade 30 azo compounds. Fourteen of these azo dyes showed a percentage
decolourisation of 50 % or higher, with results indicating that degradability was directly related to
2-9

the molecular structure of the azo compounds. Azo compounds with hydroxy or amino groups were
generally more readily degraded than those with a methyl, methoxy, sulpho or nitro group. The
presence of hydroxy or amino groups on the compound also appeared to partially counteract the
inhibitive effect of sulphonate groups on azo reduction. The lower rate of degradation of
sulphonated azo compounds was thought to be related to a decreased ability of the compounds to
enter the microbial cells, as reported by Wuhrmann et al. (1980) with bacterial cells.
It was found that the sulphonated azo dye, Erichrome Blue SE could be utilised by the algae as a sole
source of carbon and nitrogen, and that the degradation process was related to the physiological
metabolism of the algae. It seemed likely, therefore, that the algal population had the ability to
mineralise the azo degradation products. This was confirmed when aniline (a common azo
degradation product) was found to be mineralised in all of the tests.
The azo reductase enzyme, responsible for the initial reduction reaction, was found to cleave the azo
bonds of the compounds to yield aromatic amine intermediates which were subsequently mineralised
by the algae. The activity of azo reductase increased with the addition of NADH or NADPH
suggesting that these compounds were co-factors for azo reductase, acting as electron donors for the
breaking of the azo bond. The algal azo reductase was more specific for NADPH than NADH.
Moreover, it was found that unacclimated algae displayed a lower level of azo reductase activity than
those previously exposed to azo compounds, suggesting that azo reductase is induced by the azo
compounds.
The results of this research are particularly relevant to treatment of textile effluent in stabilization
ponds. Traditionally, the algal component was thought to contribute only indirectly to organic
degradation, by providing oxygen (through photosynthesis) to augment the degradative capabilities
of the catabolising bacteria. However, these results show that the algal population is capable of
mineralizing azo dyes in the textile effluent.
2.3 DECOLOURISATION OF AZO DYES IN AN ANAEROBIC SYSTEM
Decolourisation of azo dyes under anaerobic conditions is thought to be a relatively simple and
non-specific process, involving fission of the azo bond to yield degradation products such as
aromatic amines. This was initially studied with respect to mammalian metabolism, due to the
increasing use of azo dyes as food colourants (Meyer, 1981). The ability of the azo bond to be
reduced under anaerobic conditions (such as in the mammalian intestine) was cause for concern, as
the by-products of azo fission (derivatives of aminoazobenzene) were suspected carcinogens. As
early as 1911, Sidney and Porscher (cited by Meyer, 1981) found sulphanilic acid in the urine of
dogs fed with the azo dye Orange I and postulated a reductive cleavage of the azo group as the initial
step of degradation. This was later confirmed by other authors (Mueller and Miller, 1948, 1949; cited
by Meyer, 1981) and was shown to be catalysed by azo reductase enzymes in the liver as well as
anaerobic microorganisms of the intestinal tract. Subsequent work indicated that azo reduction by the
gut microflora was an important and common metabolic process in mammals (Walker and Gingell,
1971) and early research involving anaerobic microbial azo reduction, therefore, concentrated on
2-10

catalysis by intestinal anaerobes. Since then, papers published on the microbial degradation of azo
dyes in anaerobic systems have concentrated primarily on degradation of textile dyes as a potential
means of decolourising textile effluent.
Various proposals have been given regarding the mechanism of anaerobic azo reduction. A common
link between these theories is that azo reduction is thought to be concurrent with re-oxidation of
reduced flavins of the electron transport chain, i.e. the azo compound is reduced as a terminal
electron acceptor in the microbial electron transport chain. A detailed discussion with respect to the
proposed theories of anaerobic azo reduction is presented in Chapter Three, therefore, this section
aims only to provide an overview of the literature with respect to the results achieved by various
groups of researchers examining azo dye decolourisation with anaerobic microorganimsm.
2.3.1 Degradation of Azo Dyes by Microflora of the Mammalian Intestine
Papers by Walker and Gingell (1971) and Gingell and Walker (1971) investigated the mechanism of
azo reduction by Streptococcus faecalis, using the azo dye, Red 2G. Their results showed that
soluble flavin, acting as a two electron donor, could rapidly reduce the azo dye non-enzymically, i.e.
that the reduced flavins acted as electron shuttles, ferrying electrons from the flavoproteins of the
microbial electron transport chain to the acceptor azo compound. The rate of formation of the
reduced flavins was therefore a rate-limiting factor in azo reduction and, as the production of reduced
flavins is dependant on catabolism of an electron donor, an additional carbon source was found to be
required for azo reduction. Dubin and Wright (1975), working with Proteus vulgaris and the azo
dyes, Amaranth, Orange II, Ponceau 3R, Ponceax SX, Sunset Yellow and Tartrazine, extended this
theory to include a rate-controlling step which involved a redox equilibrium between the dye and an
extracellular reducing agent. Therefore, the specific reduction potentials of the dye was proposed to
be a rate-limiting factor in azo reduction. Dubin and Wright (1975) proposed that azo reduction was
an extracellular reaction, although Larsen et al. (1976), investigating the azo reduction of Fast Red E,
Amaranth, Ponceau 4R and Ponceau 6R by gut microflora, found that the rate-limiting factor for azo
reduction was the ability of the dyes to penetrate the microbial cell walls. They, therefore, proposed
that azo reduction occurred intracellularly. Finally, Chung et al. (1978) reported that Bacillus
thetaiotaomicron decolourised the azo dyes Amaranth, Poneau SX, Allura Red, Sunset Yellow,
tartrazine, Orange II and methyl orange, by means of a suitable electron shuttle. An interesting result
from this work was that the presence of glucose was found to inhibit reduction of tartrazine by B.
thetaiotaomicron, whereas most other researchers had found that glucose had an enhancing effect on
azo reduction by stimulating production of soluble flavin.
2.3.2 Anaerobic Decolourisation of Azo Dyes by Single Microbial Species
Much of the experimental work involving the anaerobic decolourisation of dyes (predominantly azo
dyes) was conducted using mono cultures. Species of Bacillus and Pseudomonas were found to be
active in the anaerobic degradation of a number of dyes but other microorganisms, such as those
belonging to the genus Aeromonas and purple non-sulphur photosynthetic bacteria, have been found
to successfully decolourise a range of dyes.
2-11

Decolourisation of azo dyes by Bacillus sp.
One of the earliest reports of azo reduction by a Bacillus sp. was by Wilcox et al. (1971) in
connection with the decolourisation of azo dyes used for dyeing incense cedar pencil slats. The dye
solution consisted of CI Acid Red 14, CI Acid Orange 7 and CI Acid Black 1. The solution was
stored in steel tanks between runs, at a temperature of 68 o C, however, during shutdown periods the
temperature would often drop to 54 o C and decolourisation of the batch solution often occurred. A
Bacillus sp was isolated from the batch and found to be capable of decolourising pure solutions of
the red and black dyes in the laboratory, although no decolourisation of the orange component was
observed. However, no residual orange colour could be detected in vivo from the mixture of dyes,
indicating that the dye mixture was degraded more efficiently than the single dye solutions. The
microorganisms were unable to utilise the dyes as sole carbon and energy sources in the laboratory
and required an additional source of nutrition. It was subsequently found that sludge in the storage
tank consisting of sawdust from the manufacturing operation, contributed the additional substrate
required for decolourisation.
Horitsu et al. (1977) showed that p-aminoazobenzene (PAAB), a disperse dye with an azo
chromophore, could be degraded by Bacillus subtilis. This occurred via reductive cleavage of the azo
bond to produce aniline and p-phenylenediamine. Continuation of this research by Idaka et al. (1982)
showed that p-aminoazobenzene was degraded by means of two pathways. The first pathway
involved cleavage of the azo bond to yield aniline and p-phenylenediamine, with the aniline
subsequently metabolised to acetanilide and the p-aminoacetanilide to p-phenylenediacetamide. The
second pathway involved direct acetylation of PAAB to p-acetamidoazobenzene. No mineralisation
of these degradation products was recorded.
Wuhrmann et al. (1980) investigated the anaerobic reduction of azo dyes utilised in the textile
industry by a strain of Bacillus cereus isolated from soil. The bacteria were shown to have the ability
to decolourise the azo dyes by reductive cleavage of the azo bonds. Decolourisation of these dyes did
not occur when the supplemental carbon source (glucose) was absent and it was proposed that
glucose was neccessary to sustain the metabolic state of the bacteria to facilitate the production of
reduction equivalents (reduced flavins) which were required for decolourisation. Permeation of the
dyes into the microbial cells was cited as the principal rate-limiting factor for decolourisation and this
was confirmed by Meschner and Wuhrmann (1982). These researchers permeabilised the cells of B.
cereus by treatment with toluene and reported that this significantly increased the rate of uptake of
both sulphonated and carboxylated azo dyes from the external medium into the microbial cells. The
mechanisms involved in the permeabilisation process were not resolved but two possible principles
were proposed :
a) The toluene in the permeabilisation liquid removed part of the lipid fraction of the cell
membrane and facilitated the passage of strongly polar, hydrophilic dye molecules; or
b) Some of the removed lipids may adsorb to the sulphonic acid groups on the dyes, decreasing
the hydrophilic nature of these compounds and concomittantly increasing their permeability.
2-12

Yatome et al. (1991), investigating the degradation of azo dyes by Bacillus subtilis, also concluded
that cell permeability was the principal rate-limiting factor in the microbial degradation of azo dyes.
They reported that unsulphonated dyes were easily decolourised via reductive cleavage of the azo
bonds, but that increasing sulphonation of the azo dyes decreased the rate of decolourisation. Some
sulphonated azo dyes were not decolourised at all by cells of B. subtilis.
Decolourisation of dyes by Pseudomonas species
The pseudomonads are an extremely large, versatile and adaptable class of microorganisms and it is
not surprising that Pseudomonas species have featured prominently in research involving the
degradation of xenobiotic azo compounds.
The biodegradation of azo dyes by Pseudomonas cepacia 13NA was investigated by Ogawa et al.
(1986; 1990) using the dyes, CI Acid Orange 12, CI Acid Orange 20 and CI Acid Red 88. A
three-stage continuous culture system (with the flasks arranged in series) was found to be more
successful then a one stage system, with respect to the rate of degradation of the dyes. This was
attributed to :
a) An abundance of nutrients in the first stage of the cultivation system which resulted in a rapid
increase in the bacterial population, increasing the number of potential azo degrading bacteria;
and
b) A consequent paucity of nutrients in the second and third culture flasks which forced the
microorganisms to assimilate the azo dyes for their growth, i.e. the azo dyes were degraded
under nutrient limited conditions.
These results are unusual as a pre-requisite for degradation of azo dyes is usually that a supplemental
carbon source is provided to sustain the metabolic activity of the azo reducing microbial population
(Wuhrmann et al, 1980).
Ogawa and Yatome (1990) aimed to develop a waste-water clarification technology, for removal of
dyes and other organic substances in a single operation, using P. cepacia 13NA. The mode of
treatment chosen was a multi-stage rotating biological contactor, with discs on which P. cepacia
13NA was immobilized with K-carrageenan gel. A multi-stage reactor was chosen due to the
findings of Ogawa et al. (1986). The researchers discovered that the natural organic substances in the
effluent were preferentially assimilated and, consequently, significant biomass increase was
achieved. However, little dye degradation occurred at this stage and it was realised that the dyes were
degraded only by starved cells. For this reason, the first reactor was suited for growth of the
microorganisms because of the rich nutrient quality of the effluent, while the third reactor was suited
for the catabolism of the dyes because of poor nutrient quality. The researchers concluded that it may
be possible to keep both the growth of the microbes and the degradation of the dyes high, by
periodically changing the path of solution in the waste-water treatment plant. The dyes treated were
C.I. Acid Red 88, C.I. Direct Blue 6 and PAAB and a retention time of 20 h was chosen as the dyes
were known to be resistant to biodegradation. However, the overall biodegradation rate of the dyes
2-13

was poor and it was concluded that a longer retention time was neccessary to enhance the rate of
elimination.
Yatome et al. (1990) investigated the degradation of several azo dyes by cell-free extracts from the
azo reducing microorganism P. stutzeri to determine the roles of dye redox potential and
hydrophobic character in the rate of azo reduction. They concluded that both parameters are useful in
helping to gain an understanding of the relationship between the ease of degradation of dyes and
their structure but that no definite rules for degradability of azo dyes could be formulated. Yatome et
al. (1991) reported that the rate of degradation of azo compounds by whole cell culture of P. stutzeri
was limited by the relative ease at which the compounds could permeate the cell.
Decolourisation of dyes by Aeromonas species
Reports of the degradation of azo dyes by Aeromonas hydrophilia var. 24B have been made by Idaka
and Ogawa (1978) and Yatome et al. (1987).These findings were similar to other reports of
anaerobic decolourisation of azo dyes.
Decolourisation of dyes by purple non-sulphur bacteria (PSB)
Guoquing et al. (1990) isolated a purple non-sulphur bacterium from activated sludge at a
waste-water treatment works treating textile dye-containing effluent. This microorganism was tested
for its ability to decolourise 14 commercial textile dyes at concentrations from 20 to 200 mg/M. The
rates of decolourisation were found to differ for the various dye classes with dyes belonging to the
direct, acid , basic, reactive and cationic dye classes generally being decolourised quickly and
effectively. Of particular interest was the fact the a reactive dye, Reactive Red X-3B, could be
decolourised with a 97,5 % efficiency. Only two dyes of the fourteen tested, a disperse blue dye and
an alizanthrene blue dye, were found to be difficult to decolourise. The decolourising ability of the
PSB was found to be considerably enhanced under dark anaerobic conditions, as opposed to light
anaerobic conditions. Since photosynthesis can occur under light anaerobic conditions it may be
speculated that this metabolic state is not conducive to decolourisation of the dyes.
Infrared analysis of the dyes showed that decolourisation was due to azo reduction, and that no
mineralisation of the dyes occurred. These dyes were, therefore, not satisfactory as sole carbon
sources for maintenance of the PSB. The addition of an auxiliary agent used in dyeing (sodium
acetate) was found to be adequate as a nutritional source to sustain the decolourising efficiency of the
bacteria.
2.3.3 Decolourisation of Dyes with Mixed Populations of Microorganisms in AnaerobicDigester Sludge
The ETAD performed a series of experiments to assess the primary biodegradability
(decolourisation) of dyestuffs under conditions of anaerobic digestion (Brown and Laboureur,
1983a). The study was performed with 22 dyestuffs which were chosen as commercially important
representatives of the major classes of dyestuffs. All dyestuffs evaluated were water-soluble and
direct Red 7 was used as a positive control. The procedure followed was that specified in the ETAD
2-14

Ecological Method No. 105 (1982). The anaerobic sludge inoculum was obtained from a sewage
digester at a local treatement works. This inoculum was incubated with a test medium containing
glucose as a supplemental labile carbon source, in suitable anaerobic batch reactors. The dyes were
added singly to individual reactors and monitored for decolourisation over a period of 42 d.
The results showed that the degree of primary biodegradability varied between, and within, the dye
classes (dyes classified by application). The structure of the dye chromophore was more important
than the dye application class in determining the ease with which decolourisation occurred. The dyes
containing mono-, dis- and poly- azo chromophores showed a substantial degree of decolourisation,
although, the dyes with anthraquinone chromophores exhibited a broad variation of results ranging
from scarcely degraded to substantial degradation. Other dye chromophores which were represented
were stilbene (53 % decolourisation), triphenylmethane (no decolourisation was measured as it was
unstable in aqueous solution), phthalocyanine (36 % decolourisation), oxazine (62 %
decolourisation), methine (35 % decolourisation) and nitro (62 % decolourisation initially reported
but a coloured metabolite was subsequently formed).
The authors concluded that with the single exception of Acid Blue 80, an anthraquinone dye which
showed only 7 % decolourisation, all the dyestuffs tested showed a substantial degree of colour
removal, and that the breakdown of dyestuffs in the environment is likely to be initiated under
anaerobic conditions.
Kremer (1989) reported that the anaerobic degradation of two monoazo dyes, Acid Red 88 and Acid
Orange 7, occurred in anaerobic serum bottles inoculated with sludge from an anaerobic digester.
The rate of decolourisation of the azo dyes was noted to be increased when supplemental carbon
(other than the dyes) was present. The addition of supplemental carbon was also found to have an
effect on the degradation products formed as a result of azo reduction, although no mineralisation of
the dyes was seen to occur.
Degradation of hydrolysed Reactive Black 5 dye in an anaerobic digester (Ganesh et al., 1992)
concurred with a decrease in colour (as measured by ADMI units). The hue of the wastwater was
reported to change from blue to greenish-yellow and was thought to be indicative of the production
of aromatic amines. As this greenish yellow colour persisted it was thought likely that mineralisation
of the dyes did not occur.
It can, therefore, be concluded that reduction of azo dyes will occur readily when these dyes are
incubated in an anaerobic treatment system in which supplemental labile carbon is present. However,
the fates of the resultant dye metabolites in the anaerobic treatment system remains uncertain and is
2.4 THE FATE OF DYE METABOLITES IN BIOLOGICAL TREATMENTSYSTEMS
Decolourisation of dyehouse effluent by reductive cleavage represents a primary degradation step
which involves no elimination of chemicals from the waste water and results in the production of
2-15

aromatic amine metabolites. Environmental protection requires the mineralisation of waste
compounds and thus, conditions must be found which will permit microbial degradation of the amine
moieties produced in the primary reductive reaction.
The ETAD extended the research begun with the assessment of the primary biodegradability of dyes,
to include the biodegradability of some aromatic degradation products. Brown and Laboureur
(1983b) investigated the aerobic biodegradability of the following unsulphonated aromatic amines:
aniline, o-toluidine, p-anisidine, p-phenetidine, o-dianisidine and 3,3'-dichlorobenzidine. All these
compounds are lipophillic aromatic amines and possible cleavage products from commercially
available dyes. Aniline was used as the reference substance in the tests with the validity criterion
specifying that the level of aniline degradation must be at least 70 % by day 14.
The results showed that aniline, o-toluidine, p-anisidine and p-phenetidine degraded in an aerobic
system, and that degradation was complete, i.e. mineralisation of the compounds occurred. These
compounds could, therefore, be utilised as sole sources of carbon and energy by the waste-water
microorganisms. However, the extent of degradation of o-dianisidine and 3,3'-dichlorobenzidine
showed a clear dependance on the presence or absence of yeast extract. It was found that yeast
extract actually promoted biodegradation of the amines, possibly due to the provision of an essential
growth factor. It is also possible that the yeast extract merely acted as a labile food source resulting
in a large concentration of active bacteria which were then able to break down the amines.
Brown and Hamburger (1987) continued the ETAD investigation into the aerobic biodegradability of
aromatic amines and also investigated the possibility of anaerobic degradation of these metabolites.
The metabolites were prepared by anaerobically decolourising a number of sulphonated textile dyes
and collecting the degradation products in the aqueous phase of the experimental systems. The
aqueous phase (containing aromatic metabolites resulting from the degradation of sulphonated dyes)
was then either incubated with activated sludge and subjected to aerobic degradation, or re-incubated
in an anaerobic system. Degradation of the metabolites was assessed by monitoring the removal of
DOC or by gas chromatographic analysis. The results showed that degradation of the dye metabolites
occurred in the aerobic system, usually resulting in mineralisation, whereas no evidence of
biodegradation of these compounds could be detected in the anaerobic system.. It was concluded
that metabolites resulting from the reduction of azo compounds were unlikely to be degraded under
anaerobic conditions, but could probably be degraded in acclimated aerobic systems.
Haug et al. (1991) reported that the metabolites resulting from the reduction of an azo dye Mordant
Yellow 3, ( 6-aminonaphthalene-2-sulphonate and 5-aminosalicylate) were not degraded in the
anaerobic system which gave rise to decolourisation. However, upon re-aeration of the culture these
amines were mineralised by a bacterial association indicating that these compounds were more
amenable to aerobic than anaerobic degradation.
Kremer (1989) reported that the anaerobic reduction of an azo dye, Acid Red 88, resulted in the
production of naphthionic acid and 1-amino-2-naphthol. The metabolites were not mineralised when
incubated in an anaerobic system with an additional carbon source, although transformation of these
2-16

compounds occurred during the incubation period. The fate of the aromatic amine metabolites,
naphthionic acid and 1-amino-2-naphthol, is shown in Fig 2.1. The compounds marked with an
asterisk were detected in the anaerobic system. It can be seen that 1-amino-2-naphthol (a metabolite
resulting from reduction of AR88) was not detected in the anaerobic system and was, therefore,
probably rapidly transformed to isoquinoline, 2-naphthol or 1,2 naphthoquinone, all of which were
detected in the system. The other metabolite resulting from the reduction of AR88, naphthionic acid,
was not transformed during the incubation period and was postulated to be channelled into a dead
end pathway.
Fig 2.1 : Fate of Acid Red 88 metabolites in an anaerobic system.
NaO3S N N
OH
NaO3S NH2
+OH
H2N
N
N
N
NH3
O
O OH
OH
OHH
HOH
OH
O
O
*
*
*
*
H2H2O
ACID RED 88
NAPHTHIONIC ACID 1-AMINO-2-NAPHTHOL
NO DEAMINATION OCCURING :POSSIBLY CHANNELLED INTO A DEAD END PATHWAY
1,2 DIHYDROXY NAPHTHALENE
NAPHTHOQUINONE1,2
2-NAPHTHOL
* COMPOUNDS DETECTED
Possibly a competing mechanism in the degradation of 1,2 dihydroxynaphthalene to form 1,2 naphthoquinone and 2-naphthol
ISOQUINOLINE
*
A polymerization product formed through reaction of naphtholamines and their polymerisation products
2.4.1 The Potential of Specialised Anaerobic Microorganisms to Degrade AromaticCompounds Structurally Similar to Azo Dye Metabolites
Research dealing specifically with the mineralisation of dye metabolites in biological systems has
indicated that little biodegradation of these compounds would be expected in an anaerobic system.
However, general research involving the degradation of aromatic compounds has shown that a
2-17

number of aromatic compounds previously thought to be dependent on oxygen for splitting the ring
structure, can be degraded under anaerobic conditions. Since most dyes are aromatic in structure it
was postulated that the aromatic dye metabolites could possibly be anaerobically degraded. A
literature review was undertaken with the aim of determining whether dye metabolites are unlikely to
be degraded in anaerobic systems, as concluded by Brown and Hamburger (1987), or whether these
compounds have the potential to be degraded in specifically applied anaerobic systems.
The literature review concentrated on papers dealing with biodegradation of the following
compounds:
a) Naphthalene and naphthol (including substituted compounds) which form the structural basis
of numerous azo dyes;
b) Nitroaromatics such as aniline; and
c) Nitrogen heterocyclic compounds which form the reactive groups of reactive dyes.
Mihelcic and Luthy (1988) showed that degradation of naphthalene, acenaphthene and naphthol
could occur under anaerobic conditions but was significantly improved in anoxic systems with
denitrification conditions. The acclimation period for degradation of naphthalene and acenaphthene
under denitrification conditions was reported to be two weeks, in comparison to the two day
acclimation period required for aerobic degradation of these compounds. Mihelcic and Luthy (1991)
investigating the degradation of naphthalene in soil water suspensions under denitrification
conditions, confirmed that naphthalene was readily degraded under these conditions. Al-Bashir et al.
(1990) showed that mineralisation of naphthalene to carbon dioxide occurred in parallel with
consumption of nitrate in the system over a 50 d incubation period. They concluded that denitrifying
redox conditions show significant potential for the biodegradation of low molecular weight
polycyclic aromatic hydrocarbons. Garcia-Valdes (1988) isolated over 100 strains of microorganisms
from anaerobic marine sediments in a heavily polluted area, that could utilise naphthalene as a sole
source of carbon and energy. One of these isolates was identified as Pseudomonas stutzeri, a species
previously shown to be capable of anaerobically decolourising azo dyes (Yatome et al., 1990). This
correlation is interesting as the metabolites of the azo dye reduced by P. stutzeri were substituted
naphthalenes, and the findings of Garcia-Valdes (1988) raises the question of whether these
metabolites could have been degraded by this microorganism in an anaerobic system.
Nitroaromatic compounds such as aniline were reported to be degraded by the sulphate-reducing
bacterium, Desulfobacterium anilini, under anaerobic conditions with carbon dioxide as the electron
acceptor (Schnell and Schink, 1991). Hallas and Alexander (1983) also reported that aniline
degradation could occur under anaerobic conditions with single species cultures of adapted
microorganisms. However Horowitz et al. (1982) reported that several nitroaromatic compounds
were highly resistant to microbial attack under anaerobic conditions.
2-18

Heterocyclic compounds, particularly those containing nitrogen (which commonly form the reactive
groups of cotton reactive dyes), are susceptible to degradation under sulphate-reducing or
methanogenic conditions (Kuhn and Suflita, 1989). Pyridine and indole have been reported to be
metabolised under nitrate-reducing and methanogenic conditions respectively (Ronen and Bollag,
1991; Berry et al., 1987).
2.4.2 Degradation of Sulphonated Metabolites of Water-Soluble Dyes
Section 2.4.1 shows that the degradation of aromatic compounds such as naphthalene, aniline and
nitrogen heterocyclic compounds, which form the structural basis of commercial textile dyes, does
occur under anaerobic conditions. However, water-soluble textile dye intermediates are usually
highly sulphonated, a property which is known to increase the recalcitrant nature of these compounds
by decreasing their ability to permeate into microbial cells (Wuhrmann et al., 1980). In fact,
naphthalene-sulphonic acids which are manufactured as pre-products for detergents and textile dyes
have been classified as persistent xenobiotics (Quentin, 1978; cited by Luther and Soeder, 1991) due
to the consistent recalcitrance of these compounds in both aerobic and anaerobic biological treatment
systems.
Research involving the biodegradation of sulphonated aromatic compounds has shown that
degradation of these compounds only occurs subsequent to the removal of the sulphonic acid group
from the compound. The C-SO3 bond is labilised by oxygenolytic cleavage (Brilon et al., 1981a) and
is, therefore, a strictly aerobic reaction.
Aerobic degradation of naphthalene-sulphonic acids by a Pseudomonas sp was reported by Brilon et
al. (1981a, 1981b). The sulphonic acid group was eliminated as hydrogen sulphite as a result of
oxygenolytic cleavage of the C-SO3 bond (Fig 2.2) and the naphthalene compound was mineralised
as a sole source of carbon and energy.
Fig 2.2 : Oxygenolytic cleavage of naphthalene-2-sulphonic acid and thesubsequent liberation of hydrogen sulphite.
[2h]
HSO3
O2
OHOH
SO3HOH
OHH
SO3H
2-19

Zurrer et al. (1987) showed that nine substituted naphthalenesulphonic acids could be desulphonated
while providing the sole source of sulphur for aerobic growth of a Pseudomonas and an Arthrobacter
sp. None of these compounds served as a carbon source for these bacteria, i.e. they were not
mineralised subsequent to desulphonation. Naphthalenesulphonic acids have also been shown to be
adequate sources of sulphur for the green alga, Scenedesmus obliquus, which liberates the sulphate
by oxygenolytic cleavage (Luther and Soeder, 1991).
However, no reports of the anaerobic degradation of sulphonated aromatic compounds have been
made and, therefore, it seems unlikely at this time that mineralisation of the sulphonated degradation
products of water-soluble dyes (such as acid, direct and reactive dyes) will take place in the
anaerobic system that causes decolourisation.
2.5 A COMBINATION OF ANAEROBIC AND AEROBIC BIOLOGICALSYSTEMS FOR THE DEGRADATION OF TEXTILE DYES
Anaerobic treatment of dyes has been found inadequate with respect to mineralisation of the
degradation products and aerobic decolourisation of dyes does not seem feasible in practical
waste-water treatment. Therefore, two-phase systems have been developed which incorporate an
anaerobic stage for decolourisation and a subsequent aerobic stage for mineralisation of the
degradation products.
Bhattacharya et al. (1990) investigated the fate and effect of water-soluble azo dyes in a two phase
anaerobic-aerobic system. They reported 30 % to 50 % dye removal in the anaerobic stage and a
further 1 % to 18 % removal in the aerobic stage. Unfortunately the DOC content of the effluent was
not monitored and, therefore, the efficiency of the system for mineralisation of azo dyes cannot be
assessed.
Haug et al. (1991) achieved mineralisation of the sulphonated azo dye, Mordant Yellow 3, by a
6-aminonaphthalene-2-sulphonate-degrading bacterial association. The system used to achieve this
was a two phase anaerobic-aerobic system. Complete decolourisation was noted in the anaerobic
phase, although the exact mechanism of decolourisation was not understood. The addition of glucose
to the culture medium was shown to enhance the decolourisation process, which was attributed to
two potential factors. Either the glucose could act as a donor of reduction equivalents, or its addition
could result in more actively respiring cells thus rapidly depleting the medium of oxygen and
facilitating the anaerobic transfer of reduction equivalents to the azo dye. The addition of flavin
adeninenucleotide (FAD) to the culture medium clearly enhanced the reduction reaction, indicating
that FAD was reduced in the microbial cells and the reduced FAD in turn spontaneously reduced the
azo dye.
The reduction (cleavage of the azo bond) of Mordant Yellow 3 resulted in the production of two
intermediates, 6-aminonaphthalene-2-sulphonic acid (6A2NS) and 5-aminosalicylate (5AS) which
accumulated under anaerobic conditions. However, when aerobic conditions were restored the
degradation products were mineralised by the microorganisms in this mixed culture. The proposed
pathway for complete degradation of the azo dye, Mordant Yellow 3, is shown in Fig 2.2.
2-20

It should be noted that the unsulphonated metabolite (5-aminosalicylate) immediately underwent ring
cleavage and degradation, while initial reactions involving the sulphonated metabolite
(6-aminonaphthalene-2-sulphonic acid) were the oxygenolytic cleavage of the C-SO3 bond and
liberation of sulphite. This confirms reports by Brilon et al. (1981a, 1981b) that the sulphonic acid
Fig 2.3 : Proposed pathway for degradation of the azo dye Mordant Yellow 3 (MY3) by amixed microbial population (Haug et al., 1991).
OHCOOH
N N
SO3H
OHCOOH
NH2
SO3H
H2N
(5AS)(6A2NS)
(MY3)ANAEROBIC
AEROBIC
COOHOCOOH
H2N
COOHO
H2N COOH
COOHO
COOHHO
FUMURATE + PYRUVATE
H2O
COOH
OH
H2N02
H2ONH3
SO3H
H2N
H2N
SO3HOH
OHH
H2N
OHOH
OH COOHO
H2N
COOH
OH
H2N
PYRUVATE
O2
HSO3
O2
[2h]
Zaoyan et al. (1992) reported on the results of a dye waste-water treatment system consisting of an
anaerobic rotating biological contactor (RBC) combined with an activated sludge process. This
system was used to treat the waste water at a textile finishing mill producing polyester fibre cotton
and cotton. The waste water consisted primarily of dyes (reactive, reductive, disperse, basic and
naphthol), auxiliaries, size (usually PVA), detergents, acids, alkalis and salts.
The results showed that the anaerobic RBC was efficient in removing the colour from the effluent
and also in degrading some complex organic matter (probably size and detergents). The aerobic
activated sludge unit was responsible for removing the remaining organic matter from the effluent.
The authors did not specifically measure the degradation of dye metabolites which originated in the
anaerobic treatment stage and, therefore, it cannot be concluded that all the dyes treated were
2-21

completely degraded. An added advantage of this system, however, was that the waste activated
sludge was recycled into the anaerobic phase, providing substrate for the anaerobic microorganisms
and a means of sludge disposal.
Harmer and Bishop (1992) investigated the decolourisation and degradation of an azo dye, Acid
Orange 7 (AO7), using laboratory-scale rotating drum biofilm reactors. The process was operated
under aerobic bulk-liquid conditions, as it was proposed that the biofilm would provide both
anaerobic and aerobic zones that would allow a two-phase mineralisation of AO7. The biomass was
originally obtained from an activated sludge plant and, although an acclimation period was observed,
it was found that unacclimated biomass possessed the ability to decolourise the azo dye. No
degradation of AO7 occurred unless supplemental labile carbon was present in the synthetic waste
water.
The results of these laboratory trials showed that decolourisation of AO7 occurred in anaerobic zones
of the biofilm, producing 1-amino-2-naphthol and sulphanilic acid. No detectable levels of
1-amino-2-naphthol were found in any grab samples taken after decolourisation was complete,
indicating that this compound was readily degraded in the system. Sulphanilic acid was present
subsequent to decolourisation of AO7 but was later transformed in the bulk phase aerobic conditions
of the treatment system. These results indicate that fixed film reactors operating with a bulk aerobic
phase may be capable of both decolourising and mineralising azo dyes, in a single stage.
Loyd et al. (1992) investigated two phase anaerobic-aerobic treatment for a reactive dyeing waste
water, Navy 106. Anaerobic pre-treatment was conducted in 2 M continuously stirred sequencing
batch reactors, with a residence time of 12 h. The effluent from this process was subsequently
subjected to aerobic treatment (activated sludge) in 4 M sequencing batch reactors over a period of
24 h. The results showed that the anaerobic treatment stage provided significant decolourisation of
the waste water with little accompanying biodegradation, and succeeded in enhancing the extent and
rate of subsequent aerobic biodegradation. It was reported that most of the total organic carbon
removal occurred in the aerobic stage.
It can be concluded from the papers reviewed in Section 2.5 that a multi-phase biological process
consisting of anaerobic reduction and subsequent aerobic mineralisation of the dye metabolites, is a
promising form of treatment for dye-containing textile effluent.
2.6 COMBINED CHEMICAL-BIOLOGICAL PROCESSES FOR THETREATMENT OF TEXTILE EFFLUENT
This section of the literature review investigates the combination of chemical pre-treatment
techniques with conventional biological treatment systems, to optimise colour and total organic
carbon (TOC) removal from textile effluents.
2.6.1 Chemical Reduction and Oxidation Combined with Aerobic Biodegradation
McCurdy et al. (1991) presented the results of a research project which aimed to develop a chemical
pretreatment technique to remove the colour of a textile mill waste water effluent containing reactive
2-22

dyes. This effluent was then biologically treated (aerobically) to achieve the required TOC removal
and, therefore, the effect of chemical pretreatment on the biological process was an important aspect
of this project.
A reductive mechanism of chemical pretreatment was chosen with the principal aim of removing
colour from the effluent. The reducing agents tested were sodium hydrosulphite, thiourea dioxide and
sodium borohydride. The textile effluent chosen for this project contained three reactive azo dyes,
Remazol Black, Remazol Red and Remazol Yellow (no classification numbers were given in the
paper).
The preliminary results showed that all three reducing agents tested were successful in removing
11 % of the colour when treating 17 % of the textile waste water. Sodium hydrosulphite was chosen
for future work and the results indicated that 62 % colour removal could be achieved when treating
100 % of the effluent. The fact that 100 % colour removal was not achieved was attributed to a
residual recalcitrant component associated with the textile waste water. It should be noted that this
recalcitrant component was probably the aromatic amine degradation products resulting from
reduction of the azo bonds and, as these compounds are coloured (greenish-yellow), they would have
contributed to the overall colour as measured by ADMI units.
This pretreated effluent was fed into aerobic sequencing batch reactors which comprised the
biological treatment phase. The feed consisted of 75 % pretreated textile effluent and 25 % municipal
waste water. It was found that reductive pretreatment of the textile effluent resulted in a biologically
inhibitory environment which could have been due to unreacted reducing agent in the effluent, the
creation of a reduced environment, and/or the presence of reduction by-products such as the
aforementioned aromatic amines. For this reason it was decided to extend the pretreatment regime to
include an oxidation step subsequent to reduction. The role of oxidation after reduction was to create
an environment more conducive to biological treatment, oxidise unreacted hydrosulphite, and
quinones.
Hydrogen peroxide was added after reduction with sodium hydrosulphite and was found to result in
an oxidised environment more conducive to aerobic biological treatment. No additional benefits were
gained by the oxidative pretreatment step as it did not contribute to the removal of colour from the
effluent. A purely oxidative pretreatment step was also attempted using hydrogen peroxide alone but
it was found that this removed little colour (less than 5 %) and did not enhance the biological
degradation of the textile waste water.
2.6.2 Pretreatment of Textile Effluent with Ozone and Fentons Reagent Followed byAerobic Biological Treatment
Powell et al. (1992) and Michelsen et al. (1992) reported on the use of oxidising agents to pretreat
textile effluents containing reactive dyes and the subsequent treatment of this effluent in a
conventional aerobic biological treatment system. The effluents chosen for the tests were exhausted
dyebaths containing reactive (primarily azo) dyes. As the dyes to be treated were known to consist of
large numbers of conjugated or aromatic bonds, the oxidants were chosen on the criterion that they
2-23

were to react with unsaturated systems. The oxidants chosen were ozone, which has been extensively
used as a disinfectant for potable water systems and has recently grown in popularity for the
treatment of industrial wastes, and Fentons reagent, which consists of hydrogen peroxide and ferrous
salts. The biological treatment phase was simulated using aerated sequencing batch reactors with 2 d
residence times. Municipal waste water was utilised to supplement the pretreated effluent to provide
the necessary nutrients for the microorganisms.
The results of the oxidative pretreatment stage showed that good colour removal could be achieved
with ozone or Fentons reagent when treating waste streams containing reactive dyes with azo
chromophores. However, colour removal achieved with Fentons reagent and phthalocyanine reactive
dyes was shown to be reversible when the pH of the treated solution was increased, indicating that
the chromophores of these dyes were not destroyed in the oxidative process.
Ozone appeared to selectively oxidise the dyes and little DOC removal was achieved, whereas
Fentons reagent did not seem to be selective for coloured organic matter. The level of colour removal
achieved with Fentons reagent was therefore dependant on the amount of non-coloured organic
matter in the waste stream and it was concluded that ozone would be preferred over fentons reagent
for pretreatment of waste waters with a high organic load.
Pretreatment of the waste water with ozone or Fentons reagent did not seem to significantly enhance
or inhibit subsequent biological degradation of the DOC in the waste water streams. Waste water
pretreated with Fentons reagent appeared to show a lower rate of DOC removal than that pretreated
with ozone, however, this was probably due to the fact that Fentons reagent removed a high
percentage of the non-coloured labile organic matter, resulting in less DOC being readily available
to the waste-water microorganisms.
2.7 CONCLUSIONS
The following conclusions have been drawn from the literature presented in Chapter Two :
a) Bacterial and fungal cells may be used as low cost adsorbents for the removal of dyes from
solution. Specially selected fungal cells such as Myrothecium verrucaria have a far greater
capacity for adsorption of water soluble dyes in comparison to activated sludge.
b) With respect to the aerobic degradation of dyes :
{ Azo dyes are not significantly biodegraded in the activated sludge process, although
some colour removal is achieved by adsorption of dyes to the biomass in the system.
{ Although azo dyes are not biodegraded in activated sludge systems, these dyes are
generally not toxic to the waste-water microorganisms.
{ In aerobic aquatic environments simple triphenylmethane dyes (Basic Violet 1 and 3)
are readily degraded but simple azo dyes (Acid Orange 7) are not transformed.
{ Aerobic microorganisms have been adapted to degrade simple azo dyes such as
Orange II. These microorganisms were identified as strains of Pseudomonas and it was
2-24

proposed that the ability to degrade Orange II was coded for by plasmid-borne genes.
The enzymes responsible for azo reduction are inducible, with the azo dye being the
inducer compound.
{ The white-rot fungus Phanerochaete chrysosporium is able to decolourise and
mineralise azo dyes through use of the lignin degrading enzyme system.
{ Algae have been found to utilise azo dyes as sole sources of carbon and nitrogen.
c) With respect to the anaerobic degradation of dyes :
{ Decolourisation of azo dyes under anaerobic conditions is a relatively simple and
non-specific process that involves reduction of the azo bond and subsequent
destruction of the chromophore.
{ The microbial genera that have been found to degrade dyes in single species cultures
under anaerobic conditions are: Bacillus, Pseudomonas, Aeromonas and unidentified
purple non-sulphur bacteria.
{ Azo dyes are readily degraded in anaerobic digestion systems, although the fate of the
resulting metabolites is uncertain.
d)
{ Aromatic amine metabolites are degraded in aerobic activated sludge systems but
usually accumulate in the anaerobic treatment systems that caused decolourisation of
the dyes.
{ Unsulphonated structural components of dye metabolites, such as naphthalene,
naphthol, aniline and nitrogen heterocyclic compounds, have been reported to be
degraded in anaerobic or anoxic systems.
{ Sulphonation of these compounds increases their recalcitrance in both aerobic and
anaerobic systems, although, the ability of some aerobic microorganisms to
oxygenolytically cleave the C-SO3 bond and liberate sulphite allows the mineralisation
of these sulphonated aromatic compounds under aerobic conditions.
e) With respect to the combination of anaerobic and aerobic systems for degradation of dyes :
{ Anaerobic pretreatment (for decolourisation of dyes) followed by aerobic treatment to
allow mineralisation of dye metabolites is a promising system for textile effluent
treatment.
{ An anaerobic RBC in combination with an aerobic activated sluge unit had the added
advantage of low sludge disposal as the waste activated sludge was utilised as substrate
in the anaerobic reactor.
2-25

{ Fixed film reactors operated under aerobic bulk liquid conditions can decolourise azo
dyes in anaerobic microzones with the metabolites being subsequently degraded in the
aerobic areas of the system.
f) With respect to the combination of chemical and biological processes for the treatment of
dye-containing effluent :
{ Decolourisation of a reactive dye textile effluent through the use of reducing agents
was found to render the decolourised effluent inhibitory to subsequent aerobic
biological treatment. However, oxidation with hydrogen peroxide after reduction
resulted in an environment more conducive to aerobic biological degradation.
{ Pretreatment of dye-containing effluent with oxidising agents (ozone and Fentons
reagent) achieved good colour removal and neither inhibited nor enhanced subsequent
biological DOC removal in an activated sludge system.
2-26

CHAPTER THREE
PROPOSED MECHANISMS OF BIOLOGICAL AZO REDUCTION
IN ANAEROBIC / ANOXIC SYSTEMS
Chapter Three takes the form of a discursive literature review dealing with the proposed mechanisms
of biological azo reduction in anaerobic/anoxic systems. The purpose of this section was to collate the
various mechanisms of anaerobic azo reduction that have been proposed in the literature, and to
determine a general mechanism that could be applicable to decolourisation of Procion Red HE-7B in
the standard assay system, which is reported in Chapter Four.
3.1 INTRODUCTION
Azo dyes, such as Procion Red HE-7B, can be decolourised in an anaerobic system by reduction of
the azo bonds and subsequent destruction of the dye chromophore/s. This is a four electron process
which proceeds through two stages. The first gives rise to an unstable, colourless compound
(Eqn 3.1) which may revert to the original coloured form under oxidising conditions, or be further
(Eqn 3.2).
(where R1 and R2 are various substituted phenyl and naphthol residues)
(3.2)R1 −NH−NH−R2 +2e− +2H+ dR1 −NH2 +R2 −NH2
(3.1)R1 −N=N−R2 +2e− +2H+ dR1 −NH−NH−R2
Proposed theories of microbially mediated azo reduction differ according to the site, the enzymatic
nature and the rate-controlling factors. However, all the proposed theories indicate that the basic
mechanism involves reduction of the azo bond, which is concurrent with re-oxidation of
enzymatically-generated flavin nucleotides. The dye, acting as an oxidising agent for the reduced
flavin decolourised.
This chapter begins with a section (3.2) on the role of enzymes in microbial azo reduction which aims
to define (from the literature) the role of enzymes in the non-enzymatic azo reduction process.
Section 3.3 explains the proposed role of soluble flavins in microbial azo reduction and Section 3.4
explains the proposed theories for intracellular and extracellular azo reduction, identifying the
probable rate-limiting factors for each site of azo reduction. Finally, Section 3.5 examines the rate
limiting effects of competitive oxidising agents in azo reduction and Section 3.6 the role of dye
structure in microbial azo reduction.
3-1
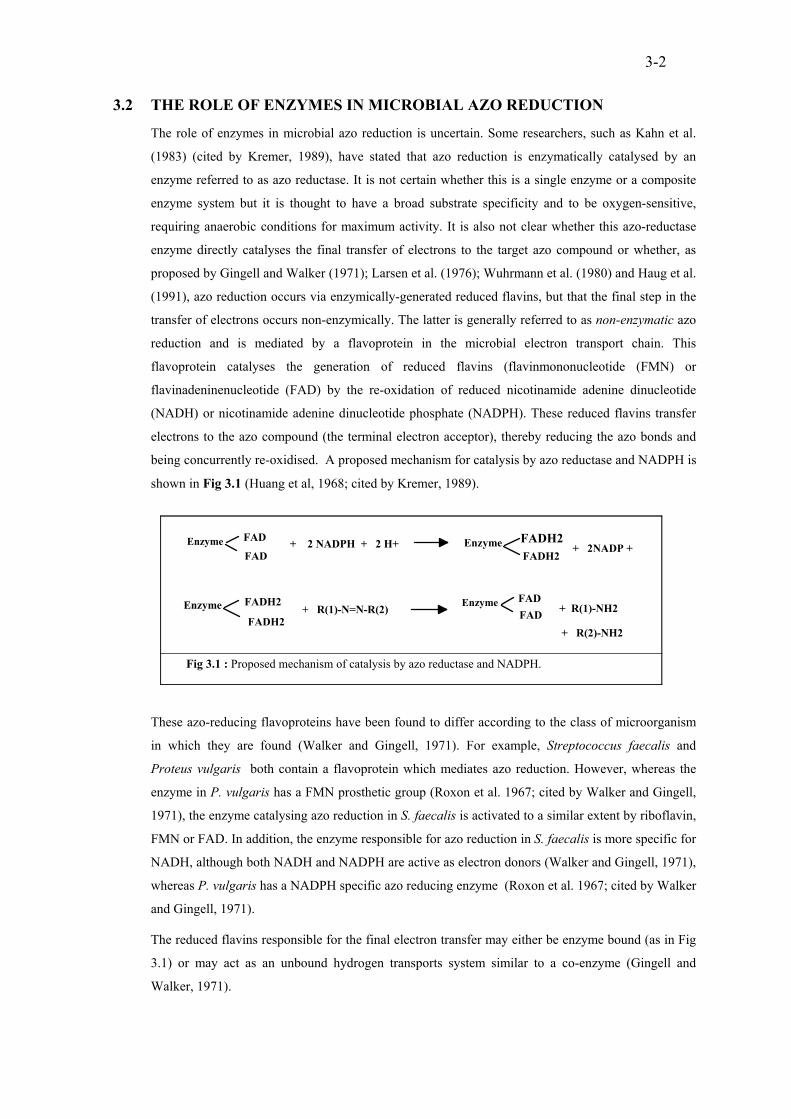
3.2 THE ROLE OF ENZYMES IN MICROBIAL AZO REDUCTION
The role of enzymes in microbial azo reduction is uncertain. Some researchers, such as Kahn et al.
(1983) (cited by Kremer, 1989), have stated that azo reduction is enzymatically catalysed by an
enzyme referred to as azo reductase. It is not certain whether this is a single enzyme or a composite
enzyme system but it is thought to have a broad substrate specificity and to be oxygen-sensitive,
requiring anaerobic conditions for maximum activity. It is also not clear whether this azo-reductase
enzyme directly catalyses the final transfer of electrons to the target azo compound or whether, as
proposed by Gingell and Walker (1971); Larsen et al. (1976); Wuhrmann et al. (1980) and Haug et al.
(1991), azo reduction occurs via enzymically-generated reduced flavins, but that the final step in the
transfer of electrons occurs non-enzymically. The latter is generally referred to as non-enzymatic azo
reduction and is mediated by a flavoprotein in the microbial electron transport chain. This
flavoprotein catalyses the generation of reduced flavins (flavinmononucleotide (FMN) or
flavinadeninenucleotide (FAD) by the re-oxidation of reduced nicotinamide adenine dinucleotide
(NADH) or nicotinamide adenine dinucleotide phosphate (NADPH). These reduced flavins transfer
electrons to the azo compound (the terminal electron acceptor), thereby reducing the azo bonds and
being concurrently re-oxidised. A proposed mechanism for catalysis by azo reductase and NADPH is
shown in Fig 3.1 (Huang et al, 1968; cited by Kremer, 1989).
Fig 3.1 : Proposed mechanism of catalysis by azo reductase and NADPH.
Enzyme FAD
FAD+ 2 NADPH + 2 H+ Enzyme
FADH2+ 2NADP +
Enzyme FADH2
FADH2+ R(1)-N=N-R(2) Enzyme FAD
FAD + R(1)-NH2
+ R(2)-NH2
FADH2
These azo-reducing flavoproteins have been found to differ according to the class of microorganism
in which they are found (Walker and Gingell, 1971). For example, Streptococcus faecalis and
Proteus vulgaris both contain a flavoprotein which mediates azo reduction. However, whereas the
enzyme in P. vulgaris has a FMN prosthetic group (Roxon et al. 1967; cited by Walker and Gingell,
1971), the enzyme catalysing azo reduction in S. faecalis is activated to a similar extent by riboflavin,
FMN or FAD. In addition, the enzyme responsible for azo reduction in S. faecalis is more specific for
NADH, although both NADH and NADPH are active as electron donors (Walker and Gingell, 1971),
whereas P. vulgaris has a NADPH specific azo reducing enzyme (Roxon et al. 1967; cited by Walker
and Gingell, 1971).
The reduced flavins responsible for the final electron transfer may either be enzyme bound (as in Fig
3.1) or may act as an unbound hydrogen transports system similar to a co-enzyme (Gingell and
Walker, 1971).
3-2

3.3 THE ROLE OF SOLUBLE FLAVINS IN MICROBIAL AZO REDUCTION
Gingell and Walker (1971) showed that the addition of soluble flavin (FMN) to cell-free preparations
of S. faecalis, enhanced the rate of reduction of the azo dye Red-2G. The anaerobic assay consisted
of the cell-free NADH-generating system to which FMN and Red-2G were added, either
simultaneously or sequentially. When FMN and Red-2G were added simultaneously FMN was
partially reduced, reaching a plateau at which point all the dye was reduced. Only when all the dye
was reduced did flavin reduction continue to its limiting value. The rate of Red 2-G decolourisation
was dependent on the redox potential of the system, as given by the ratio of reduced to oxidised FMN
in the plateau region. At the lower level (represented by the limiting value for enzymatic reduction of
flavin) reduction of Red-2G was rapid, with the rate falling as the redox potential of the system rose.
These results indicate that the redox potential of an anaerobic system could be a controlling factor in
microbial azo reduction.
When Red-2G was added to an assay system containing enzymatically-reduced FMN, the dye was
rapidly decolourised with simultaneous re-oxidation of the flavin, which suggested that the rate of azo
reduction was directly related to the rate of generation of reduced FMN. This was proposed to be a
rate-limiting factor in bacterial azo reduction, and was supported by other researchers such as Roxon
et al. (1967) who reported that the presence of flavin in the medium was essential for reduction of
tartrazine (an azo compound) by whole cell cultures of Proteus vulgaris. Chung et al. (1978) also
noted a marked enhancement of azo reduction upon addition of flavin nucleotide and other electron
carriers, and Wuhrmann et al. (1980) concluded that in the absence of oxygen, an azo compound
would act as a sole electron acceptor and, therefore, the rate of azo reduction would be governed
exclusively by the rate of fomation of the electron donor i.e. reduced flavin nucleotides. As the rate of
formation of reduced flavins is directly related to the metabolic state of a microbial population, it is
not surprising that azo reduction rates are sensitive to the amount of available respiration substrate in
an anaerobic system (Haug et al., 1991; Harmer and Bishop, 1992), since catabolism of these
substrates is ultimately responsible for the production of reduced flavins. Therefore, the rate of azo
reduction will also be controlled by the availability of supplemental labile carbon in the system.
It was concluded by Gingell and Walker (1971) that soluble flavins can act as electron shuttles,
under anaerobic conditions, to transfer electrons between NADH-linked flavoproteins that are
normally involved in cellular electron transport and azo compounds which are acting as artificial
electron acceptors.
3.4 THE SITE OF MICROBIAL AZO REDUCTION
Although Gingell and Walker (1971) had proposed that azo reduction was mediated by an electron
shuttle, these results were obtained using cell-free extracts and did not establish whether this electron
shuttle was capable of mediating extracellular azo reduction, or whether azo reduction was an
intracellular process. Subsequently, theories have been proposed that support both these mechanisms.
3-3

3.4.1 Extracellular Azo Reduction
Dubin and Wright (1975) adopted the theory of Gingell and Walker (1971) and proposed an
extracellular, non-enzymatic process in which soluble flavin acted as an electron shuttle between the
extracellular dye and an intracellular reducing enzyme, the rate being controlled by generation of the
reduced flavin. These researchers found a zero-order dependence of reduction rate on dye
concentration, which was consistent with that reported by Gingell and Walker (1971), and proposed
that the principal rate-controlling step involved a redox equilibrium between the azo dye and the
reducing agent (FMN or FAD) i.e. that the redox potential of the dye to be reduced indirectly controls
the rate of azo reduction.
The proposed mechanism of enzymic generation, and subsequent re-oxidation (by an azo
compound), of a low molecular weight reducing agent (electron shuttle) is given is Eqn 3.3 and 3.4.
(Where BH2 / B and EH2 / E are the redox couples for the low molecular weight electroncarrier and enzyme respectively)
(3.4)
BH2 +(R1 −N=N−R2)
k2→ ← k−2 B+(R1 −NH2)+(R2 −NH2)
(3.3)B+EH2 → k1 BH2 +E
Eqn 3.3 and 3.4 form a redox cycle with reducing power provided by bacterial metabolism. No net
reduction of dye occurs until the concentration of BH2 is such that the reduction potential of the
BH2/B couple approaches that of the dye, as shown in Eqn 3.5.
(3.5)E = E0 −0,030log (BH2)
(B) = Em(dye)
Subsequently, colour loss depends on the rate of formation of BH2, which in turn depends on the
concentration of B. If BH2/B is constant, the concentration of B is controlled by the ratio BH2/B
which, according to Eqn 3.5, is determined by the dye redox potential. Thus the electrochemical
properties of the dye may indirectly control the reduction rate by determining the concentration of B
in the system, although the dye molecule is not itself involved in the rate limiting step. The rate of
colour loss would then be zero-order with respect to dye concentration (until extremely low
concentrations are reached) and dependent on dye redox potential.
3.4.2 Intracellular Azo Reduction
The dependence of azo dye reduction on the redox potential of the dyes (Dubin and Wright,1975)
was tested by Yatome et al. (1991). The results showed that the rate of azo reduction was not
controlled by the specific dye reduction potentials but by the degree of sulphonation of the dyes. This
lead the researchers to conclude that azo reduction was limited by the rate of permeation of the dyes
into the microbial cells and that azo reduction must be intracellular. These conclusions are supported
by numerous authors reporting on the microbial reduction of azo dyes in anaerobic systems.
3-4

Research by Wuhrmann et al. (1980) revealed that some dyes, which were not decolourised by whole
cells could be decolourised by cell extracts, which lead them to conclude that cell permeability
(diffusion) was a pertinant governing factor in azo reduction rates. Additional evidence of cell
permeability as a primary rate-limiting factor in microbial azo reduction was found in research by
Meschner and Wuhrmann (1982), who managed to substantially increase the reduction rates of azo
compounds by permeabilising bacterial cells prior to azo reduction.
Larsen et al. (1976) found that increasing sulphonation of azo compounds, which should increase the
rate of degradation due to an increased withdrawal of electrons, instead has an inverse effect on their
degradation rate. They attributed this to the reduced ability of the compounds to penetrate the
microbial cell boundaries. Continuing in this line of research, Meyer (1981) reported that
sulphonated azo compounds were slower to degrade than their carboxylated analogues, when
incubated with a whole cell microbial culture. However, when the constraint of cell permeability was
removed, the sulphonated compounds were found to be degraded on average 60% faster than the
carboxylated analogues, proving that the ability of the dye compound to permeate the cell wall
directly effected the rate of degradation.
In contrast to the zero-order kinetics of azo reduction reported by Dubin and Wright (1975) for
extracellular azo reduction, and by Gingell and Walker (1971) for a cell-free system, Larsen et al.
(1976), Wuhrmann et al. (1980), Meschner and Wuhrmann (1982) and Kremer (1989) observed first
order kinetics of azo
3.5 THE EFFECT OF COMPETITIVE ELECTRON ACCEPTORS ONANAEROBIC AZO REDUCTION
As azo reduction is proposed to occur through reduction of the dye as a terminal electron acceptor in
the microbial electron transport chain, the presence of competitive electron accepting agents in the
system would be expected to effect the rate of azo reduction. The sensitivity of the azo reduction
process to the presence of oxygen can then be explained as a competition of the oxidants (azo dye and
oxygen) for the reduced electron carriers in the respiration chain, with respiration of oxygen being the
favoured reaction. The rate-limiting effect of nitrite (as a competitive electron acceptor) was also
reported by Wuhrmann et al. (1980), who noted that decolourisation of an azo dye in a
nitrate-containing system would not commence until denitrification was complete. That is, the nitrite
appeared to be reduced preferentially to the azo dye, as a more favourable electron acceptor.
3.6 STRUCTURAL EFFECTS REGARDING PLACEMENT OF SUBSTITUENTGROUPS ON THE AZO DYE
Structural effects regarding placement of substituent groups on an azo dye have been noted by Meyer
(1981). As a general rule, the closer the substituent group to the azo bond, the slower the rate of
reduction. This was also noted by Larsen et al. (1976) who stated that the prominent factor
determining the reduction rate of azo compounds was the electron density in the region of the azo
group, while the additional factor of stabilisation by hydrogen bonding must be considered. It
3-5

would therefore be expected that an increase in the number of sulphonate groups (electron
withdrawing groups) on a dye molecule, would consequently increase the reduction rate. However,
this would however only hold true for permeabilised cells or cell free extracts, as a high degree of
sulphonation reduces the ability of the dye compounds to penetrate the cell boundary, making cell
permeability the rate-limiting factor for azo reduction.
3.7 CONCLUSIONS
a) The role of the flavoprotein enzyme in anaerobic microbial azo reduction is the generation of
reduced flavins.
b) The reduced flavins may be enzyme bound, or unbound hydrogen carriers.
c) The reduced flavins transfer the electrons from the NADH-dependent flavoproteins to the azo
compound, thus reducing the azo bond and becoming re-oxidised.
d) The rate of generation of reduced flavin is the principal rate-limiting step in extracellular azo
reduction or azo reduction with cell free extracts, and is indirectly controlled by the redox
potential of the compound to be reduced.
e) The rate of generation of reduced flavin is directly dependant on the metabolic state of the
microorganisms and, therefore, since the presence of supplemental carbon is essential to
maintain the metabolic activity of the microorganisms, this is a rate-limiting factor in azo
reduction.
f) The site of microbial azo reduction has been proposed to be either intracellular or
extracellular.
g) The rate-limiting factor for intracellular azo reduction is the rate of permeation of the azo
compounds into the microbial cells.
h) Competitive electron accepting agents, such as oxygen or nitrite, affect the rate of azo
reduction by competing for the source of reduction equivalents.
i) The structure of the azo compounds affects the rate of reduction, although this is often
3-6

CHAPTER FOUR
DECOLOURISATION OF PROCION RED HE-7B IN AN ANAEROBIC SYSTEM
4.1 INTRODUCTIONProcion Red HE-7B can be decolourised in an anaerobic system by reduction of the azo bonds and
subsequent destruction of the dye chromophore/s. This azo reduction reaction can be caused by both
chemical reducing agents and anaerobic microorganisms. Although chemical azo reduction is well
documented, no single theory has been developed which adequately explains all the factors involved
in microbial azo reduction. For this reason, the primary focus of the experimental work presented in
this chapter was the elucidation and investigation of the mechanisms controlling microbial azo
reduction in an anaerobic system.
Section 4.1 introduces the consecutive stages in the experimental investigation and is divided
accordingly :
Section 4.1.1 introduces the concept of enriching microorganisms to develop or enhance the azo
reduction reaction and Section 4.1.2 summarises the theories of anaerobic azo reduction which
influenced the experimental approach for the investigation into the decolourisation of Procion Red
HE-7B. As decolourisation in a biological anaerobic system can also be attributed to abiotic
mechanisms, such as chemical reduction or physical adsorption of the dyes to the microbial cells,
these mechanisms were investigated with respect to decolourisation of Procion Red HE-7B and are
introduced in Section 4.1.3. Following on from this, the fate and effect of Procion Red HE-7B in a
biological anaerobic system are discussed. Section 4.1.4 contains a summary of the possible fates of
degradation products resulting from reduction of azo dyes in biological anaerobic treatment systems
and Section 4.1.5 introduces the possibility of azo dyes (or their degradation products) being
inhibitory to the anaerobic microbial population.
4.1.1 The Effect of Prior Exposure of Anaerobic Biomass to Procion Red HE-7B on theEfficiency of Azo ReductionAdaptation of a microbial community to degrade a previously recalcitrant compound, through prior
exposure of the microorganisms to this compound, is known as enrichment or acclimation. The
literature has shown that anaerobic decolourisation of textile dyes can occur with unacclimated
microorganisms, although prior exposure of microorganisms to particular azo dyes has been shown to
play a major role in enhancing degradation (Meyer, 1981). These adapted microorganisms may also
have increased tolerance to previously inhibitory concentrations of dyes (Ogawa et al., 1988, 1989). It
is possible that exposure of biomass to dyes may even facilitate the development of microorganisms
able to mineralise dye metabolites and, in fact, recommendations for future research, by Kremer
(1989) included specific enrichment programmes to improve the dye mineralisation ability of

anaerobic microorganisms.
Although preliminary experimental results indicated that decolourisation of Procion Red HE-7B could
occur with unacclimated biomass, enrichments were performed with the aim of :
a) improving the rate of decolourisation;
b) improving degradation and, possibly, mineralising the degradation products resulting from the
decolourisation of Procion Red HE-7B; and
c) improving microbial tolerance to inhibitory concentrations of dye and/or degradation products.
The effectiveness of this acclimation period was tested with respect to the above objectives. The
experimental method for comparison of decolourisation rates for acclimated and unacclimated
biomass is presented with details of the enrichment programme, in Section 4.2.1. However, the
experiments performed to test whether acclimation had improved the ability of the biomass to (a)
mineralise Procion Red HE-7B degradation products; and (b) tolerate inhibitory concentrations of
Procion Red HE-7B, are dealt with in Sections 4.2.4 and 4.2.5, respectively. The results are also
presented in the respective sections. This format was chosen to avoid repetition of experimental
methods and results. Discussion of all results is included in the general discussion (Section 4.4).
4.1.2 Biological Decolourisation by Anaerobic MicroorganismsAs indicated in Section 4.1, the process responsible for biological decolourisation of azo dyes under
anaerobic conditions is subject to debate. Theories proposed for the mechanism/s of azo reduction can
be broadly categorised into two groups :
a) intracellular azo reduction; and
b) extracellular azo reduction.
In both cases the mechanism proposed for azo reduction is similar, in that reduction of the azo bond is
concurrent with re-oxidation of enzymatically-generated reduced flavin nucleotides. The dye, acting
as an oxidising agent for the reduced flavin nucleotides of the electron transport chain, is reduced and,
consequently, decolourised, as is shown in Fig 4.1. The disparity arises as to whether azo reduction
takes place within the microbial cell, or in the extracellular medium.
Rate-determining factors for azo reduction differ according to whether azo reduction is proposed to be
intra- or extra-cellular. Generally, intracellular azo reduction has been found to be first-order with
respect to dye concentration (Larcen et al., 1976; Meyer, 1981; Wuhrmann et al., 1981; Yatome et
al.,1991), with the principal rate-limiting factor of decolourisation being permeation of the azo dyes
through the cell boundaries (Meschner and Wuhrmann, 1982). Extracellular decolourisation has been
found to be zero-order with respect to dye concentration (Dubin and Wright, 1975). Electron transfer
is thought to be catalysed by an extracellular reducing agent which acts as an electron shuttle between
the dye and cellular reducing enzymes. The rate-limiting factor for non-enzymatic azo reduction is
proposed to involve a redox equilibrium between dye and reducing agent (FAD or FMN), which
results in the rate of reduction of an azo dye being governed by its redox potential.
4-24 2

Fig 4.1 : Schematic respresentation of an electron transport chain with an azo dye as the terminalelectron acceptor.
Primary electron donor
Oxidised donor
Carrier I (ox)
Carrier I (red)
Carrier II (red)
Carrier II (ox)
Carrier III (ox)
Carrier III (red) Azo dye (ox.)
Azo dye (red.)
Both intracellular and extracellular decolourisation rely on the production of enzymatically-generated
reduced flavin nucleotides. These reduced flavins are formed in catabolic processes and therefore the
availability of respiration substrates should also be considered as a rate-controlling step in azo
reduction (Haug et al.,1991).
The experimental approach adopted in this chapter aimed to elucidate the mechanism of biological
decolourisation of Procion Red HE-7B, so that the suitability of this process for large scale
decolourisation of textile dyes could be assessed. Thus, decolourisation of the azo dye was
investigated in a standardised laboratory system with the aim of identifying the order of
decolourisation (with respect to dye concentration) and, from these results, identifying possible
rate-limiting factors for further investigation. The aims of the latter experiments were two-fold, that
is, to understand which rate-limiting factors should be taken into account when designing a
waste-water treatment plant and to aid in identifying the controlling mechanism/s for decolourisation
of Procion Red HE-7B. Experimental materials and methods are presented in Section 4.2.2 and
experimental results are presented in Section 4.3.2. Discussion of these results is included in the
general discussion (Section 4.4).
4.1.3 Abiotic DecolourisationAbiotic decolourisation can be attributed to physical removal of dye from solution, either by
adsorption to the biomas or flocculation/precipitation by a chemical agent, or to chemical reduction of
the dye.
Decolourisation by Adsorption
Research into the decolourising abilities of biological sludge has led to the conclusion that
considerable decolourisation of textile effluent can occur through adsorption of dyes to the biomass
(Pagga and Brown, 1986; Ganesh et al., 1992; Shaul et al., 1988) the extent of which is primarily
governed by the class of dye in the waste water. For example, reactive dye waste water discharged to
a treatment works contains primarily hydrolysed dye which is no longer able to react with the fabric.
These hydrolysed dyes are water soluble and, therefore, only a small percentage of the dye adsorbs to
the sludge. However, dyehouse waste water containing dyes which are predominantly hydrophobic
(for example, disperse dyes) will attain a high level of colour removal by adsorption of these dyes to
the biological sludge in the treatment system. As discussed in Chapter Two, decolourisation by
adsorption of dyes to the biomass is the primary and often, sole, mechanism of decolourisation
4-34 3

operating in an activated sludge plant.
Adsorption of dyes to biomass in a treatment system can be measured experimentally and adsorption
isotherms developed from the results. The experiments consist of the equilibration of sub-samples of
sludge at a constant temperature (isothermal) with a number of aliquots of solutions containing
different concentrations of the adsorbate (dye) of interest. The graphical plot of the amount adsorbed
by the sludge against the equilibrium solution concentration is termed the adsorption isotherm. If the
adsorbent is characterised by monolayer adsorption, these plots usually have a steep portion at
relatively low solution concentrations (i.e. when more adsorption sites are available than can be filled
by adsorbate) followed by a less steeply rising curve as the concentrations become higher (i.e. the
adsorbent becomes saturated) (Holford, 1974). The Langmuir and Freundlich equations are the most
widely used isotherm equations for description of such curves (Holford, 1974). The principal
function of an adsorption isotherm is that it allows the prediction of adsorption for values of solute
concentrations not used experimentally.
Langmuir equation : This equation expresses the relationship between the amount adsorbed, x, at an
equilibrium concentration, c, as is given in Eqn 4.1:
(4.1)x = kKc
1+Kc
x = amount of dye adsorbed per unit mass of sludge solids (mg/g)
c = equilibrium concentration of dye in solution, mg/M
k, K = empirical constants
A linear plot is given either by c/x against c , or x/c against x. From either of these graphs values of K
and k can be determined from the linear slope and intercept, respectively (Holford, 1974).
Freundlich equation : The Freundlich equation is given by the following relationship (Eqn 4.2) :
(4.2)x = acb
x = amount of dye adsorbed per unit mass of sludge solids (mg/g)
c = equilibrium concentration of dye in solution, mg/M
a, b = empirical constants
The logarithmic form of the Freundlich equation is employed to obtain a straight line relationship and
is given in Eqn 4.3 :
4-44 4

(4.3)log(x) = log(a) + (b) log(c)
This may be illustrated graphically by a plot of log (x) versus log (c). The slope of this line equals (b)
and the intercept equals log (a).
Two experiments were performed to determine the adsorption characteristics of Procion Red HE-7B.
The first measured adsorption of Procion Red HE-7B to biomass in the standard assay system
(Appendix C) and the second measured the extent of adsorption of Procion Red HE-7B (with
anaerobic biomass as the adsorbent) in a system for the prediction of adsorption isotherms (Shaul et
al., 1986). The experimental materials and methods for this work are presented in Section 4.2.3 and
the results in 4.3.3. These results are discussed in Section 4.4.
Decolourisation in the mineral salts medium
It is possible that ions in the mineral salts growth medium (Appendix C) could reduce the azo dye in
the low redox potential environment of an anaerobic digester, although this type of decolourisation
would often be reversible upon atmospheric exposure. In addition, physical removal of the dye from
solution by precipitation or flocculation could be responsible for abiotic colour loss. The extent of
colour removal that could be solely attributed to decolourisation in the mineral salts medium was
investigated under standard assay conditions. Experimentation is presented in Section 4.2.3 and the
results in Section 4.3.3.
4.1.4 Identification and Fate of Procion Red HE-7B Breakdown ProductsAnaerobic decolourisation of reactive azo dyes involves the reduction and consequent splitting of the
dye chromophore. This process eliminates the colour from the effluent but produces intermediary
compounds which may be broadly classified as sulphonated aromatic amines. Degradation products
(metabolites) resulting from the decolourisation of Procion Red HE-7B (Fig 4.2) are primarily
sulphonated aminonaphthalenes and aminonaphthols, nitroaromatics such as aniline and nitrogen
heterocyclic
4-54 5

Fig 4.2 : Decolourisation of Procion Red HE-7B to yield dye intermediates.
N
SO3Na
SO3Na
NH
N
N
NCl
NH OH
N
SO3NaNaO3S
N
SO3Na
SO3Na
SO3Na
SO3Na
NH2
NH OH
SO3Na
NH2
NaO3S
N
N
NCl
2HN
SO3Na
SO3Na
+ +
N NH
ClN
N
N
NH
SO3NaNaO3S
N
N
NCl
NaO3S
2HN
NHOH
SO3Na
NHNH
(+ 4e- + )4 H+
Sulphonated aromatics such as napthalenesulphonic acids (NSS) have been classified as persistent
xenobiotics (Quentin, 1978 cited by Luther and Soeder, 1991) and pass through waste-water treatment
plants without significant biodegradation (Zahn and Wellens, 1979 cited by Luther and Soeder, 1991).
Some classes of aromatic amines are also suspected carcinogens (Weisburger and Weisburger, 1966;
Chung, 1983). Therefore, although decolourisation is a primary step in the treatment of textile
dyehouse effluent, environmental protection requires the mineralisation of waste compounds and
conditions must be engineered that will permit microbial catabolism of the resulting dye metabolites.
Research into the biodegradability of aromatic amines (as degradation products of textile dyes) has
shown that aerobic conditions are more amenable to mineralisation, with little or no degradation of
these compounds occurring under the anaerobic conditions that give rise to decolourisation. The
Ecological and Toxicological Association of the Dyestuffs Manufacturing Industry (ETAD) reported
that little degradation of dye degradation products occured in the anaerobic systems tested, as
evidenced by a large build-up of these compounds in the systems. They concluded that aerobic
treatment was the more feasible option for mineralisation of dye degradation products (Brown and
Hamburger, 1987). Haug et al. (1991) also concluded that a two phase anaerobic-aerobic system was
neccessary for mineralisation of the sulphonated azo dye, Mordant Yellow 3.
However, anaerobic degradation of aromatic compounds (mono- and poly- cyclic) similar in structure
to the aromatic degradation products of textile dyes, has been reported by Evans (1977), Sleat and
Robinson (1984) and Berry et al. (1987). Guoqing et al. (1990), reported that latest results show that
aromatic compounds, as the products of the reductive splitting of bisazo dyes, are likely to undergo
further anaerobic degradation. Such reports have motivated a renewed examination of the feasibility
of mineralisation of azo dyes in anaerobic systems.
Thus, a specifically enriched anaerobic association may be able to mineralise dye compounds in an
anaerobic treatment system. The advantages of such a system compared to a two phase
4-64 6

anaerobic-aerobic system would include energy production in the form of biogas and low sludge
production. However, other considerations such as the residence time required for dye mineralisation
to occur under anaerobic conditions may be impractical for a full size plant, neccessitating the
implementation of a two-phase anaerobic-aerobic system.
The first stage of experimentation with Procion Red HE-7B aimed to prove that azo reduction was
responsible for the decolourisation observed in the standard assay system. This was achieved by
performing scans of absorbance versus wavelength (190 to 600 nm) using centrate from serum bottles
in which decolourisation was occurring. The second phase of experimentation was to determine
whether mineralisation of Procion Red HE-7B would occur over an extended incubation period of 52
d. This experiment also involved the use of acclimated and unacclimated biomass to determine
whether acclimation of the biomass resulted in the ability to mineralise Procion Red HE-7B
degradation products. The mineralisation experiment was monitored by measurement of total gas
production. The volumes of gas produced in bottles containing Procion Red HE-7B were compared
with those measured for the controls (containing no dye). The details of experimental materials and
methods are presented in Section 4.2.4 and the results are presented in Section 4.3.4.
4.1.5 Inhibitory Effects of Procion Red HE-7B on an Anaerobic Microbial PopulationTextile dyes are known to exert inhibitory effects on the activity and growth of microorganisms. The
extent of inhibition is governed by parameters such as dye type and concentration and the class of
microorganism. In general, high concentrations of dyes are usually required for inhibition to occur,
although with some cationic species (e.g. triphenylmethane dyes) inhibition is noticeable at low
concentrations (Meyer, 1981). Dye structure has been shown to affect the level of inhibition. Azo
dyes such as Tropeolin O exhibit a mean microbial survival rate of 92 % at 5 mg/M, while
triphenylmethane dyes such as Basic Violet 3 exhibit only a 20 % survival rate at identical
concentrations (Michaels and Lewis, 1985). With respect to the class of microorganisms, gram
negative species generally exhibit a greater resistance to dyes than gram positive species (Fung and
Miller, 1973).
The mechanism of growth inhibition caused by dye toxicity was investigated by Ogawa et al. (1988,
1989). Inhibition of Bacillus subtilis by basic dyes was related to decreasing ratios of RNA : DNA,
which concurred with increasing dye concentration. This indicated that the dyes acted preferentially to
limit protein synthesis, rather than inhibit cell division, which resulted in a variation in cell shape
when bacteria were grown in the presence of basic dyes. Cell division inhibition was found to be
caused by stabilization of the DNA double helix which, in turn, inhibited enzymatic activities and
prevented DNA replication. Stabilization was caused by intercalation of the dyes between the base
pairs of DNA. It was reported by these authors that acclimation of bacteria to growth in the presence
of inhibitory dyes reduced the toxic effects of the dyes and partially restored the physiological activity
of the cells.
Textile effluent entering a waste-water treatment works is usually characterised by high volumes of
dilute waste water and should, therefore, not pose a toxicity problem in the biological treatment
4-74 7

processes. However, concentration of dye-containing effluent by flocculation, membrane filtration or
segregation of concentrated exhausted dyebaths, prior to treatment in a specialised biological
treatment system would, accordingly, increase the inhibitory nature of the effluent. It was, therefore,
neccessary to determine the toxicity of Procion Red HE-7B to both acclimated and unacclimated
anaerobic biomass by means of an anaerobic toxicity assay.
Anaerobic toxicity can be defined as the adverse effect of a substance on the predominant
methanogens in an anaerobic population of microorganisms (Jerris and Mcarty, 1965; cited by Owen
et al.,1979). This can be determined through batch techniques which make use of serum bottles and
syringe gas measurements, as described in papers by Owen et al. (1979) and Shelton and Tiedjie
(1984). A second batch technique, known as the specific methanogenic activity test (SMA), makes use
of a modified Warburg respirometer to measure gas volume (Chernicharo and Campos, 1991; Campos
and Chernicharo, 1991). Both these techniques have a similar approach. The compound to be tested
has assay concentrations selected to provide a range from non-inhibitory to severely toxic. In general,
five to ten assay concentrations and three controls are selected. The assay bottles contain an anaerobic
inoculum, mineral salts medium, inhibitory substance (at the concentrations chosen) and a suitable
source of substrate. The control bottles lack the inhibitory compound to be tested. The bottles are
incubated at a required temperature and gas production is measured once or twice daily for the first
seven days and periodically thereafter.
Total gas production data, or methane production data, are employed for determining the relative rates
of metabolism of the feed source among samples. The maximum rate of gas production is computed
for each sample over the same time period and the data are normalized by computing ratios between
respective rates for samples and the average of the controls. This ratio is designated the maximum rate
ratio (MRR). Since measurement of gas production is relatively accurate, a MRR of less than 0,95
suggests possible inhibition and one less than 0,9 suggests significant inhibition (Owen et al., 1979).
Data interpretation can be complicated by gas production from sample decomposition and by varying
rates of carbon dioxide and methane production.
The batch method of Owen et al. (1974) was used to test the anaerobic toxicity of Procion Red
HE-7B. This test also aimed to determine whether prior exposure of the biomass to Procion Red
HE-7B increased the resistance of the biomass to any inhibitory effects of the dye. The
experimentation is presented in Section 4.2.5 and the results in Section 4.3.5.
4-84 8

4.2 EXPERIMENTATIONA standard set of operating conditions was developed for laboratory studies of Procion Red HE-7B
decolourisation and are described in Appendix C. In the experimentation sections which utilised
these conditions the details are referenced to Appendix C, with any amendments described in the
relevant experimental section. All experiments were performed in triplicate unless otherwise
specified.
4.2.1 The Effect of Prior Exposure of Anaerobic Biomass to Procion Red HE-7B on theEfficiency of Azo Reduction This section is divided into :
a)
b) the experimental procedure for testing whether acclimated biomass could decolourise Procion
Red HE-7B at a higher rate than unacclimated biomass.
Enrichment programme for Procion Red HE-7B
The enrichments were performed in two batch digesters; a round-bottomed reactor (5 M) with flange
(Quickfit); and an aspirator bottle (10 M). The inoculum was obtained from anaerobic digesters at the
Umzinto and Umbilo Waste-water Treatment Works. These works were chosen as sources of
inoculum as they treat a significant volume of textile effluent and the microoganisms in the sludge
could have become adapted to tolerate and/or degrade textile dyes. A 40 % (v/v) inoculum was used
in the enrichments (including undigested organics in the sludge). A defined medium of trace elements,
minerals and vitamins was prepared according to Owens et al. (1979) (Appendix C) and added to the
digesters with the inoculum. The digesters were overgassed with oxygen-free nitrogen (Fedgas) for
30 min at a flow rate of 0,5 M/min and incubated, without shaking, in the dark at 32 oC. Gas was
released continuously from the digesters into gas traps. The traps consisted of upturned measuring
cylinders clamped in beakers of solution (20 % (w/v) NaCl and 0,5 % (w/v) citric acid). The volume
of solution displaced was equivalent to the volume of gas produced.
Once the digesters were stable (approximately 15 d of incubation) Procion Red HE-7B dye solution
was added to the reactors to give an initial concentration of 10 mg/M. Dye solution was added at
monthly intervals over the 4 month enrichment period and the final concentration of Procion Red
HE-7B (after 4 months of incubation) was calculated to be 200 mg/M, assuming that no degradation
of the dye had occurred. A cumulative concentration was calculated, although decolourisation was
seen to occur, as it was not known whether the resultant dye metabolites were degraded or merely
accumulated in the digester, and there was uncertainty concerning the concentration at which these
metabolites would become toxic to the microorganisms.
Dye solution
The commercial (impure) form of Procion Red HE-7B (ICI) was used in the enrichment programme.
4-94 9

4.2.2 Biological Decolourisation of Procion Red HE-7BA series of experiments was undertaken to define the nature of anaerobic decolourisation. The first
experiment aimed to determine the order of decolourisation for Procion Red HE-7B with respect to
dye concentration. From this study probable rate controlling factors were identified to be: cell
permeability; presence of additional carbon source; and addition of competitive electron acceptors.
These factors were investigated to determine which theory of microbial azo reduction (Chapter Three)
supported the results observed in the standard assay system. The role of redox potential in azo
reduction was investigated both when Procion Red HE-7B was present as a sole electron acceptor and
when competitive electron acceptors such as nitrate or sulphate were added.
Standard assay conditions were followed and are described in Appendix C. A number of
ammendments were made to these conditions to suit the individual experiments, which are explained
below :
The order of Procion Red HE-7B decolourisation, with respect to dye concentration
Procion Red HE-7B concentrations of 150 and 200 mg/M were used, in addition to the 100 mg/M
concentration used in the standard assay. Three dye concentrations were utilised to assess the effect of
increased dye concentration on the rate of decolourisation of Procion Red.
Rate of decolourisation of Procion Red HE-7B as a sole carbon source
The rate of decolourisation of Procion Red HE-7B was measured in the presence of an additional
carbon source (glucose) as per standard assay conditions and compared with decolourisation rates in
serum bottles with no additional carbon source. That is, no glucose was added to the experimental
bottles, which were otherwise prepared according to standard assay conditions.
The effect of cell permeability on rate of Procion Red HE-7B decolourisation
Standard assay conditions were not followed in these experiments and the full experimental materials
and procedure are described in this section. Cells were permeabilised using the technique of Meschner
The effect of prior exposure of anaerobic biomass to Procion Red HE-7B on the rate of azo
reduction.
The conditions and methods of the standard assay, described in Appendix C, were followed for these
experiments in which rates of decolourisation of Procion Red HE-7B were compared for acclimated
and unacclimated biomass, i.e. biomass previously exposed to Procion Red HE-7B in the enrichment
programme and biomass that had not been previously enriched for Procion Red HE-7B. An
amendment to the standard assay procedure was the method of serum bottle inoculation. As the two
sources of inoculum (acclimated and unacclimated biomass) were to be obtained from digesters with
different liquid : volume ratios, a standard volume of 30 mM inoculum could not be used. A volume
of 30 mM inoculum (equivalent to that in the standard assay) was centrifuged and the biomass pellet
weighed. It was found to give a wet weight of approximately 5 g and this mass was chosen as the
standard inoculum size per serum bottle for this experiment.
4-104 10

and Wuhrmann (1982) (reported below with some amendments) so that decolourisation rates of
Procion Red HE-7B
Cell permeabilisation
Cells from the laboratory enrichment digester were separated from the preculture medium by
centrifugation (5 000 rpm for 20 min), washed in phosphate buffer (0,025 M, pH 6,86) and
centrifuged again (5 000 rpm for 20 min). A 30 g (wet weight) pellet of washed cells was
resuspended by vigorous agitation in 250 mM of phosphate buffer (0,025 M, pH 6,86) containing
1 mmol/M MgCl2 and 20% (v/v) toluene. The suspension was immediately cooled to 2 o C by
plunging into crushed ice and centrifuged at 10 000 rpm for 30 min. The supernatant was separated
into a toluene and a water phase in a separation funnel (ca. 5 min). The cooled cell pellet was then
divided into two; one half was resuspended in the water phase of the permeabilisation mixture and the
other in phosphate buffer (0,025 M, pH 6,86).
The cell pellet was resuspended in the water phase of the permeabilisation mixture since it was found
by Meschner and Wuhrmann (1982) that although the aqueous phase of the permeabilisation mixture
was inactive as a dye reductant, permeabilised cells resuspended in this mixture reduced the dyes at a
much higher rate than cells suspended in phosphate buffer. As boiling of this aqueous phase did not
change its reduction enhancing effect on the cells, they assumed that treatment of the bacteria in the
water-toluene mixture leached out some heat resistant lipophilic compound that was essential for dye
transport through the cell envelope.
The permeabilised cell mixture (either suspended in the permeabilisation solution or in phosphate
buffer, 0,025 M) was decanted into serum bottles (100 mM into each bottle). Glucose was added to
the bottles to give an initial concentration of 1 g/M. Control bottles consisted of non-permeabilised
cells suspended in 100 mM phosphate buffer with 1 g/M glucose. The bottles were overgassed with
nitrogen (Fedgas) at a flow rate of 0,5 M/min, sealed, crimped and incubated statically in the dark, in
a water bath at 32 oC. After 18 h of incubation a solution of Procion Red HE-7B was added to each
bottle by syringe to give an initial dye concentration of 100 mg/M. Samples were withdrawn by
inserting a hypodermic needle through the septa of the serum bottles and withdrawing 2,5 mM of
sample into a syringe. These samples were prepared and analysed according to the analytical
procedure described in Appendix C.
Measurement of metabolic activity of permeabilised cells after exposure to Procion Red HE-7B.
The contents of the serum bottles were centrifuged at 5 000 rpm for 20 min to separate the biomass
and the centrate. The biomass pellets were washed by re-suspending the pellets in phosphate buffer
(0,025 M) and centrifuging this mixture at 5 000 rpm for 20 min. This was repeated 5 times for the
permeabilised cells, until no visible colour was present in the centrate. The biomass pellets were then
suspended in 100 mM of mineral salts medium (Appendix C) containing 1 g/M of glucose, which
was decanted into serum bottles. The serum bottles were overgassed with oxygen-free nitrogen,
sealed and incubated in the dark, in a waterbath at 32 oC. Gas production was monitored by inserting a
hypodermic needle connected to a ground glass syringe through the butyl rubber septa of the serum
4-114 11

bottles and allowing the pressure to equilibrate to atmospheric through the release of gas into the
syringe.
Rate of decolourisation of Procion Red HE-7B in the presence of additional electron acceptors
Two oxidising agents (nitrate and sulphate) were added to the assay bottles to assess the effect of the
presence of additional electron accepting compounds on the reduction of Procion Red HE-7B.
Experimental bottles were prepared and pre-incubated according to conditions described in
Appendix C and the following amendments to the standard assay conditions were made after
completion of pre-incubation.
Addition of nitrate
A concentrated stock solution of sodium nitrate was prepared by dissolving 850 mg of sodium nitrate
in distilled water in a 10 mM volumetric flask, to give a 1 000 mM (1 M) stock solution (A). This
stock solution (A) was diluted 1:1 to give a 500 mM stock solution (B) and 1: 9 to give a 100 mM
stock solution (C). One mM volumes of stock solutions A, B or C were added by syringe to the
pre-incubated serum bottles to give initial nitrate concentrations of 10, 5 or 1 mM. Control bottles
contained no nitrate. A volume of 2 mM Procion Red HE-7B stock solution (as per standard assay
conditions) was added to each serum bottle and decolourisation monitored according to the analytical
procedure described in Appendix C.
Addition of sulphate
A concentrated stock solution of sodium sulphate was prepared by dissolving 1420 mg of sodium
sulphate in distilled water and making up to volume in a 10 mM volumetric flask, to give a 1 000 mM
stock solution (A). This stock solution (A) was diluted 1:1 to give a 500 mM stock solution (B). One
mM of appropriate stock solution was added to the assay bottles by syringe to give initial
concentrations of 5 and 10 mM sulphate. Control bottles contained no sulphate. A volume of 2 mM
Procion Red HE-7B stock solution (as per standard assay conditions) was added to each serum bottle
and decolourisation
The role of redox potential in azo reduction
These experiments required continuous monitoring of the redox potential in the anaerobic system so
that any changes in redox potential could be recorded. Preliminary experiments using serum bottles
neccessitated the samples to be withdrawn from the anaerobic environment for the redox potential to
be determined. This was not satisfactory for the following reasons: firstly, the redox electrode
required approximately 30 min to stabilise; and secondly, although a blanket of nitrogen was used to
prevent oxygen contamination of the samples this was inadequate over the time period required for
the electrode to stabilise and, consequently, readings were erratic. For these reasons the following
system (Fig 4.3) was developed.
Equipment for on-line measurement of redox potential
The anaerobic system consisted of a cylindrical reactor (1 M) and flange (Quickfit) with ground glass
ports for insertion of electrodes and collection of gas and liquid samples. A magnetic stirrer was used
4-124 12

to mix the contents of the digester. A PHM82 standard Radiometer pH meter, fitted with a combined
platinum-calomel redox electrode (PK 1401) was used for on-line redox potential measurements. The
electrode was inserted into the digester through a ground glass port which was subsequently sealed.
Redox potential readings (mV) were relayed to a data collection programme and stored in a *.PRN
file. Silicone tubing and a 3-way valve connected to a syringe (Aldrich Chemical Company) were
used to withdraw samples from the digester without introducing air into the system. Gas produced in
the digester was transferred through silicone tubing into a gas trap with a solution of 20 % (w/v)
sodium chloride and 0,5 % (w/v) citric acid.
Fig 4.3 : System for on-line measurement of redox potential in ananaerobic digester containing Procion Red HE-7B.
Redox meter
Magnetic stirrerand heater
To gas trap
Redoxelectrode
3-way valvefor sampling
oWater at 32 C
Stirrer bar
Experimental procedure for on-line measurement of redox potential
Conditions in the digester were identical to standard assay conditions i.e. a 30 % (v/v) inoculum of
biomass was introduced into the digester together with mineral salts medium and 1 g/M of glucose.
The digester was sealed, overgassed with oxygen-free nitrogen and pre-incubated for 18 h in a beaker
of water at 32 oC. The digester was gently stirred during pre-incubation by means of a magnetic
stirrer.
Once pre-incubation was completed the redox electrode was introduced into the digester and allowed
to stabilise for 30 min, after which one of three experimental routes was followed :
a) Procion Red HE-7B solution was added to the digester (by means of the 3-way valve) to give
an initial concentration of 100 mg/M;
b) sodium nitrate solution was added to the digester to give an initial concentration of 20 mM,
together with Procion Red HE-7B as in (a); or
c) sodium sulphate solution was added to the digester to give an initial concentration of 5 mM,
together with Procion Red HE-7B as in (a).
The digester was incubated at 32 oC with on-line measurement of redox potential (mV). Samples were
withdrawn from the digester at regular intervals and analysed for Procion Red HE-7B concentration
4-134 13

(mg/M) by means of the analytical procedure described in Appendix C.
4.2.3 Abiotic DecolourisationAbiotic decolourisation of Procion Red HE-7B was investigated with respect to physical removal of
colour i.e. adsorption of the dye to the microbial cells and colour removal in the mineral salts medium.
Adsorption of Procion Red HE-7B was measured in the standard assay system to provide a control for
biological decolourisation and in a system for the development of an adsorption isotherm.
Adsorption of Procion Red HE-7B in mineral salts medium
Standard assay conditions (Appendix C) were followed for the measurement of adsorption of Procion
Red HE-7B to the microbial biomass. The following amendments were made to these conditions :
a) the sludge inoculum was inactivated by autoclaving at 121oC for 15 min to ensure that any
decolourisation observed was a result of adsorption of dye to the biomass and not biological
activity;
b) the experiment was performed under sterile conditions to prevent the growth of other
microorganisms which could cause decolourisation of the dye; and
c) adsorption of Procion Red HE-7B to the microbial biomass was also measured in a saline
solution which was known to have no decolourising action. This was used as a control to
determine the influence of the minerals salts medium on adsorption of Procion Red HE-7B to
the biomass.
To determine whether the adsorbed portion of Procion Red HE-7B was degraded in the standard assay
system, methanol extractions were carried out using : (a) autoclaved biomass from the adsorption
experiment, to determine the concentration of adsorbed dye that could be extracted from the biomass;
and (b) active biomass used to degrade Procion Red (soluble) to below 5 mg/M, to determine whether
any dye would be released from the cells of active microorganisms.
The biomass mixtures were centrifuged at 5 000 rpm for 20 min to remove any liquid and the cell
pellets re-suspended in 50 mM of methanol. The biomass-methanol mixture was left to stand for
30 min at ambient temperature, after which time the methanol was remove by centrifugation at
5 000 rpm for 20 min.
Procion Red HE-7B adsorption isotherm
The method used to determine an adsorption isotherm for Procion Red HE-7B was based on that of
Shaul
Experimental procedure
Sludge adsorbent was prepared by freeze drying biomass from the Procion Red HE-7B enrichment
digesters. Freeze drying was chosen as the drying method to prevent microbial disruption. A mass of
0,2 g of adsorbent was added to each of sixteen 250 mM erlenmeyer flasks. Five solutions of Procion
Red HE-7B were prepared by adding 5, 10, 15, 20 and 25 mg of the commercial dye preparation to
1 M volumetric flasks and making up to volume with distilled water. Dye solution (100 mM) was
4-144 14

added to the erlenmeyer flasks containing the sludge adsorbent so that each concentration of Procion
Red HE-7B was represented in triplicate. A single erlenmeyer flask (containing only sludge adsorbent
and 100 mM distilled water) was prepared in order to assess any absorption interference due to colour
imparted from the sludge. Control flasks contained 100 mM of Procion Red HE-7B solution but no
adsorbent. All flasks were incubated on a rotary shaker at 32 oC for 24 h.
Analytical procedure
Samples were withdrawn after 24 h, centrifuged at 6 500 rpm for 20 min and the supernatant analysed
at 520 nm for absorption intensity. These results were converted into dye concentration (mg/M) from
a standard curve (Appendix C). The results were analysed according to the Freundlich and Langmuir
adsorption isotherms.
Decolourisation in the mineral salts medium
Standard Assay conditions were followed, as given in Appendix C, with one amendment i.e. no
inoculum was added to the assay bottles. These serum bottles contained only mineral salts medium
(sterile), glucose and Procion Red HE-7B (100, 150 and 200 mg/M) so that the decolourising effect of
the mineral salts medium could be assessed.
4.2.4 Identification and Fate of Procion Red HE-7B Degradation ProductsThis section of experimentation investigated the following :
a) that decolourisation of Procion Red HE-7B occurred through azo bond cleavage and resulted
in degradation products such as those shown in Fig 4.2; and
b) whether these compounds were mineralised during a 52 d incubation period.
Azo bond cleavage was investigated using ultraviolet scanning techniques. Mineralisation of the
degradation products was investigated as a continuation of the anaerobic toxicity assay
(Section 4.2.5), by extending the incubation period to 52 d and monitoring the serum bottles for gas
production. The aim of this study was firstly, to determine whether mineralisation of Procion Red
HE-7B did occur during the incubation period and, secondly, to compare the ability of acclimated and
unacclimated biomass to mineralise the degradation products.
Cleavage of Procion Red HE-7B azo bonds
Standard assay conditions (Appendix C) were followed to prepare an experiment to measure
decolourisation of 100 mg/M of Procion Red HE-7B.
Analytical procedure
Samples were prepared according to Appendix C. The ultraviolet spectra of the samples were
determined by scanning the samples for absorbance from 190 nm to 600 nm using a Varian MS-200
spectrophotometer. The results obtained were qualitative and depicted cleavage of the azo bonds with
an increasing level of decolourisation.
4-154 15
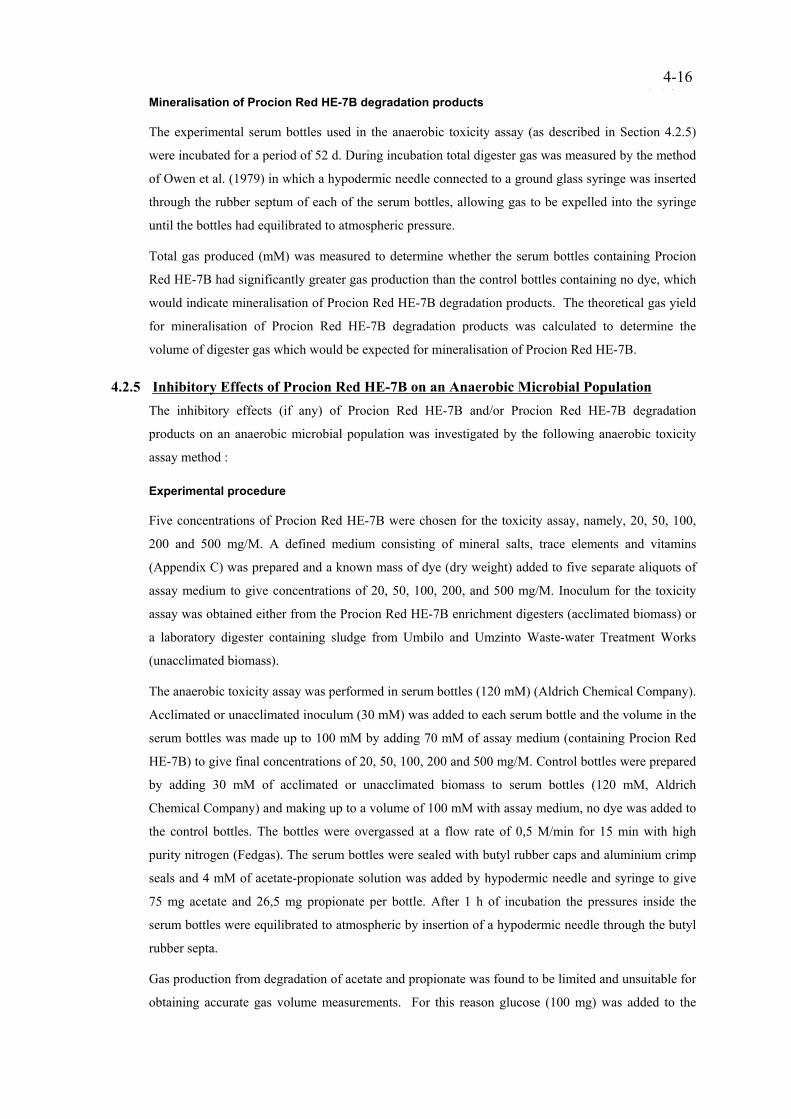
Mineralisation of Procion Red HE-7B degradation products
The experimental serum bottles used in the anaerobic toxicity assay (as described in Section 4.2.5)
were incubated for a period of 52 d. During incubation total digester gas was measured by the method
of Owen et al. (1979) in which a hypodermic needle connected to a ground glass syringe was inserted
through the rubber septum of each of the serum bottles, allowing gas to be expelled into the syringe
until the bottles had equilibrated to atmospheric pressure.
Total gas produced (mM) was measured to determine whether the serum bottles containing Procion
Red HE-7B had significantly greater gas production than the control bottles containing no dye, which
would indicate mineralisation of Procion Red HE-7B degradation products. The theoretical gas yield
for mineralisation of Procion Red HE-7B degradation products was calculated to determine the
volume of digester gas which would be expected for mineralisation of Procion Red HE-7B.
4.2.5 Inhibitory Effects of Procion Red HE-7B on an Anaerobic Microbial PopulationThe inhibitory effects (if any) of Procion Red HE-7B and/or Procion Red HE-7B degradation
products on an anaerobic microbial population was investigated by the following anaerobic toxicity
assay method :
Experimental procedure
Five concentrations of Procion Red HE-7B were chosen for the toxicity assay, namely, 20, 50, 100,
200 and 500 mg/M. A defined medium consisting of mineral salts, trace elements and vitamins
(Appendix C) was prepared and a known mass of dye (dry weight) added to five separate aliquots of
assay medium to give concentrations of 20, 50, 100, 200, and 500 mg/M. Inoculum for the toxicity
assay was obtained either from the Procion Red HE-7B enrichment digesters (acclimated biomass) or
a laboratory digester containing sludge from Umbilo and Umzinto Waste-water Treatment Works
(unacclimated biomass).
The anaerobic toxicity assay was performed in serum bottles (120 mM) (Aldrich Chemical Company).
Acclimated or unacclimated inoculum (30 mM) was added to each serum bottle and the volume in the
serum bottles was made up to 100 mM by adding 70 mM of assay medium (containing Procion Red
HE-7B) to give final concentrations of 20, 50, 100, 200 and 500 mg/M. Control bottles were prepared
by adding 30 mM of acclimated or unacclimated biomass to serum bottles (120 mM, Aldrich
Chemical Company) and making up to a volume of 100 mM with assay medium, no dye was added to
the control bottles. The bottles were overgassed at a flow rate of 0,5 M/min for 15 min with high
purity nitrogen (Fedgas). The serum bottles were sealed with butyl rubber caps and aluminium crimp
seals and 4 mM of acetate-propionate solution was added by hypodermic needle and syringe to give
75 mg acetate and 26,5 mg propionate per bottle. After 1 h of incubation the pressures inside the
serum bottles were equilibrated to atmospheric by insertion of a hypodermic needle through the butyl
rubber septa.
Gas production from degradation of acetate and propionate was found to be limited and unsuitable for
obtaining accurate gas volume measurements. For this reason glucose (100 mg) was added to the
4-164 16

serum bottles in addition to the acetate and propionate.
Analytical procedure
Two analytical methods were followed. The first measured the incremental volume of gas produced
and the second the percentage methane in the incremental gas volume.
Gas volume
Digester gas produced was measured daily by insertion of a hypodermic needle (20-gauge) and
syringe through the butyl rubber septum of each serum bottle. The syringe was initially flushed with
nitrogen gas and lubricated with distilled water. Readings were taken at the incubation temperature
with the syringe held vertically. Volume determinations were made by allowing the syringe plunger to
move freely and equilibrate between the bottle and atmospheric pressure. Gas was exhausted after
each measurement.
Percentage methane in the digester gas
The percentage methane content of the digester gas was measured using a Varian (3 300) gas
chromatograph equipped with a thermal conductivity detector (TCD) which was used to detect
methane, carbon dioxide and nitrogen, and a Varian (3 700) gas chromatograph equipped with a flame
ionisation detector (FID) to detect methane. A stainless steel packed column (poropak N, 6' by 1/8'',
80 to 100 mesh) was used for separation of methane, carbon dioxide and nitrogen with the following
conditions :
Conditions for the Varian 3 300 and TCD
Column oven : 50 oC
Detector : 200 oC
Filaments : 250 oC
Injector : 100 oC
Range : 10-9
Attenuation : 64
Conditions for the Varian 3 700 and FID
Column oven : 50 oC
Detector : 100 oC
Injector : 100 oC
Flow rate (nitrogen) : 15 mM/min
Range : 10-9
Attenuation : 64
The residence times of methane and carbon dioxide in the column were approximately 0,53 and 1,81
min respectively, although, water vapour present in the gas samples required a run time of 20 min to
be released from the column under these operating conditions. A temperature ramp was, therefore,
used to remove the water vapour and the following analytical method was developed:
Initial column oven temperature : 50 oC
4-174 17

Hold time : 2 min
Temperature ramp to 100 oC
Rate : 10 oC/min
Hold time : 5 min
Samples of digester gas were withdrawn from the serum bottles (directly after the bottles had been
equilibrated to atmospheric pressure) by inserting the needle of a gas-tight syringe (100 M) through
the butyl rubber septa of the serum bottles and withdrawing 70 M of headspace gas. A volume of
approximately 20 M of gas in the syringe was wasted to achieve an accurate volume of 50 M,
which was injected into the gas chromatograph. Peak area was recorded on a Varian integrator with
the attenuation set at 64 and the chart speed at 0,5 cm/min.
Calibration curves were prepared by injecting increasing volumes of high purity methane (Fedgas)
and plotting the peak areas versus volume ( M) of methane injected. The peak area obtained for
methane in the digester gas was related to a volume of 100 % methane by use of the calibration curve.
This volume was converted to a percentage (v/v).
4-184 18

4.3 RESULTS
This section presents results obtained from laboratory investigation of Procion Red HE-7B
decolourisation in a biological anaerobic system. The sections begin with the results of the
enrichment programme with respect to the rate of decolourisation (Section 4.3.1). Section 4.3.2
presents results from the investigation of the nature of biological decolourisation and Section 4.3.3
results from the identification and fate of the degradation products of azo reduction. The final section
contains results from an anaerobic toxicity assay conducted with Procion Red HE-7B. All results are
discussed in the general discussion section (Section 4.4).
4.3.1 The Effect of Prior Exposure of Anaerobic Biomass to Procion Red HE-7B on the Rateof Decolourisation.
Fig 4.4 shows that prior exposure of the anaerobic biomass to Procion Red HE-7B in the enrichment
digesters did not increase the rate of decolourisation of Procion Red HE-7B. The rate constants for
decolourisation by acclimated and unacclimated biomass were - 0,289/h and - 0, 310/h, respectively
which shows a slightly lower rate of decolourisation for the acclimated biomass. Experimental data
are presented in Appendix D.
Fig 4.4 : Rate constants for decolourisation of ProcionRed HE-7B by acclimated and unacclimated biomass withstandard assay conditions.
0 2 4 6 8 10-3
-2,5
-2
-1,5
-1
-0,5
0
Time (h)
Acclimated biomass
Unacclimated biomass
- 0,318 / hk = - k = - 0,289 / h
ln (C
/C )0
t
4.3.2 Biological Decolourisation of Procion Red HE-7B
The results of the investigation of the nature of biological decolourisation of Procion Red HE-7B in
the standard assay system are presented in the following order. The first experiment determined the
order of decolourisation with respect to dye concentration. From these results the following possible
rate-determining factors were chosen for investigation : cell permeability, presence of electron donor
i.e. glucose; and presence of additional oxidising agents (nitrate or sulphate). The final experiment
measured changes in redox potential in the standard assay system during decolourisation.
Experimental data are presented in Appendix D.
4-19

The order of Procion Red HE-7B decolourisation with respect to dye concentration
The exponential regressions of Procion Red HE-7B (mg/M) versus time (h), for initial dye
concentrations of 100, 150 and 200 mg/M, are plotted in Fig 4.5. To account for the decolourising
action of the mineral salts medium (Section 4.3.3) in which the experiment was performed,
decolourisation during the first 15 min was attributed solely to chemical decolourisation and Co was
taken as the concentration of Procion Red HE-7B after 15 min of incubation. The exponential curves
suggest a first-order relationship of Procion Red HE-7B decolourisation versus time, with respect to
(soluble) dye concentration. That is, the rate of dye degradation at any time was directly dependent on
the concentration of dye in the system.
Fig 4.6 : ln (Ct/Co) versus time (h) is plotted forinitial dye concentrations of 100, 150 and200 mg/M, confirming that Procion RedHE-7B decolourisation could be first-orderwith respect to dye concentration.
Fig 4.5 : Exponential regression of ProcionRed HE-7B (mg/M) with time (h) showingpossible first order reaction with respect to dyeconcentration. Decolourisation is shown withinitial dye concentration of 100, 150 and 200mg/M.
0 2 4 6 8 10 12 14 16-5
-4
-3
-2
-1
0
Time (h)
100 mg/l
150 mg/l
200 mg/l
k = - 0,441
k = - 0, 316
k = - 0,252
/h
/h
/h
ln (C
/C )0
t
0 2 4 6 8 10 12 14 160
20
40
60
80
100
120
140
Time (h)
Proc
ion
Red
HE-
7B (
mg/
l)
100 mg/l
150 mg/l
200 mg/l
To confirm whether decolourisation of Procion Red HE-7B was first order with respect to dye
concentration, ln (Ct/Co) [where Ct is the dye concentration at time t and Co the dye concentration at
time zero] was plotted against time (h). This plot was expected to be linear if the reaction was first
order with respect to dye concentration. As can be seen in Fig 4.6, linear relationships of ln (Ct/Co)
versus time were obtained for all the intial dye concentrations and the rate constant (k) was calculated
from the slope of the line. The rate constant for a first-order reaction should be independent of initial
concentration, as the half-life is independent of the initial concentration (Brown, 1988). However,
Fig 4.6 shows decreasing values of k and, therefore, decreasing rates of decolourisation) with
increasing initial dye concentrations.
Procion Red HE-7B decolourisation with permeabilised cells
Cell permeability was investigated as a rate-limiting factor in the decolourisation of Procion Red
HE-7B. Cells were permeabilised by the method of Meschner and Wuhrmann (1982) and
permeabilised cells were re-suspended in :
4-20

a) the aqueous phase of the permeabilisation mixture. The reason for this was that Meschner and
Wuhrmann found that permeabilised cells, re-suspended in this mixture, decolourised dyes at a
much higher rate than cells re-suspended in phosphate buffer; and
b) phosphate buffer (0,025 M).
Non-permeabilised cells were used as a control for this experiment and were suspended in phosphate
buffer (0,025 M).
N-P = non-permeabilised biomass
P-B = permeabilised biomass suspended in buffer
P = permeabilised biomass suspended in permeabilisation
liquid
Fig 4.7 : Decolourisation of Procion Red HE-7B(100 mg/M) with inoculum consisting of : cellspermeabilised and suspended in phosphate buffer;cells permeabilised and suspended in perm.solution and non-permeabilised cells in phosphatebuffer.
018.525.5120
0820.548
0012.524
Subsequent to addition of Procion RedHE-7B, biomass washed and suspended inmineral salts medium + glucose
44418
PP-BN-PTime (h)
Prior to addition of Procion Red HE-7B
Table 4.1 : Gas production (cumulative) fromnon-permeabilised and permeabilised cells.
0 5 10 15 20 25 300
20
40
60
80
100
120
Time (h)
Proc
ion
Red
HE-
7B m
g/l
Non-permeabilised(in buffer)
Permeabilised(in buffer)
Permeabilised(in perm. soln)
Fig 4.7 shows that decolourisation of Procion Red HE-7B by the non-permeabilised cells was
exponential over time. The permeabilised cells did not show any marked decolourisation of the dye
which suggested that the permeabilisation process could have had a detrimental effect on the
microorganisms. However, gas produced by the permeabilised microorganisms during pre-incubation
(Table 4.1) indicated that the permeabilised microorganisms were metabolically active prior to
addition of Procion Red HE-7B. To determine whether addition of the dye had inhibited the
permeabilised microorganisms, the permeabilised biomass was centrifuged (to remove the soluble dye
remaining in the serum bottles after 25 h of incubation) and washed with phosphate buffer (0,025 M)
(to remove any dye adhering to the microbial cells). It must be noted that the permeabilised biomass
had to be washed five times to remove all visible dye from the cells whereas two washes had
previously been found adequate to remove adsorbed dye from autoclaved (non-permeabilised)
biomass. The washed biomass was re-suspended in mineral salts medium and glucose and monitored
for gas production. These results are presented in Table 4.1 and show that the permeabilised cells did
not produce any gas for the first 48 h whereas the non-permeabilised cells produced 20 mM of gas
during the initial 48 h of incubation. The permeabilised cells originally suspended in buffer were able
to resume metabolic activity after 48 h of incubation, producing 8 mM of gas, although those cells,
originally suspended in the aqueous phase of the permeabilisation mixture, did not show any signs of
metabolic activity during the 120 h incubation period.
4-21

Rate of decolourisation of Procion Red HE-7B as a sole carbon source
Fig 4.8 : Decolourisation of Procion Red HE-7B(100 mg/M) in the presence and absence of asupplemental carbon source (glucose, 1 g/M ).
0 50 100 150 200 250-5
-4
-3
-2
-1
0
1
Time (h)
No supplemental carbon Supplemental carbon source
k = - 0.012/ h
k = - 0.441/ h
ln (C
/C )0
t
Fig 4.8 shows that decolourisation of Procion Red HE-7B could occur in the standard assay system
when the dye was present as the sole carbon source and that this reaction could be related to
first-order kinetics. However, this reaction proceeded at a very low rate when compared with the rate
of decolourisation in assay bottles containing glucose at 1 g/M. The rate constant (k) measured
without glucose was only 2,72 % of that measured in the presence of glucose. No gas production was
measured during the time period required for decolourisation (or for 5 days after decolourisation was
complete) although gas bubbles were noted in the biomass.
Rate-limiting effects of additional electron acceptors
Two electron acceptors, nitrate and sulphate, were used to determine the effect of the presence of an
additional electron acceptor (i.e. other than Procion Red HE-7B) on the rate of decolourisation of
Procion Red HE-7B.
Nitrate as an additional electron acceptor
Fig 4.9 shows how the presence of nitrate in the standard assay system inhibited decolourisation of
Procion Red HE-7B for a period of time which will be termed the lag phase. The duration of these
lag phases were directly related to the concentration of nitrate in the system, which is well illustrated
by comparing the duration of the lag phase in the presence of 5 mM nitrate (approximately 12 h) to
that in the presence of 10 mM nitrate (approximately 25 h). This two-fold increase in nitrate
concentration resulted in a doubling of the lag phase. The close correlation between nitrate
concentration and the duration of the lag phase (in which no Procion Red HE-7B reduction occured)
suggests that nitrate reduction was occurring preferentially to reduction of Procion Red HE-7B in the
standard assay system.
4-22

Fig 4.10 : ln (Ct/Co) versus time plotted fordecolourisation of Procion Red HE-7B in thepresence of 0, 1, 5 and 10 mM nitrate. Timezero was taken as the sampling time recordeddirectly before the onset of decolourisation.
Fig 4.9 : Procion Red HE-7B decolourisation inthe presence of 0, 1, 5 and 10 mM nitrateshowing lag phases before the onset ofexponential decolourisation, the duration ofwhich corresponded to the concentration ofnitrate present.
0 10 20 30 40-3,5
-3
-2,5
-2
-1,5
-1
-0,5
0
T ime ( h)
Control (no nitrate)
1mM nitrate
5mM nitrate
10 mM nitrate
k = - 0.309/ h k = - 0.245/ hk = - 0.256
k = - 0.218/h/ h
ln (C
/C )0
t
Time (h)0 10 20 30
0
10
20
30
40
50
60
Time (h)
Proc
ion
Red
HE-
7B m
g/l
Control (no nitrate)
1 mM nitrate
5 mM nitrate
10 mM nitrate
Once decolourisation of Procion Red HE-7B commenced, an exponential relationship of dye
concentration versus time was observed (Fig 4.10). The control (no nitrate) had the highest rate of
decolourisation while the rate constants for the nitrate-containing samples were similar, irrespective of
the initial nitrate concentration.
Sulphate as an additional electron acceptor
The addition of sulphate to the serum bottles containing Procion Red HE-7B had no effect on the rate
of decolourisation. This was demonstrated by the fact that there was no significant difference in
reaction rates for the control bottles (no sulphate) and those containing 5 or 10 mM sulphate
(Fig 4.11).
Fig 4.11 : Decolourisation of Procion Red HE-7B in thepresence of 0, 5 and 10 mM sulphate.
0 2 4 6 8 10 12 14-3
-2,5
-2
-1,5
-1
-0,5
0
Time (h)
Control (no sulphate)
5 mM sulphate
10 mM sulphate
ln (C
/C )0
t
Trends in redox potential for microbial decolourisation of Procion Red HE-7B
The redox potential of an anaerobic digester was monitored during decolourisation of Procion Red
HE-7B (100 mg/M) when Procion Red HE-7B was present as the sole electron acceptor, or in the
presence of nitrate (20 mM) and sulphate (5 mM). Fig 4.12 shows the decolourisation of Procion Red
4-23

HE-7B when the dye was present as a sole electron acceptor. The redox potential of the anaerobic
system was monitored continuously during decolourisation and for approximately 20 h subsequent to
decolourisation. The results show that the redox potential of the system decreased from approximately
- 375 mV (addition of Procion Red HE-7B) to approximately - 475 mV by the end of the 5 h
decolourisation period. A redox potential reading of approximately - 475 mV was maintained until
12,5 h of incubation, at which point the redox potential of the system can be seen to increase fairly
rapidly to approximately - 450 mV. This reading then remained steady until the end of the monitoring
period (22,5 h).
Fig 4.12 : Redox potential (mV) measured in an anaerobic digester during decolourisation ofProcion Red HE-7B (approximately 5 h) and for 20 h subsequent to the completion of decolourisation.
0 5 10 15 20 25
-500
-450
-400
-350
-300
-250
-200
0
10
20
30
40
50
60
70
Dye
con
cent
ratio
n (m
g/l)
Redox potential Dye concentration
Time (h)
Red
ox P
oten
tial (
mV)
Fig 4.13 Shows the redox potential (mV) and Procion Red HE-7B concentration (mg/M) for an
anaerobic digester containing Procion Red HE-7B and nitrate. The redox potential of the system
(prior to addition of dye and nitrate) was approximately - 475 mV. An initial colour loss was
recorded in the first five hours subsequent to addition of dye and nitrate to the digester, during which
time the redox potential remained below - 400 mV. Once the redox potential increased to
approximately - 375 mV, decolourisation appeared to be inhibited. The redox potential continued to
rise to - 225 mV, at which point the readings remained steady (within a range of - 225 to - 200 mV)
for approximately 40 h of incubation. During this time no decolourisation was recorded and it may be
speculated that nitrate reduction coincided with this redox potential plateau. It must also be noted that
the duration of the lag phase was approximately 40 h (i.e. 2 h per mM nitrate) which was consistent
with results shown in section 4.3.2. After 40 h of incubation the redox potential of the system
decreased sharply to reach - 450 mV within 3 h. Once the redox potential decreased below - 450 mV
decolourisation of Procion Red HE-7B was initiated. Decolourisation was achieved in approximately
5 h during which time the redox potential decreased to - 500 mV.
4-24

Fig 4.13 : Redox potential (mV) measured in an anaerobic digester containing nitrate (20 mM)and Procion Red HE-7B (100 mg/M).
0 10 20 30 40 50 60
-500
-450
-400
-350
-300
-250
-200
0
10
20
30
40
50
60
70
Redox potential Dye concentration
Proc
ion
Red
HE-
7B (m
g/l)
Red
ox p
oten
tial (
mV)
Time (h)
Fig 4.14 shows the change in residual dye concentration and Eh, for an anaerobic system containing
Procion Red HE-7B (100 mg/M) and sulphate 5 mM . The redox potential of the system was fairly
high (- 300 mV) before addition of the dye. Subsequent to addition of Procion Red HE-7B and
sulphate the redox potential decreased rapidly to - 450 mV. Decolourisation of the dye was
completed in approximately 6 h and the redox potential remained steady at - 450 mV until 15 h of
incubation at which point a sharp decrease in potential was recorded (below - 500 mV). An increase
in redox potential was recorded after approximately 20 h of incubation and the Eh of the system
remained steady at approximately - 475 mV for the next 50 h.
Fig 4.14 : Redox potential (mV) measured in an anaerobic digester containing sulphate (5 mM)and Procion Red HE-7B (100 mg/M).
0 10 20 30 40 50 60 70 80-600
-500
-400
-300
-200
10
20
30
40
50
60
70
Time (h)
Redox potentialDye concentrationPr
ocio
n R
ed H
E-7B
(mg/
l)
Red
ox P
oten
tial (
mV)
4-25

4.3.3 Abiotic Decolourisation of Procion Red HE-7B
This section presents the results from an investigation of possible abiotic mechanisms of
decolourisation that could occur in the standard assay system. The mechanisms investigated can be
divided into :
a) adsorbance; and
b) decolourisation of the dye in the mineral salts medium.
Experimental data for this section are presented in Appendix E.
Asorption of Procion Red HE-7B with anaerobic biomass as the adsorbent
Adsorption of Procion Red HE-7B was investigated with respect to the extent of adsorption occurring
in the standard assay system and the fate of the adsorbed dye. Adsorption was also investigated with
the aim of developing an adsorption isotherm for Procion Red HE-7B, with digester sludge as the
adsorbent.
Adsorption of Procion Red HE-7B in mineral salts medium and saline solution
Fig 4.15 shows that adsorption of Procion Red HE-7B to the inactivated (autoclaved) biomass did
occur although this was not instantaneous and required approximately 6 h to reach equilibrium. An
increased level of decolourisation was observed in serum bottles where the adsorbent was incubated
with mineral salts medium, in comparison with the serum bottles in which the adsorbent was
incubated with saline solution. Control bottles (results not shown) in which Procion Red HE-7B
(100 mg/M) was incubated with either sterile mineral salts medium or sterile saline solution gave
similar results, indicating that the increased colour removal observed in the mineral salts medium was
due to a component of the medium and not to increased adsorption of the dye to the biomass
adsorbent.
Once it had been established that adsorption of Procion Red HE-7B to the biomass in the standard
assay system was responsible for a percentage of the recorded decolourisation it was neccessary to
determine the fate of the adsorbed dye in an actively decolourising system i.e. whether the adsorbed
dye was, subsequently, decolourised or could be extracted from the biomass after decolourisation of
the soluble dye was completed. A second experiment was, therefore, performed to determine whether
dye could be extracted from :
a) inactivated biomass adsorbent; and
b) biomass that had actively decolourised a solution of Procion Red HE-7B (100 mg/M).
Methanol extraction of the autoclaved sludge resulted in some dye removal whereas extraction of the
active sludge showed no release of dye from the biomass. The results were obscured by a strong
yellow colour which was extracted from both types of inoculum and, therefore, only represented a
qualitative experiment. In fact, more successful results were obtained by washing the biomass with
saline solution as a considerable amount of dye was released from the autoclaved sludge, whereas no
dye was released from the active sludge. Although this was only a qualitative experiment the results
4-26

indicated that the adsorbed portion of Procion Red HE-7B was probably decolourised.
Decolourisation by adsorbance was, therefore, not dissociated from biological decolourisation of
Procion Red HE-7B in rate-determining experiments.
Development of an adsorption isotherm for Procion Red HE-7B
Fig 4.16 is the plot of Procion Red HE-7B adsorbed/mass of adsorbent versus the equilibrium
concentration of Procion Red HE-7B in solution. This plot shows a typical pattern of monolayer
adsorption i.e. a steep portion with relatively low solution concentrations (when more adsorption sites
were available than could be filled by adsorbate) followed by a less steeply rising curve as the
solution concentrations increased. The amount of dye adsorbed reached a maximum value at moderate
concentrations (17 to 20 mg/M) and remained constant with a further increase in dye concentration, as
the adsorbent was saturated.
Fig 4.16 : Procion Red HE-7B adsorbed permass of sludge adsorbent plotted versus theequilibrium concentration of Procion RedHE-7B in solution.
Fig 4.15 : Adsorption of Procion Red HE-7B toinactivated (autoclaved) biomass in salinesolution and mineral salts medium.
0 5 10 15 20 25 300,6
0,8
1
1,2
1,4
1,6
1,8
2
2,2
x (m
g/g)
c (mg/l)0 1 2 3 4 5 6 70
20
40
60
80
100
120
140
Time (h)
Proc
ion
Red
HE-
7B m
g/l
Adsorption in saline solution
Adsorption in mineral medium
Fig 4.17 shows the linear relationship between x (mg/g) and c (mg/M) when Procion Red HE-7B
adsorption data is represented by the logarithmic form of the Freundlich adsorption isotherm equation.
The linear regression has an R-Square value of 0,95541. The slope of the line (b) is 0,50469 and
indicates adsorption intensity. The y-intercept (a) is - 0,96092 and indicates adsorption capacity. Fig
4.18 shows the linear relationship of c/x versus c when Procion Red HE-7B is represented by the
Langmuir adsorption isotherm. The linear regression has an R-Square value of 0,95729. The slope of
the line (K) is 0,1849 and the y-intercept (k) is 2,06165.
4-27

Fig 4.18 : The Langmuir adsorption isotherm.Fig 4.17 : Log-log plot of the Freundlichadsorption isotherm.
0 5 10 15 20 25 302
3
4
5
6
7
8
C (mg/l)
c/x
R-Square = 0,95729
1,5 2 2,5 3 3,5-0,4
-0,2
0
0,2
0,4
0,6
0,8
ln c (mg/l)
ln x
(mg/
g)R-Square = 0,95541
Decolourisation in the mineral salts medium
As shown in Fig 4.19, approximately 35 % of the dye was removed by contact with the mineral salts
medium. Since this colour removal remained constant and occurred instantaneously this form of
decolourisation, although accounted for in a colour balance, was excluded from the results when
calculating the order and rate of dye degradation by the microbial inoculum.
Fig 4.19 : Decolourisation of Procion RedHE-7B in sterile mineral salts medium. Initialdye concentrations of 100, 150 and 200 mg/M.
0 2 4 6 8 10 120
50
100
150
200
250
Time (h)
Proc
ion
Red
HE-
7B m
g/l
100 mg/l 150 mg/l 200 mg/l
4.3.4 Identification and Fate of Procion Red HE-7B Degradation Products
The objectives of this study were two-fold. Firstly, to determine whether azo reduction was
responsible for decolourisation of Procion Red HE-7B in an anaerobic biological system and
secondly, to determine the fate of these degradation products in the anaerobic system during an
extended incubation period of 52 d.
All calculations and raw data for this section of experimental results are presented in Appendix F.
4-28

Experiments to determine whether azo reduction was responsible for biological decolourisation
of Procion Red HE-7B
Fig 4.20 shows the results of ultraviolet scanning of samples taken from anaerobic serum bottles
prepared according to the standard assay procedure. The samples taken prior to decolourisation
exhibited a broad peak (475 to 600 nm) which corresponded to the azo bonds of the dye
chromophore. Samples taken subsequent to decolourisation no longer exhibited a peak in this region
of the spectrum, indicating that decolourisation of Procion Red HE-7B in the standard assay system
occurred through reduction and consequent splitting of the azo bonds in the dye chromophore.
Fig 4.20 : Scans of samples from serum bottles containingProcion Red HE-7B, before and after decolourisation.
200 300 400 500 6000
0.2
0.4
0.6
0.8
1
1.2
1.4
Hydrocarbon peaks
Solvent peak
Azo bond
Before decolourisation
After decolourisation
Wavelength (nm)
Abso
rban
ce
Fate of Procion Red HE-7B degradation products in an anaerobic system
Solutions of Procion Red HE-7B (20, 50, 100, 200 and 500 mg/M) were incubated with either
acclimated or unacclimated biomass for a period of 52 d. At the initiation of the incubation period
glucose, acetate and propionate were added as substrate for the biomass. Fig 4.21 shows the total gas
production during 52 d of incubation for the serum bottles containing 0 (control), 20, 50, 100, 200 and
500 mg/M of Procion Red HE-7B inoculated with either acclimated or unacclimated biomass. The
total gas produced by the acclimated biomass was far greater than that by the unacclimated biomass
but this could not be attributed to dye inhibition of the unacclimated biomass as the unacclimated
control bottles produced on average similar volumes of gas compared with the bottles containing
Procion Red HE-7B. No significant difference in total gas production could be seen between the
control bottles and those incubated with Procion Red HE-7B (acclimated biomass), indicating that
mineralisation of the Procion Red HE-7B degradation products did not occur when incubated
anaerobically for 52 d with acclimated biomass.
4-29

Fig 4.21 : Total gas produced by acclimated and unacclimatedbiomass during 52 d of incubation.
Control 20 50 100l 200 500l0
50
100
150
200
250
������������������������
������������������
���������������������������
���������������������������
���������������������������
������������������
Procion Red HE-7B (mg/l)
Tota
l dig
este
r gas
(ml)
at 5
2 d
of in
cuba
tion
����Acclimated biomass Unacclimated biomass
Calculations of theoretical gas production for mineralisation of Procion Red HE-7B (Table 4.2) show
that digester gas volumes of 3,7 to 92,5 mM would be expected for mineralisation of Procion Red
HE-7B. At the lower volumes it would be impossible to distinguish mineralisation of Procion Red
HE-7B from experimental variation, although, at the higher assay concentration (500 mg/M assay
bottles) a significant volume of gas would be expected as a result of Procion Red HE-7B
mineralisation and could be easily detected by the analytical techniques employed.
It may be argued that mineralisation of the dye would not be expected in the presence of labile carbon
sources unless this was a co-metabolic process. As the additional substrates were exhausted by the
acclimated biomass at approximately 37 d this would mean that the effective incubation period in
which mineralisation could have occured was only 15 d. Therefore, the possibility of mineralising
Procion Red HE-7B in an anaerobic system cannot be overruled without additional investigation. As
the unacclimated biomass did not exhaust the additional sources of substrate in the 52 d incubation
period no conclusions can be made as to the mineralising ability of this biomass for Procion Red
HE-7B.
92.5837.0318.529.263.7Total volume (mM)
31.7512.76.353.181.27Carbon dioxide (mM)
60.8324.3312.176.052.43Methane (mM)
500 mg/M 200 mg/M 100 mg/M 50 mg/M 20 mg/M
Table 4.2 : Theoretical gas volumes for mineralisation of Procion Red HE-7B in assay bottles.
4.3.5 Inhibitory Effects of Procion Red HE-7B on an Anaerobic Microbial Population
The objectives of this study were two-fold: to determine whether Procion Red HE-7B was inhibitory
to the anaerobic biomass of the standard assay; and to determine whether prior exposure of the
biomass to Procion Red HE-7B increased the resistance of the acclimated biomass to the inhibitory
effects of the dye. An anaerobic toxicity assay was performed to achieve these objectives. The
toxicity assay consisted of a range of five concentrations of Procion Red HE-7B viz. 20, 50, 100, 200
and 500 mg/M which were incubated with either acclimated or unacclimated biomass (fed with
4-30

acetate, propionate and glucose) in anaerobic serum bottles. During incubation gas production in the
serum bottles was monitored to determine whether the presence of Procion Red HE-7B was inhibitory
to the methanogenic population.
Figs 4.22 and 4.23 show gas production (cumulative) for acclimated and unacclimated biomass
respectively, during the 52 d incubation period. To calculate the levels of inhibition for samples
containing Procion Red HE-7B, the maximum rate of gas production for each sample had to be
calculated over the same time period. The time periods chosen for computation of these rates are
shown between the vertical lines in Fig's 4.22 and 4.23, and the plots used to calculate these rates are
shown in Figs 4.24 and 4.25.
Fig 4.23 : Cumulative gas production for serumbottles inoculated with unacclimated biomassand fed with acetate, propionate and glucose.Control bottles contain no Procion Red HE-7Band assay bottles contain 20, 50, 100, 200 and500 mg/l dye.
Fig 4.22 : Cumulative gas production for serumbottles inoculated with acclimated biomass andfed with acetate, propionate and glucose. Controlbottles contain no Procion Red HE-7B and assaybottles contain 20, 50, 100, 200 and 500 mg/l dye.
0 10 20 30 40 50 600
50
100
150
200
250
Time (d)
Dig
este
r gas
(ml)
Control 20 mg/l 50 mg/l
100 mg/l 200 mg/l 500 mg/l *
0 10 20 30 40 50 600
50
100
150
200
Time (d)
Dig
este
r gas
(ml)
Control 20 mg/l 50 mg/l
100 mg/l 200 mg/l 500 mg/l *
*
Fig 4.25: Rates of gas production(unacclimated biomass) calculated for the timeperiod when gas production rates were lineari.e. before substrate concentration becamelimiting.
Fig 4.24 : Rates of gas production (acclimatedbiomass) calculated for the time period when gasproduction rates were linear i.e. before substrateconcentration became limiting.
15 20 25 30 35 4020
40
60
80
100
120
140
160
180
200
Time (d)
Dig
este
r gas
(ml)
Control 20 mg/l 50 mg/l
100 mg/l 200 mg/l 500 mg/l *
5 10 15 20 2520
40
60
80
100
120
140
160
180
Time (d)
Dig
este
r gas
(ml)
Control 20 mg/l 50 mg/l
100 mg/l 200 mg/l 500 mg/l *
The maximum rates of gas production for all serum bottles were calculated and the data normalised by
computing ratios between respective rates for samples and the controls. This ratio was designated as
MRR. A MRR of less than 0,95 suggested possible inhibition, and one less than 0,90 suggested
4-31

significant inhibition (Owen et al., 1979). The MRRs calculated for Procion Red HE-7B are shown in
Table 4.3 and Fig 4.26.
0.7270.920500.000
0.6780.944200.000
0.6640.965100.000
1.0601.02250.000
1.0231.01420.000
1.0001.000Control (0)
Unacclimatedbiomass
Acclimated biomassProcion Red HE-7B(mg/M)
Maximum Rate Ratio (MRR)
Table 4.3 : Maximum Rate Ratio's (MRR) for the anaerobic toxicity assaywith Procion Red HE-7B
The MRRs for the anaerobic toxicity assay with Procion Red HE-7B showed that, for biomass
previously exposed to the dye, concentrations of 20, 50 and 100 mg/M were not inhibitory. Higher
concentrations of Procion Red HE-7B (200 and 500 mg/M) resulted in MRRs of 0,944 and 0,92
respectively which indicated possible inhibition of the anaerobic biomass by the increasingly
concentrated dye, although, no significant inhibition of the acclimated biomass was recorded in this
toxicity assay. However, for serum bottles containing unacclimated biomass, MRRs indicating
significant inhibition were recorded for concentrations of Procion Red HE-7B above and including
100 mg/M. No inhibititory effects were recorded with the lower dye concentrations. These results,
therefore, suggested that prior exposure of the biomass to Procion Red HE-7B increased the resistance
of this microbial population to inhibitory concentrations of dye.
Fig 4.26 : Maximum rate ratio's for anaerobic toxicity assay withProcion Red HE-7B.
Control 20 50 100 200 500 0
0,2
0,4
0,6
0,8
1
1,2
����������������������������������������������������������������������������������������
����������������������������������������������������������������������������������������
������������������������������������������������������������������������������������
��������������������������������������������������������
��������������������������������������������������������
��������������������������������������������������������
Procion Red HE-7B (mg/l)
Max
imum
rate
ratio
(MR
R) m
l/d
Acclimated biomassUnacclimated biomass
����Possible inhibition (0,95)
Significant inhibition (0,9)
Although anaerobic toxicity assays are usually conducted using the analytical criterions of total gas
production, the results may be complicated by varying ratios of carbon dioxide to methane, which
may cause subtle inhibition effects to be overlooked. For this reason the Procion Red HE-7B toxicity
assay aimed to employ methane production data for determination of MRR's, by analysing the
4-32

percentage methane in the digester gas. However, due to difficulties with analytical equipment,
methane percentages were only measured on 3 days of the assay, viz. days 3, 8 and 30 and methane
production data could not be employed for analysis of the assay. The available data has been
presented in Figs 4.27 and 4.28, and show percentage methane in the digester gas for acclimated and
unacclimated biomass respectively.
Fig 4.28 : Methane content (%) of digester gasproduced in anaerobic toxicity assay withunacclimated biomass.
Fig 4.27 : Methane content (%) of digester gasproduced in anaerobic toxicity assay withacclimated biomass.
2 Days 8 Days 30 Days0
10
20
30
40
50
60
��������������������������������
�����������������������������������
���������������������������������������������
����������������������������������������
������������������������������������������������������������
����������������������������������������
��������������������������������������������������
������������������������������������
% M
etha
neControl 20 mg/l
�������� 50 mg/l
������ 100 mg/l
������ 200 mg/l
������ 500mg/l
2 days 8 days 30 days0
10
20
30
40
50
60
��������������������������������������������
�������������������������������������������������������
�������������������������������������������������������
������������������������������������������������
�����������������������������������������������������������������
������������������������������������������������
������������������������������������������������������������
�����������������������������������������������������������������
% M
etha
ne
Controls 20 mg/l����
50 mg/l
����100mg/l
����200mg/l
����500 mg/l
Fig 4.27 shows that no marked difference could be detected between the methane content of gas
produced in the assay bottles (containing Procion Red HE-7B) and the control bottles containing no
dye. Fig 4.28 does show marked differences in the methane contents for the various samples, although
no trend could be discerned from these results.
4-33

4.4 DISCUSSION
This section discusses the experimental results in Chapter Four, beginning with the outcome of the
enrichment programme, followed by a discussion aimed at elucidating the mechanism of
decolourisation of Procion Red HE-7B under anaerobic conditions and ending with a discussion on
the role of abiotic decolourisation in the biological system.
4.4.1 Prior Exposure of Anaerobic Microorganisms to Procion Red HE-7B
As outlined in the Section 4.1.1, an enrichment programme for Procion Red HE-7B was performed
with the objectives of improving the rate of decolourisation of Procion Red HE-7B, selecting for
microorganisms with the ability to mineralise the degradation products from decolourisation of
Procion Red HE-7B, and improving the tolerance of the microorganisms to inhibitory concentrations
of dye and/or dye degradation products.
Prior exposure of the anaerobic microorganisms to Procion Red HE-7B was expected to improve the
rate of decolourisation of the dye, however, the measured rates of decolourisation (Section 4.3.1)
indicated that the acclimated microorganisms were less proficient in decolourising the dye than the
unacclimated microorganisms. It was, therefore, suggested that prior exposure to Procion Red HE-7B
(or the dye metabolites) caused the microorganisms to be stressed, resulting in an overall lowering of
the metabolic state of the acclimated microorganisms and thereby slowing the rate of decolourisation.
Alternatively, inoculating the serum bottles by mass (wet weight) of inoculum could have been
subject to error if the biomass activities of the acclimated and unacclimated digesters differed
significantly. For example, if cell death occurred in the enrichment digester a percentage of the wet
weight inoculum was probably inactive. If 10 % of the acclimated inoculum was inactive, the rate of
decolourisation by acclimated biomass would only be 90 % of that recorded for the unacclimated
biomass (assuming 100 % activity for the unacclimated biomass). As the difference between -0,289
and -0,318 is approximately 10 %, the reaction rates measured would not be considered to differ
significantly. It is, therefore, recommended that, for experiments in which different sources of
biomass are to be utilised, biomass activity should be determined prior to inoculation by methods such
as measurement of dehydrogenase activity.
Although this enrichment programme did not improve the ability of the microorganisms to degrade
Procion Red HE-7B, other researchers have reported success in this field. Heiss et al. (1992) reported
that previous exposure of an azo reducing Rhodococcus strain to a particular azo dye improved the
ability of the microorganisms to degrade that dye by stimulating production of an inducible azo
reducing enzyme. Haug et al. (1991) showed that enrichment of a bacterial population with a
particular sulphonated azo compound increased the ability of this population to decolourise other
sulphonated azo dyes. They proposed that this occurred through the development of an inducible
membrane transport system which was able to take up sulphonated compounds into the cell. As cell
permeability is cited as the principal rate-limiting factor in microbial decolourisation of sulphonated
azo dyes (Meschner and Wuhrmann, 1982) this is in keeping with the theory. However, as discussed
4-34

in Section 4.4.2, it is debatable whether cell permeability is a major rate limiting factor in the
anaerobic decolourisation of Procion Red HE-7B, which could explain why prior exposure of the
anaerobic population to Procion Red HE-7B did not increase the rate of decolourisation of the dye.
With respect to the selection of microorganisms capable of mineralising Procion Red HE-7B,
experiments in Section 4.3.4 showed that mineralisation of Procion Red HE-7B did not occur in the
52 d incubation period with either acclimated or unacclimated biomass. Although the literature had
reported that aromatic compounds such as naphthalene, naphthol and aniline could be degraded under
anaerobic/anoxic conditions, a principle difference between these compounds and the degradation
products of Procion Red HE-7B is the highly sulphonated nature of the latter. Sulphonation tends to
increase the recalcitrant nature of these compounds by decreasing the ability of these compounds to
permeate through the microbial cell walls (Meschner and Wuhrmann, 1982; Haug et al., 1991).
Microbial degradation of sulphonated naphthalene compounds has been reported by Brilon et al.
(1988a,b) but desulphonation was found to be essential before these compounds could be utilised as
sources of carbon and energy. As molecular oxygen is essential for oxygenolytic cleavage of the
sulphonate bonds, in order to liberate the sulphonate groups as sulphite, it does not seem likely that
mineralisation of sulphonated dyes will occur under the strict anaerobic conditions required for
decolourisation. Therefore, it is probable that the results achieved in these experiments correctly
indicate that mineralisation of Procion Red HE-7B degradation products is unlikely to occur in the
anaerobic system responsible for azo reduction. However, any problems with the mineralisation
experiment or improvements that could be made to the original enrichment programme must be taken
into consideration before drawing any conclusions.
Firstly, with respect to the mineralisation experiment, supplementary labile carbon was present in the
growth medium for 75 % of the incubation period, which would probably have been degraded
preferentially to the recalcitrant aromatic products unless co-metabolic degradation occurred.
Therefore, the absolute time period in which mineralisation of the degradation products was most
likely to occur was only 15 d of the total 52 d incubation period. In this time a population shift would
have had to occur to favour those microorganisms capable of degrading the degradation products and,
in addition, synthesis of suitable catabolic enzymes would have been required if the enzymes were
inducible. Only upon completion of these requirements would degradation and possibly,
mineralisation, have occurred.
With respect to the enrichment programme, it must be taken into consideration that supplemental
labile carbon (originating from the digester sludge inoculum) was present throughout the enrichment
period i.e. the microbial population was never exposed to Procion Red HE-7B as a sole carbon source.
Therefore, enrichment schemes utilising Procion Red HE-7B as a sole carbon source could have
significantly improved results compared with the original enrichment programme. To further increase
the efficiency of the enrichment programme, with respect to mineralisation of Procion Red HE-7B,
isolation of the various degradation products resulting from azo reduction should be undertaken, and
separate enrichment schemes implemented for each degradation product. This would facilitate the
development of microbial associations capable of catabolising each degradation product and would
4-35

give valuable information such as the relative degradabilities of these compounds and rates of
degradation. Some enrichment schemes should target the compound as a sole carbon source and
others should include supplementary labile carbon to allow for co-metabolic catabolism of the target
compound.
The redox state of the enrichment system should also be taken into consideration, as a methanogenic
system may not be optimal for catabolism of the Procion Red HE-7B degradation products. For
example, the sulphonated aminonaphthalene compound may be more efficiently catabolised under
denitrification conditions than other anaerobic conditions, as was discovered for naphthalene
(Mihelcic and Luthy, 1988) whereas the nitroaromatic compound may be degraded under anaerobic
conditions with carbon dioxide as the electron acceptor, as was found for aniline (Schnell and Schink,
1991). Nitrogen heterocyclic compounds, such as those forming the reactive groups of Procion Red
HE-7B, have been reported to be metabolised under both nitrate reducing and methanogenic
conditions (Ronen and Bollag, 1991). Degradation of these compounds in an aerobic system should
also be considered as reports by the ETAD (Brown and Laboureur, 1983b) found the biodegradability
of primary aromatic amines to be enhanced under aerobic conditions.
Rather than monitoring mineralisation by digester gas production, suitable analytical techniques such
as high performance liquid chromatography (HPLC) should be employed to trace the catabolic
pathways of the Procion Red HE-7B degradation products. This would elucidate, for example,
whether certain products were channelled into dead-end pathways, as was found by Kremer (1989)
with naphthionic acid. Kulla (1981) also suggested that sulphonated aromatic compounds resulting
from cleavage of azo bonds were channelled into dead-end pathways. Build-up of these compounds
in treatment systems could, therefore, be a serious problem resulting in digester failure if increasing
concentrations of these compound were not detected. A simpler approach for monitoring
mineralisation would be to assay total organic carbon in the digester, although some researchers have
reported difficulties with this method as the readings are often complicated by an overall increase in
TOC in the digester, possibly due to cell lysis, which conceals any TOC reduction that could be
attributed to catabolism of the dye (Ganesh et al., 1992).
Therefore, successful mineralisation of Procion Red HE-7B could necessitate a multi-component
system to allow for the different operating conditions required to catabolise the individual degradation
products. These could be the provision of supplemental carbon sources in the case of co-metabolic
degradation, or the maintenance of specific redox conditions for catabolism of individual compounds.
This could be achieved by use of a multistage reactor with sequentially arranged reactor vessels
allowing spatial separation of microbial associations that have developed to degrade the individual
intermediary products, with the more labile compounds being catabolised in the initial reactors and
the recalcitrant compounds being catabolised in the final reactors, forming the rate-limiting step of the
overall catabolic process.
The third objective of the enrichment programme was to improve the tolerance of the acclimated
microorganisms to inhibitory concentrations of Procion Red HE-7B. The results in Section 4.3.5
4-36

showed that prior exposure of the biomass to Procion Red HE-7B appeared to increase the resistance
of the acclimated microorganisms to dye concentrations that were found to be inhibitory to
unacclimated microorganisms, which was in agreement with the findings of Ogawa et al. (1988;
1989). These researchers reported that inhibition was caused by intercalation of dye compounds
between DNA base pairs, so preventing enzymatic activities and cell replication (Ogawa et al., 1988).
Intercalation can also cause frame-shift mutations upon replication of the distorted DNA double helix
(Stanier et al.,1987) and this property may even be partially responsible for the development of
microbial resistance when exposed to these dyes.
Intercalation as a mechanism of inhibition requires that the dye be suitable to: (a) pass through the cell
membrane of the microorganisms; and (b) insert itself between the base pairs of DNA. Procion Red
HE-7B is a large, highly sulphonated compound (MW = 1634 g/mol) therefore permeation of the dye
through the microbial cell membranes and subsequent intercalation of the dye between DNA base
pairs is thought to be unlikely as a mechanism of inhibition. Although it is possible that an alternative
mechanism is responsible for the inhibitive effects observed with Procion Red HE-7B, the potential
toxicity of the dye degradation products must not be overlooked. Decolourisation of Procion Red
HE-7B occurred within 48 h of incubation for all concentrations of dye, subsequently liberating the
aromatic amine degradation products. These degradation products are smaller than the dye compound
and may be capable of penetrating the cell and inhibiting the microorganisms either by intercalation or
some other intracellular mechanism. The microbial toxicity of aromatic degradation products of dyes
has been reported by Chung (1983) and Ganesh et al. (1992). The latter noted inhibition of biomass
in a waste-water system treating reactive dye waste water and suggested that this was caused by the
products of dye degradation rather than the dye itself.
It must be noted that both acclimated and unacclimated serum bottles containing 20 and 50 mg/M of
Procion Red HE-7B exhibited higher rates of gas production than the control bottles. This suggests
that, at low concentrations, the presence of the dye in the anaerobic system is beneficial to the
anaerobic microorganisms, possibly due to its role as a terminal electron acceptor. Rahman (1991)
also reported that the addition of the reactive dye, Red B, to a biological culture capable of reducing
the dye, appeared to enhance growth in the culture and proposed that the electron accepting nature of
the dye was responsible for this.
4.4.2 Biological Decolourisation in an Anaerobic System
The first-order reactions for decolourisation of Procion Red HE-7B (Section 4.3.2) were not in
accordance with the measured rates of decolourisation which were inversely proportional to the initial
dye concentrations. In view of the results obtained with the toxicity assay, it is suggested that this
was caused by increasingly inhibitive concentrations of Procion Red HE-7B degradation products in
the system, resulting in decreasing decolourisation rates with increasing initial dye concentrations.
Wuhrmann et al.(1980) also noted that with some dyes the rate of decolourisation decreased more
4-37

rapidly than predicted by a first-order reaction, when a large percentage of the dye had already been
reduced. This was attributed to accumulation of toxic metabolic products in the medium. Although
the decreasing rate of degradation of Procion Red HE-7B with increasing dye concentration did not
directly correlate with the observation of Wuhrmann et al.(1980), it is probable that the toxicity of
First-order reactions for degradation of azo dyes by anaerobic microorganisms were reported by
Larsen et al. (1976), Wuhrmann et al. (1980), Meschner and Wuhrmann (1982) and Kremer (1989).
Pseudo first-orders for reduction of azobenzene in an anaerobic sediment-water system were reported
by Weber and Wolfe (1987), although azo reduction was attributed to abiotic factors associated with
the sediment and could not be directly compared to azo reduction mediated by anaerobic
microorganisms. In all instances the site of azo reduction was assumed to be intracellular and the
favoured primary rate-limiting factor for azo reduction was the rate of permeation of the dyes through
the cell membrane (Larsen et al.,1976; Wuhrmann et al.1980; Meschner and Wuhrmann, 1982; and
Yatome et al., 1991). This is particularly applicable with sulphonated azo dyes such as Procion Red
HE-7B, as their hydrophilic nature is not conducive to cell permeation.
Permeabilisation of the biomass was, therefore, investigated to determine whether permeation of
Procion Red HE-7B through the microbial cell membrane was the principal rate limiting factor for
decolourisation. The results achieved, showing that permeabilisation of the biomass inhibited
decolourisation of Procion Red HE-7B, were in contrast to the results reported by Meschner and
Wuhrmann (1982) when using the same techniques. These researchers showed that, by permeabilising
the cells of Bacillus cereus, the reduction rate of sulphonated dyes could be substantially increased.
Furthermore, dyes not previously reduced by whole cells were reduced by the permeabilised cells.
It was, therefore, initially suggested that the contradictory results achieved with Procion Red HE-7B
were a result of cell damage during the permeabilisation procedure. However, it was noted that gas
production during pre-incubation of the biomass was identical for permeabilised and
non-permeabilised cells i.e. that the metabolic state of the permeabilised biomass was similar to that
of the non-permeabilised control cells, prior to Procion Red HE-7B addition. This suggested that any
inhibition of the biomass occurred upon contact with Procion Red HE-7B and was confirmed by
monitoring the metabolic state of the permeabilised cells following their exposure to the dye. The
results showed that both permeabilised cells originally suspended in buffer and permeabilised cells
originally suspended in the aqueous phase of the permeabilisation mixture, were inhibited by
exposure to Procion Red HE-7B. Although the former group of microorganisms were able to resume
metabolic activity (as measured by gas production) after 48 h of incubation, the latter did not resume
metabolic activity during the 120 h incubation period. These results suggest that the permeabilisation
process facilitated entry of the dye into microbial cells which were previously impermeable to the dye,
thereby inhibiting the biomass. As suspending the biomass in the aqueous phase of the
permeabilisation mixture was thought to increase the rate of transport of the dyes into the microbial
cells (Meschner and Wuhrmann, 1982) this could explain why the permeabilised cells in this mixture
were more inhibited than those in the buffer.
4-38
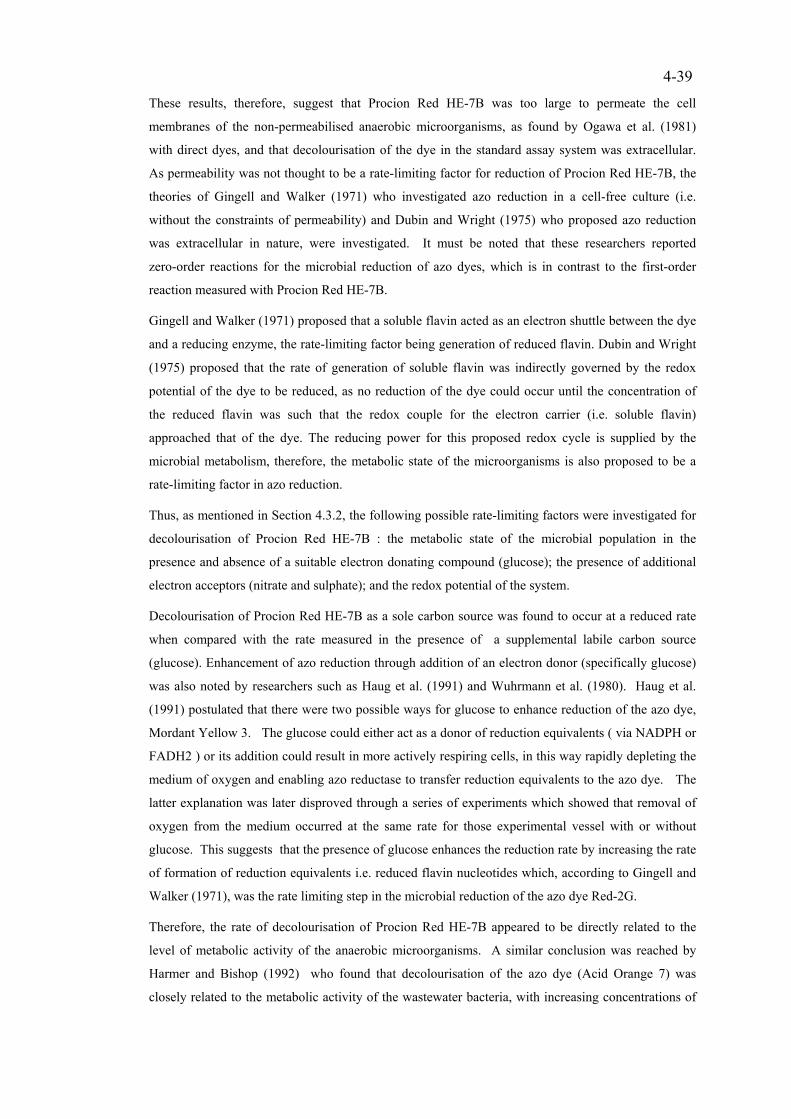
These results, therefore, suggest that Procion Red HE-7B was too large to permeate the cell
membranes of the non-permeabilised anaerobic microorganisms, as found by Ogawa et al. (1981)
with direct dyes, and that decolourisation of the dye in the standard assay system was extracellular.
As permeability was not thought to be a rate-limiting factor for reduction of Procion Red HE-7B, the
theories of Gingell and Walker (1971) who investigated azo reduction in a cell-free culture (i.e.
without the constraints of permeability) and Dubin and Wright (1975) who proposed azo reduction
was extracellular in nature, were investigated. It must be noted that these researchers reported
zero-order reactions for the microbial reduction of azo dyes, which is in contrast to the first-order
reaction measured with Procion Red HE-7B.
Gingell and Walker (1971) proposed that a soluble flavin acted as an electron shuttle between the dye
and a reducing enzyme, the rate-limiting factor being generation of reduced flavin. Dubin and Wright
(1975) proposed that the rate of generation of soluble flavin was indirectly governed by the redox
potential of the dye to be reduced, as no reduction of the dye could occur until the concentration of
the reduced flavin was such that the redox couple for the electron carrier (i.e. soluble flavin)
approached that of the dye. The reducing power for this proposed redox cycle is supplied by the
microbial metabolism, therefore, the metabolic state of the microorganisms is also proposed to be a
rate-limiting factor in azo reduction.
Thus, as mentioned in Section 4.3.2, the following possible rate-limiting factors were investigated for
decolourisation of Procion Red HE-7B : the metabolic state of the microbial population in the
presence and absence of a suitable electron donating compound (glucose); the presence of additional
electron acceptors (nitrate and sulphate); and the redox potential of the system.
Decolourisation of Procion Red HE-7B as a sole carbon source was found to occur at a reduced rate
when compared with the rate measured in the presence of a supplemental labile carbon source
(glucose). Enhancement of azo reduction through addition of an electron donor (specifically glucose)
was also noted by researchers such as Haug et al. (1991) and Wuhrmann et al. (1980). Haug et al.
(1991) postulated that there were two possible ways for glucose to enhance reduction of the azo dye,
Mordant Yellow 3. The glucose could either act as a donor of reduction equivalents ( via NADPH or
FADH2 ) or its addition could result in more actively respiring cells, in this way rapidly depleting the
medium of oxygen and enabling azo reductase to transfer reduction equivalents to the azo dye. The
latter explanation was later disproved through a series of experiments which showed that removal of
oxygen from the medium occurred at the same rate for those experimental vessel with or without
glucose. This suggests that the presence of glucose enhances the reduction rate by increasing the rate
of formation of reduction equivalents i.e. reduced flavin nucleotides which, according to Gingell and
Walker (1971), was the rate limiting step in the microbial reduction of the azo dye Red-2G.
Therefore, the rate of decolourisation of Procion Red HE-7B appeared to be directly related to the
level of metabolic activity of the anaerobic microorganisms. A similar conclusion was reached by
Harmer and Bishop (1992) who found that decolourisation of the azo dye (Acid Orange 7) was
closely related to the metabolic activity of the wastewater bacteria, with increasing concentrations of
4-39

easily assimilable COD in the treatment system resulting in increased decolourisation of the azo dye.
Thus, a treatment system designed to anaerobically decolourise textile dyes must take into account
the requirement of this system for supplemental labile carbon in order to maintain the metabolic
activity of the microorganisms and, consequently, the formation of reduced flavin nucleotides to
reduce and decolourise the dyes.
The presence of nitrate in the standard assay system inhibited decolourisation for a period of time
proportional to the concentration of nitrate added. This suggested that nitrate (as the more
thermodynamically favourable electron accceptor) was reduced in preference to Procion Red HE-7B
and that only after all the nitrate (and possibly nitrite) had been reduced did decolourisation of
Procion Red HE-7B commence. This is in agreement with the proposal of Dubin and Wright (1975)
i.e. that the redox potential of the particular compound controls the rate of reduction of that
compound. Inhibition of azo reduction by nitrate or nitrite was also reported by Wuhrmann et al.
(1980), although in this case the principal rate limiting factor of azo reduction was thought to be
permeation of the dyes through the microbial cell walls.
The presence of sulphate as an additional electron acceptor had no effect on the rate of
decolourisation of Procion Red HE-7B in the standard assay system. It is, therefore, probable that the
dye was reduced preferentially to the sulphate compounds, which indicates that Procion Red HE-7B
was the more favourable electron acceptor. It is, therefore, proposed that the reduction potential of
the dye falls between that of nitrate and sulphate.
The redox potential of the anaerobic digester, measured in the presence of Procion Red HE-7B, dye
and nitrate, and dye and sulphate, shows that reduction of the dye is dependant on the redox potential
of the anaerobic system. It is probable that decolourisation of Procion Red HE-7B will occur
anywhere within a range of redox potentials but that the rate will be influenced by whether the
reduction potential of the system is at the upper or lower level of this range. This was also reported
by Gingell and Walker (1971), when using cell free extracts of Streptococcus faecalis, who stated
that the azo dye (Red 2-G) was reduced at a rate depending on the redox potential of the system.
Although the precise redox potential for decolourisation is not known, it can be concluded that strictly
anaerobic conditions are condusive to decolourisation of Procion Red HE-7B.
These results must be considered when designing a wastewater treatment system for decolourisation
of textile effluent. It was reported by Wuhrmann et al. (1980) that in a nitrifying sewage works
supplemented with an anaerobic treatment step for denitrification, azo compounds were not
decolourised until all nitrite was denitrified. This has serious implications if it is intended to combine
the treatment of textile and nitrate-containing effluent, as it would not be possible to combine
denitrification and dye reduction in a simultaneous process unless the detention time in the anaerobic
step corresponded to the sum of the detention times of the two reactions involved.
4-40

4.4.3 Abiotic Decolourisation of Procion Red HE-7B in a Biological Anaerobic System
The final issue to be addressed in this section is the role of abiotic decolourisation in the anaerobic
system. Abiotic decolourisation was investigated with respect to adsorption and decoloursiation in the
mineral salts medium. Adsorption of Procion Red HE-7B did not occur instantaneously (as found by
Wuhrmann et al., (1980), with cell of B. cereus) but came to equilibrium over a 6 h incubation period.
This gradual attainment of equilibrium between adsorbed and soluble dye neccessitated a rate of
decolourisation (adsorption) to be calculated to determine the extent of decolourisation that could be
attributed to biological decolourisation alone. However, the following questions arose with respect to
whether the adsorbed dye could be considered to be abiotically decolourised, or whether biological
factors were responsible for subsequently decolourising this dye :
a) was the adsorbed dye subsequently biologically decolourised ?; and
b) could the adsorbed dye inhibit, or at least limit, the decolourisation of dye in solution?
The first question was addressed by attempting to remove the adsorbed dye from the cells of an
actively decolourising microbial population, subsequent to decolourisation of Procion Red HE-7B. It
was found that no adsorbed dye could be extracted from actively decolourising cells but that some dye
could be extracted from heat-killed cells. This suggested that the adsorbed portion of the dye was
subsequently decolourised (with active microorganisms) and, therefore, no distinction was made
between abiotic decolourisation (adsorption) and biological decolourisation, in the standard assay
system.
The second question was not answered with respect to Procion Red HE-7B although Wuhrmann
et al.(1980) revealed that some types of dyes adsorbed to bacterial cells were subsequently degraded,
whereas others did not show any signs of degradation over a 24 h period. However, dyes that were
not degraded did not usually affect the reduction rate of dye in solution.
The proportion of Procion Red HE-7B adsorbed to the biomass was low, due to the extreme solubility
of the dye. Adsorption was shown to be of the mono-layer type with the data fitting both the
Freundlich and Langmuir isotherm equations. No conclusions could be reached regarding the
isotherm equation best suited to Procion Red HE-7B adsorption with digester sludge as the adsorbent,
without further experimentation. According to the literature, a Freundlich relationship would be
expected for adsorption of azo dyes to biological sludge. Shaul et al. (1986) calculated adsorption
isotherms for a number of acid azo dyes, using activated sludge as the adsorbent. The results showed
that the Freundlich model was the most suitable in all cases, which agreed with the research of
Dohanyos et al. (1978) (cited by Shaul et al.,1986) who applied three adsorption models to data for 22
textile dyes and found the Freundlich relationship to be the most suitable for 18 of these dyes, with
activated sludge solids as the adsorbent. Wuhrmann et al. (1980) also related dye adsorption by
Bacillus cereus to the Freundlich adsorption model and observed the same relationship. As the
Langmuir isotherm assumes uniform adsorption sites, and the Freundlich isotherm accomodates the
4-41

presence of more than one type of adsorption site, it is reasonable that this isotherm should be more
suitable for representing adsorption data for a heterogenous adsorbent such as biological sludge.
Finally, decolourisation of Procion Red HE-7B in the mineral salts medium could have been caused
by interaction of the dye with ions in the medium, flocculation of the soluble dye or adsorption of the
dye to a precipitate that was noted in the medium. This form of abiotic decolourisation was found to
occur within 15 min of incubation and, therefore, all decolourisation occurring in the first 15 min was
attributed to abiotic decolourisation, when calculating reduction rates for Procion Red HE-7B.
4-42

4.5 CONCLUSIONS
a) The enrichment programme did not increase the rate of decolourisation of the dye, orselect for microorganisms capable of mineralising the dye in the anaerobic system.
b) Prior exposure of the biomass to Procion Red HE-7B increased the resistance of themicroorganisms to inhibitory concentrations of Procion Red HE-7B.
c) Decolourisation of Procion Red HE-7B in an anaerobic system was found to befirst-order with respect to dye concentration.
d) It is suggested that decolourisation of Procion Red HE-7B occurs in the extracellularenvironment.
e) Permeability is, therefore, not proposed to be the principal rate-limiting factor fordecolourisation of Procion Red HE-7B.
f) The metabolic state of the microbial population is a rate-limiting factor indecolourisation of Procion Red HE-7B.
g) The presence of competitive electron acceptors is rate-limiting with respect todecolourisation of Procion Red HE-7B.
h) The redox potential of the system is thought to play a role in the rate of Procion RedHE-7B decolourisation.
i) Abiotic factors causing decolourisation in the anaerobic system were adsorption anddecolourisation by the mineral salts medium.
j) Adsorption of Procion Red HE-7B to the anaerobic biomass was found to follow thepattern of monolayer adsorption and dye adsorbed to the biomass was proposed to besubsequently decolourised.
4-43

CHAPTER FIVE
FINISHING EFFLUENTS AND DECOLOURISATION OF PROCION RED HE-7B
5.1 INTRODUCTION
This chapter deals with a combination of two processes, namely, anaerobic digestion of organic-rich
textile finishing effluents and decolourisation of the azo dye Procion Red HE-7B. Anaerobic digestion
of textile finishing effluents (desizing, scouring and bleaching effluents) was investigated as an aid to
decolourising azo dyes. Preliminary results from this study indicate that anaerobic digestion shows
potential as both a source of energy for azo reduction and for substantial COD reduction of a textile
mill effluent. An additional advantage of anaerobic digestion as a treatment process is the production
of methane gas, which may replace some of the conventional energy sources in a textile factory, and
carbon dioxide which may be used to neutralise the mill effluent before discharge to sewer.
In section 5.1.1 a general review of textile finishing processes is given. A more specific literature
review on anaerobic treatment of textile finishing effluents is presented in section 5.1.2 and the
advantages of process combination are outlined in section 5.1.3.
5.1.1 Textile Finishing Processes and Effluents
A cotton-finishing mill receives raw cotton cloth / yarn which is cleaned and prepared for dyeing and
printing. The preparation involves three wet processes: desizing, scouring and bleaching which may
be combined or performed separately. The advantage of combining these processes into a single stage
operation is a substantial reduction in the number of textile padding and washing processes. Of these
effluents, only those from the desizing and scouring processes have an organic load suitable for
anaerobic treatment, although bleaching effluents must be taken into consideration as they are often
combined with scouring effluents.
Desizing involves the removal of size which is applied to the individual warp yarns during weaving.
The size coats the yarns with a protective film which resists the abrasive effects of the filling yarns
(weft) which are positioned by the shuttle action of the weaving loom (Hart et al., 1983). The size
must be removed prior to dyeing to achieve even dyeing of the cloth.
Natural sizing agents include starches and starch derivatives, cellulose derivatives and protein sizes
(BASF, 1977). The biodegradability of the desizing effluent depends primarily on the type of size
and the desizing process used.
Starch and starch-derived sizes are obtained from maize, corn, potato, tapioca and rice (Hart et
al., 1983). They are insoluble in water and are removed with acid or alkali, or by enzymatic desizing.
The biological degradability of the starch-derived sizes is influenced by chemical modification. In
5-1

general, the non-modified starches are more readily biodegradable, although all starch-based sizes can
be described as biodegradable (Schluter, 1990). The resulting desizing effluent is therefore energy
rich in terms of anaerobic digestion.
Carboxymethyl cellulose (CMC) is the most economically significant of the cellulose derivatives
(Schluter, 1990). It is formed by treating cellulose with sodium hydroxide and monochloroacetic acid.
Carboxymethyl cellulose size is water soluble and can be removed by a hot water wash.
Carboxymethyl cellulose is incompletely biodegraded with a short residence time but complete
degradation could be expected with increased residence times (Schluter, 1990).
Protein sizes are technically outdated as they are far less constant in quality and produce poorer sizing
effects than synthetic sizes (BASF, 1977). The synthetic sizes vary in their chemical basis with the
two most important groups being the polyvinyl alcohol's (PVA) and the polyacrylates. Synthetic sizes
are considered relatively recalcitrant, although approximately 90% removal of PVA has been reported
in an aerobic acclimated system (Hart et al., 1983 ; Porter, 1976). Schluter (1990) also reported that
PVA degradation was found to be possible with acclimated microorganisms. Polyacrylate size shows
little biological degradability although some removal through adsorption to the biomass has been
demonstrated in an activated sludge system (Schluter, 1990).
Cotton desizing effluent is characterised by temperatures of 90 to 95 oC and contains detergents and
auxiliaries (wetting, metal complexing and antifoam agents) in addition to the sizes and solid matter.
The COD of the desizing effluent is dependent on the type of size removed, with starch based sizes
giving rise to the highest COD values for the final effluent, while CMC size results in the lowest COD
values, as the size deposit needed for starch sizes is twice as high as that for CMC size (Schluter,
1990).
Once the cotton has been desized it is scoured with hot alkali and detergent to remove natural
impurities from the cotton together with the spinning oils (Hart et al., 1983). The substances to be
removed in scouring (i.e. pectin's, waxes and proteins) are found mainly in the primary wall and
cuticle, which has a thickness of approximately 1 % of the fibre diameter (BASF, 1977). The
secondary wall, which constitutes over 90 % of the bulk of the mature fibre, consists of cellulose
arranged in a complicated lamellae structure. Although natural cotton contains a relatively small
proportion of impurities, these impurities are difficult to remove. The waxes have a high molecular
weight, which makes their removal difficult and the proteins are situated in the central cavity of the
fibre and are, therefore, relatively inaccessible to chemical attack. Prolonged boiling with sodium
hydroxide solutions (up to 2% w/v) is adequate to solubilise all unwanted impurities (other than the
natural colouring matter) which can then be washed away with water (Trotman, 1968). The cellulose
portion of the cotton is not affected by this treatment providing that air is excluded.
The following changes are brought about by boiling with alkali (Groves et al., 1990) :
a) the pectin's and pectoses are converted to soluble pectic salts;
b) the proteins are degraded into soluble amino acids or ammonia;
5-2

c) the mineral matter is dissolved;
d) dirt is removed;
e) the saponifiable matter is hydrolysed to form soaps which in turn emulsify the unsaponifiable
oils and retain the dirt particles in suspension and
f) the hydrophilic properties of the fibre are improved thereby enhancing the water absorptivity
and the evenness of dye and chemical uptake.
Boiling with alkali is carried out in vessels known as kiers which may be either open (the liquor boils
at atmospheric pressure) or closed (the liquor boils under pressure at temperatures higher than
100 o C). Because the scouring process is carried out in kiers, the resultant scouring effluent may be
referred to as kier liquor.
Cotton scouring effluents contain cotton-derived organics which may be converted to chemical energy
in an anaerobic digester. The wax component of the effluent is known to be recalcitrant although
neutralisation of the effluent in the digester (by carbon dioxide produced as an end-product of
anaerobic digestion) should facilitate physical removal of the wax compounds. Scour effluents are
characterised by high temperatures and pH and contain additional organic compounds such as
detergents (usually anionic) and auxiliaries.
After scouring, the cotton still retains some natural colouring compounds. These are removed by
bleaching which destroys the colouring matter of fibres and associated impurities. Two categories of
bleaches, namely, oxidising or reducing bleaches, can be used in combination with wetting, softening
and stabilising agents. Cotton is generally bleached with oxidising chemicals such as sodium
hypochlorite, sodium chlorite and hydrogen peroxide in a batch process. This process is often carried
out by passing the cloth through a standing bowl containing the bleaching chemicals, after which the
cloth is rotated on a beam for 2 to 8 h.
The characteristics of the desizing and scouring effluent (i.e. high pH, total solids and COD value) all
contribute to increase the cost of discharge to sewer. It is, therefore, desirable to treat or pre-treat the
effluent on site to reduce COD values, pH and total solids.
5.1.2 Treatment /
Traditionally, biological treatment of cotton-finishing effluent involved an aerobic process combined
with a chemical treatment system (Athanasopoulos and Karadimitris, 1988a). The operating costs of
these processes were high due to energy requirements of aeration, nutrient and chemical costs and the
cost of sludge treatment and disposal. By treating this wastewater in an anaerobic digester the total
cost of treatment could be reduced.
Anaerobic digestion is a process whereby complex organic compounds are broken down to methane,
carbon dioxide and water by an association of microoganisms in the absence of molecular oxygen.
Complex organic compounds are hydrolysed by extracellular enzymes then fermented to simple
organic acids by a group of microorganisms collectively referred to as the acidogens. Some of these
5-3

acids are degraded by the methanogens to produce methane and carbon dioxide (McCarty, 1974).
Anaerobic treatment processes are characterised by low sludge production, in contrast to aerobic
processes and have low energy costs as no aeration is required. Mixing in the digester can be
achieved by use of the gas produced in the process. In addition, heating of the reactors would not be
required as wastewater streams from textile finishing usually have temperatures ranging from 60 to
80 oC.
Enrichment of microoganisms for anaerobic digestion of textile finishing effluents
Although scouring and desizing effluents contain a percentage of labile carbon, the presence of
recalcitrant compounds, for example, sizes such as PVA and CMC and cotton-derived organics such
as waxes and auxiliaries, combined with inhibitory conditions such as cation toxicity, necessitates the
enrichment of a catabolic microbial population to ensure efficient attenuation of the effluent.
Enrichment involves the adaptation of a microbial community to degrade a previously recalcitrant
compound, through prior exposure to that compound (Spain and Van Veld, 1983). Adaptation is
defined as a change in the microbial community that increases the rate of transformation of a test
compound as a result of prior exposure to that test compound (Spain and Van Veld, 1983).
Mechanisms that bring about adaptation include gene transfer or mutation, production of inducible
enzymes and population changes within the microbial community. The latter refers to a shift in the
microbial population which may occur upon exposure to a test compound to favour those
microorganisms capable of degrading the compound.
Anaerobic digestion of a mixed textile finishing effluent
The literature is limited with respect to degradation of cotton scouring and desizing effluents by
adapted microbial associations. Most of the papers were published by the authors Athanasopoulos and
Karadamitris (1988a, 1988b) and Athanasopoulos (1992). The first paper reports the successful
adaptation of anaerobic microorganisms to degrade a textile finishing effluent comprised of streams
from woven fabric finishing, knitted fabric finishing and yarn dyeing and finishing.
This effluent (described above) was characterised by high volumes with a relatively low organic load,
thus maintenance of a high treatment rate over extended periods would prove difficult with respect to
biomass washout. For this reason, fixed film anaerobic reactors were investigated for treatment of the
mixed effluent. These reactors have a matrix present for holding microorganisms in the system,
thereby preventing washout. The support matrix may consist of packing media that is either fixed in
position or randomly packed, as in an anaerobic filter, or may consist of sand particles on which the
biomass becomes attached (fluidised or expanded bed).
An anaerobic filter was chosen by Athanasopoulos and Karadamitris (1988a) for treatment of the
above textile effluent. This consisted of a 60 M cylinder, jacketed for temperature control at 35 oC
and packed with polypropylene pall rings. Initially the filter was fed with a solution of 6 % (w/v) cow
manure solids to establish a suitable population of anaerobic microorganisms. After 20 d the feed was
replaced with a glucose solution and the loading was increased to 1 kg COD/m3 / d while
progressively replacing the glucose solution with wastewater. After four months the feed was entirely
5-4

wastewater. Removal of COD for loadings up to 0,8 kg COD/m3/d varied from 66 to 80 % and for
higher loadings was approximately 50 %. The concentration of volatile fatty acids was reported to
remain low (100 to 150 mg/M). Biogas production varied from 0,2 to 0,4 M/g of influent COD and
was found to be 20 M/d for loading up to 1 kg COD/m3/ d. Methane content of the biogas was found
to range from 70 % to 80 % (v/v). When COD loading was increased to 1,3 kg/m3/ d, biogas
production decreased gradually and stopped within a month.
Scale-up of this laboratory process was investigated by Athanasopoulos and Karadamitris (1988b). A
study was undertaken to determine the appropriate packing medium for optimum performance of a
fixed film reactor treating textile finishing effluent. From the performance results of the test reactors,
it was concluded that loose-fill medium could not be used in a full scale anaerobic reactor as short
circuiting (channelling) occurs due to the random placement of the medium. In addition, it was shown
that specific surface area of modular media had no significant effect on the performance of the
reactor. Crossflow medium was recommended and it was suggested that selection of the appropriate
cross flow medium should be based on the resistance to plugging.
In the final assessment, Athanasopoulos and Karadimitris (1988b) concluded that the investment cost
for pre-treatment of cotton textiles finishing wastewater in an upflow filter would be high. However,
the economic benefits of anaerobic digestion (as opposed to activated sludge treatment) were
significant. It was estimated that treatment of the wastewater in an anaerobic system would yield
1 350 m3/d of biogas, the energy of which was calculated to be equivalent to approximately 1 000 kg
of fuel oil per day. This could be used to replace electricity or liquid petroleum gas in some textile
mill processes. In addition, the flue gas from the biogas burner would be adequate to neutralise the
entire mill effluent.
Athanasopoulos (1992) investigated the use of an anaerobic expanded bed reactor for treatment of the
textile effluent described above. The reactor utilised quartz sand as the support medium. After an
initial acclimation stage, the COD loading was gradually increased from 0,1 to 0,63 kg/m3/d. At the
lower COD loadings the removal was approximately 87 %, and this decreased to 50 % at the upper
loading. For COD loading above this the COD removal was constant at 35 %. The volatile fatty
acids decreased as the COD loading increased which is contrary to what would usually be expected
with an unstable anaerobic digester. In most circumstances, digester failure occurs through an
increase in volatile fatty acids (VFA) and concomitant decrease in pH, thus inhibiting the activity of
the methanogens. However, in this case the acidification step appeared to be rate limiting which
indicated that the bulk of the COD was recalcitrant. When the COD loading increased to
0,68 kg/m3/d, the biogas production decreased gradually and ceased after a few days. This could have
been due to inhibition of either the acidogens or methanogens
Promising results for the full-scale treatment of textile finishing effluent were given by Marte and
Keller (1991) in a report on anaerobic pre-clarification of textile wastewater process streams (as part
of the River Glatt rehabilitation project). They concluded that, with appropriate optimisation
measures, approximately 80% degradation could be expected for desizing and preparation (scouring
5-5

and bleaching) streams. This meant an average lowering of the overall COD of approximately 50 to
60 %. With respect to printing pastes, alginate thickeners exhibited 90 % degradation, although
semi-emulsion thickeners could not be anaerobically degraded.
Many textile effluents may be successfully treated by anaerobic digestion, although segregation of
wastewater streams is imperative when designing a biological treatment system so that concentrated
effluent streams can be treated without the additional volume of dilute wash-water streams.
Segregation also allows the treatment system to target specific organic compounds, at designated
stages in the process and allows the waste waters to be fed to the digester in such a way that
5.1.3 Anaerobic Digestion of Cotton Scouring Effluent as an Energy Source forDecolourisation of Procion Red HE-7B
As concluded in Chapter Four, Procion Red HE-7B decolourisation does not provide an adequate
source of energy for the azo-reducing microorganisms. The process, therefore, requires additional
substrate/s to maintain the population of anaerobic microorganisms in the treatment system.
Laboratory experiments utilised glucose as the additional substrate for rate determining experiments.
This would not be feasible for large-scale treatment and an alternative carbon source with the
following characteristics would be required :
a) low cost, preferably a form of waste; and
b) readily available at the site of treatment.
As it is intended to decolourise dye-containing waste on-site in an anaerobic treatment system, it is
desirable that the substrate for the digester is readily available at the factory. This substrate may be
provided by textile effluents with high organic loads, such as those arising from scouring and
desizing. These waste streams provide organic carbon for anaerobic microbial metabolism and
indirectly aid decolourisation. Additional benefits of a combined process are :
a) the COD content of the desizing and scouring wastestreams will be substantially reduced,
resulting in reduced effluent discharge costs;
b) the high pH (approximately 13,5) commonly associated with scouring effluent, is neutralised
by carbon dioxide production in the digester, reducing the costs of acid previously used to
neutralise effluent prior to discharge;
c) the colour of the final effluent will be reduced; and
d) energy will be produced in the form of methane which can either be used to heat the digester,
making the waste treatment process self sufficient, or be utilised elsewhere in the factory if
required.
5-6

Section (5.2.1) outlines the experimental plan and procedure followed during the enrichment
programme. Enrichment of biomass to anaerobically digest textile finishing effluent was divided into
two phases. Firstly, serum bottle acclimation studies were conducted with a kier liquor from Smith
and Nephew (Pinetown) and secondly, acclimation studies were carried out in a laboratory-scale
digester with a mixed cotton scouring and bleaching effluent (John Grant, Jacobs, Durban). The
effluent from Smith and Nephew was a complex mixture of sizes, organics and auxiliary compounds
emanating from kiering of varied fabrics. This made it difficult to predict the degradability of typical
components of textile pre-treatment streams and, consequently, the effluent stream from John Grant
was chosen as representative of a typical cotton scouring and bleaching effluent. This effluent
emanated from the scouring and bleaching of cotton linters and, therefore, contained no sizing agents.
The only organic compounds present in the John Grant effluent were those scoured from the cotton
together with some auxiliaries from the scouring process. Hydrogen peroxide was the bleaching agent
used. The carbon content and pH of these effluents is given in Table 5.1.
12.21 320 to 1 8002 500 to 3 600John Grant
13.510 000 to 11 00015 000 to 20 000 Smith & Nephew
pHInorganic carbon (mg/M)Organic carbon (mg/M)Effluent source
Section 5.2.2 outlines the experimental plan and procedure followed to investigate the ability of the
enriched biomass to decolourise Procion Red HE-7B. The effluent used for these tests was John
Grant kier liquor and the inoculum was obtained from the semi-continuous enrichment digester.
5.2.1 Enrichment of Microbial Populations Capable of Anaerobically Digesting CottonScouring Effluent
Experimental outline and procedure for serum bottle studies
Preliminary serum bottles tests using Smith and Nephew kier liquor aimed to establish :
a) whether anaerobic microorganisms would survive in the inhibitory conditions of the effluent
i.e. high concentrations of sodium hydroxide and presence of organic compounds that could
be toxic to the microorganisms;
b)
c) the minimum period of time required for adaptation to occur.
The serum bottles (120 mM, Aldrich Chemical Company) were divided into two categories: controls
which contained no effluent, i.e. the only available organic substrate was that in the digester sludge
and bottles containing 10, 50 and 100 % effluent respectively.
Inoculum was obtained from Umbilo and Umzinto Waste-Water Treatment Works (WWTW). These
WWTWs were chosen as a source of inoculum as they both receive and treat a significant percentage
5.2 EXPERIMENTATION 5-7

of textile effluent. The inoculum contained residual organic material in addition to biomass.
Enrichment bottles (120 mM) were filled with 70 mM of appropriately diluted kier liquor (10, 50 or
100 %, in triplicate) and 30 mM inoculum. The kier liquor had a pH of 13,5 (Table 5.1) but was
lowered to within the range of 8,0 to 8,5 pH units before use. Control bottles contained 30 mM
inoculum and 70 mM distilled water. The bottles were overgassed with oxygen-free nitrogen (Fedgas)
for 15 min at a flow rate of 0,5 M/min to displace oxygen. After overgassing, the bottles were quickly
sealed with butyl rubber caps and aluminium crimping seals (Aldrich Chemical Company) to prevent
the ingression of oxygen. The bottles were incubated at 32 °C for 1 h, after which time the gas
pressures inside the bottles were equilibrated to atmospheric pressure by inserting a hypodermic
needle (fitted to a 50 mM glass syringe) through the rubber septa of the serum bottles. The bottles
were incubated for 80 d and metabolic activity was monitored through measurement of digester gas
production.
Experimental outline and procedure for John Grant enrichment study
The second enrichment programme, using John Grant cotton scouring and bleaching effluent, was
performed on a larger scale. A round-bottomed reactor (5 M) and flange (Quickfit) constituted the
enrichment vessel. The inoculum was a mixture of biomass from the initial serum bottles study,
biomass from laboratory digesters seeded with biomass from Umbilo and Umzinto WWTWs which
had been operated to exhaust the sludge of any residual organics, and biomass from the Umgeni river
mangrove swamps. The latter two constituted the bulk of the inoculum and were mixed in a 1 : 1
(v/v) ratio. Inoculum from the mangrove swamps was obtained by removing anaerobic sediment from
the bed of a saline river. The rationale behind using this inoculum for degradation of cotton scouring
effluent was the presence of plant derived organics in the effluent, which are similar to plant matter
present in the mangrove sediment. Furthermore, microorganisms in the mangrove sediment are able to
tolerate the sediment salt concentrations (3,5 %) which should infer a competitive advantage with
respect to cation toxicity.
A 30 % (v/v) mixed inoculum (1 500 mM) and 3 500 mM of 10 % (v/v) John Grant effluent, were
added to the digester which was overgassed with oxygen-free nitrogen for 30 min at a flow rate of
0,5 M/min, to displace any oxygen present. The pH of the effluent was lowered to 8,35 by sparging
with carbon dioxide before being added to the reactor, although all subsequent additions of effluent
were not pH adjusted. The reactor was incubated (without mixing) in a water bath at 32 (+ 1) o C. A
3-way syringe valve (with Luer lock fittings) supplied by Aldrich Chemical Company was used to
extract samples from the digester and introduce liquid into the digester, without oxygen ingression.
Gas from the digester was transferred via silicone tubing to a gas trap consisting of an upturned
measuring cylinder clamped in a beaker of citric acid-acidified sodium chloride solution (20 % NaCl
and 0,5 % citric acid). Additional ports were available for insertion of pH electrodes etc.
The reactor was initially operated in batch mode with additional effluent added once gas production
had ceased. This operational mode was used to predict a suitable residence time for a semi-continuous
digester. An initial residence time of 50 d was chosen and the digester operated in semi-continuous
5-8

mode, with 400 mM of effluent added every fourth day. The digester was monitored by measuring
DOC, digester gas production and pH.
Analytical techniques
The volume of gas produced in the serum bottles was measured using the method of Owen et al.
(1979). A hypodermic needle attached to a glass syringe was inserted through the butyl rubber seals
of the serum bottles and the bottles allowed to equilibrate to atmospheric pressure. Displacement of
the ground glass plunger corresponded to the volume of gas produced. The readings were not
corrected to standard temperature and pressure since the experiment was designed to compare the
relative gas productions of the control and enrichment bottles only. Gas volume in the enrichment
digester was measured by liquid displacement.
Dissolved organic carbon (DOC) was measured using a Beckmann Total Carbon Analyser. Samples
(5 mM) were withdrawn from the digester and acidified to pH 2,0 with hydrochloric acid (conc.)
followed by rapid sparging with nitrogen (10 min) to remove the inorganic carbon. The duration of
sparging was calculated from a test in which a sample was sparged for 30 min, with samples injected
into the total carbon channel of the instrument every 2 min. It was found that after approximately
6 min no change in total carbon value occurred, therefore, a sparging time of 10 min was chosen. The
samples were centrifuged at 5 000 rpm for 10 min to remove suspended matter and each supernatant
injected into the total carbon channel. The results were converted to mg of DOC / M by use of a
potassium biphthalate calibration curve which is shown in Fig 5.1.
Fig 5.1 : Calibration curve for total carbon using potassiumbiphthalate standards.
50 100 150 200 250 300 350 400 450 500 550 600 650 700 7500
10
20
30
40
50
60
70
80
90
100
TC mg/l
Peak
hei
ght (
mm
)
5.2.2 Decolourisation of Procion Red HE-7B Combined with Anaerobic Digestion of CottonScouring Effluent
Experimental outline
The aim of these experiments were to determine :
a) whether anaerobic microorganisms capable of digesting scour effluent organics would alsodecolourise Procion Red HE-7B; and
b) whether the mechanism of decolourisation was analogous to that reported in Chapter Four.
5-9

Two experiments were performed to fulfill these aims.
The first experiment measured the rate of decolourisation of Procion Red HE-7B when added to
anaerobic digesters (120 mM serum bottles) in which the microbial population was actively degrading
John Grant scouring effluent at concentrations of either 50 or 100 % (v/v). Controls, consisting of
uninoculated scouring effluent (50 or 100 % v/v), were prepared in serum bottles (120 mM) to assess
the decolourising ability of uninoculated John Grant scouring effluent. Additional controls,
consisting of sterilised John Grant scouring effluent (50 %), were prepared in serum bottles (120 mM)
to determine whether any decolourisation observed in the unsterilised controls could be attributed to
biological activity in the effluent.
The second experiment evaluated the effect of nitrate addition on rate of decolourisation of Procion
Red HE-7B when Procion Red HE-7B (100 mg/M) and nitrate (3mM) were added to anaerobic
digesters (120 mM serum bottles) in which the microbial population was actively degrading John
Grant scouring effluent 50 % (v/v). The rate of decolourisation measured in these experimental
Experimental procedure
Experiments were performed in serum bottles (120 mM). Inoculum was withdrawn from the
enrichment digester by means of a 3-way syringe valve (Aldrich Chemical Company) and centrifuged
at 5 000 rpm. A mass of 5 g of inoculum (wet weight) and 100 mM of effluent (50 or 100 %, diluted
with distilled water) were added to each experimental bottle. All serum bottles were overgassed with
oxygen-free nitrogen for 15 min at a flow rate of 0.5 M/min, capped and sealed. The bottles were
incubated for 40 h at 32 o C, during which time gas production and pH were monitored. After 40 h of
incubation, Procion Red HE-7B stock solution was added to each bottle by hypodermic needle and
syringe, to give an initial concentration of 100 mg/M dye. Sodium nitrate stock solution was also
added to the appropriate bottles at this time to give an initial concentration of 3 mM. Samples (2,5
mM) were withdrawn from the assay bottles by syringe at hourly intervals. These samples were
immediately centrifuged at 10 000 rpm to remove suspended particles.
Uninoculated control bottles (120 mM serum bottles) contained 100 mM of 50 or 100 % (v/v)
unsterile John Grant scouring effluent, diluted with distilled water. Additional control bottles
contained 100 mM of 50 % (v/v) John Grant scouring effluent which was sterilised by autoclaving at
121 o C for 15 min. The control bottles were overgassed with oxygen-free nitrogen for 15 min at a
flow rate of 0,5 M/min, sealed and incubated for 40 h at 32 o C. After 40 h of incubation, Procion Red
HE-7B stock solution was added to each bottle by hypodermic needle and syringe, to give an initial
concentration of 100 mg/M dye. Samples (2,5 mM) were withdrawn from the assay bottles by syringe
at hourly intervals. These samples were immediately centrifuged at 10 000 rpm to remove suspended
particles.
5-10

Procion Red HE-7B stock solution
A 10 g/M stock solution of Procion Red HE-7B was prepared by dissolving 1 g of commercially
available Procion Red HE-7B powder (ICI) in distilled water and making up to 100 mM in a
volumetric flask.
Sodium nitrate stock solution
A stock solution of NaNO3 was made up by dissolving 255 mg in distilled water and making up to
10 mM, to give a 300 mM solution; 1 mM of stock solution was added to each experimental bottle (by
syringe) to give an initial nitrate concentration of 3 mM.
Analytical procedure
Decolourisation was monitored by measuring absorbance at 520 nm on a LKB Biochrom Ultraspec
spectrophotometer (model 4050) and converting the readings to dye concentration using a calibration
curve (Appendix C).
5.3 RESULTS
Section 5.3.1 presents results from serum bottles enrichment studies and data from monitoring the
John Grant enrichment digester in both batch and semi-continuous mode. Section 5.3.2 presents
results from the combination of Procion Red HE-7B decolourisation and anaerobic digestion of John
Grant effluent. All experimental data is presented in Appendix G.
5.3.1 Enrichment of Microbial Populations to Tolerate and Degrade Cotton ScouringEffluent
Fig 5.2. shows the gas production (cumulative, not corrected for STP) monitored during incubation of
digester sludge (microoganisms and residual organic matter) in serum bottles with 0 (control), 10, 50
and 100 % Smith and Nephew kier liquor. The results shown are averages of triplicate results
(Appendix C). The volume of gas produced by the control bottles (containing no kier liquor) and the
enrichment bottles (with kier liquor) was similar for the first 30 d of incubation indicating that gas
production resulted from anaerobic digestion of the residual organic carbon in the digester sludge and
not mineralisation of organic compounds in the kier liquor. However, at approximately 37 d of
incubation the rate of gas production in the 10 % enrichments began to increase in excess of the
controls. At this time the rate of gas production in the controls was low possibly due to a lack of
available substrate and it is therefore probable that any gas produced in the 10 % bottles subsequent to
the 37 d of incubation resulted from anaerobic digestion of organic substrate in the kier liquor. As gas
production in the 50 and 100 % enrichments was similar to that of the controls throughout the 80 d
incubation period, it is probable that degradation of the kier liquor organics did not occur in these
bottles. The reasons for this are unclear but may involve inhibition of the anaerobic biomass by the
increasing salinity of the 50 and 100 % (v/v) effluent.
Fig 5.3 shows digester gas production (cumulative, not corrected for STP) and DOC removal
(cumulative) in the 5 M enrichment digester during the start-up period. This digester was run in batch
mode until gas production ceased at which point 1 M of digester liquid was withdrawn and 1 M of
5-11

John Grant scouring effluent added. As the mangrove sediment (used as a source of inoculum for the
enrichment digester) contained a high percentage of solid organic matter it may be speculated that
degradation of these organics may have occurred in preference to the organics in the scouring
effluent, as was found with the serum bottle enrichments. However, Fig 5.3 shows that gas
production was closely related to the added effluent concentration as measured by DOC in the
digester, with gas production ceasing when DOC was low and increasing overnight subsequent to the
addition of effluent. This indicated that organic compounds in the scouring effluent were being
preferentially degraded.
Fig 5.4 shows a steady rate of DOC removal (cumulative) and digester gas production (cumulative)
with the digester operating in semi-continuous mode. Fig 5.5 is a plot of pH and DOC for the digester
over the same time period. These results show a gradual increase in residual DOC, indicating
incomplete removal of organic carbon in the scouring effluent. Frequent sampling between days
5 and 7 showed a 35 % decrease in DOC between the fifth and sixth day and a further 8 % decrease
by the end of the seventh day. Although digester feeding of the digester was scheduled to occur every
4th day, it was decided to increase the residence time to facilitate a greater decrease in DOC although
only 7 % DOC was removed by day 11. Over the next 8 d of operation, the residual DOC in the
digester gradually increased. It is probable that the labile carbon sources were digested preferentially
causing an accumulation of recalcitrant compounds in the digester.
Fig 5.3 : DOC consumption and digester gasproduction shown for the 80 d start-up period.Digester in batch mode.
Fig 5.2 : Cumulative digester gas production (mM)from inoculum incubated with 0 % (control), 10 %,50 % and 100 % Smith & Nephew kier liquor.Inoculum contains residual organics.
0 20 40 60 80 1000
200
400
600
800
1 000
1 200
1 400
1 600
0
1 000
2 000
3 000
4 000
5 000
Time (d)
DO
C C
onsu
med
mg/
l
Tota
l gas
(ml)
Tota
l gas
(ml)
DOC Consumed
Total gas
0 20 40 60 80 1000
30
60
90
120
150
Time (d)
Gas
pro
duce
d (m
l)
100%
50%
10%
control
5-12
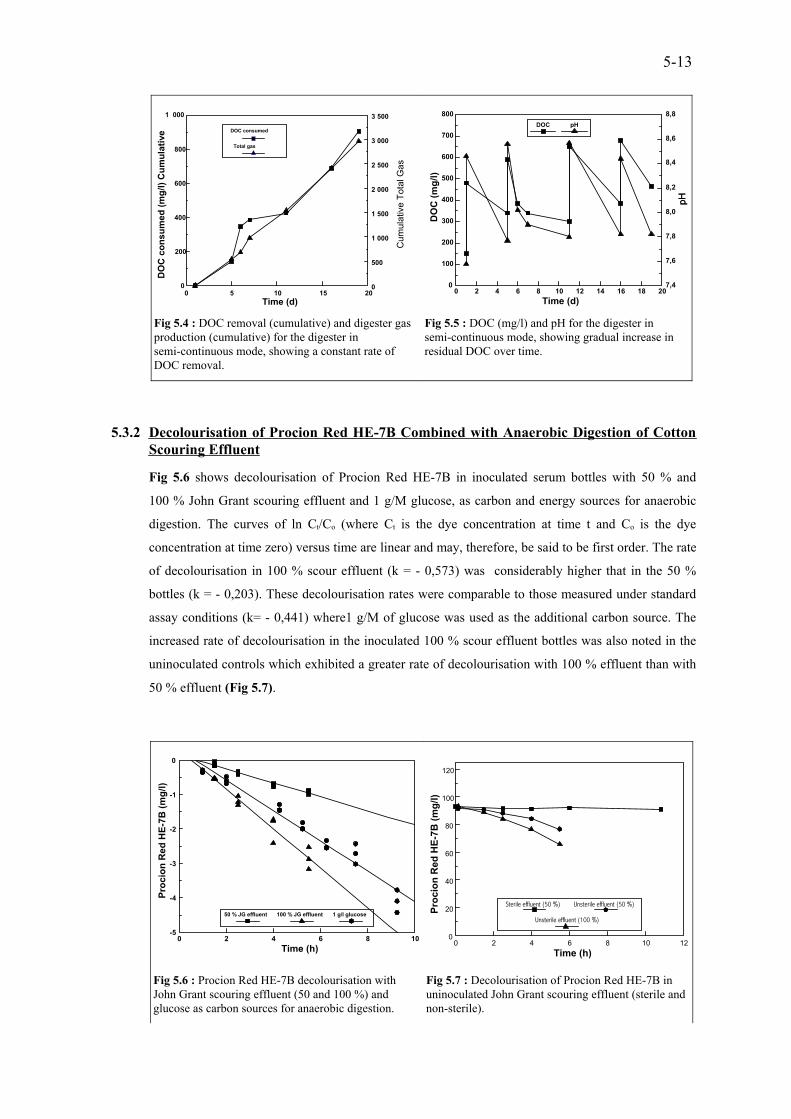
Fig 5.5 : DOC (mg/l) and pH for the digester insemi-continuous mode, showing gradual increase inresidual DOC over time.
Fig 5.4 : DOC removal (cumulative) and digester gasproduction (cumulative) for the digester insemi-continuous mode, showing a constant rate ofDOC removal.
0 2 4 6 8 10 12 14 16 18 200
100
200
300
400
500
600
700
800
7,4
7,6
7,8
8,0
8,2
8,4
8,6
8,8
Time (d)
DO
C (m
g/l)
pHpH
DOC pH
0 5 10 15 200
200
400
600
800
1 000
0
500
1 000
1 500
2 000
2 500
3 000
3 500
Time (d)
DO
C c
onsu
med
(mg/
l) C
umul
ativ
e DOC consumed
Total gas
Cum
ulat
ive
Tota
l Gas
5.3.2 Decolourisation of Procion Red HE-7B Combined with Anaerobic Digestion of CottonScouring Effluent
Fig 5.6 shows decolourisation of Procion Red HE-7B in inoculated serum bottles with 50 % and
100 % John Grant scouring effluent and 1 g/M glucose, as carbon and energy sources for anaerobic
digestion. The curves of ln Ct/Co (where Ct is the dye concentration at time t and Co is the dye
concentration at time zero) versus time are linear and may, therefore, be said to be first order. The rate
of decolourisation in 100 % scour effluent (k = - 0,573) was considerably higher that in the 50 %
bottles (k = - 0,203). These decolourisation rates were comparable to those measured under standard
assay conditions (k= - 0,441) where1 g/M of glucose was used as the additional carbon source. The
increased rate of decolourisation in the inoculated 100 % scour effluent bottles was also noted in the
uninoculated controls which exhibited a greater rate of decolourisation with 100 % effluent than with
50 % effluent (Fig 5.7).
Fig 5.7 : Decolourisation of Procion Red HE-7B inuninoculated John Grant scouring effluent (sterile andnon-sterile).
Fig 5.6 : Procion Red HE-7B decolourisation withJohn Grant scouring effluent (50 and 100 %) andglucose as carbon sources for anaerobic digestion.
0 2 4 6 8 10 120
20
40
60
80
100
120
Time (h)
Proc
ion
Red
HE-
7B (m
g/l)
Sterile effluent (50 %) Unsterile effluent (50 %)
Unsterile effluent (100 %)
0 2 4 6 8 10-5
-4
-3
-2
-1
0
Time (h)
Proc
ion
Red
HE-
7B (m
g/l)
50 % JG effluent 100 % JG effluent 1 g/l glucose
5-13

To determine whether the effluent was biologically active, Procion Red HE-7B was incubated with
uninoculated scour effluent that was either sterilised by autoclaving, or remained unsterilised. The
results are given in Fig 5.7. The sterilised bottles showed no significant colour loss, therefore
decolourisation in the non-sterile bottles could be attributed to reducing conditions in the effluent,
brought about by microorganisms in the effluent (i.e. other than the inoculum) that were actively
catabolising the organics in the effluent and, thereby, decolourising the azo dye. Alternatively,
decolourisation could have been mediated by a heat-labile compound (possibly a reducing agent)
which was inactivated in the autoclaving process. The increased rates of decolourisation measured in
the bottles with 100 % scouring effluent can, therefore, be attributed to a greater concentration of
microorganims or chemical reducing agent in the effluent, or both.
Fig 5.8 shows gas production in the serum bottles (containing 50 % scour effluent) prior to dye
addition. The pH readings for the bottles prior to dye addition and after decolourisation, are presented
in Table 5.2. The initial pH values (8,1) were lowered due to carbon dioxide production during the
40 h pre-incubation period. No marked pH change occured during decolourisation and addition of
nitrate had no significant effect on the pH of the system.
Fig 5.9 : Decolourisation of Procion Red HE-7B inthe presence and absence of 3 mM nitrate, incubatedwith 50 % John Grant scouring effluent.
Fig 5.8 : Gas production in bottles incubated with50 % John Grant scouring effluent prior to theaddition of Procion Red HE-7B.
0 2 4 6 8 10 120
10
20
30
40
50
60
70
Time (h)
Proc
ion
Red
HE-
7B (m
g/l)
No nitrate added
Nitrate (3mM) added
0 10 20 30 40 500
2
4
6
8
10
12
14
Time (h)
Gas
Pro
duct
ion
(ml)
Controls (no dye) gas (ml)
Experimental bottles gas (ml)
Nitrate bottles gas (ml)
The effect of nitrate on the decolourisation process was assessed to determine whether the mechanism
of decolourisation was electrochemical, as concluded in previous experiments (refer to Chapter Four).
Fig 5.9 shows that the presence of nitrate resulted in a significantly reduced rate of decolourisation,
suggesting that nitrate (and possibly nitrite) reduction must occur before decolourisation of Procion
Red HE-7B can take place.
5-14

6,9 to 7,26,5 to 6,66,8 to 7,179c
6,9 to 7,26,5 to 6,86,8 to 7,055b
6,9 to 7,26,9 to 7,07,0 to 7,143a
6,9 to 7,47,0 to 7,27,2 to 7,428
8.18.18.10
a Dye added at 43 hb Decolourisation complete (dye only) c Decolourisation complete (nitrate and dye).
pH (nitrate and dye)
pH (dye only)
pH (control, no dye)
Time (h)
Table 5.2 : pH values during the pre-incubation of enriched inoculum in 50 % JohnGrant effluent and after the decolourisation of Procion Red HE-7B.
5.4 DISCUSSION
Adaptation of microorganisms to anaerobically degrade the organic component of two textile
finishing streams, namely, a mixed kier liquor (Smith and Nephew) and a kier liquor from scouring
and bleaching of cotton linters (John Grant), was achieved. In both cases, additional carbon sources
were present with the enrichment inoculum, either as residual organics in the digester sludge or
organics in the mangrove sediment. For the Smith and Nephew kier liquor enrichments, the additional
carbon was exhausted before degradation of the kier liquor organics was initiated suggesting that the
organic compounds in the digester sludge were more labile than those in the kier liquor. In contrast,
the biomass in the John Grant enrichment digester showed a preference for the dissolved organic
carbon in the effluent suggesting that the carbon sources in the John Grant scouring effluent were
more accessible to the microorganisms than that present in the mangrove sediment. When the digester
was operated semi-continuously, 35 % of the dissolved organic carbon was degraded in the 24 h
period following addition of the effluent to the digester, although approximately 50 % of the total
DOC was not degraded in the allotted residence time (50 d). This suggested that a percentage of the
organic carbon in the John Grant scouring effluent was readily degradable, but that residual DOC
required an extended residence time to be mineralised. Consequently, the more recalcitrant
compounds accumulated in the digester, increasing DOC values in the final effluent. This problem
must be addressed before scale-up of the process can be considered.
A prolonged enrichment programme may result in microorganisms capable of degrading these
compounds. However, it is unlikely that efficient DOC removal would be achieved in a single-stage
digester unless an extended residence time was introduced or the digester was operated as a batch
reactor, as digestion of labile carbon sources would occur preferentially. A multi-stage anaerobic
digester, allowing spatial separation of microbial populations adapted to degrade various components
of the effluent would enable different residence times to be implemented for optimum removal of
DOC. This multi-stage anaerobic digester would consist of initial reactors, operating with short
residence times for degradation of the labile carbon sources and subsequent reactors, with extended
residence times to ensure mineralisation of the effluent.
5-15

Decolourisation of azo dyes in anaerobic digesters utilising textile finishing effluent as a feed source
has shown promising results. Decolourisation of Procion Red HE-7B in an anaerobic digestion
process using John Grant kier liquor as a carbon source was found to occur at a rate comparable to
that measured under standard assay conditions (Chapter Four). Azo reduction was found to be first
order with respect to dye concentration and to be inhibited by the presence of nitrate. A similar result
was obtained in experiments using glucose as an auxiliary carbon source (Chapter Four). In addition,
the inoculum had not been exposed to Procion Red HE-7B prior to these experiments which indicates
that decolourisation of Procion Red HE-7B occurs through a non-specific electrochemical reduction
mechanism in which the dye is utilised as a terminal electron acceptor by the microbial population and
is consequently reduced and decolourised. An advantages of non-specific decolourisation is that a
digester operating at a suitable redox potential with an alternative source of carbon (other than the
dyes) should be capable of reducing and decolourising a wide range of azo dyes. A disadvantage of
this non-specific mechanism of decolourisation is that azo reduction produces compounds (which may
be broadly classed as sulphonated aromatic amines) which are unlikely to be mineralised in the
anaerobic digestion process. Some aromatic amines have been found to be mutagenic (Chung, 1982)
although, as reported in Section 4.4.1, mutagenicity tests for compounds closely resembling the
degradation products of reactive textile dyes, for example, 4-amino-1-naphthalene-sulphonic acid,
1-amino-2-naphthol, anthranillic acid and sulphanilic acid, did not find these compounds to be
mutagenic. It is interesting to note that the above-mentioned compounds are sulphonated and
therefore extremely water soluble. As microbial cell walls are relatively impermeable to sulphonated
azo compounds (Meschner and Wuhrmann, 1982) this may effect the mutagenic properties of these
compounds, rendering the sulphonated compounds less mutagenic to the test bacteria than compounds
that can readily enter the microbial cells. It is, however, possible that high concentrations of these
aromatic compounds could be inhibitory to the microorganisms in a biological treatment system
which would be significant in a combined treatment system.
Design of an anaerobic digester combining treatment of organic rich textile finishing effluent with
decolourisation of azo dyes must therefore take into account the different residence times required for
efficient degradation of organic compounds which vary in their ease of biodegradation and the
minimum residence time required for decolourisation of azo dyes to prevent accumulation of dye
breakdown products in the digester. The latter would be relatively short (maximum of 2 d for a
200 mg/M solution) in comparison to that required for biodegradation of scour effluent organic
compounds or recalcitrant sizing agents. Again, a multi-stage digester may be required, the initial
stages of which would include a high rate digestion process, possibly utilising starch or starch derived
sizes as a feed source, combined with decolourisation of dye-containing streams. A fixed film reactor
may be necessary to enable a high flow rate through the system while retaining the biomass in the
reactor. The type of support medium used would be important as the dyes would probably adsorb to a
medium such as activated carbon. This could be advantageous or disadvantageous depending on the
process. The final stages of the process would consist of reactors with residence times suited to
5-16

degradation of targeted organic compounds, the design of which would depend on the residence times
required.
5.5 CONCLUSIONS
a) Anaerobic digestion of textile finishing effluents, such as those emanating from scouring and
desizing processes, can be achieved following enrichment of an adapted microbial population.
b) The varied compositions of these effluent streams could necessitate spatial separation of
specific microbial populations in a multi-stage digester to ensure efficient removal of organic
carbon.
c) Decolourisation of azo dyes in these digesters probably occurs through a non-specific
electrochemical reduction mechanism.
d) Products resulting from a zo reduction are unlikely to be mineralised in the digestion process.
These products may be inhibitory to the microorganisms if allowed to accumulate,
necessitating a high rate anaerobic digestion process for decolourisation of textile dyes.
5-17

REFERENCES
Abrahart E N (1977) Dyes and their intermediates (2nd edn). Edward Arnold Publishers, London.
Al-Bashir B, Cseh T, Leduc R and R Samson (1990) Effect of soil/contaminant interactions on the
biodegradation of naphthalene in flooded soil under denitrifying conditions. Applied Microbiology and
Biotechnology 34: 414-419.
Athanasopoulos N and T Karadimitris (1988a) Cotton yarn and fabric finishing wastewater treatment
in an upflow anaerobic filter. Biotechnology Letters 10: 443-444.
Athanasopoulos N and T Karadimitris (1988b) Effect of media design on the performance of cotton
fabric desizing and scouring wastewater treatment in upflow anaerobic filters. Resources, Conservation
and Recycling 1: 123-129.
Athanasopoulos N (1992) Cotton yarn and fabric finishing wastewater treatment using an anaerobic
expanded bed reactor. Bioresource Technology 39: 291-293.
BASF Manual (1977) Cellulosic fibres: sizing, pretreatment and dyeing. p 20-21, 41-43.
Barnes C, Foster C F and S E Hrudey (Ed.) (1992) Survey in industrial wastewater treatment (vol 2)
Petroleum and organic chemical industries. Pitman Advanced Publishing Programme.
Baughmann G L (1988) Investigating the fate of dyes in the environment. American Dyestuff Reporter
February: 19-47.
Berry D F, Francis A J and J M Bollag (1987) Microbial metabolism of homocyclic and heterocyclic
aromatic compounds under anaerobic conditions. Microbiological Reviews 51: 43-59.
Bhattacharya S K, Wang S, Angara R V, Kawai T and D F Bishop (1990) Fate and effect of azo dye
on an anaerobic-aerobic system. 44th Purdue Industrial Waste Conference Proceedings. Lewis
Publishers Inc., Chelsea, Michigan.
Brahimi-Horn M C, Lim K K, Liang S L and D G Mou (1992) Binding of textile azo dyes by
Myrothecium verrucaria. Journal of Industrial Microbiology 10: 31-36.
Brilon C, Beckmann W, Hellwig M and H J Knackmuss (1981a) Enrichment and isolation of
naphthalenesulphonic acid utilising Pseudomonads. Applied and Environmental Microbiology 42: 39-43.
R-1

Brilon C, Beckmann W and H J Knackmuss (1981b) Catabolism of naphthalenesulphonic acids by
Pseudomonas sp. A3 and Pseudomonas sp. C22. Applied and Environmental Engineering 42: 44-55.
Brown (1988) Introduction to physical chemistry. Longman group (FE) Ltd, Hong Kong.
Brown D, Hitz H R and L Schaefer (1981) The assessment of the possible inhibitory effect of dyestuffs
on aerobic wastewater bacteria: Experience with a screening test. Chemosphere 10: 245-261.
Brown D and P Laboureur (1983a) The degradation of dyestuffs Part I : Primary biodegradation under
anaerobic conditions. Chemosphere 12: 397-404.
Brown D and P Laboureur (1983b) The aerobic biodegradability of primary aromatic amines.
Chemosphere 12: 405-414.
Brown D and B Hamburger (1987) The degradation of dyestuffs: Part III - Investigation of their
ultimate degradability. Chemosphere 16: 1539-1553.
Buckley C A (1992) Membrane technology for the treatment of dyehouse effluents. Water Science and
Technology 25: 203-209.
Burkinshaw S M (1990) Applications of dyes. In : Waring D R and Hallas G. The chemistry and
application of dyes. Plenum Press, New York.
Campos C M M and C A L Chernicharo (1991) The use of the SMA-test for measuring toxicity in
anaerobic sludges. Water Science and Technology 24: 103-111.
Capalash N and P Sharma (1992) Biodegradation of textile azo dyes by Phanerochaete chrysosporium.
World Journal of Microbiology and Biotechnology 8: 309-312.
Chadrabory J N (1990) Reactive HE dyes: Chemistry, techniques and effluent problems involved.
Textile Dyer and Printer, December 26, 31-33.
Chernicharo C A L and C M M Campos (1991) A new methodology to evaluate the behaviour of
anaerobic sludge exposed to potentially inhibitory compounds. Water Science and Technology 24:
201-210.
Chung K T, Fulk G E and M Egan (1978) Reduction of azo dyes by intestinal anaerobes. Applied and
Environmental Engineering 35: 558-562.
R-2

Chung K (1983) The significance of azo reduction in the mutagenesis and carcinogenesis of azo dyes.
Mutation Research 114: 269-287.
Cripps C, Bumpus J A and S D Aust (1990) Biodegradation of azo and heterocyclic dyes by
Phanerochaete chrysosporium. Applied and Environmental Microbiology 56: 1114-1118.
Dubin P and K L Wright (1975) Reduction of azo food dyes in cultures of Proteus vulgaris.
Xenobiotica 5: 563-571.
Ecological and Toxicological Association of the Dyestuffs Manufacturing Industry (1982) Ecological
Method No. 105. A screening test for assessing the primary anaerobic biodegradability of water-soluble
dyestuffs.
Evans W C (1977) Biochemistry of the bacterial catabolism of aromatic compounds in anaerobic
environments. Nature 270: 17-22.
Fung D Y C and R D Miller (1973) Effect of dyes on bacterial growth. Applied Microbiology 25:
793-799.
Garcia-Valdes E, Cozar E, Rotger R, Lalucat J and J Ursing (1988) New naphthalene degrading
marine Pseudomonas strains. Applied and Environmental Microbiology 54: 2478-2485.
Ganesh R, Boardman G D and D Michelson (1992) Fate of azo dyes in sludges. Submitted for
publication in Journal of Environmental Engineering, July 1992.
Gingell R and R Walker (1971) Mechanisms of azo reduction by Streptococcus faecalis II. The role of
soluble flavines. Xenobiotica 1: 231-239.
Glenn J K and M H Gold (1983) Decolourisation of several polymeric dyes by the lignin degrading
basidiomycetes Phanerochaete chrysosporium. Applied and Environmental Microbiology 45: 1741-1747.
Godefroy S (1993) The structure and reactivity of reactive dyes. Annexure Two to the Steering committee
report for the Water Research Commission, Project no. 456, The regional treatment of textile and
industrial effluent. June 7 1993.
Gregory P (1990) Classification of dyes by chemical structure. In : Waring D R and Hallas G. The
chemistry and application of dyes. Plenum Press, New York.
Groves G R, C A Buckley and A E Simpson (1990) A guide for the planning, design and
implementation of wastewater treatment plants in the textile industry. Part Three: Closed loop treatment /
R-3
recycle options for textile scouring, bleaching and mercerising effluents, p 2-7 to 2-10. Water Research
Commision, Pretoria.
Guoqing W U, Hengli D U, Chang L and N Zhiqing (1990) A study of decolourising dyestuffs by
utilization of purple nonsulphur photosynthetic bacteria. Water Treatment 5: 463-473.
Hallas L E and M Alexander (1983) Microbial transformation of nitroaromatic compounds in sewage
effluent. Applied and Environmental Microbiology 45: 1234-1241.
Harmer C and P Bishop (1992) Transformation of azo dye AO-7 by wastewater biofilms. Water
Science and Technology 26: 627-636.
Hart O O, Groves G R, Buckley C A and B Southworth (ed.) (1983) A guide for the planning, design
and implementation of wastewater treatment plants in the textile industry. Part One: Closed loop
treatment/recycle system for textile sizing/desizing effluents, p 19 - 26. Water Research Commission,
Pretoria.
Haug W, Schmidt A, Nortemann B, Hempel D C, Stolz A and H J Knackmuss (1991) Mineralisation
of the Sulphonated Azo Dye Mordant Yellow 3 by a 6-Aminonaphthalene-2-Sulphonate Degrading
Bacterial Consortium. Applied and Environmental Microbiology 57: 3144-3149.
Heiss G S, Gowan B and E R Dabbs (1992) Cloning of DNA from a Rhodococcus strain conferring the
ability to decolourise sulphonated azo dyes. FEMS Microbiology Letters 99 : 221-226.
Holford I C R. (1974) Surface chemistry of soil particles. Journal of Soil Science 25: 242.
Horitsu H, Takada M, Idaka E, Tomoyeda M and T Ogawa (1977) Degradation of p-
aminoazobenzene by Bacillus subtilis. European Journal of Applied Microbiology and Biotechnology 4:
217-224.
Horowitz A D, Shelton D R, Cornell C P and J M Tiedjie (1982) Anaerobic degradation of aromatic
compounds in sediment and digested sludge. Developments in Industrial Microbiology 23: 435-434.
Hu T L (1992) Sorption of reactive dyes by Aeromonas biomass. Water Science and Technology
26: 357-366.
Idaka E and T Ogawa (1978) Degradation of azo compounds by Aeromonas hydrophila var. 24B.
Journal of the Society of Dyers and Colourists 94: 91-94.
Idaka E, Ogawa T, Horitsu H and C Yatome (1982) Degradative pathway of P-aminoazobenzene by
Bacillus sutbtilis. European Journal of Applied Microbiology and Biotechnology 15: 141-143.
R-4

Jinqui L and L Houtian (1992) Degradation of azo dyes by algae. Environmental Pollution 75: 273-278.
Kremer F V (1989) Anaerobic degradation of monoazo dyes. PhD Thesis, Department of Civil and
Environmental Engineering, University of Cincinnati.
Kuhn E P and J M Suflita (1989) Microbial degradation of nitrogen, oxygen and sulfur heterocyclic
compounds under anaerobic conditions: Studies with aquifer samples. Environmental Toxicology and
Chemistry 8: 1149-1158.
Kulla H G (1981) Aerobic bacterial degradation of azo dyes. In: Microbial Degradation of Xenobiotic
and Recalcitrant Compounds, Leisinger T et al. (ed). Academic Press, London.
Kulla H G, Klausener F, Meyer U, Ludeke B and T Leisinger (1983) Interference of aromatic sulpho
groups in the microbial degradation of the azo dyes Orange I and Orange II. Archives of Microbiology
135: 1-7.
Larsen J C, Meyer T and R R Scheline (1976) Reduction of sulphonated water soluble azo dyes by
caecal microorganisms from the rat. Acta Pharmacology et Toxicology 38: 353-357.
Licis I J, Skovronek H and M Drabkin (1991) Industrial pollution prevention opportunities for the
1990's. EPA Project Summary, EPA/600/S8-91/052. Risk Reduction, Engineering Laboratory,
Cincinnati OH 45268.
Loyd C K, Boardman G D and D L Michelson (1992) Anaerobic/aerobic treatment of a textile dye
wastewater. Pre-printed for Mid-Atlantic Industrial Waste Conference, July 15-17, Morgantown, WV.
Luther M and C J Soeder (1991) 1-Naphthalenesulfonic acid and sulfate as sulfur sources for the green
algae Scenedesmus obliquus. Water Research 25: 299-307.
Marte W and W Keller (1991) Anaerobe entsorgung textiler teilstrome. Textilveredlung 26: 224-230.
McCarty P L (1974) Anaerobic Processes. Presented at the Birmingham Short Course on Design
Aspects of Biological Treatment, International Association of Water Pollution Research, Birmingham,
England.
McCurdy M W, Boardman G D, Michelsen D L and R M Woodby (1991) Chemical reduction and
oxidation combined with biodegradation for the treatment of a textile dye wastewater. 46th Purdue
Industrial Waste Conference, May 1991.
R-5

Mechsner K and K Wuhrmann (1982) Cell permeability as a rate limiting factor in the microbial
reduction of sulphonated azo dyes. European Journal of Microbiology and Biotechnology 15: 123-126.
Meyer U (1981) Biodegradation of synthetic organic colourants. In: Microbial Degradation of Xenobiotic
and Recalcitrant Compounds, Leisinger T et al. (ed). Academic Press, London.
Michaels G B and D L Lewis (1985) Sorption and toxicity of azo and triphenylmethane dyes to aquatic
microbial populations. Environmental Toxicology and Chemistry 4: 45-50.
Michaels G B and D L Lewis (1986) Microbial transformation rates of azo and triphenylmethane dyes.
Environmental Toxicology and Chemistry 5: 161-166.
Mihelcic J R and R G Luthy (1988) Degradation of polycyclic aromatic hydrocarbons under various
redox conditions in soil-water systems. Applied and Environmental Microbiology 54: 1182-1187.
Mihelcic J R and R G Luthy (1991) Sorption and microbial degradation of naphthalene in soil water
suspensions under denitrification conditions. Environmental Science and Technology 25: 169-177.
Michelsen D L, Powell W W, Woodby R M, Fulk L L and G D Boardman (1992) Pretreatment of
textile dye concentrates using fentons reagent and ozonation prior to biodegradation. Preprint for AATCC
International Conference and Exhibition, Atlanta, GA, October 4-6 1992.
Mohr U K (1992) Textile treatments and ecological aspects in future South Africa. Textile Industries
Dyegest SA (May): 3-6.
Mou D G, Lim K K and H P Shen (1991) Microbial agents for the decolourisation of dye wastwater.
Biotech. Adv. 9: 613-622.
Ogawa T, Idaka E and C Yatome (1981) Influence of azo dye on synchronised cells of Bacillus subtilis.
Bull. Environm. Contam. Toxicol. 26: 38-41.
Ogawa T, Yatome C, Idaka E and H Kamiya (1986) Biodegradation of azo acid dyes by continuous
cultivation of Pseudomonas cepacia 13NA. Journal of the Society of Dyers and Colourists 102: 12-14.
Ogawa T, Shibata M, Yatome C and E Idaka (1988) Growth inhibition of Bacillus subtilis by basic
dyes. Bulletin. Environ. Contam. Toxicol. 40: 545-552.
Ogawa T, Fuji H, Kawai K, Yatome C and E Idaka (1989) Growth inhibition of Bacillus subtilis upon
interaction between basic dyes and DNA. Bulletin Environ. Contam. Toxicol. 42: 402-408.
R-6

Ogawa T and C Yatome (1990) Biodegradation of azo dyes in multistage rotating biological contactor
immobilized by assimilating bacteria. Bulletin Environ. Contam. Toxicol. 44: 561-566.
Owen W F, Stuckey D C, Healy J B, Young L Y and P L McCarty (1979) Bioassay for monitoring
biochemical methane potential and anaerobic toxicity. Water Research 13: 485-492.
Pasti-Grigsby M B, Paszczynski A, Goszczynski S, Crawford D L and R L Crawford (1992)
Influence of aromatic substitution patterns on azo dye degradability by Streptomces spp. and
Phanerochaete chrysosporium. Applied and Environmental Microbiology 58: 3605-3613.
Pagga U and D Brown (1986) The degradation of dyestuffs: Part II - Behaviour of dyestuffs in aerobic
biodegradation tests. Chemosphere 15: 479-491.
Paszczynski A, Pasti-Grigsby M B, Goszczynski S, Crawford D L and R L Crawford (1992)
Mineralisation of sulphonated azo dyes and sulphanilic acid by Streptomces spp. and Phanerochaete
chrysosporium. Applied and Environmental Microbiology 58: 3598-3604.
Porter J J and E H Snider (1976) Long-term biodegradability of textile chemicals. Journal of the Water
Pollution Control Federation 48: 2198-2210.
Powell W W, Michelsen D L, Boardman G D, Dietrich A M and R M Woodby (1992) Removal of
colour and TOC from segregated dye discharges using ozone and fentons reagent. Chemical Oxidation for
the Nineties, 2nd International Symposium, February 1992.
Rahmen R A (1991) Factor analysis for identification of most influential variables for the growth of
biodecolourisation cultures. Environmental Technology 12: 609-615.
Ronen Z and J M Bollag (1991) Pyridine metabolism by a denitrifying bacterium. Canadian Journal of
Microbiology 37: 725-729.
Schluter K (1990) Ecological evaluation of sizing agents. Melliand Textilberichte 71: 195.
Schnell S and B Schink (1991) Anaerobic aniline degradation via reductive deamination of
4-aminobenzoyl-CoA in Desulfobacterium anilini. Archive of Microbiology 155: 183-190.
Shaul G, Dempsey C R, Dostal K A and R J Lieberman (1986) Fate of azo dyes in the activated
sludge process. 41st Purdue Industrial Waste Conference Proceedings. Lewis Publishers Inc., Chelsea,
Michigan.
R-7

Shaul G M, Dempsey C R and K A Dostal (1988) Fate of water soluble azo dyes in the activated sludge
process. EPA Project Summary, EPA/600/S2-88/030. Water Engineering, Research Laboratory,
Cincinnati, OH 45268.
Shelton D R and J M Tiedjie (1984) General method for determining anaerobic biodegradation potential.
Applied and Environmental Microbiology 47: 850-857.
Sleat P and J P Robinson (1984) The bacteriology of anaerobic degradation of aromatic compounds.
Journal of Applied Bacteriology 57: 381-394.
Spain J C and P A Van Veld (1983) Adaptation of natural microbial communities to degradation of
xenobiotic compounds: Effects of concentration, exposure time, inoculum and chemical structure.
Applied and Environmental Microbiology 45: 428-435.
Stanier R Y, Ingraham J L, Wheelis M L and P R Painter (1987) General Microbiology (5th edn).
Macmillan Education Limited, London.
Straley J P (1984) Selected bacterial cultures for textile wastewaters. American Dyestuff Reporter,
September: 46-57.
Tarvin D and A M Buswell (1934) The methane fermentation of organic acids and carbohydrates.
Journal of the American Chemical Society 56: 1751-1755.
Trotman E R (1968) Textile scouring and bleaching, p 102-103. Charles Griffin and Company Limited,
London.
Walker R and R Gingell (1971) Mechanisms of azo reduction by Streptococcus faecalis. I. Optimisation
of assay conditions. Xenobiotica 1: 221-229.
Weber E J and N L Wolfe (1987) Kinetic studies of the reduction of aromatic azo compounds in
anaerobic sediment/water systems. Environmental Toxicology and Chemistry 6: 911-919.
Weisburger J H and E K Weisburger (1966) Chemicals as causes of cancer. Chemical and Engineering
News February 7: 125-143.
Wilcox W W, Oldham N D and H L Rammer (1971) Bacterial degradation of dye used in incense cedar
pencil slats. Forest Products Journal 21: 50-52.
R-8

Wuhrmann K, Meschsner K L and T H Kappeler (1980) Investigation on rate determining factors in
the microbial reduction of azo dyes. European Journal of Applied Microbiology and Biotechnology 9:
325-338.
Yatome C, Ogawa T, Itoh K, Sugiyama A and E Idaka (1987) Degradation of azo dyes by cell-free
extracts from Aeromonas hydrophilia var. 24B. Journal of the Society of Dyers and Colourists 103:
395-398.
Yatome C, Ogawa T, Hishida H and T Taguchi (1990) Degradation of azo dyes by cell-free extracts
from Pseudomonas stutzeri. Journal of the Society of Dyers and Colourists 106: 280-282.
Yatome C, Ogawa T and H Hayashi (1991) Microbial reduction of azo dyes by several strains. Journal
of Environmental Science and Health A26 : 471-485.
Zaoyan Y, Ke S, Guangliang S, Fan Y, Jinshan D and M Huanian (1992) Anaerobic-aerobic treatment
of a dye wastewater by combination of RBC with activated sludge. Water Science and Technology 9:
2093-2096.
Zimmermann T, Kulla H G and T Leisinger (1982) Properties of the purified Orange II azoreductase,
the enzyme initiating azo dye degradation by Pseudomonas KF46. European Journal of Biochemistry
129: 197-203.
Zurrer D, Alasdair M C and T Leisinger (1987) Microbial desulfonation of substituted
naphthalenesulfonic acids and benzenesulfonic acids. Applied and Environmental Microbiology 53:
1459-1463.
R-9

APPENDIX A
CLASSIFICATION OF DYES
In general dyes consist of two basic components: the chromogen (electron acceptor) and the
auxochrome (electron donor) which regulates solubility and dyeing. The chromogen is an aromatic
body containing a colour-giving group called a chromophore. The chromophore causes colour by
altering absorption bands in the visible region. Some common chromophores are presented in
Table A.1.
-C=S; -C-S-S-C-carbon-sulphur groups
-C=NH; CH=N-carbon-nitrogen group
-C=O-carbonyl group
-C=C-ethylene group
-N=N-azo group
NO2 or (=N-OOH)nitro
NO or (=N-OH)nitroso
Table A.1 : The structure of some common dye chromophores
Dyes may be classified according to their chromophoric structure or alternatively, by their application.
Neither system of classification is satisfactory by itself as the same chromophoric system may be
present in dyes differing widely in usage and application, since the presence or absence of solubilising
groups, proton-accepting groups, long-chain alkyl groups, etc., are the factors which determine dyeing
characteristics and suitability for a particular purpose (Abrahart, 1977).
A.1 THE COLOUR INDEX
The following is an excerpt from Burkinshaw S.M (1990).
The colour index is the internationally accepted catalogue of dyes and pigments. The first edition,
published in 1924, used chemical constitution as the basis for classification of dyes and pigments. The
second (1951) and third (1971) and the current revised third editions (1976; 1981 and 1987) classify
colourants according to :
a) Constitution, for the chemist requiring information on chemical structure, preparative methods,
etc.
b) Application, for the user seeking information on commercial products, dyeing properties, etc.
Table A.2 gives the Colour Index (C.I) classification of colorants, according to application and
constitution.
A-1

Inorganic colouring matters
Oxidiation bases
Natural organic colouring matters
Phthalocyanine
Indigoid
Anthraquinone
Hydroxyketone
Aminoketone
Lactone
SulphurVat dyes
ThiazineSulphur dyes
OxazineSolvent dyes
AzineReducing agents
IndophenolReactive dyes
IndaminePigments
ThiazoleOxidation bases
MethineNatural dyes
QuinolineMordant dyes
AcridineLeather dyes
XantheneIngrain dyes
Triaryl methaneFood dyes
DiphenylmethaneFluorescent brightening agents
CarotenoidDisperse dyes
StilbeneDirect dyes
AzoicDevelopers
AzoBasic dyes
NitroAzoic colouring matters
NitrosoAcid dyes
ConstitutionApplication
Table A.2 : C.I. classification of colourants
The revised third edition of the Colour Index consists of several volumes :
Volumes 1 to 3 classify colourants according to application type. Each colouring matter within each of
the nineteen classes is ascribed a Colour Index Generic Name according to hue, e.g., CI Acid Red 11,
CI Reactive Yellow 16, etc.
Volume 4 divides colourants
Volume 5 includes :
a) An index of commercial names in alphabetical order. Since colourants are given a variety of
commercial names which may disguise the fact that one colourant is sold under different
names by different manufacturers, for each commercial product the CI Generic Name and CI
Constitution Number is provided (if the colourant structure has been declared) so as to permit
equivalent products to be identified.
A-2

b) An index of CI Generic Names, each entry including the corresponding commercial name to
allow the identification of equivalent products.
c) An index of manufacturers of colourants.
Volume 6 is the first (1976) supplement to volumes 1 to 4.
Volume 7 is the second (1982) suplement to volumes 1 to 4 and a supplement to volume 6.
Volume 8 is the third (1987) supplement to volumes 1 to 4 and a supplement to volume 7.
A.2 DYES IN THE TEXTILE INDUSTRY
Textile dyes are usually classified according to application and will be described accordingly in this
section, however, as the azo chromophore is the single most important chromophore represented
throughout the application classes of textile dyes, the chemically classified group of azo dyes will also
be described briefly.
Azo dyes (Gregory, 1990)
These dyes are the most important class, accounting for over 50 % of all commercial dyes. Azo dyes
contain at least one azo group (-N=N-) (monoazo) but can contain two (disazo), three (trisazo), or
more rarely, four azo groups (polyazo). The azo group is attached to two radicals of which at least
one, but usually both, are aromatic.
A-NN-E
In the monoazo dyes, which are the most important group, the A radical contains electron-accepting
groups and the E radical contains electron-donating groups, particularly hydroxy and amino groups. If
the azo dyes contain only aromatic radicals they are known as carbocyclic or homocyclic azo dyes. If
they contain one or more heterocyclic radicals, they are know as heterocyclic azo dyes.
Classification according to applicationAcid dyes (Burkinshaw, 1990)
The majority of these dyes are soluble in water, solubility being conferred by the presence of
sulphonic acid groups on the dye, usually in the form of a sodium salt (-SO3Na). The dyes are
insoluble in acid and therefore acidic conditions are used for dyeing to achieve good exhaustion in
dyeing of wool and nylon. Generally, the lower the natural affinity of the dyes for the fibers, the more
acidic the dyeing conditions, and visa versa. Process chemicals (dyeing auxillaries) that are associated
with acid dyeing are: sulphuric acid, acetic acid, sodium sulphate and surfactants.
There are nine chemical classes of nonmetallised acid dye of which three are the most important :
a) Azo. This class constitutes by far the largest number of acid dyes, and includes the majority of
red, yellow, orange, brown and black hues. The dyes range from relatively simple monoazo
A-3
dyes that generally possess low affinity for wool and nylon, to larger molecular weight dyes to
which high affinity is imparted by the presence of alkyl chains.
b) Anthraquinoid. These acid dyes provide a range of mostly bright blues, violets, and greens
and have good all round fastness properties on wool and nylon fibres.
c) Triphenylmethane. These dyes provide brilliant violets, blues and greens of relatively low
all-round fastness on wool and nylon.
Azoic Dyes (Burkinshaw, 1990)
An azoic colouring matter is a water-insoluble azo compound produced in situ in textile fibres by the
interaction of a diazo component with a coupling component. Azoics are principally used for dyeing
cellulosic fibres on which they provide a wide range of bright hues, excluding greens and bright
blues. Navies and blacks may also be achieved with azoic dyeing. Auxiliary chemical associated with
azoic dyeing are: metal salts, formaldehyde, sodium hydroxide, sodium nitrate and acids.
Basic Dyes (Burkinshaw, 1990)
These are amino and substituted amino compounds that are soluble in acid and become insoluble
when alkali is added. They are used to dye acrylics or can be used with a mordant dye for dyeing
wool and cotton. Auxiliary chemicals associated with basic dyeing are acetic acid and softening
agents.
Direct Dyes (Burkinshaw, 1990)
Direct dyes can dye cotton and viscose rayon directly from a neutral dyebath containing sodium
chloride, which decreases the solubility of the dyes. Direct dyes are relatively inexpensive and
provide a wide range of hues, however, they are characterised by poor fastness especially with respect
to washing,, a property that can be improved by aftertreatments. Auxiliary chemicals associated with
direct dyeing are: sodium salts, fixing agents and metal salts (copper or chromates). Fibre-reactive
dyes have largely replaced direct dyes for dyeing of cotton. Direct dyes belong to several chemical
classes, the following are the most important :
a) Azo. The majority of direct dyes are of the disazo, trisazo and polyazo types.
b) Phthalocyanine. These bright blue and turquoise dyes possess high fastness to light but low
fastness to wet treatments on cotton.
c) Stilbene. This is a relatively small but important group of mostly red, yellow and orange dyes.
Disperse Dyes (Burkinshaw, 1990)
A disperse dye is defined as a substantially water-insoluble dye having substantivity for one or more
hydrophobic fibres, for example, cellulose acetate, and usually applied from fine aqueous dispersion.
In addition to acetate fibres, the dyes are used on polyester, polyamide and acrylic fibres. Auxiliary
A-4

chemicals associated with disperse dyeing are: carrier, sodium hydroxide and sodium hydrosulphite.
Disperse dyes belong to the azo, anthraquinone, nitrodiphenylamine and styryl groups.
Fibre Reactive Dyes (Godefroy, 1993)
Reactive dyes are coloured components capable of forming a covalent bond between the dye molecule
and the fibre. Fibre reactive dyes have been developed for wool and polyamide but the major success
in this field has been the application to cotton and cotton blends. Auxiliary chemical associated with
reactive dyeing are: sodium chloride, sodium hydroxide and ethylene diamine.
The structure of a fibre-reactive dye is essentially divided into two parts, the chromogen and the
reactive system. It is convenient to consider them separately as many chromogens are common to
several dye ranges and only the reactive systems differ.
The reactive system is the component of the dye that reacts with the fibre. Reactive systems can be
divided into :
a) Heterocyclic reactive systems. These heterocyclic ring structures all contain nitrogen atoms
and are usually based on the s-triazine, pyrimidine and pyrimazone ring structures. The most
commonly used displaceable substituent is chlorine, but success has been achieved with
fluorine, quaternary amines and methyl sulphonyl groups.
The monchloro-s-triazine dyes contain one monochloro-s-triazine reactive group and are
characterised by fairly low exhaustion. This is improved by the incorporation of two
monochloro-s-triazinyl rings into the dye molecule, thus providing two opportunities for
reaction with the fibre and improving the exhaustion process. An example of this type of dye is
Procion Red HE-7B. There are many other types of heterocyclic reactive systems but these will
not be covered in this appendix.
These reactive systems react with ionised hydroxyl groups on the cellulose substrate by a
nucleophillic substitution mechanism. Alkaline conditions are required for the ionisation of the
fibre and, therefore, hydroxyl ions are present and compete with the ionised cellulose as a
nucleophillic reagent. This results in hydrolysed dyes which can no longer react with the
cellulose fibre and accounts for the low levels of exhaustion achieved with some reactive dyes.
b) Reactive systems based on nucleophillic addition. These reactive systems interact with the
cellulose fibre by means of a nucleophillic addition mechanism.
The chromophores used for reactive dyes are the following :
a) Azo. These may be divided into those dyes which have aromatic radicals based on benzene
and naphthalene ring structures to give yellow, red, blue and green shades, and those azo dyes
where the radicals contain heterocyclic compounds. When the heterocyclic coupling agents are
indoles, pyrazolones and pyridones, yellow to orange shades are achieved, and when
heterocyclic diazo compounds with either sulphur or sulphur and nitrogen are used, strong
shades of blue to green are obtained.
A-5
b) Anthraquinone. These dyes give bright colours with good fastness and are used for strong
shades from blue to green.
c) Phthalocyanine. These are used for the production of turquoise hues which cannot be
prepared from azo or anthraquinone dyes.
Mordant Dyes (Burkinshaw, 1990)
The term mordant dye refers to a dye which is applied to a fibre in conjunction with a metallic
mordant (often chromium). Characteristically, mordant dyes contain groups (e.g., -OH, -COOH)
which are capable of forming a stable coordination complex with a chromium ion inside the fibre. The
formation of this large molecular weight complex results in an often dramatic increase in fastness of
the dyeing to light and wet treatments. Mordant dyes give fast, full, but generally dull shades on wool
and nylon fibres. Auxiliary chemicals associated with mordant dyeing are: chromium and other metal
salts, acetic acid and sodium sulphate.
The following chromophores are associated with mordant dyes:
a) Azo. This group, consisting mainly of monoazo dyes, comprises the majority of mordant dyes
and, with the exception of bright greens, blues and violets, provides a comprehensive range of
shades on wool and nylon. These are characterised by very high fastness to light and wet
treatments.
b) Anthraquinone. Provides mostly blues, reds and browns.
c) Triphenylmethane. Provides mostly bright violets and blues and are characterised by
moderate fastness to light wool and nylon.
d) Xanthene. This group contributes a very small number of brilliant, mostly red ,dyes.
Sulphur Dyes (Burkinshaw, 1990)
Sulphur dyes are used for the dyeing of cellulosic fibres in medium to deep shades of generally dull
brown, black, olive, blue, green, maroon and khaki hues. These dyes are chemically complex and for
the most part are of unknown structure, the majority of which are prepared by thionation of various
aromatic intermediates. Auxiliary chemicals associated with sulphur dyeing are: sodium sulphide and
other salts, and acetic acid.
Vat dyes (Burkinshaw, 1990)
These are water-insoluble dyes which contain at least two conjugated carbonyl groups that enable the
dye to be converted, by means of reduction under alkaline conditions, into the corresponding
water-soluble ionised leuco compound. It is in this form that the dye is adsorbed by the substrate.
Subsequent oxidation of the leuco compound in situ regenerates the parent insoluble vat dye within
the fibre. The dyed material is then soaped in order to develop the true hue and optimum fastness
properties of the dyeing. The principle use of vat dyes is in the dyeing of cellulosic fibres on which
they provide a very wide range of hues that are generally of outstanding all-round fastness. Auxiliary
A-6

chemicals associated with vat dyeing are: sodium hydroxide, sodium hydrosulphite and other salts,
and sufractants. The chemical classes of vat dyes may be divided into Indigoid and Thioindigoid, and
Anthraquinone which is the largest and most important class of vat dyes.
A-7

APPENDIX B
LIST OF DYES REFERRED TO IN LITERATURE REVIEW
Appendix B lists the dyes discussed in the literature reviews in Chapters Two and Three. Dyes referred to by
the Colour Index classification numbers are listed under CI ---, in alphabetical order. All other dyes are
listed in alphabetical order.
NNH2
SO3Na
N N N
SO3Na
NH2Disazo dyeCongo Red
N
SN NCH3CH3
CH3H+
Cl-Heterocyclic dyeAzure B
N N N
NaO3S SO3Na
OH NH2N NO2
Disazo dyeAmido Black
N
SO3Na
N
SO3NaNaO3S
OH
Monoazo dyeAmaranth
Structure not given in paperAzo dyeAllura Red
StructureDescriptionDye name
B-1

N N
HO
-O3S
SO3-
Monoazo dyeCI Acid Orange 10
N-O3S
CH3 HO
N
Monoazo dyeCI Acid Orange 8
N-O3S N
HOMonoazo dyeCI Acid Orange 7
NNaO3S N
HO
OHMonoazo dyeCI Acid Orange 6
N
-O3S
N N N NH
SO3-
Disazo dyeCI Acid Blue 113
Structure not given in paperAnthraquinonedye
CI Acid Blue 80
NO2N N
-O3S
NH2
N
SO3-
OH
N
Disazo dyeCI Acid Black 1
NO2N NN N
NH2
NAO3S SO3Na
OHDisazo dye10 B (H/C)
B-2

HO
NN-O3S N N
Disazo dyeCI Acid Red 151
N-O3S
HO
N
Monoazo dyeCI Acid Red 88
N-O3S
HO
-O3S
SO3-
N
Monoazo dyeCI Acid Red 18
N-O3S N
SO3-
OHMonoazo dyeCI Acid Red 14
N N
-O3S SO3-
NH-CO-CH3OHMonoazo dyeCI Acid Red 1
NNaO3S N OH
Monoazo dyeCI Acid Orange 20
N N
HOMonoazo dyeCI Acid Orange 12
B-3
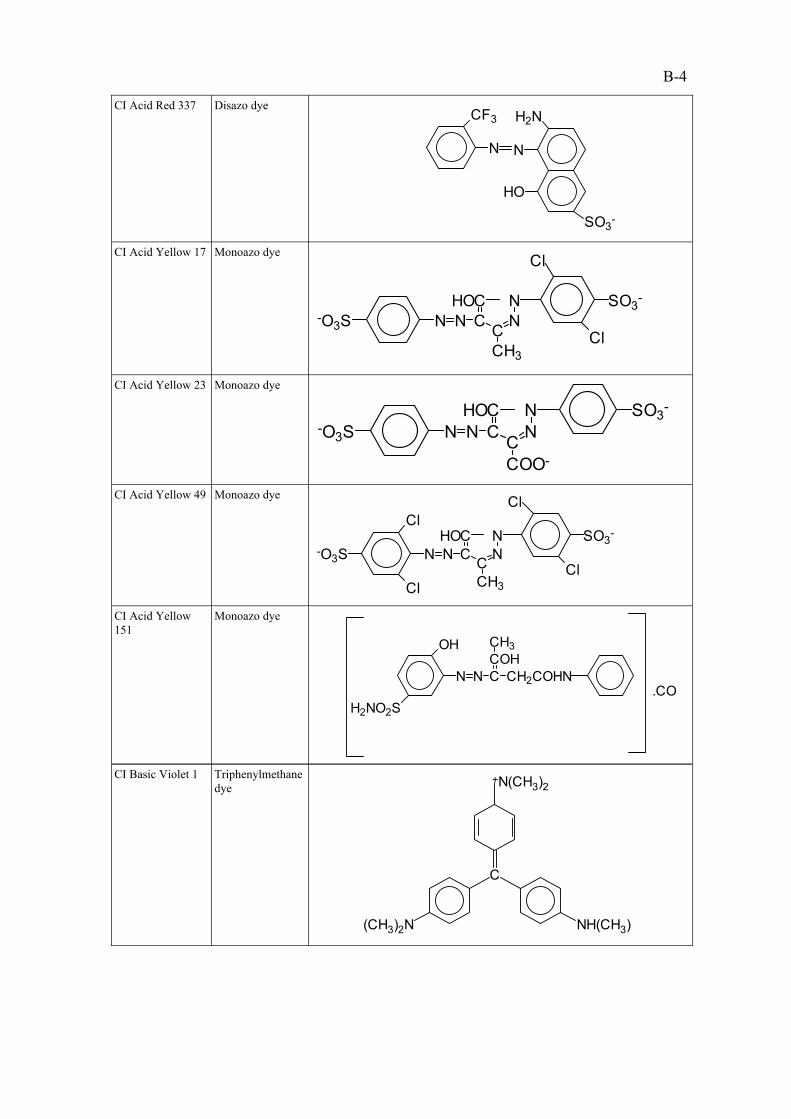
(CH3)2N NH(CH3)
C
+N(CH3)2Triphenylmethanedye
CI Basic Violet 1
N N CCOHCH3
CH2COHN
OH
H2NO2S.CO
Monoazo dyeCI Acid Yellow151
N N CC
C NN
-O3S
Cl
Cl CH3
SO3-
Cl
Cl
HO
Monoazo dyeCI Acid Yellow 49
N N CC
C NN
-O3S
COO-
SO3-HOMonoazo dyeCI Acid Yellow 23
N N CC
CCH3
NN
-O3S
Cl
Cl
SO3-HO
Monoazo dyeCI Acid Yellow 17
N
CF3
N
SO3-
HO
H2NDisazo dyeCI Acid Red 337
B-4

NaO3S
NH
ClN
N
N
NH
SO3Na
N N
SO3Na
SO3NaNH OH
N
SO3NaNaO3S
N
N
NCl
NHN
SO3Na
SO3Na
CI Reactive Red141
-O3SS
N
3HC N N CS
N
SO3-
CH3C
Monoazo dyeCI Direct Yellow28
NHO N CH
SO3-
NHC
-O3S
N OH
Disazo dyeCI Direct Yellow 4
N-O3S N N
OCH3
H3C
NNH
-O3S
HODisazo dyeCI Direct Violet 9
Structure not given in paperDisazo dyeCI Direct Red 7
N
N
N
OH NH2
SO3--O3S
OH NH2
SO3--O3S
N
Disazo dyeCI Direct Blue 6
(CH3)2N NH(CH3)
C
+N(CH3)2Cl -Triphenylmethanedye
CI Basic Violet 3
B-5

COOHOH
N
SO3H
N
Monoazo dyeMordant Yellow 3
Structure not given in paperAzo dyeMethyl Orange
Structure not given in paperFast Red E
OH OH
NaO3S
NN
SO3Na
HO
Cl
Azo DyeEriochrome BlueSE
NNaO3SOCH2CH2SO2
NNaO3SOCH2CH2SO2
SO3
SO3
N
N
HO
H2N
Reactive azo dye
Commercial nameis Remazol BlackGFA
CI Reactive Black5
Structure not given in paperAzo dyeCI Reactive RedX-3B
NNaO3SOCH2CH2SO2 SO3
SO3
N
HO
HNN
NNCl
X
Reactive monoazodye
CI Reactive Red198
B-6

NH NH3+
NO2
SO3-
Polymeric dyePoly Y
NH
O
O
NH
NH
CH3
SO3Na
Ac
n
Polymeric dyePoly R
NH2
NH
O
O NH SO3Na
SO3Na
Ac
n
Polymeric dyePoly B
N N NH2
p-Aminoazobenzen
OH
N N SO3Na
Azo dyeOrange II
Remazol Black GFA (see CI Reactive Black 5)
Remazol Red RB (see CI Reactive Red 198)
Remazol Golden Yellow - Structure not given in paperMixture of 3reactive dyesRemazol Goldenyellow RNL,Remazol red RBand RemazolBlack GFA.
Navy 106
B-7
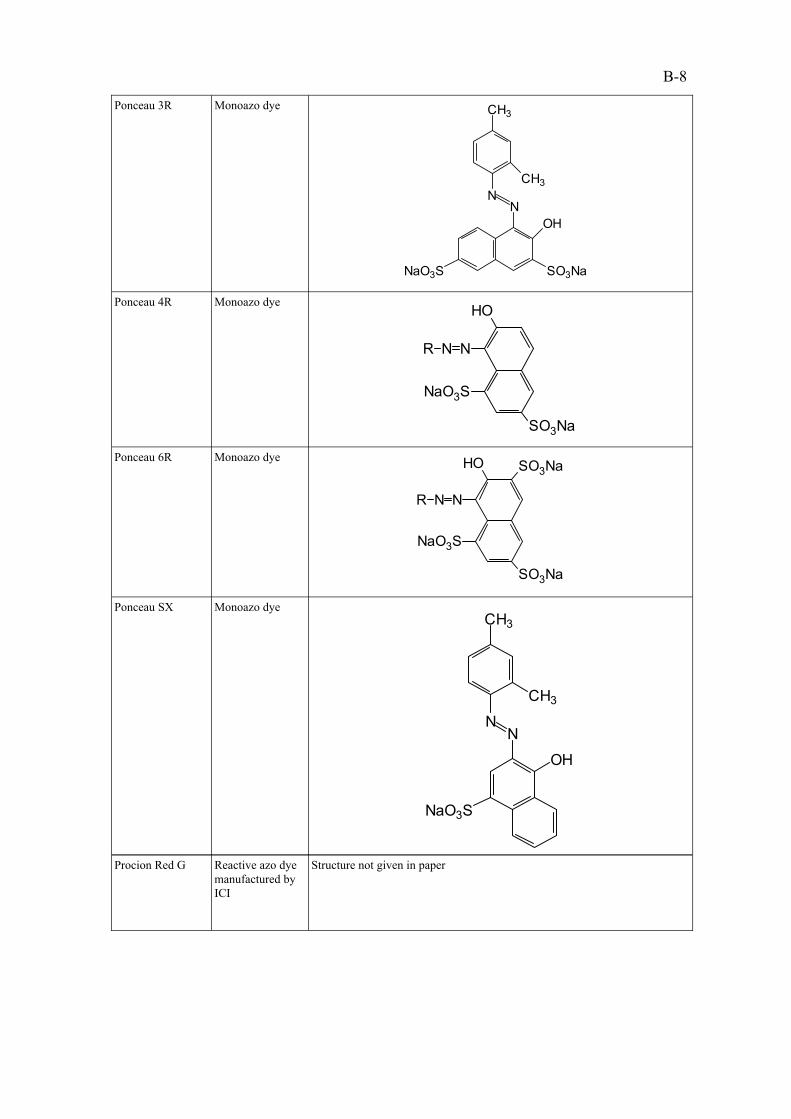
Structure not given in paperReactive azo dyemanufactured byICI
Procion Red G
NN
CH3
CH3
OH
NaO3S
Monoazo dyePonceau SX
HO
NNR
SO3Na
NaO3S
SO3NaMonoazo dyePonceau 6R
HO
NNR
SO3Na
NaO3S
Monoazo dyePonceau 4R
NOH
SO3NaNaO3S
N
CH3
CH3
Monoazo dyePonceau 3R
B-8

SO3Na
NN
N
HOOC OH
SO3Na
N
Monoazo dyeTartrazine
SO3Na
NN
OH
NaO3S
Monoazo dyeSunset Yellow
H3C
NN
SO3Na
SO3Na
NN O
CH3
N O2S
CH3
Disazo dyeRS (H/C)
NNOH
NaO3S SO3Na
NHCOCH3Monoazo dyeRed 2G
HN
CHNaO3S
N
NCONH2
N
NaO3S SO3Na
SO3Na
H
NaO3S
HN
CH
N
NN
Cl
N
N
N
NN
H
N
NHCONH2
N
NaO3S
SO3Na
SO3Na
H
Reactive azo dyeReactofix GoldenYellow
B-9

NNaO3S N
OH
OH
Monoazo dyeTropeolin O
B-10

Mixture of 3reactive dyesRemazol yellow,Remazol red andRemazol blue.
Navy 106
Reactive Black 5
NaO3S
NH
ClN
N
N
NH
SO3Na
N N
SO3Na
SO3NaNH OH
N
SO3NaNaO3S
N
N
NCl
NHN
SO3Na
SO3Na
CI Reactive Red141
-O3SS
N
3HC N N CS
N
SO3-
CH3C
CI Direct Yellow28
NHO N CH
SO3-
NHC
-O3S
N OHCI Direct Yellow 4

APPENDIX C
STANDARD ASSAY CONDITIONS FOR MEASUREMENT OF
PROCION RED HE-7B DECOLOURISATION
C.1 INTRODUCTION
A number of experiments were made in order to determine the most satisfactory conditions for
measurement of Procion Red HE-7B decolourisation rates. The rationale behind some of the
conditions prescribed for the standard assay, as described in Section C.2, are briefly described in this
introductory section.
Although decolourisation of Procion Red HE-7B was found to occur when no supplemental carbon
source was added, this was a slow method and the results were difficult to replicate. The literature
also supported the addition of a supplemental carbon source in order to obtain reliable estimates of
dye reduction rates (Wuhrmann et al., 1980). It was, therefore, decided to measure all decolourisation
of Procion Red HE-7B in the presence of a supplemental carbon source, namely, glucose. Further
experimentation was done to determine an optimum glucose concentration for measurement of
Procion Red HE-7B decolourisation and, from these results, it was decided that glucose should not be
limiting at any stage in the decolourisation process.
Although precautions were taken to minimise oxygen contamination during preparation of the assay
bottles, it was impossible to exclude all oxygen from the system. This resulted in a lag phase of
approximately 15h prior to the onset of decolourisation. It was decided to minimise the lag phase by
pre-incubating the assay bottles overnight (18 h) in the presence of glucose.
To determine the concentration of Procion Red HE-7B to be used in the standard assay, varying
concentrations of the dye were investigated. It was found that, for initial concentrations below 100
mg/M, it was difficult to measure the rate of decolourisation accurately over the entire degradation
period, as the majority of the readings were close to the lower limits of the analytical technique. For
this reason, a standard dye concentration of 100 mg/M, recommended by the ETAD (method no. 105)
for measurement of primary degradability of textile dyes in an anaerobic asssay system, was adopted
as the reference dye concentration for measurement of decolourisation in the standard assay system.
C.2 EXPERIMENTATION
The experimentation section begins with a list of the materials required for the standard assay.
Following this are the sections describing experimental and analytical procedures for the standard
assay.
C-1

C.2.1 Materials
Mineral salts medium
A defined medium consisting of trace elements, minerals and vitamins is prepared according to Owen
et al. (1979) with some modifications. The stock solutions for preparation of the medium are
presented in Table C.1, and the method for preparation of the medium is presented in Table C.2.
0.0001B12
0.0005Pantothenic acid
0.0005Thiamin
0.0050Riboflavin
0.0020Folic acid
0.0020BiotinS(4)
370.0000FeCl2.4H2OS(3)
0.1400ZnCl2
0.1700Na2MoO4.2H2O
0.1800CuCl2.2H2O
0.3800H3BO3
2.0000CoCl2.6H2O
1.3300MnCl2.4H2O
86.7000KCl
120.0000MgCl2.6H2O
26.6000NH4Cl
16.7000CaCl2.H2OS(2)
26.7000(NH4)2HPO4S(1)
Concentration( /M)
CompositionStock solution
Table C.1 : Stock solutions for preparation of mineral saltsmedium.
5.4Stock solution S(1)
Add the following to the volumetric flask :2
Add 1M of distilled water to a 2 M volumetric flask1
Mass (g)Volume (mM)InstructionStep
Table C.2 : Instructions for preparation of defined medium
C-2

Make up to volume with distilled water4
2.0Add glucose as powder4
8.4Add NaHCO3 as powder3
18.0Stock solution S(4)
1.8Stock solution S(3)
27.0Stock solution S(2)
Procion Red HE-7B stock solution
The commercially available preparation of Procion Red HE-7B (ICI) is used in these experiments. A
stock solution is prepared by adding 500 mg of Procion Red HE-7B powder to a 100 mM volumetric
flask and making up to volume with distilled water, to give a concentration of 5 000 mg/M. A volume
of 2 mM is added to each assay bottle to give an approximate concentration of 10 mg Procion Red
HE-7B per 100 mM, i.e. 100 mg/M.
Inoculum
Inoculum for all assay experiments is obtained from the Procion Red HE-7B enrichment digester
which contains acclimated biomass that has been exhausted of residual organic substrate. This
biomass was incubated in the presence of Procion Red HE-7B for four months during which time the
residual organic substrate in the digester sludge provided an additional carbon source for metabolic
activity (Section 4.1.1).
Reaction vessels
Experiments are performed in serum bottles (120 mM, Aldrich Chemical Company) which are sealed
with butyl rubber stoppers and aluminium crimp seals.
C.2.2 Experimental Procedure
A 30 % (v/v) inoculum is used per serum bottle which is equivalent to 30 mM of digester sludge
(from the laboratory Procion Red HE-7B enrichment digester) in a total liquid volume of 100 mM, in
a 120 mM serum bottle. The inoculum is centrifuged at 5 000 rpm for 20 min to remove excess liquid
which may contain dye and/or degradation products. The centrate is decanted and the biomass pellet
(from 30 mM of digester sludge) resuspended in 100 mM of mineral salts medium. The
sludge/medium mixture is decanted into a serum bottle (120 mM, Aldrich Chemical Company).
Assay bottles are over-gassed with oxygen-free nitrogen (Fedgas) at a flow rate of 0.5mM/min for 15
min and sealed with butyl rubber stoppers and aluminium crimp seals. The assay bottles are
pre-incubated for 18 h in a waterbath at 32 oC (without shaking). Upon completion of pre-incubation
2 mM of Procion Red HE-7B stock solution is added to each assay bottle by means of a hypodermic
needle and glass syringe (2 mM) to give an initial dye concentration of 100 mg/M.
C-3

C.2.3 Analytical Procedure
Samples (2 mM) are withdrawn from the assay bottles by a hypodermic needle and syringe which is
inserted through the butyl rubber septa of the assay bottles. Prior to sample removal, 3 mM of
oxygen-free nitrogen is expelled into the assay bottle to maintain the pressure inside the assay bottles
with the decreasing liquid volume. The samples are immediately centrifuged at 6 500 rpm for 25 min
to remove any suspended material. The absorbance of the supernatant is read at the maximum
wavelength of absorbance for Procion Red HE-7B (520 nm) using quartz microcuvettes (vol = 1.5
mM; path length = 10 mm, Zeiss) and a LKB Biochrom Ultraspec (model 4050). The absorbance
figures are converted to the equivalent dye concentrations using a calibration curve of absorbance
(520 nm) versus Procion Red HE-7B concentration (Fig C.1)
C-4
Fig C.1 : Calibration curve of Procion Red HE-7B (mg/M)versus absorbance measured at 520 nm.
0 20 40 60 80 100 1200
0,5
1
1,5
2
dye concentration (mg/l)
Y = 0.01839 X + 0.05242
Abso
rban
ce 5
20 n
m

APPENDIX D
DATA FOR SECTIONS 4.3.1 AND 4.3.2
D.1 INTRODUCTION
Appendix D contains experimental data for section 4.3.1: : comparison of decolourisation rates for
acclimated and unacclimated biomass and section 4.3.2: biological decolourisation of Procion Red
HE-7B.
D.2 EXPERIMENTAL DATA : COMPARISON OF DECOLOURISATIONRATES FOR PROCION RED HE-7B BY ACCLIMATED ANDUNACCLIMATED BIOMASS.
R-Square = 0,989 (y = -0,318x + 0,083)R-Square = 0,954 (y = -0,289x + 0,272)
-2.36-2.64-2.32-2.22-2.26-2.198.00
-1.82-1.78-1.90-1.49-1.27-1.336.00
-1.40-1.39-1.34-0.99-0.94-0.884.50
-1.12-1.08-1.01-0.62-0.60-0.523.50
-0.46-0.50-0.45-0.31-0.26-0.262.00
-0.27-0.26-0.250.230.22-0.211.00
Unacclimated biomassAcclimated biomass
ln(Ct/Co)
5.033.785.036.236.016.348.00
8.579.007.7013.0316.1814.986.00
13.0813.2413.4621.5122.4923.364.50
17.2717.9718.7431.0231.6233.583.50
33.5832.1132.6542.2244.1343.372.00
40.3240.8640.1045.8146.0845.701.00
53.0453.1551.4157.6157.3956.420.00
Unacclimated biomassAcclimated biomassTime (h)
Procion Red HE-7B (mg/M)
Table D.1 : Data from experiment to compare rates of decolourisation of Procion Red HE-7B byacclimated and unacclimated biomass.
D-1

D.3 BIOLOGICAL DECOLOURISATION OF PROCION RED HE-7B
D.3.1 The Order of Procion Red HE-7B Decolourisation with Respect to Dye Concentration
The data in Table D.2 is presented in Fig's 4.5 and 4.6, Section 4.3.2, Chapter Four.
y = -0,252x + 0,003y = -0,316x + 0,04y = -0,441x + 0,301R-Square = 0,962R-Square = 0,975R-Square = 0,959
-3.240-3.900-3.70012.00
-2.630-3.050-2.890-3.570-3.360-3.89010.25
-2.380-2.780-2.710-3.240-2.910-3.2709.25
-2.030-2.580-2.170-3.130-2.680-3.350-3.770-4.430-4.1007.50
-1.730-2.220-1.870-2.280-2.300-2.560-2.430-2.710-3.0206.25
-1.570-1.950-1.540-2.060-1.980-2.150-2.340-2.530-2.5505.25
-1.160-1.570-1.530-1.790-1.590-1.710-1.820-2.000-1.9904.25
-0.870-1.090-0.940-1.270-1.300-1.160-1.290-1.450-1.4502.00
-0.390-0.480-0.450-0.490-0.440-0.460-0.480-0.690-0.6001.00
-0.200-0.320-0.270-0.310-0.280-0.230-0.290-0.360-0.3400.25200.00 200.00 200,00 150,00 150,00 150,00 100,00 100,00 100,00
Initial dye concentration (mg/M)
ln (Ct/Co)8.796.016.942.532.911.8312.00
11.297.928.303.514.603.4010.25
16.029.6614.223.955.743.131.440.741.069.25
21.6213.8419.179.178.406.945.524.113.137.50
25.5918.0326.8911.4511.6110.366.074.924.986.25
38.3626.4627.0015.0417.1616.1810.208.408.735.25
51.1442.8248.8625.3122.8127.8717.3814.4915.094.25
82.9578.6079.9054.8954.0856.4738.7431.1935.162.00
100.5492.0095.0065.7163.2771.2047.1743.3745.381.00
122.40127.00124.9089.9684.0489.3162.8962.0264.030.25
200,00 200,00 200,00 150,00 150,00 150,00 100,00 100,00 100 ,00
Initial concentration200 mg/M
Initial concentration150 mg/M
Initial concentration100 mg/M
Procion Red HE-7B (mg/M)Time
Table D.2 : Experimental data used to determine the order of Procion Red HE-7B decolourisation, withrespect to dye concentration.
D-2

D.3.2 Procion Red HE-7B Decolourisation with Permeabilised Cells
75.5375.7775.1775.6677.9179.7477.9576.0425.00
10.259.117.5317.00
21.5121.6719.9913.00
78.8578.9379.4778.1679.6280.6779.9678.2231.7331.8425.599.00
78.9479.8578.4478.5479.9481.8679.9678.0042.0641.3533.257.00
79.9680.2379.5280.1280.9282.1380.8879.7459.2456.2551.415.00
81.9283.6080.7281.4382.7083.4482.9581.7080.1875.5071.263.00
83.7784.6982.8486.9786.2185.3489.3689.4286.7083.661.00
87.7390.3485.1287.5787.5792.5286.7084.140.08
PAVG
PPPPBAVG
PBPBPBNPNPNPTime(h)
Procion Red HE-7B (mg/M)
Table D.3 : Experimental data for decolourisation of Procion Red HE-7B by permeabilised and non-permeabilisedmicroorganisms
NP = non-permeabilised biomass
PB = permeabilised biomass suspended in phosphate buffer
P = permeabilised biomass suspended in the aqueous phase of the permeabilisation solution
The experimental data presented in Table D.3 is presented in Fig 4.7, Section 4.3.2, Chapter Four.
D-3

D.3.3 Rate of Decolourisation of Procion Red HE-7B as a Sole Carbon Source
y = -0,011x + 0,141y = -0,441x + 0,301
R-Square = 0,924R-Square = 0,959
-2.120-3.470-2.240235.00
-1.980-2.780-2.130192.00
-1.630-1.920-1.810168.00
-1.470-1.450-1.430144.00-2.740-2.910-2.8509.25
-1.190-1.110-1.290125.00-2.070-2.240-2.4207.50
-0.590-0.750-0.57077.00-2.000-2.130-2.1506.25
-0.280-0.360-0.33048.00-1.620-1.760-1.7605.25
-0.350-0.370-0.37030.00-1.180-1.320-1.3204.25
-0.070-0.140-0.10022.00-0.460-0.650-0.5702.00
0.0400.0200.0402.00-0.270-0.340-0.3301.00
Experimental bottles (no additional carbon source)
TimeControlTime
ln (Ct/Co)
9.272.538.57235.00
10.635.039.60192.00
15.0911.8813.19168.00
17.7019.1219.22144.004.243.543.869.25
23.4126.6722.16125.008.326.915.937.50
42.8838.5845.4977.008.867.727.786.25
58.3756.5257.8848.0013.0011.2011.535.25
54.3556.0355.8230.0020.1717.2917.894.25
71.9170.9972.8422.0041.5433.9837.952.00
80.4583.3381.052.0049.9746.1648.181.00
77.1381.3280.500.2565.6864.8166.830.25
Experimental bottles (no additional carbon source)
TimeControls (glucose)Time
Procion Red HE-7B (mg/M)
Table D.4 : Experimental data for decolourisation of Procion Red HE-7B as a sole carbon source.
The data in Table D.4 is presented in Fig 4.8, Section 4.3.2, Chapter Four.
D-4
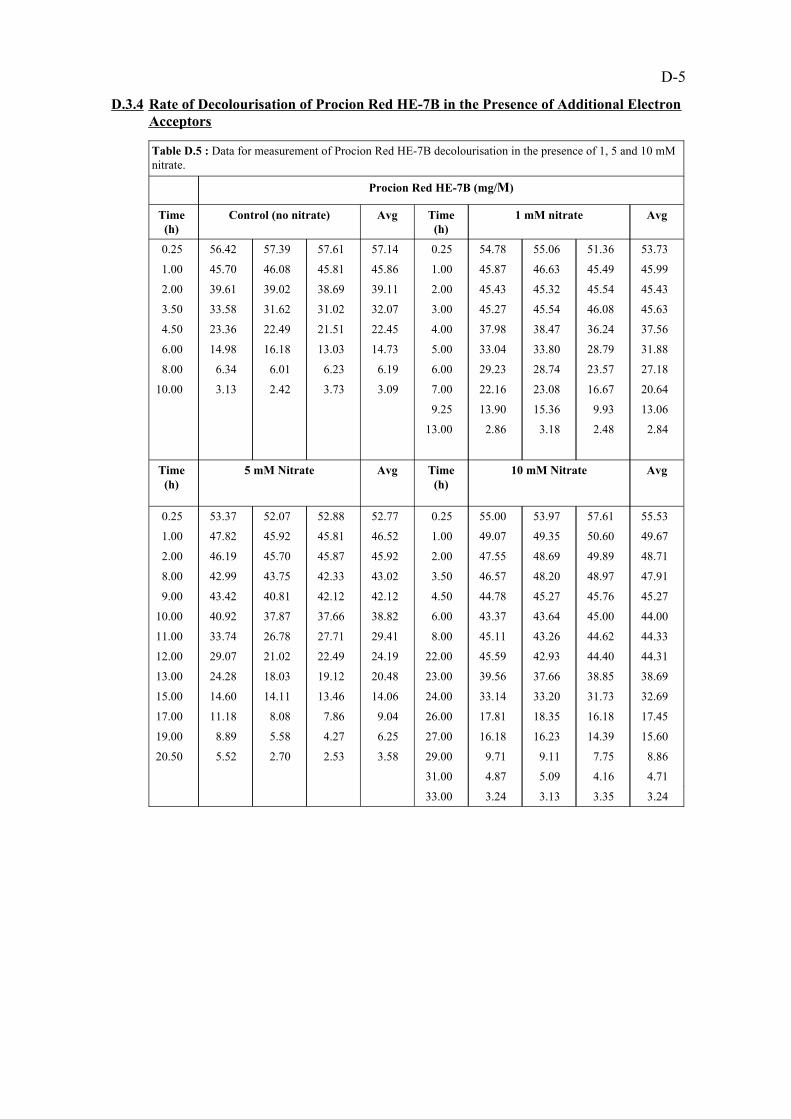
D.3.4 Rate of Decolourisation of Procion Red HE-7B in the Presence of Additional ElectronAcceptors
3.243.353.133.2433.00
4.714.165.094.8731.00
8.867.759.119.7129.003.582.532.705.5220.50
15.6014.3916.2316.1827.006.254.275.588.8919.00
17.4516.1818.3517.8126.009.047.868.0811.1817.00
32.6931.7333.2033.1424.0014.0613.4614.1114.6015.00
38.6938.8537.6639.5623.0020.4819.1218.0324.2813.00
44.3144.4042.9345.5922.0024.1922.4921.0229.0712.00
44.3344.6243.2645.118.0029.4127.7126.7833.7411.00
44.0045.0043.6443.376.0038.8237.6637.8740.9210.00
45.2745.7645.2744.784.5042.1242.1240.8143.429.00
47.9148.9748.2046.573.5043.0242.3343.7542.998.00
48.7149.8948.6947.552.0045.9245.8745.7046.192.00
49.6750.6049.3549.071.0046.5245.8145.9247.821.00
55.5357.6153.9755.000.2552.7752.8852.0753.370.25
Avg10 mM NitrateTime(h)
Avg5 mM NitrateTime(h)
2.842.483.182.8613.00
13.069.9315.3613.909.25
20.6416.6723.0822.167.003.093.732.423.1310.00
27.1823.5728.7429.236.006.196.236.016.348.00
31.8828.7933.8033.045.0014.7313.0316.1814.986.00
37.5636.2438.4737.984.0022.4521.5122.4923.364.50
45.6346.0845.5445.273.0032.0731.0231.6233.583.50
45.4345.5445.3245.432.0039.1138.6939.0239.612.00
45.9945.4946.6345.871.0045.8645.8146.0845.701.00
53.7351.3655.0654.780.2557.1457.6157.3956.420.25
Avg1 mM nitrateTime(h)
AvgControl (no nitrate)Time(h)
Procion Red HE-7B (mg/M)
Table D.5 : Data for measurement of Procion Red HE-7B decolourisation in the presence of 1, 5 and 10 mMnitrate.
D-5

y = 0,256x + 5,79y = -0,218x + 2,09R-Square = 0,989R-Square = 0,943
-2.81-2.72-2.0620.50
-2.58-2.62-2.6433.00-2.29-1.99-1.5919.00
-2.37-2.13-2.2431.00-1.68-1.62-1.3617.00
-1.75-1.55-1.5529.00-1.14-1.06-1.0915.00
-1.13-0.97-1.0427.00-0.79-0.82-0.5813.00
-1.01-0.85-0.9426.00-0.63-0.66-0.4012.00
-0.34-0.26-0.3224.00-0.42-0.42-0.2511.00
-0.13-0.13-0.1423.00-0.11-0.07-0.0610.0010 mM nitrateTime (h)5 mM nitrateTime (h)
y = -0,244x + 0,88y = -0,309x + 0,31R-Square = 0,928R-Square = 0,964
-2.74-3.16-2.8910.00
-2.91-2.66-2.7613.00-2.22-2.26-2.198.00
-1.53-1.09-1.189.25-1.49-1.27-1.336.00
-1.01-0.68-0.717.00-0.99-0.94-0.884.50
-0.66-0.46-0.446.00-0.62-0.60-0.523.50
-0.46-0.30-0.325.00-0.40-0.39-0.352.00
-0.23-0.17-0.184.00-0.23-0.22-0.211.001 mM nitrateTimeControlTime
ln(Ct/Co)
Table D.6 : Data for measurement of the rates of decolourisation of Procion Red HE-7B in the presenceof nitrate.
Data from Table D.5 and D.6 are presented in Fig's 4.9 and 4.10, Section 4.3.2, Chapter Four.
D-1

y = -0,208x + 0,067y = -0,207x + 0,077y = -0,208x + 0,114R-Square = 0,949R-Square = 0,944R-Square = 0,945
-2.64-2.37-2.17-2.26-2.23-2.47-2.14-2.00-2.3113.00
-1.71-1.53-1.59-1.51-1.66-1.51-1.72-1.67-1.7710.00
-0.69-0.66-0.71-0.73-0.75-0.63-0.67-0.70-0.776.00
-0.62-0.59-0.57-0.58-0.62-0.47-0.51-0.54-0.564.00
-0.51-0.47-0.49-0.47-0.52-0.39-0.46-0.35-0.403.00
-0.39-0.36-0.39-0.37-0.39-0.30-0.30-0.30-0.312.00
-0.26-0.23-0.28-0.26-0.28-0.22-0.23-0.21-0.231.0010 mM sulphate5 mM sulphateControl (no sulphate)Time
ln Ct/Co
4.225.316.945.856.394.766.667.325.3113.00
10.7412.3712.3712.3711.2912.3710.2010.209.1110.00
29.7729.4529.8826.9528.1429.7728.9026.8924.826.00
31.9531.7334.1231.5131.9535.1033.9631.5130.754.00
35.4335.4337.1134.8835.4338.0435.9238.0435.973.00
40.2739.5641.1938.6440.3241.4142.1740.2739.452.00
45.5445.2745.8743.4244.7345.0545.0043.8042.881.00
59.2456.9660.6056.0959.4156.1456.7454.1956.960.25
10 mM sulphate5 mM sulphateControl (no sulphate)Time (h)
Procion Red HE-7B (mg/M)
Table D.7 : Data for measurement of Procion Red HE-7B decolourisation in the presence of sulphate
Data from Table D.7 are presented in Fig 4.11, Section 4.3.2, Chapter Four.
D.3.5 The Role of Redox Potential in the Microbial Decolourisation of Procion Red HE-7B
The raw data for this experiment has not been included as each figure (4.12, 4.13 and 4.14) has in
excess of 500 data points.
D-2

Appendix EDATA FROM SECTION 4.3.3
Appendix E contains data for Section 4.3.3 : The abiotic decolourisation of Procion Red HE-7B.
E.1 ADSORPTION OF PROCION RED HE-7B IN MINERAL SALTS MEDIUMAND SALINE SOLUTION
76.2675.1277.4024.00
46.1446.7943.206.0076.3474.5878.118.00
46.2546.6843.375.0075.3174.7475.887.00
46.6346.1943.094.0076.5177.8475.176.00
46.9046.7944.513.0077.1977.9576.425.00
52.6152.2351.522.0077.8678.9876.754.00
58.7061.5858.431.0081.6782.5180.833.00
58.2659.8458.700.7584.6385.3483.932.00
61.2563.4360.440.5088.9889.5388.441.00
64.3067.5663.810.2595.4896.0594.910.25
100.00100.00100.000.00100.00100.00100.000.00
Adsorption in mineral saltsmediumTime (h)
Ti (h)
Adsorption in saline solution
Time (h)
Procion Red HE-7B (mg/M)
Table E.1 : Data from experiment to determine the extent of adsorption of Procion Red HE-7B toa sludge adsorbent, measured in mineral salts medium and saline solution.
The data in Table E.1 is presented in Fig 4.15, Section 4.3.3, Chapter Four.
E.2 PROCION RED HE-7B ADSORPTION ISOTHERM
y = 0,504x + 0,96R-Square = 0,955
0.690.550.593.251.852.001.731.8125.79
0.570.620.593.031.811.761.861.8120.64
0.490.540.502.781.661.631.711.6516.07
0.170.272.361.251.18 1.3110.61
- 0,08 - 0,17 - 0,141.680.880.920.840.87 5,36
ln xln cx avgx (mg/g)c(mg/M)
Table E.2 : Representation of Procion Red HE-7B adsorption data by the Freundlichisotherm
Data from Table E.2 is presented in Fig's 4.16 and 4.17, Section 4.3.3, Chapter Four.
5.362.913.193.09
c (mg/M)c/x
Table E.3 : Adsorption data for Procion Red HE-7B withanaerobic biomass as the adsorbent, represented by theLangmuir isotherm.
E-1

R-Square = 0,957y = 0,184x + 2,06
25.796.467.447.12
20.645.875.545.70
16.074.944.714.86
10.614.494.04
E.3 DECOLOURISATION OF PROCION RED HE-7B IN MINERAL SALTSMEDIUM
102.43102.50105.4499.3575.9776.1076.2675.5549.4949.6751.0347.7710.00
104.92104.76106.96103.0475.8276.2575.2375.9950.3550.9051.2048.978.00
107.32106.20108.15107.6178.6378.3079.8577.7352.4852.8953.5950.984.00
106.32106.35107.72104.8978.6579.5778.1178.2751.6452.7652.0750.112.00
105.92105.47107.72104.5780.9980.2380.9981.7553.8153.2955.1652.991.00
111.09110.87112.29110.1181.5780.6081.7082.4054.4454.5755.1653.590.75
108.53108.53109.46107.6182.0382.5482.0881.4854.1854.0355.1653.370.50
111.76111.25112.50111.5383.1484.1383.0682.2454.1654.1255.0053.370.25
2002002002001501501501501001001001000.00
AvgInitial concentration200 mg/M
AvgInitial concentration150 mg/M
AvgInitial concentration100 mg/M
Time(h)
Procion Red HE-7B (mg/M)
Table E.4. : Data from experiment to measure the extent of decolourisation caused by incubation of Procion RedHE-7B in sterile mineral salts medium.
E-2

Appendix FDATA FOR SECTIONS 4.3.4 AND 4.3.5
Appendix F contains calculations and experimental data from Section 4.3.4 : Identification and fate of
Procion Red HE-7B degradation products in an anaerobic system and Section 4.3.5 : Inhibitory
effects of Procion Red HE-7B on an anaerobic microbial population.
F.1 THEORETICAL GAS VOLUME CALCULATIONS
The Buswell equation (Tarvin and Buswell, 1934) was used to calculate the theoretical gas volumes
for mineralisation of Procion Red HE-7B.
CnHaOb + n − a4 − b
2 H2O d n2 − a
8 + b4 CO2 + n
2 + a8 − b
4 CH4
C46H22O25 + 46 − 224 − 25
2 H2O d 462 − 22
8 + 254 CO2 + 46
2 + 228 − 25
4 CH4
Therefore 1 mole Procion Red HE-7B yields 26,5 mole CO2 and 19,5 mole CH4.
To calculate the volume of gas (CH4 + CO2) expected for mineralisation of 1 mole of Procion Red
HE-7B :
V = nRTP
CO2 : V = 26,5 x 37,22 x 305 / 101325
V = 2,96896 kM CO2
CH4 : V = 19,5 x 35,71 x 305 / 101325
V = 2,09608 kM CH4
It was neccessary to correct these volumes for solubility :
2,96896 kM CO2 x 0,35 = 1,039136 kM CO2
2,09608 kM CH4 x 0,95 = 1,991276 kM CH4
Therefore, a total volume of 3,03412 kM digester gas would be expected from an anaerobic digester
mineralising 1 mole of Procion Red HE-7B.
The molecular weight of Procion Red HE-7B = 1634 g/mol.
Therefore the number of moles in each of the assay bottles was :
20 mg/M = 2 mg per assay bottle (100 mM) = 1,22399 x 10⁻⁶ moles
50 mg/M = 5 mg per assay bottle (100 mM) = 3,05997 x 10⁻⁶ moles
100 mg/M = 10 mg per assay bottle (100 mM) = 6,11995 x 10⁻⁶ moles
200 mg/M = 20 mg per assay bottle (100 mM) = 1,22399 x 10⁻⁵ moles
500 mg/M = 50 mg per assay bottle (100 mM) = 3,05997 x 10⁻⁵ moles
F-1

92.5837.0318.529.263.70Total volume (mM)
31.7512.706.353.181.27Carbon dioxide (mM)
60.8324.3312.176.052.43Methane (mM)
Mineralisation of entire dye molecule
500 mg/M 200 mg/M 100 mg/M 50 mg/M 20 mg/M
Procion Red HE-7B (mg/M)
Table F.1 : Theoretical gas volumes for mineralisation of Procion Red HE-7B in assay bottles.
F.2 EXPERIMENTAL DATA FROM THE ANAEROBIC TOXICITY ASSAY
182.20177.20169.20141.5089.2063.2042.5035.3029.7023.30Avg
186.00181.00173.00143.0090.0065.0045.0038.0032.0025.00
186.50181.50173.50147.5093.5067.5047.5040.5035.0026.00
174.00169.00161.00134.0084.0057.0035.0027.5022.0019.00500 mg/M
186.50182.10174.60148.3098.6068.0048.0040.5033.8026.70Avg
191.00186.00178.00151.00100.0069.0049.0042.0035.5028.00
186.40182.40175.90149.9099.9068.9048.9041.0034.0027.00
182.00178.00170.00144.0096.0066.0046.0038.5032.0025.00200 mg/M
180.90176.90170.10148.10107.1070.7046.4037.9030.2021.30Avg
188.50184.50177.50155.50109.5072.5048.5040.0032.0023.00
170.70166.70160.70138.70105.7068.7046.7038.2030.2022.00
183.50179.50172.00150.00106.0071.0044.0035.5028.5019.00100 mg/M
188.00183.70177.00155.30109.5072.7047.7038.8030.8023.30Avg
186.50181.50174.50152.50106.5070.5045.5036.5028.0020.00
186.00182.00176.00155.00108.5071.0047.0038.5031.0024.00
191.50187.50180.50158.50113.5076.5050.5041.5033.5026.0050 mg/M
184.30180.30174.00153.50106.5072.3046.8037.8030.3022.00Avg
186.00182.00176.00156.00110.0072.5047.5038.5030.0021.50
186.50182.50175.50154.50107.5073.5048.5039.5031.0022.00
182.00178.00172.50152.50105.5071.0045.0036.0029.5022.0020 mg/M
185.80181.80175.50154.50108.2074.7048.0040.3034.0026.70Avg
190.00186.00179.50158.50111.5077.5049.5041.5035.0028.00
189.50185.50179.00158.00111.0076.5050.5043.0036.0028.00
178.00174.00168.00147.00102.0070.0044.0036.5031.0024.00Controls
Digester gas (mM)
5238302317138421
Time (d)
Table F.2 : Digester gas volumes for assay bottles containing acclimated biomass
Data in Table F.2 is presented in Fig 4.22 and Fig 4.24, Section 4.2.5, Chapter Four.
F-2

161.77124.4396.4374.7756.7746.4337.2732.9327.0020.50Avg
170.30120.3076.3052.3044.3040.3035.8031.8026.0020.00
144.0086.0068.0052.0044.0040.0036.0032.0026.0020.00
171.00167.00145.00120.0082.0059.0040.0035.0029.0021.50500 mg/M
170.00106.0078.3362.6749.6744.3339.3334.5028.5021.83Avg
168.5094.5075.5060.5048.5043.5039.0034.0028.0022.00
166.00108.0078.0062.0049.0044.0038.5033.5027.5021.50
175.50115.5081.5065.5051.5045.5040.5036.0030.0022.00200 mg/M
162.50104.5079.8362.5049.8344.0038.8334.5029.5022.67Avg
165.00107.0079.0062.0050.0044.5039.5034.5029.5023.00
161.00103.0081.0063.0050.0044.0039.0035.0030.0023.00
161.50103.5079.5062.5049.5043.5038.0034.0029.0022.00100 mg/M
203.00158.33120.0092.0071.1763.5057.1751.6742.5019.33Avg
218.00178.00149.00106.0078.0067.0060.0054.5045.5020.00
195.00155.00108.0086.0068.5062.5056.5050.5042.0019.00
196.00142.00103.0084.0067.0061.0055.0050.0040.0019.0050 mg/M
174.67133.3391.3367.0048.6740.8334.5029.6724.6719.17Avg
176.50136.5088.5066.5048.5040.5033.5029.0024.5020.00
171.50121.5083.5064.5046.5039.0033.0028.0024.5018.50
176.00142.00102.0070.0051.0043.0037.0032.0025.0019.0020 mg/M
186.33134.33100.6774.6751.6743.5037.1733.0027.0019.83Avg
177.00127.0089.0069.0051.0043.5037.5033.5027.5019.50
176.50150.50124.5086.5053.5043.5036.5032.5026.5019.00
205.50125.5088.5068.5050.5043.5037.5033.0027.0021.00Controls
Digester gas (mM)
5238302317138421
Time (d)
Table F.3 : Digester gas volumes for assay bottles with unacclimated biomass
Data in Table F.3 is presented in Fig 4.23 and Fig 4.25, Section4.3.5, Chapter Four.
F-3

0.8373.2170.9546.645500 mg/M
0.9382.6570.9736.801200 mg/M
0.9902.6040.9796.951100 mg/M
0.8434.1540.9847.35350 mg/M
0.9484.0080.9877.29620 mg/M
0.8853.9200.9817.198Control
R-Square valuesUnacclimatedR-Square valuesAcclimated
Rate of gas production (mM/d)
Table F.4 : Methane production rates for acclimated biomass in the anaerobic toxicity assay.
The data in Table F.4 was used to calculate the maximum rate ratios in Table 4.3, Section 4.3.5,
Chapter Four.
6.0114.82
6.0114.47
53.1356.746.0413.13
53.6756.3931.8048.105.1913.57
53.5753.9256.2755.6731.7531.6948.3448.575.685.1513.8513.26500 mg/l
39.7254.6732.6349.68
39.6855.8332.6750.88
39.4739.0155.8156.9332.6432.6350.8451.96200 mg/l
42.4953.5536.9446.86
42.3554.1937.7445.84
42.5342.7554.1454.6737.2637.0946.8147.72100 mg/l
43.5753.6429.5149.01
42.5954.3328.8148.92
43.2343.5353.7353.2128.8328.1849.2249.7450 mg/l
49.9553.9431.5045.80
49.9355.2130.7245.94
50.0750.3254.3653.9230.8930.4546.4147.4920 mg/l
51.5252.5550.866.9319.62
55.6753.4933.1752.166.9217.80
54.7557.0652.7952.3433.2733.3652.3453.996.886.7919.2020.18Control
AvgunacAvgacclAvgunacAvgacclAvgunacAvgaccl
3days
8days
2days
Sample
Time (d)
Table F.5 : Methane production (%) values for acclimated and unacclimated biomass, during the toxicity assay
Data from Table F.5 is presented in Fig's 4.26 and 4.27, Section 4.3.5, Chapter Four.
F-4

APPENDIX G
CHAPTER FIVE : EXPERIMENTAL DATA
G.1 DATA FROM ENRICHMENT SCHEMESTable G.1 contains total gas production data from the serum bottle enrichment study, which utilised
Smith and Nephew kier liquor as the substrate. The averages of the triplicate results in this table are
presented in Fig 5.2, Chapter 5. Samples labelled 'C' are control samples which contained only
inoculum and distilled water. Samples labelled 10 %, 50 % and 100 % are enrichment bottles which
contained inoculum and effluent in 10, 50 or 100 % (v/v) concentrations, respectively.
78.279.581.074.065.566.559.071.0140.0154.5125.5173.586.077.0
66.263.567.068.055.252.551.062.092.5114.570.5161.576.847.0
66.263.567.068.055.252.551.062.074.590.558.5153.572.138.0
62.559.563.065.052.249.547.060.064.078.549.5147.568.734.0
58.555.559.061.049.545.545.058.051.064.537.5135.563.027.0
52.851.553.054.046.541.542.056.042.553.531.5123.558.323.0
47.545.547.050.043.539.539.052.037.044.529.5109.553.719.0
40.737.540.044.539.837.535.047.031.837.526.091.548.715.0
36.733.535.041.537.035.532.043.529.535.024.085.546.314.0
32.529.530.038.033.532.528.539.528.033.023.080.044.713.0
28.225.525.034.028.526.524.534.524.529.020.072.041.012.0
22.821.521.026.020.516.517.527.521.024.018.054.034.38.0
17.018.017.016.017.313.015.024.018.521.016.046.030.77.0
12.714.012.012.014.010.012.020.013.516.011.036.026.36.0
6.78.06.06.08.34.08.013.010.512.09.025.020.34.0
3.33.02.05.06.74.08.08.07.58.07.014.013.02.0
0.00.00.00.00.00.00.00.00.00.00.00.00.00.0
AVG100%(3)
100%(2)
100%(1)
AVG50 %(3)
50 %(2)
50 %(1)
AVG(2&3)
10 %(3)
10 %(2)
10 %(1)
CAVG
Time(d)
Sample
Table G.1 : Gas production for Smith and Nephew serum bottle enrichments
G-1

150.004 0307.690.00
170.003 9907.687.00
242.003 9307.685.00
400.003 7907.683.00
3 43080.00
3 19077.00
2 92075.00
2 84074.00
850.002 7008.573.00
2 56072.00
Re-fed digester 1M ofconc effluent.
100 / 9002 4607,5 / 8,971.00
2 46062.00
2 42058.00
Overgassed digester withnitrogen.
2 34057.00
2 32053.00
2 32051.00
530.002 18050.00
1 92046.00
560.001 72044.00
1 60042.00
Re-fed with 10 %effluent
600.001 44041.00
208.001 44037.00
1 4207.227.00
1 40017.00
115.001 3207.215.00
1 28013.00
800.008.00
265.00600.008.17.00
300.005.00
240.002.00
8.20.00
fed 10 % scour efffluent360.000.007,3 0.00
NotesTotal OrganicCarbon (mg/M)
Total Gas (mM)cumulative
pHTime (d)
Table G.2 : Data for the John Grant enrichment digester during batch operation.
G-2

Cumulative gas production and cumulative dissolved organic carbon (data from Table G.2) are
plotted in Fig 5.3 (Chapter Five).
7 45022.00
7 15019.00
465.006 9907.818.00
Digester fed680.008.415.00
385.006 4307,8 15.00
Digester fed650.008.610.00
300 5 5707,8 10.00
5 1707.00
340.005 0107.96.00
385.004 7108.05.00
Digester fed590.008.64.00
340.004 5707.84.00
4 1101.00
Digester fed 400 mMJohn Grant Scouringefluent.
1,0/ 4,84 0307,5 / 8,50.00
NotesTotal organiccarbon (mg/M)
Total gas (mM)pHTime (d)
Table G.3 : Data from John Grant digester operating in semi-continuous mode
Data from Table G.3 are presented in Fig 5.4 and 5.5 (Chapter Five).
G-3

G.2 COMBINATION OF ANAEROBIC DIGESTION OF JOHN GRANTSCOURING EFFLUENT AND DECOLOURISATION OF PROCION REDHE-7B
-2.8847-2.5258-3.1711-0.9012-0.9901-0.87445.5
-2.4054-1.7259-1.7591-0.6869-0.7789-0.71294.0-1.2102-1.0353-1.3016-0.3280-0.3715-0.41082.5
-0.5500-0.5381-0.5252-0.0493-0.1527-0.15281.5100(3)100 (2)100 (1)50(3)50(2)50(1)Time (h)
ln Ct/Co
3.55.12.624.823.125.55.5
5.711.310.530.728.629.94.0
18.922.516.644.042.940.52.5
36.536.936.158.153.452.41.5
63.363.261.061.162.261.00.0100(3)100 (2)100 (1)50(3)50(2)50(1)Time (h)
Procion Red HE-7B concentration (mg/M)
Table G.4 : Data from experiment to determine the order and rate of decolourisation of ProcionRed HE-7B in 50 and 100 % John Grant scouring effluent (inoculated).
Data from Table G.4 are presented in Fig 5.6 (Chapter Five).
65.876.75.591.210.8
76.584.24.092.08.2
84.188.42.591.36.0
89.090.91.591.54.0
93.391.60.292.91.0
Procion Red HE-7B (mg/M)Procion Red HE-7B(mg/M)
100 %50 %50 %
Non-sterilised bottlesTime (h)Sterilised bottlesTime (h)
Table G.5 : Decolourisation data from sterilised and non-sterilised John Grant scouring effluent(uninoculated).
The data in Table G.5 are presented in Fig 5.7, Chapter Five.
G-4

37.237.941.97.94.87.910.8
40.942.743.916.010.915.78.2
48.149.449.431.024.930.36.0
52.954.054.838.533.537.04.0
57.057.158.647.646.246.72.5
62.463.062.059.558.160.01.0
62.962.360.260.862.061.30.0
N (3)N (2)N (1)D (3)D (2)D (1)
Procion Red HE-7B (mg/M)Time (h)
Table G.6 : Decrease in Procion Red HE-7B concentration (mg/M) in inoculated serumbottles containing 100 mg/M of dye (D 1 to 3), and inoculated serum bottles containing 100mg/M of dye and 3 mM nitrate (N 1 to 3). John Grant scouring effluent (50 %) was thesubstrate for these experiments.
Data from Table G.6 are presented in Fig 5.9, Chapter Five.
G-5


![Biotransformation and Detoxification of Xylidine Orange ... · The three most commonly used dyes are azo, anthraquinone and phthalocyanine [1]. Azo dyes, in particular, contain an](https://img.dokumen.tips/doc/110x75/601cef69c50cac6a4b44f587/biotransformation-and-detoxification-of-xylidine-orange-the-three-most-commonly.jpg)