Embed Size (px)
Citation preview

Biological Assessment For the
Harris Vegetation Management Project
Shasta-McCloud Management Unit (SMMU)
Mt. Shasta Ranger District
Shasta-Trinity National Forest
Prepared By_______________________________ Date____________________
Scott L. Reitz
Wildlife Biologist TEAMS Enterprise Reviewed By______________________________ Date_____________________
Debbie Derby
Wildlife Biologist Shasta Trinity National Forest


The U.S. Department of Agriculture (USDA) prohibits discrimination in all its programs and activities on the basis of race, color, national origin, age, disability, and where applicable, sex, marital status, familial status, parental status, religion, sexual orientation, genetic information, political beliefs, reprisal, or because all or part of an individual's income is derived from any public assistance program. (Not all prohibited bases apply to all programs.) Persons with disabilities who require alternative means for communication of program information (Braille, large print, audiotape, etc.) should contact USDA's TARGET Center at (202) 720-2600 (voice and TDD). To file a complaint of discrimination, write to USDA, Director, Office of Civil Rights, 1400 Independence Avenue, S.W., Washington, D.C. 20250-9410, or call (800) 795-3272 (voice) or (202) 720-6382 (TDD). USDA is an equal opportunity provider and employer.


Harris Vegetation Project Biological Assessment
i
Table of Contents
I. Introduction .................................................................................................................................. 1 A. Purpose ................................................................................................................................... 1 B. Species Evaluated ................................................................................................................... 1
Northern spotted owl (Strix occidentalis caurina)---------------Threatened ............................ 1 C. Critical Habitat ....................................................................................................................... 2
II. Legal Requirements and Consistency with Recovery Plan ........................................................ 2 III. Consultation To-Date ................................................................................................................ 2 IV. Current Management Direction ................................................................................................. 3
A. Forest Plan Prescription and Management Areas................................................................... 3 B. LSR Direction and Management ............................................................................................ 5
V. Description of the Proposed Action ............................................................................................ 5 A. Location of the Proposed Action ............................................................................................ 5 B. Purpose and Need for Action (Objectives) ............................................................................. 7
Improve Forest Diversity and Health ...................................................................................... 7 Develop Late Successional Forest ........................................................................................... 7 Reduce Risks from Wildfire .................................................................................................... 7 Maintain Aspen and Oak ......................................................................................................... 8 Reduce Roading ...................................................................................................................... 8
C. Timeline.................................................................................................................................. 8 D. Treatment Description ............................................................................................................ 8
Vegetation Modeling and Silvicultural Terminology .............................................................. 8 Silvicultural Treatments .......................................................................................................... 9 Fuel Treatments ..................................................................................................................... 18 Other Activities ..................................................................................................................... 19 Treatment Summary .............................................................................................................. 19
E. Project Design Features ........................................................................................................ 21 VI. T&E Species Account and Effects of Proposed Action .......................................................... 25
Spatial Scales and Analysis Area .............................................................................................. 25 Interrelated and Independent Actions ....................................................................................... 27 A. Environmental Baseline – Northern Spotted Owl ................................................................ 27
Habitat Status ........................................................................................................................ 27 Minimum Habitat Requirements ........................................................................................... 33 Connectivity .......................................................................................................................... 34 Current Status of Northern Spotted Owl in the Action Area ................................................. 34 Status of Predators and Competitors ..................................................................................... 36 Cumulative Effects ................................................................................................................ 36
B. Direct and Indirect Effects of the Proposed Action .............................................................. 37 Effect Intensity ...................................................................................................................... 37 Direct Effects ......................................................................................................................... 39 Indirect Effects ...................................................................................................................... 40 Changes in Nest, Roost and Foraging Habitat ....................................................................... 46 Habitat Thresholds................................................................................................................. 49 Connectivity and Dispersal Habitat ....................................................................................... 50 Insects and Fire ...................................................................................................................... 50 Spotted Owl Prey ................................................................................................................... 51 Predators and Competition .................................................................................................... 52
D. Determination ....................................................................................................................... 52 VII. Critical Habitat ....................................................................................................................... 53
Environmental Baseline ............................................................................................................ 54 Direct and Indirect Effects ..................................................................................................... 56

Harris Vegetation Project Biological Assessment
ii
Summary ............................................................................................................................... 59 Cumulative Effects ................................................................................................................ 59 Determination of Effects to Critical Habitat.......................................................................... 60
VIII. Summary of Determinations ................................................................................................. 60 IX. Management Recommendations ............................................................................................. 61 X. Contributors .............................................................................................................................. 61 XI. Literature ................................................................................................................................. 62 Attachment 1: Species List ............................................................................................................ 65
Listed/Proposed Threatened and Endangered Species for Siskiyou County (Candidates Included) ................................................................................................................................... 66
Attachment 2: Project Maps .......................................................................................................... 67 Attachment 3: Harris Baseline Habitat Summary ......................................................................... 71
Introduction ............................................................................................................................... 72 Climatic Pattern ......................................................................................................................... 72 Climate Change ......................................................................................................................... 72 Fire, Fuels and Vegetation Management .................................................................................. 73
Fire Regime ........................................................................................................................... 73 Vegetation Management ........................................................................................................ 75 Consultation Synopsis and LSR/Critical Habitat Treatments ............................................... 80 Private .................................................................................................................................... 81 All Ownerships ...................................................................................................................... 83 Past and Anticipated Future Activities .................................................................................. 84
References ................................................................................................................................. 87
List of Figures
Figure 1: Harris Vicinity Map ......................................................................................................... 6 Figure 2: Lodgepole Mortality within the Harris LSR .................................................................... 7 Figure 3: Spotted Owl Habitat for the Harris LSR ........................................................................ 48 Figure 4: Spotted Owl Habitat for the Action Area....................................................................... 48 Figure 5: Spotted Owl Habitat for the Harris Home Range .......................................................... 49
List of Tables
Table 1: Prescription and Management Area Lands within the Harris Project Area ...................... 4 Table 2: Stand Attribute Changes by Treatment ........................................................................... 10 Table 3: Summary of Units Proposed for Harvest and Fuel Treatments ....................................... 15 Table 4: Summary of Units with only Fuel Treatments ................................................................ 19 Table 5: Summary Activity Table by Land Allocation ................................................................. 20 Table 6: Resource Protection Measures ........................................................................................ 21 Table 7: Summary of Seasonal Restrictions for Proposed Activities ............................................ 25 Table 8: Past Treatment Summary ................................................................................................ 28 Table 9: Spotted Owl Habitat Related to Crown Diameter and Canopy Cover ............................ 29 Table 10: Harris Mountain Spotted Owl Activity Center Summary ............................................. 31 Table 11: Belnap Springs (ST-222) Spotted Owl Activity Center Summary ............................... 31 Table 12: NSO Habitat Within Treatment Units. .......................................................................... 31 Table 13: Northern Spotted Owl Minimum Habitat Thresholds ................................................... 33 Table 14: Status of the spotted owl activity centers in the Harris Project Action Area. ............... 35 Table 15: Summary of Effect Intensity to Spotted Owl Habitat
a................................................... 38

Harris Vegetation Project Biological Assessment
iii
Table 16: Short and Long-Term Changes in Spotted Owl Nest/Roost and Foraging Habitat ....... 47 Table 17: Northern Spotted Owl Minimum Habitat Thresholds ................................................... 49 Table 18: Summary of Project Effects to Dispersal Habitat ......................................................... 50 Table 19: Northern Spotted Owl Critical Habitat .......................................................................... 55 Table 20: Changes in large diameter trees in critical habitat ........................................................ 57 Table 21: Effect Intensity to Spotted Owl Critical Habitat ........................................................... 57 Table 22: Short and Long-Term Changes to NRF and Connectivity within Critical Habitat ....... 57 Table 23: Summary of Effect to TES species................................................................................ 60 Table 24: Summary of National Forest Timber Harvest within the Action Area ......................... 77 Table 25: Past Action Area activities on National Forest System lands by project ...................... 77 Table 26: Past LSR/Critical habitat activities on National Forest System lands ........................... 80 Table 27: Action area activities on private land ............................................................................ 82 Table 28: Private land THPs completed with the Action Area by Year ........................................ 83 Table 29: Past Action Area activities by treatment ....................................................................... 83 Table 30: Past and Anticipated Future Action Area activities by treatment
1 ................................ 85
Table 31: NSO habitat unaffected by past and future activities (1965-2015) ............................... 86


Harris Vegetation Project Biological Assessment
1
I. Introduction
A. Purpose The purpose of this biological assessment is to review the proposed Harris Vegetation Management
Project in sufficient detail to determine whether the proposed action may affect any of the threatened,
endangered, or proposed species listed below. This biological assessment is prepared in accordance with
legal requirements set forth under Section 7 of the Endangered Species Act (16 U.S.C. 1536 (c)), and
follows the standards established in Forest Service Manual direction (FSM 2670.32).
B. Species Evaluated The species list for the project, using the legal requirements set forth under Section 7 of the Endangered
Species Act and Forest Service manual direction (FSM 2672.42), was obtained from the Arcata Fish and
Wildlife Office website http://arcata.fws.gov , dated March 25,2011 document number: 615772918-72542
(USFWS 2011 Attachment 1). Of the species listed, the following species will be evaluated in detail in
this Biological Assessment (BA):
Northern spotted owl (Strix occidentalis caurina)---------------Threatened
The Harris project area is not within the current range of and/or does not provide habitat for fourteen
species found on the Fish and Wildlife Service list of Threatened, endangered and Candidate species
(Attachment 1). These species and specific rationale for elimination from detailed analysis is provided
below.
California Red-legged Frog (Rana draytonii) – Although the project area is within the Sierra Nevada
Foothills and Central Valley recovery plan, it is outside its current range (USFWS 2002). As a result there
will be No Effect to the California red-legged frog.
Vernal Pool Tadpole Shrimp (Branchinecta lynchi)– Although this species has been found in suitable lake
habitat within the porcupine watershed (USDA FS 2003), due to the absence of aquatic habitat and
considering the dry conditions and porous nature of the soils which prevent development of upland water,
the project area does not provide suitable habitat for this species. As a result there will be No Effect to
vernal pool tadpole shrimp.
Mardon Skipper (Polites marton) – The project area lacks fescue dominated openings that would provide
suitable habitat for this species (personal communication with Rhonda Posey-3/15/10). As a result and
considering that the project area is over 50 miles from the closest known location (USFWS 2009b), there
will be No Effect to the Mardon skipper.
Oregon Spotted Frog (Rana pretiosa) – The project area is outside the current range of this species
(USFWS 2009a) and there will be No Effect to the Oregon spotted frog.
Western yellow-billed cuckoo (Coccyzus americanus) – The project area is outside the range and lacks
riparian habitat preferred by this species and there will be No Effect to the Western yellow-billed cuckoo.
Shasta Crayfish (Pacifastacus fortis), Green Sturgeon (Acipenser medirostris), Shortnose Sucker
(Chasmistes brevirostris), Lost River Sucker (Deltistes luxatus), Coho Salmon (N or S Calif.)
(Oncorhynchus kisutch), Central Valley Steelhead (Oncorhynchus mykiss), Central Valley spring run
Chinook Salmon (Oncorhynchus tshawytscha), Central Valley fall/late fall Chinook Salmon
(Oncorhynchus tshawytscha), Winter Run Chinook Salmon -(Oncorhynchus tshawytscha). Because the

Harris Vegetation Project Biological Assessment
2
project area lacks suitable aquatic habitat, and considering the high soil infiltration rate and that small
ephemeral streams outside the project area only flow short distances, there will be No Effect to these
species.
Effects of the Harris proposed action on both the fisher (Martes pennant), a federal candidate species and
the wolverine (Gula gulo luscus), which warrant listing but is not yet listed (USFWS 2011) are addressed
in the Harris Biological Evaluation.
C. Critical Habitat The Final Revised Critical Habitat (CH) for the northern spotted owl was designated by the U.S. Fish and
Wildlife Service on September 12, 2008. The Harris Project Area, which is addressed in this Biological
Assessment includes 2,210 acres of Northern spotted owl critical habitat (Unit 29, subunit CA-73).
II. Legal Requirements and Consistency with Recovery Plan This Biological Assessment conforms to legal requirements set forth in Section 7 of the Endangered
Species Act (19 U.S.C. 1536 (c), 50 CFR 402.12 (f) and 402.14 (c), and the requirements in Forest
Service Manual Direction (FSM 2672.42). Also as described below, the Shasta-Trinity National Forest
(STNF) is currently operating in full compliance with the Record of Decision for Amendments to Forest
Service and Bureau of Land Management Planning Documents within the Range of the Northern Spotted
Owl (ROD; USDA Forest Service and USDI Bureau of Land Management, 1994). As a result, and
considering proposed activities help to ensure the long-term sustainability of the Harris Late Successional
Reserve (LSR) and spotted owl critical habitat, proposed activities are consistent with recovery strategies
identified for the Northern spotted owl (USDI 2008).
III. Consultation To-Date The Harris Project is located entirely within Siskiyou County, California. An updated species list for
Siskiyou County was obtained from the Arcata Fish and Wildlife Office website http://arcata.fws.gov
dated (March 25, 2011) document number: 615772918-72542 (USFWS 2011). This list can be found in
Attachment 1 of this document.
Keith Paul of the U.S. Fish and Wildlife Service (USFWS), Red Bluff Office was initially consulted on
5/31/2009. The following is a brief summary of this and subsequent consultation with the USFWS related
to the Harris project:
5/31/09 – Keith Paul was sent a brief summary of the proposed action, including a map of
treatments and existing northern spotted owl documentation. Also a request was made to have
Keith review the project on the ground, if possible.
6/11/2009 – Phone conversation between Scott Reitz and Keith Paul to discuss the project.
7/7/2009 – A field review date of August 20, 2009 was confirmed via email.
7/23/09 – Keith Paul recommended to Debbie Derby, Shasta-McCloud Wildlife Biologist, that
projects on the Shasta-Trinity Forest analyze northern spotted owl habitat using a 0.5 mile core
and 1.3 mile territory.

Harris Vegetation Project Biological Assessment
3
8/20/2009 – A field review of the project was conducted by Keith Paul (USFWS), Michelle
Havens (USFWS), Scott Reitz (USFS) and Debbie Derby (USFS). This review concentrated on
treatments proposed in the Harris activity center territory and home range. Baseline habitat
conditions within treatment units and northern spotted owl status and surveying were also
discussed.
9/28/09 – Scott Reitz provided a summary of possible treatment changes to Keith Paul and
Michelle Havens resulting from the 8/20 review, including a draft list of mitigation measures and
maps. Proposed treatment changes provided by Keith and Michelle were incorporated into the
proposed action.
9/29/09 – Michelle Havens provided a list of recommended mitigation measures that should be
included to reduce potential impacts to the northern spotted owl. These mitigation measures were
incorporated into the proposed action and are displayed in Table 6.
10/13/09 – Scott Reitz informed Keith Paul and Michelle Havens that the project had been pushed
back and that the BA would probably not be submitted until March/2010 or later. Keith and
Michelle were also asked for northern spotted owl minimum thresholds.
10/15/09- Michelle Havens provided northern spotted owl minimum habitat needs within the core
and home range.
10/10/10 – An updated Biological Assessment Template was received from the Red Bluff Office.
IV. Current Management Direction The Shasta-Trinity National Forest (STNF) is currently operating in full compliance with the Record of
Decision for Amendments to Forest Service and Bureau of Land Management Planning Documents
within the Range of the Northern Spotted Owl (ROD; USDA Forest Service and USDI Bureau of Land
Management, 1994). The Regional Forester approved the STNF Land and Resource Management Plan
(Forest Plan or LRMP) on April 28, 1995 and it became effective as of June 5, 1995. The Northwest
Forest Plan ROD was incorporated into the Forest Plan.
The Forest Plan adopts the ROD as the Federal contribution to the recovery of the northern spotted owl.
The STNF expects management objectives within the network of areas including wilderness, late-
successional reserves, riparian reserves, and administratively withdrawn areas combined with standards
and guidelines related to snag, log, and hardwood retention to provide habitat adequate to maintain viable
well-distributed populations of federally listed or proposed species.
The following is a discussion of specific LRMP, LSR and critical habitat management direction
applicable to the Harris project.
A. Forest Plan Prescription and Management Areas The Harris project is located on the Shasta-McCloud Management Unit of the STNF. National Forest
System lands within the project area include the matrix, Late Successional Reserve and special
management prescription areas (riparian reserve), as identified in the LRMP (USDA FS 1995) and
Northwest Forest Plan (USDA FS 1994). The LRMP also identifies Management Areas (MA) that
provides separate management direction in response to localized issues and resource opportunities and the
Harris project area includes portions of the Porcupine Butte and McCloud Flats Management Areas MAs.

Harris Vegetation Project Biological Assessment
4
Land and Resource Management Plan prescription and management areas found within the Harris project
area are summarized in Table 1 and discussed in brief below.
Table 1: Prescription and Management Area Lands within the Harris Project Area
Prescription Area
Project
Area
Management Areas
Porcupine Buttes Management Area
7968 acres (87%)
McCloud Flats Management Area
(1201 acres (13%)
Acres % Acres % Acres %
Matrix 6,948 75 5,748 72 1,201 98
Roaded Recreation* 74 <1 51 <1 23 2
Wildlife Habitat Mgt*. 3378 37 2,559 32 819 67
Commercial Wood* 3,496 38 3,138 39 359 29
Riparian Reserve 10 <1 10 <1 0 0
LSR 2,210 25 2,210 28 0 0
Total 9,168 100 7,968 NA 1,201 NA
*-acres included in the matrix total
Roaded Recreation - This prescription emphasizes recreation opportunities associated with developed
road systems and dispersed and developed camp sites. Fish and wildlife management, which supports the
recreational use of wildlife species, is also emphasized. The emphasis of vegetation management
activities will be to meet recreation, visual, and wildlife objectives while maintaining healthy and
vigorous ecosystems.
Wildlife Habitat Management - The primary purpose of this prescription is to maintain and enhance big
game, small game, upland game bird and non-game habitat, thereby providing adequate hunting and
viewing opportunities. Habitat management for species which are primarily dependent upon early and
mid-seral stages is an important consideration. While this prescription does not emphasize those wildlife
species dependent on late seral stages, habitat favorable to these species will occur within this
prescription. Vegetation is manipulated to meet wildlife habitat management objectives and to maintain
healthy, vigorous stands using tools such as silviculture and prescribed fire.
Commercial Wood Product Emphasis - The purpose of this prescription is to obtain an optimum timber
yield of wood fiber products from productive forest lands within the context of ecosystem management.
Investments will be made in road construction, fuels management, reforestation, vegetation management
and timber stand improvement. Vegetative manipulation will provide habitat for those wildlife species
primarily dependent on early and mid-seral stages.
Riparian Reserve – Riparian reserves in combination with Late Successional and other reserves are to
provide connecting travel corridors for wildlife, particularly late-successional dependent species and
provide for the protection of sensitive wildlife dependent on riparian areas and the adjacent upland
(USDA FS 1995). Activities that retard or prevent attainment of Aquatic Conservation Strategy are no
permitted. However silvicultural activities can be used to control stocking, re-establish and manage stands
and acquire desired vegetation management characteristics needed to attain Aquatic Conservation
Strategy objectives (USDA FS 1995). Fish and wildlife management in this prescription area emphasizes
restoration and enhancement activities that contribute toward attainment of the Aquatic Conservation
Strategy (USDA FS 1995).

Harris Vegetation Project Biological Assessment
5
B. LSR Direction and Management Late Successional Reserves are to be managed to protect and enhance conditions of late-successional and
old-growth related forest ecosystems and the species that depend on them such as the northern spotted
owl. A Forest Wide Assessment was completed to develop management strategies for LSRs, determine
their sustainability and help decision makers achieve LRMP objectives (USDA FS 1999). This analysis
provides the best available information related to future LSR needs and based on existing conditions, the
following objectives (USDA FS 1999 pp 175-181) should be emphasized for the Harris LSR (RC-359):
1. Objective I - Protect existing late successional habitat from threats (habitat loss) that occur inside
and outside the LSR. This has application to the Harris LSR because it has had more than two
years of high insect and disease related mortality, has increased fuels and has a large block of
private land to the east which is at higher fire risk due to past harvest. Consequently 25% of the
LSR is considered to be at a high risk from fire and 75% is at medium risk (USDA FS 1999 p.
154) .
2. Objective II - Promote the continued development of late successional characteristics. This has
strong application for the Harris LSR because it currently contains large amounts of early and
mid-successional habitat. Harris was also identified as a priority for treatment under this
objective.
3. Objective III - Protect mid and early successional vegetation from loss to large-scale
disturbances.
V. Description of the Proposed Action
A. Location of the Proposed Action The Harris Vegetation Management Project is located on the Shasta-McCloud Management Unit, Mt
Shasta Ranger District on the Shasta Trinity National Forest (See Figure 1). It includes 9,168 acres in
Siskiyou County California, Mt. Diablo Meridian, T41N, R10E sections 1 and 2, T41N, R20E Sections 1-
12, T42N, R10E Section 36, T42N, R20E Sections 17- 21, and 28-36.

Harris Vegetation Project Biological Assessment
6
Figure 1: Harris Vicinity Map

Harris Vegetation Project Biological Assessment
7
B. Purpose and Need for Action (Objectives) Five objectives were identified to achieve the purpose and need of the Harris Project. The following is a
brief summary of each:
Improve Forest Diversity and Health
The project area contains a large lodgepole pine component and many of these stands are experiencing
wide-spread mountain pine beetle mortality (See Figure 2). Tree mortality associated with disease and
drought is also affecting the overstory of many stands, with disease spreading into seedling/sapling sized
trees. Proposed treatments are designed to promote disease free trees and create a young, vigorous stand
of lodgepole pine mixed with ponderosa pine and white fir. This will improve species diversity and stand
health and help to ensure that over the long-term, suitable northern spotted owl habitat will be available.
Figure 2: Lodgepole Mortality within the Harris LSR
Develop Late Successional Forest
Late Successional Reserves are to be managed to protect and enhance conditions of late-successional and
old-growth related forest ecosystems, which serve as habitat for species such as the northern spotted owl.
While some late successional forest and nest/roost habitat exists within the LSR, this is currently largely
limited to a few sites immediately adjacent to Harris Mountain (See Map 2 in Attachment 2). Also many
stands within the LSR are overcrowded, which increases competition for light and nutrients and causes
mortality, particularly to larger diameter trees. As a result there is a need to thin overcrowded early and
mid-successional stands to promote the development of late successional characteristics, decrease risk of
insect and disease mortality and improve the distribution of northern spotted owl habitat within the LSR
(LSR objective II, USDA FS 1999).
Reduce Risks from Wildfire
Stands throughout the project area have accumulated surface and ladder fuels that would threaten
overstory trees in the event of a wildfire (See Figure 2). Consequently high levels of tree mortality are
predicted in the event of a wildfire (USDA FS 1999, Chapter 4). Also approximately 25 percent of the
Harris Mountain LSR is considered to be at high risk from catastrophic fire, whereas the remainder is at

Harris Vegetation Project Biological Assessment
8
medium risk (USDA FS 1999). In order to reverse the current trend and reduce the likelihood from large
scale disturbances (LSR objective III, USDA FS 1999), there is a need to accomplish the following:
Remove ladder fuels that could threaten the large, mature overstory trees in a wildfire event by
removing ladder fuels..
Shift stand species composition from pine mixed with white fir regeneration to stands
predominately composed of pine.
Decrease concentrations of surface fuels where they are in excess of those needed to meet Forest
Plan standards and guidelines (USDA FS 1995, p. 4-67, Appendix G).
Reintroduce fire through low-intensity under-burning after ladder fuels are removed.
Maintain Aspen and Oak
While California black oak and aspen contribute to native biodiversity, they are very limited in the project
area. Several small groups or clumps of aspen exist; however, conifer trees have seeded in and are
competing for sunlight, water, and nutrients. Due to competition for light and nutrients, combined with
browsing, the sprouts could eventually be lost, which would decrease plant species richness (Bartos
2001). Oak is also a minor component of some stands and will be slowly replaced by conifers in the
absence of disturbance. In order to maintain these important vegetation/habitat components, it is
necessary to remove conifers within the aspen and oak patches.
Reduce Roading
There is a network of system roads to provide access for management on National Forest System lands
and adjacent private lands within the project area. Project-level roads analysis showed there are two
unclassified roads and two segments of Forest system roads that are unnecessary for management.
Consequently there is a need to decommission approximately 1.5 miles of unclassified and 0.5 mile of
unnecessary National Forest System road.
C. Timeline The Project is scheduled to be sold during 2011 and implementation would start in 2011 or early 2012.
Silvicultural activities could commence upon signing of the Record of Decision and may take up to 5
years to complete. Fuels treatments will occur approximately 3-5 years after silvicultural treatments are
completed. Because it is anticipated that it may take up to five years for the project to be completed, this
consultation will be in effect for five years from the date of the letter of concurrence. After that date,
consultation for Harris would be re-initiated. Additionally, section 7 regulations outline four general
conditions for reinitiating formal consultation: (1) the amount or extent of incidental take is exceeded; (2)
new information reveals effects of the action that may affect listed species or critical habitat in a manner
or to an extent not previously considered; (3) the action is modified in a manner causing affects to listed
species or critical habitat not previously considered; and (4) a new species is listed or critical habitat
designated that may be affected by the action (USDI and USDC 1998).
D. Treatment Description
Vegetation Modeling and Silvicultural Terminology
In order to identify treatments that can be implemented to achieve the purpose and need described above,
it is necessary to 1) identify the existing composition and structure of forested stands within the project
area, 2) predict future stand conditions that will occur under different management scenarios and 3)

Harris Vegetation Project Biological Assessment
9
identify current and future risks to wildfire. The Forest Vegetation Simulator (FVS) model is used to
provide this information.
The FVS model uses recent inventory data for the project (McCusker 2009) to describe stand conditions
as well as simulate growth and yield for project tree species and forest types. FVS can also simulate a
wide range of silvicultural treatments to predict future forest composition and structure that would occur
under different types of management. Also, the fire and fuels extension to the FVS simulates the
dynamics and potential fire behavior over time in the context of stand development and management. As
a result, it is used to predict existing and future fire risk. Finally, FVS model outputs such as Quadric
Mean Diameter (QMD), canopy cover, and the number and size of green trees and snags are used to
assess pre and post treatment NSO habitat conditions and the following is summary of some of the less
commonly known silvicultural terms that are used throughout this report:
Trees Per Acre, or TPA is a measure of how many trees occur on a single acre and is one measure
that is used to identify the number of trees on a site, which ultimately affects stand health. For
example a stand of 100 TPA that are 10 inches in diameter use a lot less site resources (water and
nutrients), than 100 TPA that are 20 inches in diameter. Consequently TPA is used in combination
with a measure of the stand diameter (QMD described below), to help assess site conditions.
Quadric Mean Diameter or QMD is a measure of the average tree diameter for a stand. This index
is used because it gives greater weight to larger diameter trees and is a better measure of the stand
as a whole, particularly larger diameter stands or stands with a wide range of tree sizes, such as
occurs on the Harris project area.
Stand Density Index or SDI, is based on the number of trees per acre (TPA) and the average stand
diameter (QMD), and is a measure of stand stocking. Also because the SDI for a given stand may
not change with age (e.g. older stands have less trees but their diameter is larger), this makes a
good basis for comparison. Consequently SDI is commonly used to identify the amount of
crowding in a stand, which determines stand health as well as fire risk and generally, stands with
a higher SDI will experience more mortality due to overcrowding, as well as experience increased
fire risk. Also individual stand prescriptions will target a desired SDI that will improve tree health
and growth and minimize fuel loading.
Silvicultural Treatments
Forest stand treatments would be accomplished primarily through commercial harvest. Harvest operations
would yield sawtimber (logs) and biomass (chips) products. Trees would be cut by hand falling with a
chainsaw or mechanized fellers, then, removed, and processed with mechanized equipment. Harvested
trees would be transported from the stump to central landing areas next to roads where they would be
limbed and processed into logs or chips. Anticipated changes in northern spotted owl habitat from these
treatments are described under section VI. The following is a discussion changes that will occur under the
individual treatments, with Table 2 summarizing pre and post treatment structural changes, and Table 3
summarizing harvest in individual units. Treatment units are displayed on Map 1.
Harris Vegetation Project Biological Assessment
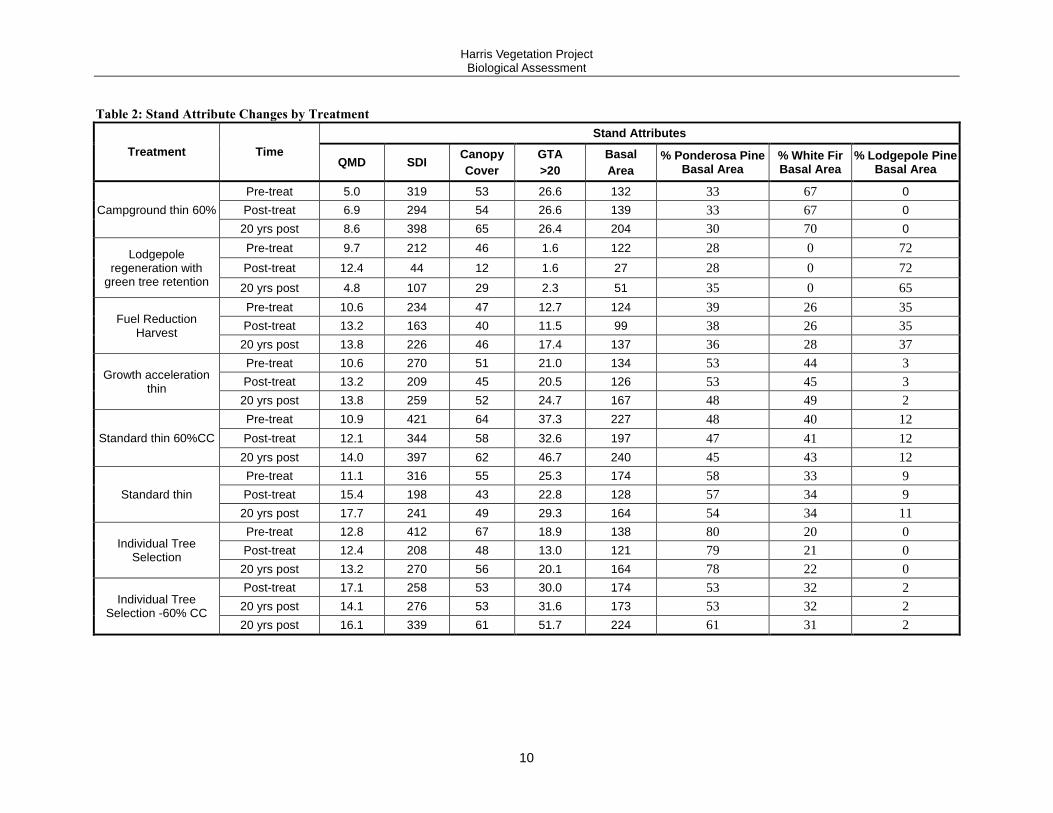
10
Table 2: Stand Attribute Changes by Treatment
Treatment Time
Stand Attributes
QMD SDI Canopy
Cover
GTA
>20
Basal
Area
% Ponderosa Pine Basal Area
% White Fir Basal Area
% Lodgepole Pine Basal Area
Campground thin 60%
Pre-treat 5.0 319 53 26.6 132 33 67 0
Post-treat 6.9 294 54 26.6 139 33 67 0
20 yrs post 8.6 398 65 26.4 204 30 70 0
Lodgepole regeneration with
green tree retention
Pre-treat 9.7 212 46 1.6 122 28 0 72
Post-treat 12.4 44 12 1.6 27 28 0 72
20 yrs post 4.8 107 29 2.3 51 35 0 65
Fuel Reduction Harvest
Pre-treat 10.6 234 47 12.7 124 39 26 35
Post-treat 13.2 163 40 11.5 99 38 26 35
20 yrs post 13.8 226 46 17.4 137 36 28 37
Growth acceleration thin
Pre-treat 10.6 270 51 21.0 134 53 44 3
Post-treat 13.2 209 45 20.5 126 53 45 3
20 yrs post 13.8 259 52 24.7 167 48 49 2
Standard thin 60%CC
Pre-treat 10.9 421 64 37.3 227 48 40 12
Post-treat 12.1 344 58 32.6 197 47 41 12
20 yrs post 14.0 397 62 46.7 240 45 43 12
Standard thin
Pre-treat 11.1 316 55 25.3 174 58 33 9
Post-treat 15.4 198 43 22.8 128 57 34 9
20 yrs post 17.7 241 49 29.3 164 54 34 11
Individual Tree Selection
Pre-treat 12.8 412 67 18.9 138 80 20 0
Post-treat 12.4 208 48 13.0 121 79 21 0
20 yrs post 13.2 270 56 20.1 164 78 22 0
Individual Tree Selection -60% CC
Post-treat 17.1 258 53 30.0 174 53 32 2
20 yrs post 14.1 276 53 31.6 173 53 32 2
20 yrs post 16.1 339 61 51.7 224 61 31 2

Harris Vegetation Project Biological Assessment
11
Standard Thin
Overcrowded forest stands would be thinned by removing primarily smaller diameter trees to achieve
desired stocking (see post-treatment BA in Table 2). The vast majority of the trees removed will be
between 10 and 19.9 inches, although up to 140 trees between 20 and 29 inches in diameter may be
removed across 250 acres, which represents one percent of the total trees greater than 20 inches diameter
on these sites. Also all harvest would occur outside the LSR/CH. Excess trees would be removed as
sawlogs (trees 10 inches and greater in diameter) and biomass material (trees 4 to 9.9 inches in diameter).
Thinning treatments would vary, depending on the management prescription and objective. Treatment
objectives include improved stand health and growth, improved resistance to insect caused mortality,
reduced fuels and improved forage conditions. Snags and coarse woody debris would be maintained at
desired levels (See Table 6).
FVS modeling for this treatment identified the following; average QMD increased from 11.1 to 15.4
inches dbh in response to harvest, trees per acre >26 inches dbh stayed at 5 trees per acre, trees 20 inches
dbh decreased from 25 to 23 following harvest and increased to 29 in 2030, stand SDI was reduced from
316 to 198 following harvest and increased to 241 by 2030, canopy closure was reduced from an average
of 55 percent to 43 percent (range 40 to 55 percent) following harvest and coarse woody debris stayed at
10. Individual sites proposed for treatment including pre and post canopy conditions and forest type are
displayed in Table 3, whereas spotted owl habitat on the individual sites is displayed in Table 12.
Standard Thin with 60 percent canopy closure
Treatment is similar to the standard thinning described above, except that 60 percent canopy closure will
be retained. As a result, higher densities of white fir would be retained. Although this treatment will
maintain more overstory trees than standard thinning and harvest primarily trees in the 10-19 inch size
class , up to 340 trees between 20 and 29 inches dbh may be harvested across 332 acres. As a result, the
number of trees exceeding 26 inches dbh/acre decreased from 11 to 10 following harvest, although by
2030 numbers will increase to 19 trees per acre (TPA). Similarly, trees greater than 20 inches dbh
decreased from 37 to 33 following harvest, but increased to 47 in 2030. However all treatments would
occur on matrix lands outside the LSR. The average stand SDI decreased from 421 to 344 and the QMD
increased from 10.9 to 12.1. Canopy cover was reduced from 64 to 58 on average, because portions of
some stands are currently below 60, although where it exists, 60 percent canopy closure will be
maintained. Species composition remained relatively constant over time.
Campground Thin with 60% Crown Closure
An overcrowded stand surrounding the Harris Spring Campground would be thinned by removing
primarily understory and midstory trees. Trees that present a safety hazard to those using the campground
would be removed. Sixty percent crown closure would be maintained across the site where it currently
exists. Like standard thinning, the bulk of the trees to be removed will be less than 19.9 inches. Treatment
objectives include improved health of large diameter overstory trees, improved resistance to insect and
disease caused mortality, removal of trees posing a safety hazard and promoting the development of
understory trees to provide vegetative screening. Snags and coarse woody debris would be maintained at
desired levels (See Table 6).
FVS modeling for this treatment identified the following; average QMD increased from 5.0 to 6.9 inches
dbh in response to harvest, trees per acre >26 inches dbh stayed at 6, stand SDI was reduced from 319 to
294 following harvest and increased to 398 by 2030, canopy closure was maintained at 53 and increased
to 65 by 2030 and trees greater than 20 inches dbh remained relatively unchanged following harvest and
in 2030. Coarse woody debris was relatively unchanged.

Harris Vegetation Project Biological Assessment
12
Growth Acceleration or LSR Thin
Overcrowded forest stands within the Harris Mountain LSR would be thinned by removing primarily
trees in the 10 to 19.9 inch size class to achieve desired stocking (See BA column in Table 2), although
100 trees in the 20-25.9 inch size class will be removed over 165 acres. So while there will be no change
in trees >26 inches dbh following harvest (stay at 2.6 TPA), trees greater than 20 inches will be reduced
slightly from 21 to 20.5, whereas by 2030 trees >20 inches and >26 inches dbh will increase to 24.7 and
6.0 TPA respectively. Treatment objectives include improved stand health, focus growth on fewer trees to
promote development of large diameter trees, improve resistance to insect caused mortality, remove
ladder fuels, promote fire resistant species, release hardwood species, improve the growth of shrubs and
forage species and improve structural diversity in the stand.
Treatment is similar to standard thinning except that ten percent or more of the treated stands would
remain in un-thinned patches and up to 15 percent of treated stands would be in heavily thinned patches
or openings up to ¼ acre in size. This increases the diversity of stand conditions and helps to establish
structural diversity characteristic of late successional forests. Snags and coarse woody debris would be
maintained at desired levels (See Table 6).
FVS modeling for this treatment identified the following; average QMD will increase from 10.6 inches to
13.2 inches dbh, stand SDI decreased from 270 to 209 following harvest and increased to 260 by 2030,
average CWD (> 3.0 inches) will be 9.2 tons/acre, canopy closure decreased from 51 to 45 and there will
be a shift away from ponderosa pine and lodgepole toward white fir. Individual sites proposed for
treatment including pre and post canopy conditions and forest type are displayed in Table 3, whereas
spotted owl habitat on the individual sites is displayed in Table 12.
Lodgepole Regeneration with Green Tree Retention
All sites occur on matrix lands outside the LSR and spotted owl critical habitat. Overmature lodgepole
pine would be regenerated by harvesting most trees between 4 inches and 19.9 inches in diameter. At least
15 percent of the stand would remain uncut to meet the Forest Plan standard for green tree retention
(USDA FS 1995, p 4-61). Remaining trees would include ponderosa pine, sugar pine, white fir and
disease-free lodgepole pine. Fill-in planting would increase ponderosa pine and sugar pine stand
composition. A healthy stand of natural and planted seedlings is expected within 5 years of the harvest.
The treatment objectives are to remove diseased overstory lodgepole pine in close proximity to existing,
young lodgepole and regenerate a stand of lodgepole pine mixed with ponderosa and sugar pine.
Based on FVS modeling the average QMD will increase from 9.7 to 12.4, the SDI will decrease from 212
to 44 and canopy cover will be reduced from 46 to 12 immediately following harvest and increase to 29 in
2030. There would be no change in the number of trees greater than 20 inches dbh and treatment would
result in an average CWD (> 3.0 inches) of 7.2 tons/acre. Snags and coarse woody debris would be
maintained at desired levels (See Table 6). Individual sites proposed for treatment including pre and post
canopy conditions and forest type are displayed in Table 3, whereas spotted owl habitat on the individual
sites is displayed in Table 12.
Aspen and Oak Release
One aspen stand would be treated by removing conifers within 150 feet of aspen. The majority of the
trees to be removed on the aspen site are less than 10 inches and harvested as biomass, although some
trees in the 10-19 inch and 20-29 inch size class may also be removed in order to release existing aspen.
Trees than 4 inches in diameter would be slashed (cut, lopped and scattered). The treatment objective is to
restore aspen as the predominant stand species. The aspen stand is currently in decline and removal of the
conifers would provide good growing conditions for aspen sprouts. Snags and coarse woody debris would

Harris Vegetation Project Biological Assessment
13
be maintained at desired levels (See Table 6). California black oak trees occur at scattered locations
within treated stands. These trees would be released by removing all trees less than 20 inches dbh for a
distance of 30 ft. Seedling- and sapling-sized conifers growing under the canopy of oaks would be slashed
to reduce competition.
Fuel Reduction Harvest
This treatment occurs within the LSR/CH on sites that contain a larger lodgepole component and have
elevated levels of tree mortality (See Figure 2). Treatment would reduce fuel loading and retain all live,
disease free trees in the middle and upper canopy. As a result the vast majority of trees occur in the 10-19
inch size class, although approximately 255 trees high risk trees or that are in decline due to pine beetle
infestation between 20 and 25.9 inches dbh may be removed over 211 acres. Although there will be no
reduction of trees greater than 26 inches dbh and by 2030, trees greater than 20 inches dbh will increase
from 12.7 (2010) to 17.4
FVS modeling for this treatment identified the following; average QMD increased from 10.6 to 13.2
inches dbh, stand SDI will decrease from 264 to 163 following harvest and increase to 226 in 2030. An
average CWD (> 3.0 inches) of 9.2 tons/acre was maintained following harvest and species composition
remained constant. Individual sites proposed for treatment including pre and post canopy conditions and
forest type are displayed in Table 3, whereas spotted owl habitat on the individual sites is displayed in
Table 12.
Individual Tree Selection
The objective of this treatment is to promote an uneven-aged stand structure across all diameter classes.
The target stand density is 190 and the spatial arrangement of trees will vary from individuals to clumps,
replicating historic pine structure (Youngblood, Max and Coe 2004). As a result, this treatment will
harvest some trees from all size classes. So while the majority of trees harvested will be less than 19
inches in diameter, approximately 5000 trees between 20 and 25 inches in diameter (30 percent) will be
harvested over 925 acres. Although there will be no change in trees greater than 26 inches dbh and there
will continue to be in 13 green trees per acre greater than 20 inches dbh and by 2030 this will increase to
20.1. Because this treatment is only proposed within the Eastside Pine community, affected stands do not
currently provide suitable spotted owl habitat NRF habitat, although approximately 400 acres provide
dispersal habitat. Also there are no treatments proposed within the LSR or Critical Habitat.
The average QMD decreased slightly from 12.8 to 12.4 and the average stand SDI decreased from 412 to
208 immediately following harvest and increased to 208 in 2030. Canopy cover decreased from 67 to 48
immediately following harvest and increased to 56 in 2030, whereas by 2030, trees greater than 26 inches
will double from the present condition and species composition will remain relatively unchanged. Coarse
woody debris (> 3 inches dbh) will remain at approximately 4.5. Individual sites proposed for treatment
including pre and post canopy conditions and forest type are displayed in Table 3, whereas spotted owl
habitat on the individual sites is displayed in Table 12.
Individual Tree Selection with 60 percent canopy closure
Treatment is very similar to the individual tree selection except that 60 percent canopy closure would be
retained. Treatment results and management is similar to other 60 percent treatments including higher
canopy closure, higher stand density and limited stand composition changes. Like individual tree
selection, trees will be harvested from all size classes to create the desired uneven-aged structure. While
approximately 22 trees between 26 and 29 inches will be removed over 81 acres, the total number of trees
greater than 20 inches will increase from 30 to 31.5 immediately following harvest. Also by 2030, trees

Harris Vegetation Project Biological Assessment
14
greater than 25 inches dbh will double from the present condition and trees greater than 20 inches in
diameter will increase by 70 percent (51.7 TPA).
The average QMD will decrease from 17.1 to 14.1 immediately following harvest and increase to 16.1 by
2030. Stand SDI will increase following harvest from 258 to 276 and increase to 339 by 2030. Canopy
cover will be maintained at 53 percent following harvest and increase to 61 percent in 2030. While the
white fir composition remained constant, treatment will increase the ponderosa pine component by 2030.
Coarse woody debris will be maintained at 9. Individual sites proposed for treatment including pre and
post canopy conditions and forest type are displayed in Table 3, whereas spotted owl habitat on the
individual sites is displayed in Table 12.

Harris Vegetation Project Biological Assessment
15
Table 3: Summary of Units Proposed for Harvest and Fuel Treatments
Unit Land Allocation Acres Forest Type* Rx
Yarding
Method
Fuel
Rx
Canopy Closure
Pre Post
20 Matrix 39 LP Green Tree Retention WTY** Machine Pile & Burn 50 17
21 Matrix 46 Eastside
Pine Individual Tree Selection WTY
Chip at Landing/ Lop and Scatter
46 45
22 Matrix 51 Eastside
Pine Individual Tree Selection WTY Machine Pile & Burn 54 48
23 Matrix 72 Eastside
Pine Individual Tree Selection WTY
Chip at Landing/ Lop and Scatter
64 50
24 Matrix 114 Eastside
Pine Individual Tree Selection WTY
Chip at Landing/ Lop and Scatter
61 52
25 Matrix 31 Mixed Conifer Standard Thin WTY Chip at Landing/ Lop and
Scatter 50 40
26 Matrix 19 Mixed Conifer Standard Thin WTY Chip at Landing/ Lop and
Scatter 61 44
27 Matrix 13 LP Green Tree Retention WTY Machine Pile & Burn 43 13
28 Matrix 46 Mixed Conifer Standard Thin
(Maintain 60% CC) WTY
Chip at Landing/ Lop and Scatter
66 61
29 Matrix 20 Mixed Conifer Standard Thin
(Maintain 60% CC) WTY
Chip at Landing/ Lop and Scatter
69 63
31 Matrix 58 Eastside
Pine Individual Tree Selection WTY Underburn 62 47
32 Matrix 34 Mixed Conifer Standard Thin
(Maintain 60% CC) WTY
Chip at Landing/ Lop and Scatter
55 53
33 Matrix 19 Eastside
Pine
Standard Thin
(Maintain 60% CC) WTY
Chip at Landing/ Lop and Scatter
55 53
34 Matrix 18 PP, WF Standard Thin WTY Chip at Landing/ Lop and
Scatter 47 46
35 Matrix 10 PP, WF Standard Thin WTY Underburn 66 42
36 Matrix 44 PP, WF Individual Tree Selection WTY Underburn 49 40
37 Matrix 55 PP, WF Individual Tree Selection WTY Underburn 62 45
38 Matrix 23 Eastside
Pine Individual Tree Selection WTY
Chip at Landing/ Lop and Scatter
62 49
39 Matrix 158 Eastside
Pine Individual Tree Selection WTY
Chip at Landing/ Lop and Scatter
66 45

Harris Vegetation Project Biological Assessment
16
Unit Land Allocation Acres Forest Type* Rx
Yarding
Method
Fuel
Rx
Canopy Closure
Pre Post
40 Matrix 35 Eastside
Pine Individual Tree Selection WTY
Chip at Landing/ Lop and Scatter
80 51
41 Matrix 114 Eastside
Pine Individual Tree Selection WTY Underburn 57 48
42 Matrix 77 Eastside
Pine Individual Tree Selection WTY
Chip at Landing/ Lop and Scatter
92 49
43 Matrix 69 Eastside
Pine Individual Tree Selection WTY Underburn 64 47
44 Matrix 9 Eastside
Pine Individual Tree Selection WTY
Chip at Landing/ Lop and Scatter
92 49
52 Matrix 59 PP, WF Standard Thin WTY Underburn,
Machine Pile & Burn 52 42
53 Matrix 114 PP, WF Standard Thin WTY Underburn 54 44
54 Matrix 22 PP, LP Green Tree Retention WTY Machine Pile & Burn 52 12
55 Matrix 137 Mixed Conifer Standard Thin
(Maintain 60% CC) WTY Underburn 65 56
56 Matrix 58 Mixed Conifer Standard Thin
(Maintain 60% CC) WTY
Chip at Landing/ Lop and Scatter
80 61
57 Matrix 29 LP Green Tree Retention WTY Chip at Landing/ Lop and
Scatter 46 12
58 Matrix 6 Mixed Conifer Standard Thin WTY Chip at Landing/ Lop and
Scatter 73 48
113 Roaded Recreation 14 PP, WF Campground Thin
(Maintain 60% CC) WTY
Chip at Landing/ Lop and Scatter
60 53
174 CH 29/RC 359 41 LP Fuel Reduction WTY Machine Pile & Burn 54 50
175 CH 29/RC 359 55 LP LSR Thin WTY Chipped at Landing 38 38
180 Matrix 41 LP Fuel Reduction WTY Chip at Landing/ Lop and
Scatter 46 40
181 Matrix 81 Eastside
Pine
Ind. Tree Selection
(Maintain 60% CC) WTY
Chip at Landing/ Lop and Scatter
54 53
183 CH 29/RC 359 14 PP, WF Fuel Reduction WTY Chip at Landing/ Lop and
Scatter 53 40
183 Matrix 8 PP, WF Fuel Reduction WTY Chip at Landing/ Lop and
Scatter 53 40
185 CH 29/RC 359 7 PP, WF LSR Thin WTY Chip at Landing/ Lop and
Scatter 53 44

Harris Vegetation Project Biological Assessment
17
Unit Land Allocation Acres Forest Type* Rx
Yarding
Method
Fuel
Rx
Canopy Closure
Pre Post
185 Matrix 3 PP, WF LSR Thin WTY Chip at Landing/ Lop and
Scatter 53 44
186 CH 29/RC 359 21 PP, WF Aspen Release WTY Chip at Landing/ Lop and
Scatter 63 41
189 CH 29/RC 359 10 PP, WF Fuel Reduction WTY Chip at Landing/ Lop and
Scatter 53 40
192 CH 29/RC 359 34 LP Fuel Reduction WTY Chip at Landing/ Lop and
Scatter 39 39
194 CH 29/RC 359 24 LP Fuel Reduction WTY Chip at Landing/ Lop and
Scatter 51 40
196 CH 29/RC 359 12 LP Fuel Reduction WTY Chip at Landing/ Lop and
Scatter 40 40
197 Matrix 7 LP, PP Standard Thin WTY Chip at Landing/ Lop and
Scatter 42 40
199 Roaded Recreation 13 PP, WF Standard Thin WTY Chip at Landing/ Lop and
Scatter 53 44
200 Roaded Recreation 5 Mixed
Conifer
Standard Thin
(Maintain 60% CC) WTY
Chip at Landing/ Lop and Scatter
63 61
200 Matrix 13 Mixed Conifer Standard Thin
(Maintain 60% CC) WTY
Chip at Landing/ Lop and Scatter
63 61
223 CH 29/RC 359 27 Mixed Conifer Fuel Reduction WTY Machine Pile & Burn 40 40
311 Matrix 7 Eastside
Pine Standard Thin WTY
Chip at Landing/ Lop and Scatter
92 50
* - PP = ponderosa pine, WF= white fir, LP = lodgepole, **-whole tree yard

Harris Vegetation Project Biological Assessment
18
Fuel Treatments
Forest fuels would be reduced within harvest units by decreasing understory and mid-story stocking,
which would reduce ladder fuels. Commercial and biomass timber harvest would be accomplished
primarily with whole-tree skidding, which drags the entire tree to a landing, where it’s processed and
made it into logs or wood chips. Minor amounts of slash would remain in the forest as a result of harvest
activities. Portions of trees not used as logs or chips would be piled and burned at a landing. The
following fuel treatments would be in addition to whole-tree skidding and Table 4 summarizes fuel and
dead wood components on affected sites. Effects of these treatments on spotted owl habitat are discussed
below under section VI B- treatment effects.
Machine Pile and Burn
Harvest-generated fuels, natural fuels, brush, and heavy accumulations of litter would be piled with
mechanize equipment such as a tractor-mounted brush rake or a grapple. Piles would be burned when
there is low fire danger. This treatment would also reduce concentrations of natural fuels and those
created from harvest activities resulting in predicted fire behavior within desired intensities. Piles would
be retained within all treatment units (See Table 6). Effects of these treatments on spotted owl habitat are
discussed below under section VI B- treatment effects.
Underburn
Natural and harvest-generated fuels would be broadcast burned in place with a low-intensity surface fire.
This treatment would be applied to forest stands with low fuel loading that have a developing understory
of conifer saplings. The low-intensity burn would reduce surface fuels along with developing ladder fuels
of conifer saplings. Underburning would require control lines where forest litter is cleared down to
mineral soil. Control lines would be constructed by hand crews or small crawler tractors, or be provided
by existing roads. This treatment would reduce natural and activity-generated fuels and reduce predicted
fire behavior to within desired intensities. All sites proposed for burning would retain CWD and
understory vegetation prescribed in Table 6.
There is no underburning proposed within the LSR or Critical Habitat. FVS modeling for stands that are
underburned indicates that up to 200 trees between 20 and 25 inches dbh and 200 trees between 8 and 19
inches dbh may be lost across 660 acres of matrix lands. Although there will be a 240 tree increase in the
number of trees >26 inch dbh. Also the reduction in trees between 20 and 25 only represents a 2 percent
reduction in the trees in this size class and there will continue to be over 13 trees >20 inches dbh/acre.
Overall, FVS modeling indicates that; the average QMD will increase from 14 to 15 following harvest
and increase to 18 inches by 2030, and that the SDI will decrease from 166 to 143 following harvest on
average and increase to 180 by 2030. Most of the underburning sites are already well below 40 percent
and on average, canopy closure will decrease from 37 to 34 percent. Burn unit 2 contains the largest
spotted owl suitable habitat component (foraging) and canopy closure on this site will be reduced from 48
to 44 percent.
Chip at Landing and Lop and Scatter
All units will be whole tree yarded, where harvested trees would be transported from the stump to central
landing areas next to roads. As a result most of the fine fuels will be chipped at the landing. Top wood
and other material less than 3 inches in diameter that remains on site will be lopped and scattered. This is
a hand treatment where elevated branches are cut and scattered to a height of less than 3 feet to increase
decomposition and lower the fire hazard on the site. Effects of these treatments on spotted owl habitat are
discussed below under section VI B- treatment effects.

Harris Vegetation Project Biological Assessment
19
Table 4: Summary of Units with only Fuel Treatments
Unit Land
Allocation/CHU
Acres Fuels Rx Ignition method
Current
Fuel Condition
b
Fuels Consumption
Objective
Time of Year
Down Wood
(>3”) #/ac
Snags
(> 16”) #/ac
1
Matrix
108
Underburn Drip Torch
Low
1-3 inch
Fall 5.0 3
2 117 Low 9.7 2
3 63 Moderate
Year-longa
8.6 9
4 4 Moderate 9.1 4
5 16 Moderate 6.1 4
6 3 Low 9.1 4
7 1 Low 5.0 2
8 8 Mod-High 5.0 1.5
9 52 Mod-High Year-long 6.1 4.5
10 4 Low Year-longa 5.0 1.5
11 2 Low Year-long 6.1 4.5
12 98 Low
Year-longa
5.0 1.5
13 26 Low 5.0 1.5
14 122 Low 5.0 1.5
a - burning could occur during the spring, summer or fall, depending on weather and burning conditions b - current fuel conditions are expressed as a measure of fire line burning intensity, with low resulting in a surface fire with a high likelihood of control and mod to high resulting in crown fires making control more difficult.
Other Activities
Landing Construction
It is estimated that landings may need to be constructed on up to 15 acres. Treatment would consist of
removing all overstory vegetation on up to ½ acre at each site. On sites with existing landings, no
overstory trees would be removed and treatment would only involve removal of understory vegetation.
Final landing locations would be identified during sale administration.
Transportation Management
Two unnecessary National Forest System roads and two unclassified roads would be decommissioned and
removed from the transportation system totaling approximately 2.0 miles. Decommissioning would
involve scarifying the surface to break up compacted soils, seeding with native vegetation, and blocking
the road to vehicle traffic with slash, rocks, and barricades or a combination of these. The average width
of decommissioned roads would be 15-20 feet.
Road Maintenance/Improvement
Road maintenance would be conducted prior to log hauling and would involve removal of brush along the
road edge and the surface would be bladed to provide a smooth running surface and proper drainage. Spot
surfacing with rock would be completed as necessary.
Treatment Summary
Proposed activities described above are summarized by land allocation in Table 5.

Harris Vegetation Project Biological Assessment
20
Table 5: Summary Activity Table by Land Allocation
Activity Land Allocation Acres or Miles
CHU - Acres or Miles
Comments*
Standard Thinning 284 Matrix 0 Reduced by 1,006 acres and changed to
individual tree selection.
Green Tree Retention (GTR) 103 Matrix 0 All LSR/CHU GTR changed to fuel reduction.
Individual Tree Selection 925 Matrix 0 Modified from standard thinning to maintain
more canopy cover/structure
Campground Thinning
(maintain 60% CC) 14 Matrix 0
Modified to maintain more canopy cover for late successional species
Standard Thinning
(Maintain 60% CC) 332 Matrix 0
Modified to maintain more canopy cover for late successional species
Aspen Release 21 LSR 21 No change
Fuel Reduction 162 LSR
49 Matrix 162
Increased in LSR/CHU to reduce fire risk while maintaining canopy cover/structure.
Individual Tree Selection
(Maintain 60% CC). 81 Matrix 0
Modified to maintain more canopy cover for late successional species
LSR Thinning 62 LSR
3 Matrix 62
160 acres deferred to maintain spotted owl NRF habitat.
Underburn 660 Matrix 0 No Change
Tractor-Pile 184 Matrix
68 LSR 68 No Change
Other (chip at landing and lop/scatter)
1,006 Matrix
177 LSR 177
Reduced by 160 acres within the LSR/CHU by deferring LSR thinning units
Road decommissioning 1.9 Matrix
0.1 LSR 0.1 No Change
Road Maintenance 34.4 Miles Matrix
6.7 LSR 0 No Change
Landings 13 Matrix
2 LSR 2
Reduced by half within the LSR/CHU by deferring LSR thinning units.
* – comments reflect changes under Alternative 2 from the original proposed action

Harris Vegetation Project Biological Assessment
21
E. Project Design Features The Harris Vegetation project has been designed to be consistent with the standards and guidelines (S & G) that are listed in the LRMP (USDA FS
1995), Northwest Forest Plan (USDA FS 1994) and Forest LSR Assessment (USDA FS 1999). Also because some standard and guidelines
between these documents differ, in all cases the more restrictive S & G and/or S & G most beneficial to wildlife will be implemented. Project
specific S & Gs that are designed to protect or promote the northern spotted owl or its habitat are displayed in Table 6, whereas northern spotted
owl Limited Operating Periods (LOPs) are summarized in Table 7.
Table 6: Resource Protection Measures
Number Resource Protection Measure Target
Species Units/Location
Underburning and Machine Pile and Burn Project Design Features
BFT-4 Leave 1 unburned machine pile per acre on matrix lands to provide small mammal habitat. Piles should be approximately 20 feet wide, by 20 feet long, by six feet high.
NSO Units: 20, 22, 27, 52, 54.
BFT-5 Leave 2 unburned machine piles per acre in the LSR to provide small mammal habitat. Piles should be approximately 20 feet wide, by 20 feet long, by six feet high.
NSO Units: 174, 223.
BFT-6
Avoid the consumption of large coarse woody debris (logs greater than 10 inches in diameter at midpoint) when underburning within matrix lands with wildlife emphasis to the extent possible. Where feasible, use control lines and/or firing techniques to maintain untreated pockets of understory vegetation and shrubs retained during harvest, and small pockets of understory vegetation at scattered locations in un-harvested burn units.
NSO Units: 1, 2, 5, 8-14, 31, 36, 41, 43, 52, 53, 55.
BFT-7 Underburning will retain 30 to 50 percent of the existing shrub cover within Matrix lands with wildlife emphasis. To the extent possible, remaining shrubs should be retained as a mosaic across the site with bitterbrush being preferred for retention.
NSO Units 1, 2, 5, 8-14, 31, 36, 41, 43, 52, 53, 55.
Coarse Woody Debris and Snags Design Features
CWD-1
Existing coarse woody debris on the ground and decayed embedded logs will be retained and protected from disturbance during project activities to the greatest extent possible. The following rates will apply by management area:
NSO All units
Roaded recreation management prescription: Maintain an average of 10 tons of unburned down/dead material, with a preference to have 4 to 6 logs per acre that are 6 inches or greater in diameter and 10 feet in length.
NSO Units: 113, 199, 200.
Matrix management prescription: maintain an average of 5 tons of unburned down/dead material, with a preference to have 4 to 6 logs per acre that are 6 inches or greater in diameter and 10 feet in length.
NSO Units: 1-14, 20-29, 31-44, 52-58, 180, 181, 197, 200, 311

Harris Vegetation Project Biological Assessment
22
Number Resource Protection Measure Target
Species Units/Location
Late-successional reserve, mixed-conifer communities: maintain an average of 6 to 7 tons per acre, with a preference to have 4 to 6 logs per acre that are 6 inches or greater in diameter and 10 feet in length.
NSO Units: 175, 183, 185, 189, 223
Late-successional reserve, lodgepole pine communities: maintain an average of 5 tons per acre with a preference to have 4 to 6 logs per acre that are 6 inches or greater in diameter and 10 feet in length.
NSO Units: 174, 192, 194, 196
All management areas: only remove biomass material that is in excess of the above rates. NSO
SNG-1
Retain existing snags greater than 20 inches in diameter unless they are a defined safety hazard. In pockets of conifer mortality, retain the three largest and best snags. Leave snags that must be cut on site. Retain live, green cull trees and trees exhibiting decadence or wildlife use where adequate snags are not available.
The following rates apply by management area:
Matrix land allocation: snags will be retained with harvest units at an average of 1.5 snags per acre greater than 15 inches in diameter and 20 feet in height.
Late-successional reserve, mixed conifer communities: maintain an average of 2 to 4 snags per acre and 20 feet in height.
Late-successional reserve, white fir communities: maintain an average of 7 snags per acre and 20 feet in height.
Late-successional reserve, lodgepole pine communities: maintain an average of 4 snags per acre and 20 feet in height.
Snags will not be retained in the immediate vicinity of the Harris Campground and Guard Station to provide for public safety.
NSO All units
LSR Design Features
LSR-1 The Shasta-Trinity Forest wide Late-Successional Reserve Assessment (LSRA) (1999) identifies design criteria standards for activities within the reserve. Apply the activity design criteria for “Reforestation and re-vegetation”.
NSO Units 192, 194 and 196;
LSR-2 Apply LSR Assessment treatment standards for “Thinning in early successional pole and mid-successional stands – Development of Late-Successional Habitat”.
NSO Units: 175, 185
LSR-3 Apply LSR Assessment treatment standards for “Fuel Reduction”. NSO Units:174, 183, 189, 192, 194, 196, 223
LSR-4
Regeneration harvest will retain at least 15 percent of the area. Retention areas should include the following features to the extent possible: large diameter trees, rock outcrops, den trees, herbaceous vegetation, snags, down-woody debris, shrubs, understory or midstory conifer.
NSO Units: 20, 27, 54, 57.

Harris Vegetation Project Biological Assessment
23
Number Resource Protection Measure Target
Species Units/Location
Northern Spotted Owl Design Features
WL 2
Existing surveys have been conducted using the 2011 survey protocol. Due to the possible presence of barred owls, the Forest will work closely with the USFWS to determine the appropriate survey methodology prior to release of limited operating period restrictions identified below.
NSO All units
If a new northern spotted owl activity center is documented, a wildlife biologist will be contacted and nest protection buffer and limited operating period restrictions implemented. All units within ¼ mile of the activity center will have a no-activity limited operating period of February 1 through September 15. This LOP may be lifted if surveys using currently accepted protocols indicate specific areas are not occupied by breeding owls or with the mutual consent of the U.S. Fish and Wildlife Service and the U.S. Forest Service.
NSO All units
Units containing nesting or roosting habitat will have a no activity limited operating period of February 1 through September 15. This LOP may be lifted if surveys using currently accepted protocols indicate specific areas are not occupied by breeding owls or with the mutual consent of the U.S. Fish and Wildlife Service and the U.S. Forest Service.
NSO Units: 56, 113, 200
A no activity (disturbance) limited operating period of February 1 through July 10 will be in effect for all units and roads within ¼ mile of an activity center or un-surveyed nesting/roosting habitat. Surveying using a currently accepted protocol is required within 2 years of harvest to release this restriction.
NSO
Units: 1, 2, 31, 33, 174, 175, 181, 183, 185, 186, 189, 190, 192, 193, 194, 196, 199, 223 Roads: 42N03Y, 42N28, 42N32, 42N49, 42N49B, 42N77, 42N77B, 42N85, 42N87, 43N35
Where it exists, 60 percent crown cover will be maintained on suitable nesting/roosting habitat within the project area.
NSO Units: 56, 113, 200
Retain all live trees with broken tops greater than 25 inches in diameter within the Harris late-successional reserve to provide potential northern spotted owl nest trees.
NSO Units : 174, 175, 176, 183, 185, 186, 187, 189, 192, 194, 196, 1999, 223
WL 2
Within northern spotted owl nesting, roosting and foraging habitat proposed for thinning, ¼ acre of each five acres harvested will be uncut. Uncut areas should include features such as pockets of herbaceous vegetation, large-diameter trees, rock outcrops, den trees, individual or pockets of concentrated snags, large woody debris, embedded wood, shrubs or understory and midstory conifers. These areas may occur as ¼-acre clumps scattered across the stand or may be combined to include larger areas with the desired conditions/features.
NSO Units: 25, 26, 28, 29, 32, 33-35, 52, 53, 55, 56, 197,199, 200, 311
New landings within ¼ mile of nest/roost habitat will be avoided where possible and coordinated with the district biologist.
NSO Units, 56, 85, 200, 113, 223

Harris Vegetation Project Biological Assessment
24
Number Resource Protection Measure Target
Species Units/Location
Habitat Diversity Design Features
WL3
In Stands proposed for Green Tree Retention or Fuel Reduction, retain 15 percent of overstory trees, large trees preferred, to provide patches of late-successional forest. Include features such as areas of rock outcrops, den trees, large-diameter trees, snags, downed logs, shrubs or understory and midstory conifers to the extent possible.
Units 20, 27, 54, 57, 174, 180, 183, 189, 192, 194, 196
Retain remnant older aged trees within plantations. Units 185, 199
Retain all hardwoods that have a reasonable chance of surviving and thriving after stand treatments.
All units
Within matrix lands proposed for thinning, ¼ acre of each 5 acres harvested will remain uncut. Uncut areas will be identified by the marking crew and should include features such as pockets of herbaceous vegetation, large-diameter trees, rock outcrops, den trees, individual or pockets of concentrated snags, large woody debris, embedded wood, shrubs or understory and midstory conifers. These areas may occur as ¼-acre clumps scattered across the stand or may be combined to include larger areas with desired conditions.
Units 21- 26, 28, 29, 32-44, 52, 53, 55, 56, 197, 200.

Harris Vegetation Project Biological Assessment
25
Table 7: Summary of Seasonal Restrictions for Proposed Activities
Activity Location Species
Protected Seasonal Restriction Dates
Silvicultural and Fuel Treatments within Stands containing Un-surveyed Nest/Roost Habitat
Units: 56, 113, 200 NSO Feb. 1 – Sept. 15 on 91 acres
Silvicultural and Fuel Treatments within ¼ mile of Un-surveyed
Nest/Roost Habitat
Units: 31-33, 174, 175, 181, 183, 185, 186, 189, 192, 194, 196,
199, 223 NSO Feb. 1 - July 10 on 297 acres
Road maintenance within ¼ mile of Un-surveyed Nest/Roost Habitat
42N03Y, 42N28, 42N32, 42N49, 42N49B, 42N77, 42N77B,
42N85, 42N87, 43N35, NSO Feb. 1 – July 10 on 9.0 miles
Road Decommissioning within ¼ mile of Un-surveyed Nest/Roost
Habitat 42N28, 42N77, ea662, ea677 NSO Feb. 1 – July 10 on 2.0 miles
Underburning within ¼ mile of Un-surveyed Nest/Roost Habitat
Units: 1 and 2 NSO Feb. 1 - Sept 15 on 223 acres
VI. T&E Species Account and Effects of Proposed Action
Spatial Scales and Analysis Area The following is a description of the five spatial scales considered in this analysis. They are
discussed below from largest to smallest:
Action Area - The 30,500-acre spotted owl Action Area is the primary area analyzed for this
project. It includes the project area (described below) as well as all lands within 1.3 miles of the
project area. This area was deemed appropriate for the following reason: Based on available
radio-telemetry data (Thomas et al. 1990), the USFWS estimated the median annual home range
size for the northern spotted owl in California. Because the actual configuration of a home range
is rarely known, the estimated home range of a northern spotted owl pair in California is
represented by a 1.3-mile circle (3,340 acres) centered upon an owl activity center (e.g., nest site).
Suitable habitat within a home range would likely be utilized to some extent within any given
year by territorial owls. Therefore any effects to habitat resulting from the project that would
likely affect any current or potential future owl activity centers would occur within this 1.3 mile
area.
Currently approximately 47% of the action area provide suitable nesting/roosting, foraging or
dispersal habitat, with all of the nest/roost and most existing foraging habitat occurring in the
western half. Conversely due to the lack of mixed conifer, scarcity of water and fragmented
nature (open canopy conditions with scattered openings) suitable northern spotted owl habitat is
limited in the eastern half of the action area (See Map 2 and Table 10).
Project Area – The project area is analyzed because it includes all sites proposed for treatment
and totals 9,168 acres of National Forest System (NFS) lands. Approximately 24 percent of the
project area is designated critical habitat (CHU 29) and LSR (RC 359) and 29 percent exist as
nesting, roosting or foraging habitat. Similar to the action area, all nest/roost and most foraging

Harris Vegetation Project Biological Assessment
26
occurs in the western half, whereas the east half provides primarily capable lands, with scattered
foraging/dispersal habitat (See Map 2 and Table 10).
Home range – The home range includes all lands within a 1.3 mile radius around an activity
center. Rationale for selection of this area is described above. There are two home ranges within
the action area including the 3,340 acre Harris Mountain (ST-218) home range and the 1,946 acre
Belnap Springs home range (ST-222). Only that portion of the ST-222 home range that falls
within the action area is included in this analysis. The following is a description of each:
Harris Mountain (ST-218) - Approximately 53% of the home range currently provides
suitable forging, roosting or nest habitat and of this, 89% occurs on NFS lands (Table
10). Most of the closed canopy nesting/roosting habitat occurs near the activity center on
Harris Mountain, with large blocks of foraging and some nest/roost habitat north and
south of the activity center. Generally, lands in the western half of the home range and in
the southeast corner contain a larger lodgepole component and have had a greater amount
of past timber harvest. As a result these lands are characterized by more overstory
mortality and open canopy conditions, smaller blocks of foraging and nest/roost habitat,
and larger acreages of capable and dispersal habitat. However there are several corridors
of existing foraging and nest/roost habitat that connect the Harris mountain territory with
suitable lands to the west.
Private lands make up approximately 24% of the home range. Due to the widespread
logging that has occurred across these lands, only 5% occurs as suitable spotted owl
habitat. This large private block to the east of the LSR adjoins less suitable lands to the
south and collectively this acreage results in a large block of less preferred habitat (See
Map 2 and Table 10).
Belnap Springs (BS, ST-222) – The BS activity center lies 1.25 miles southwest of the
project area. Approximately 9% of the BS home range occurs as nest/roost habitat and
55% as foraging habitat (See Map 2 and Table 10).
LSR–Approximately 62% of the LSR exists as nesting/roosting and foraging habitat (See Map 3
and Table 10). Most of this occurs in the eastern half on or adjacent to Harris Mountain. Large
blocks of foraging and scattered nest/roost habitat also occur north and south of the activity
center, as well as in the northwest corner. Due to lodgepole mortality and past timber harvest, the
western half of the LSR consist largely of capable lands, interspersed with small blocks of
dispersal and foraging habitat. Connectivity between critical habitat and adjacent lands is similar
to that described under home range.
Territory –The Belnap Springs (ST-222) territory does not occur within the project area. The
Harris Mountain territory includes all NFS lands within 0.5 miles of the Harris mountain activity
center (personal communication between Keith Paul and Debbie Derby) (See Map 2). Currently
the ST-218 territory contains 272 acres of nest/roost habitat and 134 acres of foraging habitat.
Although this is only 7% of the available foraging habitat within the project area, the HM
territory contains 58% of the project area nest/roost habitat. Generally, higher elevation lands on
Harris Mountain contain more white fir and ponderosa pine, provide more closed canopy
conditions and are dominated by nesting/roosting habitat. Lower elevations in the western third of
the territory and along private lands to the east contain more lodgepole and have had past
regeneration harvest. As a result these lower elevation lands contain more open canopy foraging
conditions and/or exist as capable habitat.

Harris Vegetation Project Biological Assessment
27
Interrelated and Independent Actions There are no interrelated or independent actions anticipated. Direct, indirect and cumulative
effects to the NSO and its habitat are discussed below.
A. Environmental Baseline – Northern Spotted Owl
Habitat Status
The northern spotted owl is strongly associated with conifer stands that include the following
characteristics: a multi-layered, multi-species (including hardwoods) canopy dominated by large
overstory trees; moderate to high canopy closure; a high incidence of trees with large cavities and
other types of deformities; numerous large snags; an abundance of large dead wood on the ground
(logs); and open space within and below the upper canopy for spotted owls to fly (Thomas et al.
1990, USDI FWS 2008a,). Nest sites are usually located within stands of old-growth and late-
successional (late seral) forest dominated by Douglas-fir containing structures such as cavities,
broken tree tops, or mistletoe (Arceuthobium spp.) brooms (Forsman et al. 1984, Blakesley et al.
1992, LaHaye and Gutierrez 1999). Additionally, recent landscape-level analyses suggest that a
mosaic of late-successional habitat interspersed with other vegetation types may benefit spotted
owls more than large homogeneous expanses of older forests (Zabel et al. 2003, Franklin et al.
2000, Meyer et al. 1998) presumably by providing more foraging opportunities. Foraging habitat
is the most variable of all habitats used by territorial spotted owls (Thomas et al. 1990).
Descriptions of foraging habitat have ranged from complex structure (Solis and Gutierrez 1990)
to forests with lower canopy closure and smaller trees than nesting/roosting habitat (Gutierrez
1996).
Over 95 percent and 100 percent of the project area and late-successional reserve respectively are
forested, with early and mid successional habitat predominating. While all of the forested stands
are composed of conifer or mixed conifer types, forest communities vary. For example the eastern
half of the project area consists largely of eastside pine communities, whereas the western half is
predominated by white fir, ponderosa pine, lodgepole pine and mixed pine/fir communities. As
discussed under purpose and need, many of the lodgepole pine stands are decadent and
experiencing high levels of tree mortality. As a result, canopy cover has been greatly reduced in
many areas, particularly in the western third of the project area. Similarly, due to overstocking,
some of the fir, pine and mixed conifer stands are experiencing tree mortality due to crowding
and increased susceptibility to disease. Although most of the fir, ponderosa pine and mixed
conifer/pine communities are largely intact and currently provide all of the existing
nesting/roosting habitat and most of the existing northern spotted owl foraging habitat.
There have been no wildfires in the action area since 1928 and stands have accumulated surface
and ladder fuels that would threaten overstory trees in the event of a wildfire. In addition to the
increase in ladder fuels, brush in the understory of conifer stands is becoming decadent due to age
and overstory shading. Historically, periodic surface fire would consume existing brush and
stimulate sprouting and seed germination. However decades of fire control have resulted in
increased levels of dead and dying brush and downed wood which further increases fuel loading.
Also the absence of fire has resulted in increased tree densities within many stands. Consequently
and considering recent insect and disease infestations (mountain pine beetle and root disease),
high levels of tree mortality are predicted (USDA FS 1999, Chapter 4) should a wildfire occur,
which creates a concern related to the long-term sustainability of spotted owl habitat within the
action area.

Harris Vegetation Project Biological Assessment
28
Existing baseline habitat has also been affected by past activities and in the last 10 years the
project area has had a series of treatments that were designed to improve stand health and growth
(commercial thinning, improvement cuts, group selection harvest), accelerate late successional
characteristics (commercial thinning) and reduce heavy concentrations of fuels from mortality
described above (sanitation and salvage harvest, fuel reduction treatments). Past projects within
the action area have included Harris, Bartle, Hemlock, Davis and Powder. Table 8 summarizes
activities associated with these documents and identifies the spotted owl habitat affected.
Past activities have affected approximately 7,800 acres and have included timber harvest, fuel
reduction treatments and planting. Of this harvest 70 percent has occurred within capable habitat
(5,434 acres), 6 percent in dispersal (470 acres), 19 percent in foraging (1497 acres), three percent
in nest/roost (198 acres) and two percent in unsuitable (161 acres). While spotted owl habitat
would have been affected on all of this acreage the only treatment that would have downgraded or
altered suitable habitat would have been the 106 acres of clearcutting and this is considered in the
baseline habitat described below. Also many of the treatments were designed to reduce the un-
natural levels of fuel loading that occur throughout much of the action area and reduce the risk of
catastrophic wildfire, including all of the 248 acres of treatment (sanitation salvage, fuel
reduction treatments and planting) within the LSR. Ninety one percent of the past activities
occurred on matrix lands and nine percent occurred within the LSR.
Table 8: Past Treatment Summary
NEPA Document
and Treatment
Matrix
acres
LSR
acres
Spotted Owl Habitat
Nest Forage Dispersal Capable Unsuitable
Commercial Thinning 6,934 0 196 1,372 470 4,896 0
Sanitation Salvage 426 248 0 71 0 442 161
Group Selection Harvest 6 0 0 6 0 0 0
Clearcutting 107 0 0 0 0 107 0
Improvement Cutting 37 0 0 0 0 37 0
Pre-commercial thinning 0 466 0 0 0 466 0
Fuel Treatments 2,079 339 0 176 681 1,690 0
Planting 474 248 0 189 47 485 0
Total Acres Affecteda
7758 acres (% of total)
7,643
(91%)
714
(9%)
196
(2%)
1,449
(17%)
681
(8%)
5,870
(70%)
161
(2%)
a – Acreage reflects total acres affected, which would receive multiple treatments (i.e. harvest, fuels and planting)
Because baseline habitat was based on updated surveys (McCusker 2009) effects of all natural
disturbances, as well as past actions were considered in the baseline habitat described below (See
Table 8-Table 12 and Maps 2 and 3 in Attachment 2).
Baseline Habitat
Northern spotted owl baseline habitat was initially evaluated by looking at both the California
and RSL baseline layers. However the California layer failed to identify a relatively large acreage
that had the structural conditions consistent with spotted owl use as capable habitat. Additionally,
because of the widespread lodgepole mortality within the project area, many of the stands did not
provide nesting/roosting habitat identified in the RSL layer. As a result, spotted owl baseline
habitat was identified using recent vegetation surveys (McCusker 2009) that updated stand
information to reflect lodgepole mortality and recent harvest. This information more accurately
reflected on-the-ground canopy conditions and was further refined based on field reviews and
photo interpretation.

Harris Vegetation Project Biological Assessment
29
While baseline habitat was based on crown density and canopy closure (see Table 9) forest type
was also considered when updating baseline habitat. For example the eastern half of the project
area consists largely of vegetation associated with the eastside pine alliance (EPA). This portion
of the project area also contains little surface water and is more fragmented due to interspersion
of shrub and non-forest communities. Also the California baseline layer did not identify any EPA
stands as capable and the RSL layer did not identify any EPA stands as suitable foraging or
roosting/nesting habitat. Although the fragmentation and scarcity of water reduce habitat
suitability, many of these EPA stands do have the capability to develop the structural conditions
utilized by the spotted owl. So for the purpose of this analysis, 1) small and medium diameter
EPA stands with 40% canopy cover are considered suitable dispersal/connectivity habitat, 2)
large diameter EPA stands are considered suitable foraging habitat and 3) EPA pole stands with
>40% canopy cover, and small and medium diameter trees and with <40 percent crown cover and
early successional stands are considered capable of providing northern spotted owl habitat. Table
9 displays spotted owl habitat and identifies size class and canopy closure conditions used to
separate the habitat components. Definitions of size and canopy closure classes are provided
below.
Table 9: Spotted Owl Habitat Related to Crown Diameter and Canopy Cover
Habitat Stand Typing Codes Habitat Characteristics
Nesting and Roosting
4G (high quality) and 3G (moderate quality) for all conifer communities except EPA.
>=60% crown closure, 10 to 30 inch trees
Foraging 3N or 4N (not including EPA), 5N EPA
40-69% crown closure, 10 to 30 inch trees for all types except EPA, 40-69% crown closure and greater than 30 inch trees for EPA
Dispersal 2N and 2G, for all types except EPA, 3N and 4N for EPA.
>40% crown closure and 5.0 to 9.9 inch trees for all types except EPA, >40% crown closure and 10 to 30 inch trees for EPA.
Capable
Remaining forest land capable of growing suitable habitat conditions. (4P, 4S, 3P, 3S, 2P, 2S, 2X, 1X, 1G, 1N, 1P, 1S all forest types except EPA and 2N and 2G for EPA)
Sites with <40% crown cover and plantations for all types, pole stands (5 to 9.9 inches) with >40% crown cover for EPA.
Note - there is no old growth habitat within the project area

Harris Vegetation Project Biological Assessment
30
Canopy Closure Classes:
S = <20%
P = 20-39%
N = 40-69%
G = >70%
Size Classes:
X - plantations
1 =Saplings - 1-4.9 inches QMD.
2 = Poles – 5 to 9.9 inches QMD,
3 = Small to medium diameter trees
– 10-19.9 inches QDM,
4 = Large diameter trees – 20-29.9
inches QMD
5 = Large diameter trees >= 30
inches QMD
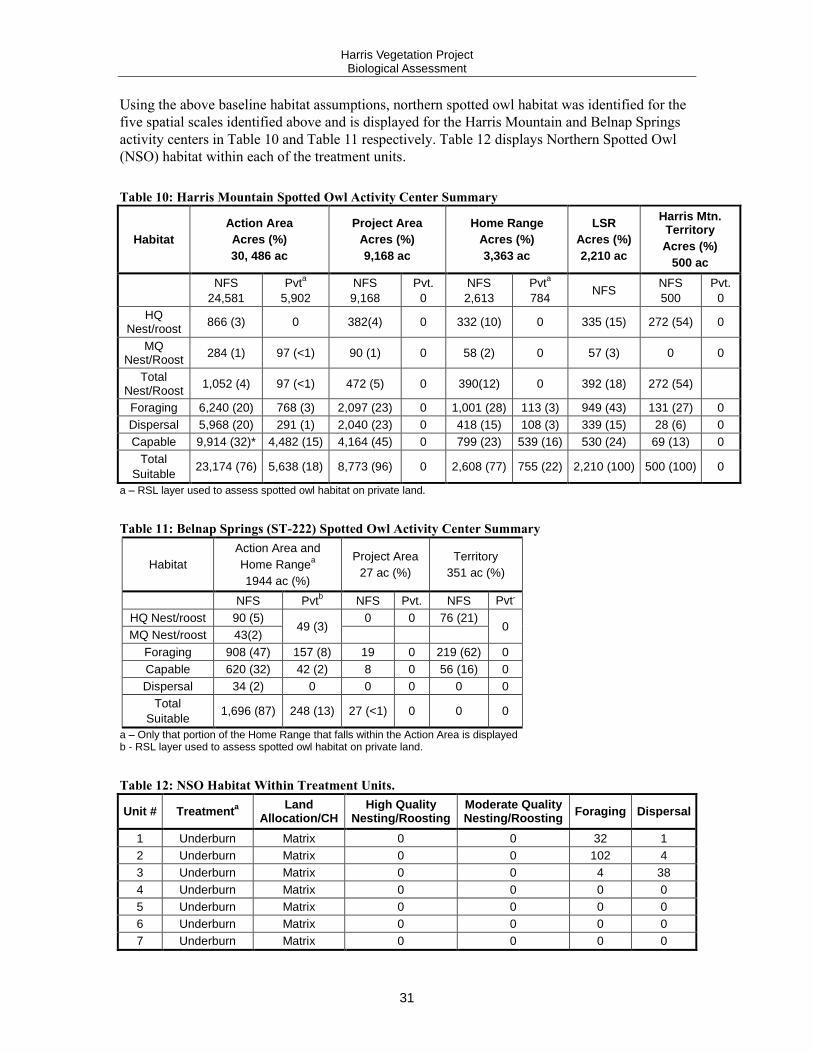
Harris Vegetation Project Biological Assessment
31
Using the above baseline habitat assumptions, northern spotted owl habitat was identified for the
five spatial scales identified above and is displayed for the Harris Mountain and Belnap Springs
activity centers in Table 10 and Table 11 respectively. Table 12 displays Northern Spotted Owl
(NSO) habitat within each of the treatment units.
Table 10: Harris Mountain Spotted Owl Activity Center Summary
Habitat
Action Area
Acres (%)
30, 486 ac
Project Area
Acres (%)
9,168 ac
Home Range
Acres (%)
3,363 ac
LSR
Acres (%)
2,210 ac
Harris Mtn. Territory
Acres (%)
500 ac
NFS
24,581
Pvta
5,902
NFS
9,168
Pvt.
0
NFS
2,613
Pvta
784 NFS
NFS
500
Pvt.
0
HQ Nest/roost
866 (3) 0 382(4) 0 332 (10) 0 335 (15) 272 (54) 0
MQ Nest/Roost
284 (1) 97 (<1) 90 (1) 0 58 (2) 0 57 (3) 0 0
Total Nest/Roost
1,052 (4) 97 (<1) 472 (5) 0 390(12) 0 392 (18) 272 (54)
Foraging 6,240 (20) 768 (3) 2,097 (23) 0 1,001 (28) 113 (3) 949 (43) 131 (27) 0
Dispersal 5,968 (20) 291 (1) 2,040 (23) 0 418 (15) 108 (3) 339 (15) 28 (6) 0
Capable 9,914 (32)* 4,482 (15) 4,164 (45) 0 799 (23) 539 (16) 530 (24) 69 (13) 0
Total
Suitable 23,174 (76) 5,638 (18) 8,773 (96) 0 2,608 (77) 755 (22) 2,210 (100) 500 (100) 0
a – RSL layer used to assess spotted owl habitat on private land.
Table 11: Belnap Springs (ST-222) Spotted Owl Activity Center Summary
Habitat
Action Area and
Home Rangea
1944 ac (%)
Project Area
27 ac (%)
Territory
351 ac (%)
NFS Pvtb NFS Pvt. NFS Pvt
.
HQ Nest/roost 90 (5) 49 (3)
0 0 76 (21) 0
MQ Nest/roost 43(2)
Foraging 908 (47) 157 (8) 19 0 219 (62) 0
Capable 620 (32) 42 (2) 8 0 56 (16) 0
Dispersal 34 (2) 0 0 0 0 0
Total
Suitable 1,696 (87) 248 (13) 27 (<1) 0 0 0
a – Only that portion of the Home Range that falls within the Action Area is displayed b - RSL layer used to assess spotted owl habitat on private land.
Table 12: NSO Habitat Within Treatment Units.
Unit # Treatmenta
Land Allocation/CH
High Quality Nesting/Roosting
Moderate Quality Nesting/Roosting
Foraging Dispersal
1 Underburn Matrix 0 0 32 1
2 Underburn Matrix 0 0 102 4
3 Underburn Matrix 0 0 4 38
4 Underburn Matrix 0 0 0 0
5 Underburn Matrix 0 0 0 0
6 Underburn Matrix 0 0 0 0
7 Underburn Matrix 0 0 0 0

Harris Vegetation Project Biological Assessment
32
Unit # Treatmenta
Land Allocation/CH
High Quality Nesting/Roosting
Moderate Quality Nesting/Roosting
Foraging Dispersal
8 Underburn Matrix 0 0 2 1
9 Underburn Matrix 0 0 0 4
10 Underburn Matrix 0 0 0 2
11 Underburn Matrix 0 0 0 0
12 Underburn Matrix 0 0 0 0
13 Underburn Matrix 0 0 0 10
14 Underburn Matrix 0 0 0 36
20 LSR Thin Matrix 0 0 0 38
21 ITS Matrix 0 0 0 37
22 ITS Matrix 0 0 0 13
23 ITS Matrix 0 0 0 44
24 ITS Matrix 0 0 0 57
25 Standard Thin Matrix 0 0 30 0
26 Standard Thin Matrix 0 0 18 0
27 GTR Matrix 0 0 0 13
28 60% Thin Matrix 0 0 45 0
29 60% Thin Matrix 0 0 19 1
31 ITS Matrix 0 0 0 13
32 60% Thin Matrix 0 0 17 11
33 60% Thin Matrix 0 0 0 14
34 Standard Thin Matrix 0 0 0 7
35 Standard Thin Matrix 0 0 3 7
36 ITS Matrix 0 0 15 26
37 ITS Matrix 0 0 22 17
38 ITS Matrix 0 0 0 3
39 ITS Matrix 0 0 0 92
40 ITS Matrix 0 0 0 0
41 ITS Matrix 0 0 0 57
42 ITS Matrix 0 0 0 23
43 ITS Matrix 0 0 0 29
44 ITS Matrix 0 0 0 7
52 ITS Matrix 0 0 5 22
53 Standard Thin Matrix 0 0 42 63
54 GTR Matrix 0 0 2 13
55 60% Thin Matrix 0 0 99 24
56 60% Thin Matrix 10 4 41 1
57 GTR Matrix 0 0 0 29
58 Standard Thin Matrix 0 0 0 0
113 CG Thin 60% Matrix 0 2 9 2
174 Fuel Reduction LSR/CH 0 0 36 5
175 LSR Thin LSR/CH 0 0 0 54
180 Fuel Reduction Matrix 0 0 0 27
181 ITS 60% Matrix 0 0 1 18
183 Fuel Reduction LSR/CH 0 0 13 9
185 LSR Thin LSR/CH 0 0 5 5
186 LSR Thin LSR/CH 0 0 9 6
189 Fuel Reduction LSR/CH 0 0 9 1
192 Fuel Reduction LSR/CH 0 0 0 34

Harris Vegetation Project Biological Assessment
33
Unit # Treatmenta
Land Allocation/CH
High Quality Nesting/Roosting
Moderate Quality Nesting/Roosting
Foraging Dispersal
194 Fuel Reduction LSR/CH 0 0 23 1
196 Fuel Reduction LSR/CH 0 0 0 12
197 Standard Thin Matrix 0 0 0 4
199 Standard Thin Matrix 0 0 0 12
200 Matrix Matrix 2 0 14 2
223 Fuel Reduction LSR/CH 0 0 0 26
311 Standard Thin Matrix 0 0 0 6
a - ITS = Individual Tree Selection, GTR = Green Tree Retention, CG= Campground , 60% Thin- Standard Thin that maintains 60% canopy.
Minimum Habitat Requirements
The USFWS has established minimum habitat threshold guidance that can be used to aid with
analysis that need to be maintained within an owls territory (.5 mile radius of nest) and on lands
between the territory and home range perimeter (i.e. on lands between .5 miles and 1.3 miles from
nest) (USFWS 2008a and USFWS 2008b). These minimum thresholds and the current conditions
are displayed for the Harris Mountain nest (ST-218) in Table 13, whereas the structural
conditions characteristic of high and low quality habitat are shown below. The Belnap Springs
nest (ST-222) is not displayed because there are no treatments within the territory and only a
small amount of home range (27 acres) occurs within the project area.
Table 13: Northern Spotted Owl Minimum Habitat Thresholds
Habitat USFWS
Threshold
Current
Condition
Harris Mountain Territory
Minimum Total Nest/Roost Habitat 250 acres 272 acres
Minimum High Quality Nest/Roost 100 acres 248 acres
Minimum Total Foraging Habitat 150 acres 131 acres
Minimum High Quality Foraging Habitat 100 acres 86 acres
Maximum Suitable habitat harvested 134 acresa None
b
Lands between the territory and home range boundary
Minimum Suitable Habitat 935 acres 1330 acres
Minimum Foraging habitat 655 acres 1036 acres
Maximum Suitable Habitat Harvested 439 acresa None
b
a – 1/3 of total suitable habitat b – No active timber sales
High quality nesting/roosting:
basal area = 210+ sq. ft. and at least 15" quadratic mean diameter and least 8 trees per acre of trees at least 26" dbh and greater than 60% canopy closure
Nesting/roosting:
-mix of basal areas ranging from 150-180 sq. ft. and

Harris Vegetation Project Biological Assessment
34
-at least 15" quadratic mean diameter and -at least 8 trees per acre of 26" or more dbh -greater than 60% canopy closure
Foraging:
-mix of basal areas ranging from 120-180+ sq. ft. and -at least 13" quadratic mean diameter and -at least 5 trees per acre of trees at least 26" dbh and -a mix of greater than 40-100% canopy closure
Low quality foraging:
-mix of basal areas ranging from 80-120+ sq. ft. and -at least 11" quadratic mean diameter and -at least 40% canopy closure
Currently the ST-218 home range exceeds established thresholds for lands between the territory
and home range boundary. However while the ST-218 territory currently has adequate
nesting/roosting habitat, it presently lacks the minimum amount of foraging habitat. This is due to
the open canopy conditions that resulted from lodgepole mortality in the western third of the
territory and small diameter conifer stands (See Map 2 in Attachment 2).
Connectivity
Connectivity habitat includes all nest, roost and foraging habitat, even aged pole stands with
roosting structures and smaller inclusions of nest, roost and foraging habitat (USDA FS 2008b)
(Codes 5N, 4N, 4G, 3G, 3N, 2G, 2N, 4P, 4S, 3P, 3S). Because of the large eastside pine
component and large block of harvested private land, only approximately 58% of the owl action
area is currently considered connectivity habitat. Although this is above the 50 percent threshold
established by Thomas et al (1990). Additionally 69% of the project area and 78% of the LSR
currently provide connectivity habitat.
Current Status of Northern Spotted Owl in the Action Area
Through survey and data records, two individual owl territories, or owl activity centers are known
to be located within 1.3 miles of the project area. These include the Harris Mountain (ST-218)
and Belnap Springs (ST-222) activity centers, both of which occur on NFS lands. The Belnap
Springs activity center has had visits to the historical nest core in 2004, 2006, 2007 and 2009,
with nesting activity being documented in 2009. The Harris Mountain activity center received 3
survey protocol surveys in 2004 and 2007-2010. The last documented nest activity at Harris
Mountain was 1996. Surveys and northern spotted owl activity, including anticipated future
surveys are displayed in Table 14.

Harris Vegetation Project Biological Assessment
35
Table 14: Status of the spotted owl activity centers in the Harris Project Action Area.
Activity Center State
ID
Activity Center Name
Overall Status
(year of the most recent pair or territorial single
status confirmation)
1989-2012 Survey Results and Commentsa
ST-218 Harris
Mountain
Occupied Nest
(1996)
2012 (2011 protocol)
2011 (2011 protocol)
2010 – No Detections (3 visit protocol of the LSR)
2009 – No Detections (3 visit protocol of the LSR)
2008 – No Detections (3 visit protocol of the LSR)
2007 – No Detections (
2006 – Not Surveyed
2005 – Not Surveyed
2004 – No Detections (3 visit protocol of the LSR)
2003 – No Survey
2001 – No Detections
2000 – Not Surveyed
1999 – Not Surveyed
1998 – No Detections
1997 – No Detections
1996 – Occupied Nest
1995 – Occupied Nest
1994 – Occupied Nest
1993 – Not Surveyed
1992 – Occupied Nest
1991 – Reproductive Pair
1990 – No Detections
ST-222
Belnap Springs
(Slagger)
Nesting Activity
(2009)
2009 – Nest Activity
2008 – Not Surveyed
2007 – No Detections
2006 – No Detections
2005 – No Survey
2004 – No Detections
2003 – Not Surveyed
2001 – No Detections
2000 – Not Surveyed
1999 – No Detections
1998 – Occupied (3 visit protocol)
1997 – Occupied (3 visit protocol)
1996 – Occupied
1995 – Occupied
1994 – Occupied
1993 – Not Surveyed
1992 – Response (3 visit protocol)
1991 – Response (3 visit protocol)
1990 – Not Surveyed
1989 – Male Present
a - surveys were not conducted to protocol unless indicated

Harris Vegetation Project Biological Assessment
36
Status of Predators and Competitors
Great-horned Owls and Hawks
Known predators of spotted owls are limited to great horned owls, whereas suspected predators
include northern goshawks, red-tailed hawks, and other raptors (USFWS 2008a p. 29). Great
horned owls, goshawks and red-tailed hawks are common throughout the McCloud Flats and
Porcupine Butte Management Units, including four active goshawk nests within or adjacent to the
project area. While some mortality may occur, occasional predation of spotted owls by these
raptors is not considered to be a threat to spotted owl populations (USFWS 2008a p. 29).
Barred Owls
Due to similar dietary preferences, the barred owl is a serious competitor with the spotted owl, as
well as a known predator. While habitat interactions are not well known, barred owls may have a
broader diet, reduce spotted owl detectability and may occupy former northern spotted owl sites
and thus displace historic northern spotted owl activity centers (Irwin et. al. 2010, USFWS
2008a). As a result, barred owls pose a greater threat to spotted owl recovery than was envisioned
when the spotted owl was listed and many populations of spotted owls continue to decline even
with maintenance and restoration of suitable habitat (USFWS 2008). Consequently, recovery
objectives for dry forests include maintaining sufficient northern spotted owl habitat in the short-
term to allow owls to persist in the face of threats from barred owl expansion and habitat loss
from wildland fires (USFWS 2008a p. 107).
Barred owls have not been detected during spotted owl surveys within the action area. Also while
the project area may not contain the moist valley bottom forest conditions characteristic of
preferred barred owl habitat in the drier forests in the Eastern Cascades of Washington (Singleton
et al 2010), structural conditions characteristic of barred owl habitat does exist. Also spotted
owl/barred owl pairs have been documented approximately 9 miles to the southwest, whereas two
other barred owl pairs (Pilgrim and Cow Creek) have been documented on the McCloud Ranger
District.
Cumulative Effects
Cumulative effects include those resulting from past, present and future activities on non-federal
lands within the 1.3 mile CE analysis area. In the past 10 years portions of the following projects
(USDI Fish and Wildlife Service concurrence date) have occurred within the action area: Powder
(5/5/03), Harris Salvage (12/18/03), Hemlock, (9/24/2002) Davis (3/26/02) and Bartle North
(11/14/97). While these have involved a mix of treatments including thinning, sanitation salvage,
and regeneration treatments, the effects of all activities are reflected in the spotted owl baseline
habitat described previously. Also the Powder EA modified several treatments to maintain 60
percent canopy and connectivity between the Harris LSR and lands immediately to the west of the
Harris project area. Consequently impacts to nesting, roosting and foraging habitat and
connectivity between the LSR and lands to the west were reduced.
Past harvest on private has included salvage, commercial thinning and clearcutting. Like cutting
on NFS lands, the effects of this harvest are reflected in the baseline habitat. Anticipated future
activities include 215 acres of sanitation salvage on private (currently capable habitat) in the
northeast corner of the action area and 35 acres and 87 acres of private commercial thinning and
clearcutting respectively (91 acres foraging, 17 acres nest/roost, 14 acres capable) in the
southwest corner of the action area. While anticipated harvest will reduce future spotted owl
habitat by removing standing and downed woody debris, approximately 70 percent has open

Harris Vegetation Project Biological Assessment
37
canopy conditions and does not currently provide NRF or dispersal habitat. Also all private
timber harvest plans must be reviewed by the U.S. Fish and Wildlife Service under section 9 of
the Endangered Species Act for the possibilities of prohibited take and private take of threatened
northern spotted owls is prohibited under California State law and prosecutable under both
Federal and State law. Finally, the following is a summary of anticipated cumulative effects
within action area territories, home ranges and LSR analysis areas.
There is no anticipated future harvest within the ST-218 or ST-222 territories or within
the ST-218 home range.
There are no activities within the LSR that would modify NRF habitat that were not
considered under direct and indirect effects.
All analysis areas will continue to exceed the 50% connectivity threshold identified by
Thomas et al (1990).
Approximately 90 percent of the action area will be unaffected by future treatment
B. Direct and Indirect Effects of the Proposed Action
Effect Intensity
Effects to spotted owls and their habitat are evaluated largely by looking at the likelihood of
disturbance (direct effects) and changes in habitat (indirect effects). Changes in habitat are
evaluated largely by looking at the intensity of the effect, which are described below and
summarized in Table 15.
The intensity of indirect effects is defined at the following three levels:
Removed indicates that habitat would no longer function as nesting/roosting or foraging
habitat. Any harvest that reduces canopy closure below 60 percent in nest/roost or 40
percent in foraging would result in removal.
Downgraded indicates that there is a temporary (20-30 years) reduction in habitat
capability such as owl nesting/roosting habitat down to foraging or foraging habitat down
to dispersal or capable habitat.
Degraded indicates that some habitat components (e.g. smaller snags, canopy closure
and vertical structure) may be somewhat reduced but habitat would continue to function
at the current level. Degraded habitat could result from a thinning prescription in foraging
habitat that does not reduce canopy closure below 40%. The project may have short-term
(20-30 years) adverse effects to habitat, but there will likely be long-term benefits by
reducing the risk of catastrophic fire and development of larger diameter trees
.

Harris Vegetation Project Biological Assessment
38
Table 15: Summary of Effect Intensity to Spotted Owl Habitata
Analysis Area
Pre-Treatment
Suitable Habitat
Acres (%) Effect
Intensity
Acres Affected Post-Treatment Suitable Habitat
Acres (%)
Nest/Roost Foraging Dispersal Nest - Roost
Foraging Dispersal Total Nest/Roost Foraging Dispersal
Owl Action Area 1,150
(5)
7,013
(23)
6,259
(21)
Removed 0 5 2 7 1,150
(5)
7,008
(23)
6,257
(21) Downgraded 0 2 92 94
Degraded 18 617 894 1,529
ST-218 Home Range
390
(11)
1,064
(34)
603
(18)
Removed 0 3 1 4 390
(11)
1,061
(34)
602
(18) Downgraded 0 0 58 58
Degraded 2 99 105 206
ST-218 Territory
272
(54)
134
(27)
27
(5)
Removed 0 0 0 0 272
(54)
134
(27)
27
(5) Downgraded 0 0 0 0
Degraded 0 0 0 0
ST-222 Home Range
182
(9)
1,066
(55)
34
(2)
Removed 0 0 0 0 182
(9)
1,066
(55)
34
(2) Downgraded 0 0 0 0
Degraded 0 17 0 17
ST-222 Territory
76
(22)
219
(62) 0
Removed 0 0 0 0 76
(22)
219
(62) 0 Downgraded 0 0 0 0
Degraded 0 0 0 0
Critical Habitat/LSR
392
(18)
949
(43)
347
(16)
Removed 0 2 0 2 392
(18)
947
(43)
347
(16) Downgraded 0 0 0 0
Degraded 0 95 150 245
Project Area1
472
(5)
2,099
(23)
2,041
(22)
Removed 0 5 2 7 472
(5)
2,094
(23)
2,039
(22) Downgraded 0 2 92 94
Degraded 18 617 894 1,529
a – High Quality Nest/Roost shown in parenthesis
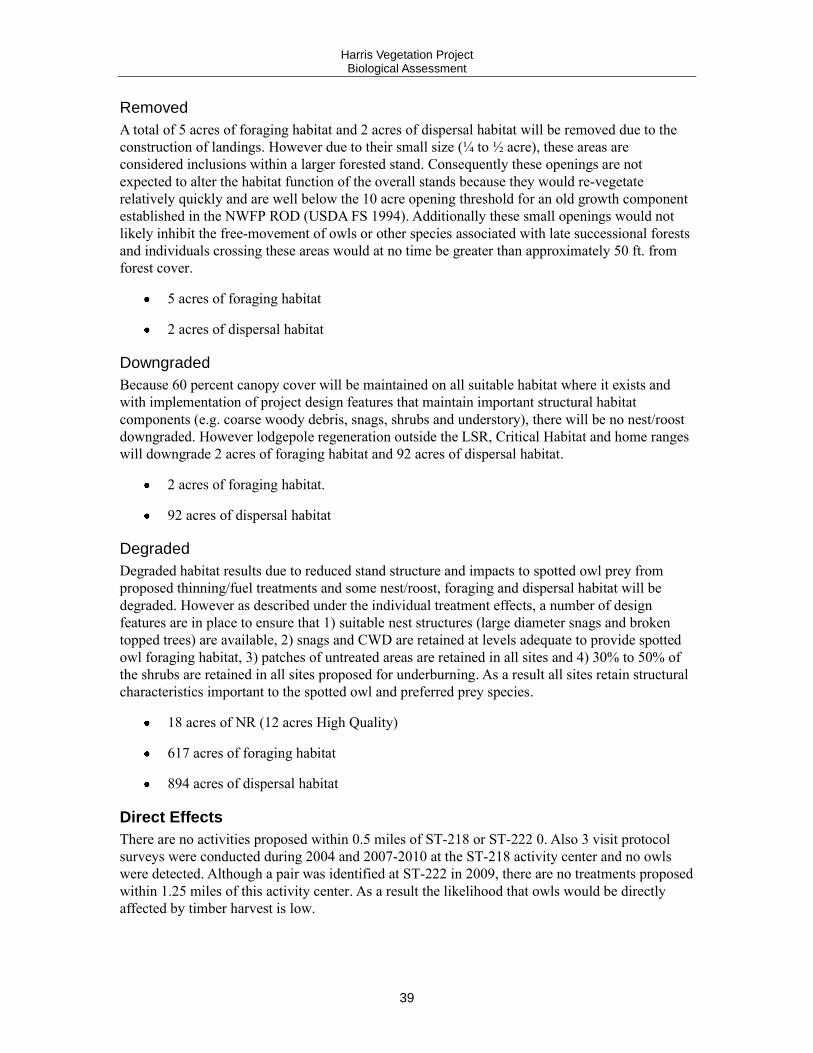
Harris Vegetation Project Biological Assessment
39
Removed
A total of 5 acres of foraging habitat and 2 acres of dispersal habitat will be removed due to the
construction of landings. However due to their small size (¼ to ½ acre), these areas are
considered inclusions within a larger forested stand. Consequently these openings are not
expected to alter the habitat function of the overall stands because they would re-vegetate
relatively quickly and are well below the 10 acre opening threshold for an old growth component
established in the NWFP ROD (USDA FS 1994). Additionally these small openings would not
likely inhibit the free-movement of owls or other species associated with late successional forests
and individuals crossing these areas would at no time be greater than approximately 50 ft. from
forest cover.
5 acres of foraging habitat
2 acres of dispersal habitat
Downgraded
Because 60 percent canopy cover will be maintained on all suitable habitat where it exists and
with implementation of project design features that maintain important structural habitat
components (e.g. coarse woody debris, snags, shrubs and understory), there will be no nest/roost
downgraded. However lodgepole regeneration outside the LSR, Critical Habitat and home ranges
will downgrade 2 acres of foraging habitat and 92 acres of dispersal habitat.
2 acres of foraging habitat.
92 acres of dispersal habitat
Degraded
Degraded habitat results due to reduced stand structure and impacts to spotted owl prey from
proposed thinning/fuel treatments and some nest/roost, foraging and dispersal habitat will be
degraded. However as described under the individual treatment effects, a number of design
features are in place to ensure that 1) suitable nest structures (large diameter snags and broken
topped trees) are available, 2) snags and CWD are retained at levels adequate to provide spotted
owl foraging habitat, 3) patches of untreated areas are retained in all sites and 4) 30% to 50% of
the shrubs are retained in all sites proposed for underburning. As a result all sites retain structural
characteristics important to the spotted owl and preferred prey species.
18 acres of NR (12 acres High Quality)
617 acres of foraging habitat
894 acres of dispersal habitat
Direct Effects
There are no activities proposed within 0.5 miles of ST-218 or ST-222 0. Also 3 visit protocol
surveys were conducted during 2004 and 2007-2010 at the ST-218 activity center and no owls
were detected. Although a pair was identified at ST-222 in 2009, there are no treatments proposed
within 1.25 miles of this activity center. As a result the likelihood that owls would be directly
affected by timber harvest is low.

Harris Vegetation Project Biological Assessment
40
Direct effects of underburning will depend on the season of burn, fuel moisture content,
vegetation, and topography. However there is no burning proposed within any spotted owl
territories and the closest underburning is approximately 1.4 miles from the ST-218 activity
center. As a result and considering that LOP restrictions (See Table 6) would ensure that burning
does not occur during the breeding season, there are no anticipated adverse effects to nesting
birds anticipated.
Smoke from underburning or burning of piles could affect foraging or dispersing individuals,
however burning would only occur when conditions would result in the rapid dispersal of smoke.
As a result any effects would be short-term in nature and considering owls are resilient to and
have evolved with fire (USFWS 2008a), no adverse direct effects are anticipated.
The proposed hauling route is 0.5 miles or more from any known spotted owl activity center.
While proposed road maintenance and decommissioning would occur, there is no transportation
work proposed within any owl territory. Also while activities would occur within and adjacent to
other spotted owl habitat, with implementation of LOPs identified in Table 6, the potential for
direct effects is greatly reduced.
In summary, considering there are no treatments proposed within any owl territory and with
implementation of limited operating periods identified in Table 6, the likelihood of direct effects
is greatly reduced and implementation of the proposed actions is not expected to harm or displace
owls.
Indirect Effects
Indirect effects or changes in spotted owl habitat are evaluated by looking at changes in suitable
northern spotted owl habitat that would result from proposed activities including 1) short and
long-term effects of individual treatments, 2) effect intensity, or changes in habitat quality or
suitability, 3) changes in the availability of NRF and connectivity habitat, 4) effects to spotted
owl prey and 5) changes related to predation and competition.
While indirect effects, or changes in spotted owl habitat vary by treatment, all treatments
generally alter spotted owl habitat in the following ways. However these effects are considered
short-term (15-20 years) and changed conditions would be largely restored by 2030.
Reduction in Canopy Closure: A moderate to dense canopy closure is important to owls
because it moderates environmental extremes (e.g. temperature, rain/snow fall). All
treatments will result in some reduction in canopy cover. Specific changes, including
removal of larger diameter trees are discussed below by treatment.
Simplification in Vertical Structure: Multiple canopy levels provided by understory
conifers and hardwoods provide lower (cooler) roost sites in the hot summer months and
provide perch sties for foraging. Any treatment which removes understory or midstory
vegetation will reduce vertical structure.
Reduction in smaller diameter (<20 inch dbh) snags and logs; Snags can provide owl
nest sites and both snags and logs provide habitat for owl prey species. While all
treatments will result in the removal of smaller diameter snags, with implementation of
design features identified in Table 6, few large snags would be removed and snags and
downed wood would be retained on all sites.

Harris Vegetation Project Biological Assessment
41
Reduction in potential nesting opportunities: Larger decadent (broken-topped)
conifers and snags provide typical nest sites for spotted owls. With implementation of
project design features, all trees with broken tops > 25 inches dbh and snags >20 inches
dbh will be retained. However some suitable nest trees could be removed due to safety
concerns or if they succumb to mortality from underburning.
Treatment Effects
The following is a discussion of short and long-term effects of the individual treatments
proposed. In addition to those described below, individually and collectively, all treatments will
reduce downed woody debris and ladder fuels and increase the likelihood that small wildfires
could be suppressed. As a result in addition to effects described below, treatments proposed will
result in short and long-term benefits by reducing the risk from catastrophic wildfire and a
possible loss of spotted owl habitat.
Standard Thinning (284 acres)
Short-term Effects
This treatment is only proposed on matrix land and would not occur within the LSR, Critical
Habitat or the ST-218 home range. However 17 acres of thinning would occur along the
perimeter of the ST-222 home range. Treatment will result in removal of predominantly small
and medium diameter sized trees with the largest healthy trees being left at densities ranging from
100 ft2/acre of basal area in ponderosa pine stands and 175 ft
2/acre in mixed conifer stands,
although as described above, some removal of trees greater than 20 inches dbh will be removed.
The average tree size will increase and the understory will be opened up due to removal of
smaller diameter trees. While this treatment will reduce stand structure, 40% canopy cover will be
maintained. As a result foraging (ST-222 habitat is foraging) and dispersal habitat treated will be
degraded on 53 and 23 acres respectively, but not removed or downgraded. There is no nest/roost
habitat proposed for standard thinning.
Long-term Effects
Over the long-term stand diameter would increase due to the reduction in inter-tree completion
and increased height and growth of remaining trees. Similarly, due to the increased crown
diameter, canopy cover would increase. Some layering will also develop over time as conifer
seedlings, shrubs and hardwood sprouts become established in the canopy openings. Additionally,
fire tolerant species such as ponderosa pine would be favored for retention and release.
Collectively the increased canopy cover, increase in stand diameter, and improved understory and
overstory diversity would result in the long-term development of vertical and horizontal diversity,
snags, CWD, and other stand components benefiting the spotted owl and other late-successional
forest-related species. Consequently over the long-term treatment would provide high quality
NRF habitat and develop late successional characteristics.
Standard and Campground Thinning with 60% Canopy Cover (332 acres)
All treatments would occur outside the LSR, critical habitat and home ranges. Long and short-
term effects are similar as those described under standard thinning, including some removal of
trees over 20 inches dbh, except that 60% canopy cover will be retained where it currently exists.
As a result the site would be characterized by a more closed canopy and smaller diameters than
would occur under standard thinning. Additionally because most late successional species appear
to be tolerant of light thinning (Vanderwel 2009) and with the increased canopy closure, spotted
owl prey availability would be greater and the likelihood of avian mortality reduced. Also by
Harris Vegetation Project Biological Assessment
42
maintaining greater canopy closure and considering project design features will help maintain
important structural features (e.g. snags, dead wood and understory diversity), nest/roost habitat
would not be downgraded and high quality nest/roost habitat would be achieved sooner than
under a standard thinning treatment. Finally like thinning, treatment would develop late
successional characteristics and reduce the risk of large scale disturbances.
Two sites contain nest/roost habitat including 1 acre in unit 200 and 10 acres in unit 56. Although
harvest will degrade nest/roost habitat on this acreage, because 60 percent canopy closure will be
maintained over existing nest/roost and with implementation of project design features to retain
desired structural features, nest/roost will not be downgraded or removed. Similarly, although
none will be downgraded or removed, treatment would degrade 29 acres and 137 acres of
dispersal and foraging habitat respectively.
Growth Acceleration (LSR) Thinning (65 acres)
Short-term Effects
All but three acres of this treatment occurs within the LSR, Critical Habitat and ST-218 home
range. This treatment occurs within LSR stands that have a large lodgepole component and have
pockets of dead and high risk trees and includes 59 acres of dispersal habitat and 5 acres of
foraging. Anticipated stand structure and canopy cover changes are similar to those described for
thinning and include some removal of large diameter trees (>20 inches dbh), except that 10
percent or more would be in un-thinned patches to retain processes and conditions such as
thermal cover, natural suppression and mortality, small trees, natural size differentiation and
undisturbed debris. Like standard thinning, a minimum of 40 percent canopy cover will be
retained. As a result and with implementation of project design features to maintain desired
structural components (e.g. snags, dead wood and understory diversity) there will be no foraging
or dispersal habitat downgraded or removed. However treatment will degrade 5 acres and 59
acres of foraging and dispersal habitat respectively.
Long-term Effects
Long-term effects would be similar to those described under thinning and critical northern spotted
owl habitat would be improved by increasing structural conditions characteristic of late
successional forest. Consequently all sites treated would provide high quality NRF habitat and
achieve the LSR objective of developing late successional characteristics sooner than would
occur under no treatment.
Individual Tree Selection (925 acres)
Short-term Effects
Individual Tree Selection is only proposed in the Eastside Pine Alliance outside the LSR, Critical
Habitat and either home range. Consequently this treatment is not proposed within spotted owl
NRF habitat. This treatment is a modification of standard thinning and differs in that harvest
occurs within all size classes. Although some trees between 20 and 25 inches will be removed, all
trees greater than 26 inches will be retained with the largest healthiest trees being left at densities
ranging from 100 ft2/acre in ponderosa pine stands to 150 ft
2/acre in mixed conifer stands. Like
thinning, the average tree size will increase as a result of removing the smallest trees. However,
because fewer trees are removed and a greater diversity of size classes are retained, pre-treatment
canopy closure would be largely restored in the short-term (15 to 20 years). Also because most
late successional species appear to be tolerant of treatments that retain greater canopy closure and

Harris Vegetation Project Biological Assessment
43
structure (Vanderwel 2009), it is expected that spotted owl prey availability would be greater and
the likelihood of avian mortality reduced on these sites.
There are no treatments proposed within spotted owl NRF habitat. Also because greater than 40
percent canopy closure will be maintained and with implementation of project design features to
maintain desired structural components (e.g. snags, dead wood and understory diversity), there
will be no dispersal habitat downgraded or removed. However treatment will degrade 283 acres
of dispersal habitat.
Long-term Effects
The reduction of inter-tree competition will result in increased diameter and height growth and
the future stand would contain larger trees than would result from no treatment. Layering will be
maintained in the small diameter classes and increase over time as conifer seedlings and
hardwood sprouts become established in the canopy openings. Over the long-term (2070 to 2080)
stands will have an excess of 60% to 70% canopy closure and a greater number of large diameter
trees. As a result, many of these eastside stands would provide higher quality forging habitat at
some point in the future.
Individual Tree Selection with 60% Canopy Cover (81 acres)
This treatment is only proposed outside the LSR, Critical Habitat and home ranges within the
eastside pine community. As a result treatment is not proposed within suitable NRF habitat.
Effects would be similar to those described above, except 60% canopy would be retained. This
would reduce stand diameters and increase short and long term canopy cover and snags. Like
individual tree selection, harvest would occur in all size classes, although a few trees greater than
20 inches dbh would be removed (21 trees over 81 acres). Although no NRF would be degraded,
removed or downgraded, 18 acres of dispersal habitat would be degraded. Effects also include
more rapid development of high quality foraging habitat within eastside stands and reduced
likelihood of predation. Also the risk of wildfire would be reduced.
Lodgepole Regeneration with Green Tree Retention (103 acres)
Short-term Effects
Treatment occurs outside of the LSR, Critical Habitat and both home ranges and is proposed on 2
acres of foraging and 92 acres of dispersal habitat. . Because this treatment is only proposed in
areas of concentrated lodgepole mortality treatment will result in removal of most of the residual
overstory so that a young stand can become established. As a result canopy cover will be reduced
to approximately 12% to 15%, which will downgrade affected foraging and dispersal habitat (See
Table 16). However, because 15% of the overstory will be retained to provide patches of late
successional forest and with retention of snags and CWD, prey habitat would continue to be
available.
Long-term Effects
This treatment is proposed on sites that have experienced concentrated areas of lodgepole pine
mortality. Consequently canopy conditions are generally open, stand diameter is small and 76%
of the total acres treated occur as spotted owl dispersal/capable habitat. Because canopy closure
will be reduced to well below 40% on all sites, long term effects include downgrading of foraging
to capable habitat on some of the sites (See Table 16). Based on FS VEG simulator runs, it is
anticipated that it will take 40 years before affected stands will again function as
foraging/dispersal habitat. In addition to harvest, treatment includes underplanting Jeffery and

Harris Vegetation Project Biological Assessment
44
ponderosa pine seedlings. As a result the developing stand will have greater diversity, contain a
larger component of fire tolerant species, and contain species that are more likely to develop late
successional characteristics preferred by the spotted owl. Consequently over the long-term, High
Quality NRF habitat, late successional conditions and the composition of fire tolerant species will
be improved on sites treated.
Aspen and Oak Release (21 acres)
Short and Long-term Effects
This treatment occurs within the LSR and ST-218 home range and would affect 6 acres of
foraging, 6 acres of dispersal and 9 acres of capable habitat. Harvest involves cutting
predominantly small conifer trees within 150 ft. of existing aspen, in order to reduce competition
and promote growth and vigor on remaining aspen, although some trees over 20 inches dbh may
be removed. Because 40 percent canopy closure would be maintained and with implementation of
project design features to maintain desired structural components (e.g. snags, dead wood and
understory diversity), there will be no habitat downgraded or removed. Also because aspen occurs
in scattered pockets, not all of the site will be affected. Although some of the 6 acres of foraging
and 6 acres of dispersal may be degraded if release occurs on this acreage.
Oak would be released by cutting all trees less than 20 inches dbh for a distance of 30 feet and
this would be incorporated into the thinning or individual tree selection prescription. As a result
there will be no additional effects to NRF or dispersal habitat other than that described for those
treatments. However over the long-term, the oak component and spotted owl prey habitat will be
improved.
Fuel Reduction (211 acres)
Short-term Effects
Treatment is proposed in areas that contain concentrated lodgepole mortality within the LSR,
Critical Habitat and ST-218 home range and would occur on 80 acres of foraging and 106 of
dispersal habitat. Because only dead and dying trees will be removed, canopy closure will be
maintained at 40 percent where it exists and these sites will continue to provide foraging/dispersal
habitat. Additionally, with implementation of project design features identified in Table 6,
including the retention of large predominant (legacy) conifers, larger snags (>19”), pockets of
understory shrubs and vegetation, CWD, and decadent conifers large enough to provide owl nest
sites, sites will continue to provide key structural features characteristic of spotted owl habitat. As
a result, although foraging and dispersal habitat will be degraded on 80 and 106 acres
respectively, none will be downgraded or removed.
Long-term Effects
Over the long-term (2080) sites will develop increased vertical structure and canopy cover and
will function largely as high quality habitat. Also like proposed lodgepole regeneration described
above, treatment includes underplanting Jeffery and ponderosa pine seedlings. As a result over
the long-term, late successional and high quality northern spotted owl habitat will be improved on
sites treated and treatment will achieve the LSR objectives of developing late successional
characteristics and promoting fire tolerant species.

Harris Vegetation Project Biological Assessment
45
Fuel Treatments (Underburning, Machine Pile and Burn)
Short-term Effects
Underburning (660 acres) – Of the acreage proposed, 140 acres occur as foraging habitat and 152
occur as dispersal/capable NSO habitat. There is no nesting/roosting habitat proposed for burning.
Treatment is proposed within primarily young stands of ponderosa pine to reduce fuel conditions.
This treatment is intended to consume natural and activity-generated fuels and/or reduce small-
diameter surface and ladder fuels. Use of surface fire will result in some losses to residual trees,
especially in the smallest size class (3-4 inches dbh) and reduce understory structure on the sites
treated. Although treatment will also increase small diameter snags and promote ponderosa pine.
Prescribed underburns mimic low-intensity wildfires and typically burn in a patchy mosaic.
Additionally several design features are in place (See Table 5) to ensure that shrubs and some
patches of vegetation and CWD are not consumed. Based on FVS modeling this treatment would
result in an average coarse woody debris (>3.0 inches) of 6.0 tons per acre. So while treatment
will reduce spotted owl prey availability for some species, the density of some prey species would
remain relatively unchanged (Russell et al 2010). Additionally, fire in combination with thinning
will increase light to the forest floor, expose mineral soil and promote seed germination and
vegetative re-sprouting. So while habitat will be degraded, these improved conditions allow for
rapid recovery of understory plants (Collins et al 2007) and any changes in habitat and prey
availability will be short-term in nature (Russell et al 2010).
Machine piling and burning (252 acres) – This treatment involves the use of heavy equipment to
drag and pile woody debris, and in the process, disturbs the soil surface and ground cover at the
site. Indirect effects include a reduction in understory shrubs and woody vegetation and some
mineral soil exposure. Like underburning this would degrade habitat, although effects would be
short-term in nature (Russell et al 2010).
All fuel treatments will result in a reduction of snags, downed wood, small diameter understory
trees, shrubs and forest floor vegetation. This would have short-term adverse effects to spotted
owl prey species and degrade habitat. However the need to maintain understory diversity was
recognized and with implementation of the following project design features, adverse effects to
understory components that affect prey abundance and diversity from fuel treatments will be
reduced (Russell et al 2010):
Leave one to two unburned machine piles per acre to provide small mammal habitat.
Piles should be approximately 20 feet wide by 20 feet long.
Avoid consumption of large CWD (logs greater than 10 inches in diameter at midpoint)
when underburning to the extent possible. Where feasible use control lines and/or firing
techniques to maintain untreated pockets of understory vegetation at scattered locations
in in-harvested burn units.
Underburning will retain 30 to 50 percent of the existing shrub cover. To the extent
possible, remaining shrubs should be retained as a mosaic across the site with bitterbrush
being preferred for retention.
With implementation of these design features and considering that there is no underburning
proposed within any spotted owl home range, and that machine pile and burning is widely
scattered, suitable NRF habitat will continue to be available in over 90 percent of the sites treated
as well as across the landscape.
Harris Vegetation Project Biological Assessment
46
Long-term Effects
Over the long-term understory plants and coarse woody debris would re-develop on the site.
Although more open understory conditions would exist than would occur under no action, based
on anticipated canopy closure (approximately 50 percent), average stand diameter (15 inches
dbh), and considering project design features (See Table 6, BFT 4-7) will ensure that some
understory structure is maintained, High Quality foraging habitat would be provided on sites
treated.
Landings (15 acres)
One half acre landings would be constructed on an estimated 15 acres. While treatment would
reduce forest cover on this acreage, because of their small size, landings are inclusions within the
larger forested stand. As a result although habitat would be removed on this acreage, habitat
quality and use of the site would be determined largely by the timber harvest and fuel treatment
discussed above. Based on proximity of habitat to roads and existing landings, it is estimated that
5 acres of foraging, 2 acres of dispersal and 8 acres of capable habitat would be affected. While
final landing location will occur during layout, it is possible that up to 1 acre of foraging and 1
acre of dispersal habitat would occur within the LSR, critical habitat and the ST-218 home range.
Changes in Nest, Roost and Foraging Habitat
Changes in NRF habitat are largely based on the structural changes discussed under treatment
effects, which are summarized in Table 2 (structural changes) and Table 15 above (intensity) as
well as by the short and long-term changes in availability, which is summarized for the analysis
areas in Table 16. In addition, Table 17 displays how well each alternative achieves northern
spotted owl thresholds immediately after harvest (2012) and Table 18 displays changes in
connectivity and dispersal habitat.
There are no treatments proposed within any spotted owl territories. The following is a summary
of short and long-term effects to spotted owl habitat within the Owl Action and Project Area, ST-
218 Home Range, ST-222 Home Range and LSR (RC-59)/Critical Habitat (CH-29), that would
occur under the proposed action. Anticipated changes are summarized in Table 17 and Figure 3 -
Figure 5.

Harris Vegetation Project Biological Assessment
47
Table 16: Short and Long-Term Changes in Spotted Owl Nest/Roost and Foraging Habitat
Alternative 2
Owl Analysis
Area
Current
Acres
Acres (%)
Short Term
2030
Acres (%)
Long Term
2080
Acres (%)
ST-218 Home Range
HQ Nest/Roost 332 332 575
MQ Nest/Roost 58 58 58
Foraging 1,064 1,139 1,009
Total 1,454 1,529 1,643
ST-222 Home Range
HQ Nest/Roost 90 90 90
MQ Nest/Roost 92 92 92
Foraging 1,066 1066 1066
Total 1248 1248 1248
CH-29/RC-59
HQ Nest/Roost 335 335 562
MQ Nest/Roost 57 57 57
Foraging 949 1,024 894
Total 1,341 1,416 1,513
Action Area
HQ Nest/Roost 866 906 1,491
MQ Nest/Roost 284 284 509
Foraging 7,013 7,208 7,087
Total 8,163 8,398 9,087
Project Area
HQ Nest/Roost 382 461 1,007
MQ Nest/Roost 90 90 315
Foraging 2,099 2,294 2,173
Total 2,571 2,845 3,495

Harris Vegetation Project Biological Assessment
48
Figure 3: Spotted Owl Habitat for the Harris LSR
Figure 4: Spotted Owl Habitat for the Action Area

Harris Vegetation Project Biological Assessment
49
Figure 5: Spotted Owl Habitat for the Harris Home Range
Although there will be a small reduction in foraging habitat within the LSR and ST-218 home range, high
quality NR and total NRF habitat will increase within both these analysis areas. Changes in available
habitat within the project area and action area include: 1) short and long-term increases in foraging
habitat, 2) long-term increases in High Quality NR habitat, and 3) short and long-term increases in total
NRF habitat. As a result, although NRF habitat will be degraded (See Table 15) within all analysis areas,
proposed treatments will maintain NRF habitat in the short-term, increase the long-term availability of
NRF habitat and reduce the risk of catastrophic wildfire.
Overall, long-term NRF habitat will increase by 3 percent, 6 percent, 8 percent and 10 percent within the
action area, ST-218 home range, LSR and project area respectively.
Habitat Thresholds
As can be seen from Table 17, there will be no effects within the ST-218 territory and established
thresholds in the immediate short-term (2012) will be met or exceeded on lands between the territory and
the home range perimeter.
Table 17: Northern Spotted Owl Minimum Habitat Thresholds
USFWS Thresholds
Acres
Current
Condition
Ac.
Alt 2
Ac.
Territory (0.5 miles)
Minimum Total Nest/Roost Habitat 250 272 272
Minimum High Quality Nest/Roost 100 248 248
Minimum Total Foraging Habitat 150 134 134
Minimum High Quality Foraging Habitat 100 86 86
Maximum Suitable habitat harvested 134 a 0 0

Harris Vegetation Project Biological Assessment
50
USFWS Thresholds
Acres
Current
Condition
Ac.
Alt 2
Ac.
Lands Between the Territory and Home Range Perimeter (.5 to 1.3 mi)
Minimum Suitable Habitat 935 1,330 1,325
Minimum Foraging habitat 655 1,036 1,031
Maximum Suitable Habitat Harvested 527 a 0 350
a – 1/3 of total suitable habitat
Connectivity and Dispersal Habitat
Because fuel reduction treatments will only remove dead and dying trees, the only reduction in
connectivity would be associated with landing construction (approximately 15 acres) and green tree
retention harvest (103 acres). Pre and post-project connectivity habitat is displayed for the Action Area,
Project Area and LSR in Table 18. The proposed treatments will reduce connectivity habitat by
approximately one percent of the project area and remain relatively unchanged within the LSR.
All analysis areas will exceed the 50% threshold established by Thomas et al (1990) and continue to
provide adequate spotted owl dispersal habitat. Also connectivity and dispersal habitat will be largely
restored by 2050, when stands affected by green-tree retention harvest will again have 40 percent canopy
closure.
Table 18: Summary of Project Effects to Dispersal Habitat
Analysis Area Pre-Project Post Projecta
Acres of
Dispersalb
% of capable
In Dispersal
% of
Area
Acres of
Dispersalb
% of capable
In Dispersal
% of
Area
Action Area 17,831 19 59 17,713 19 58
Project Area 6,432 28 70 6,314 28 69
LSR 1,732 3 78 1,729 3 78
a – reduction due to proposed green-tree retention harvest and landing construction b - (Codes 5N, 4N, 4G, 3G, 3N, 2G, 2N, 4P (not EPA), 4S (not EPA), 3P (not EPA), 3S (not EPA)
Insects and Fire
Infestation of a stand by insects and disease increases with stand stocking or density. As a result proposed
treatments will reduce the number of trees on a site and decrease insect related mortality on the acreage
treated. Also the composition of fire tolerant tree species would be increased on 342 acres.
Based on modeling in the Forest Vegetation Simulator and Fire and Fuels Extension (FVS-FEE) proposed
treatments will result in the following changes to fire behavior and associated risk to wildfire.
Collectively proposed treatments will reduce risk of catastrophic wildfire, reduce the likelihood of a loss
of spotted owl habitat both in the short and long-term and achieve LSR objective III. (USDA FS 1999),
Proposed treatments will reduce surface fuel loading, torching and the likelihood that surface
would move into crowns.
Modeling suggests about 52 percent of the project area would exhibit flame lengths less than four
feet, which is a 13 percent improvement from what would occur under no action.

Harris Vegetation Project Biological Assessment
51
Modeling suggests that fire line intensity and the likelihood of crown fires will be reduced on 214
acres (10 percent) within the LSR. The overall fire behavior effect on the LSR includes; allowing
firefighters greater success in protecting the LSR, reducing the vulnerability to stand-replacing
wildfire, and helping to set the stage to introduce more low-intensity prescribed fire in the future.
Progress would be made towards the restoration of ecological processes that include the
reintroduction of low-intensity prescribed fire. There would be a reduced risk of severe stand-
replacing crown fire that threatens important late-successional stands and mid- and early-
successional habitat and forest ecosystems. Also the ability of firefighters to safely and effectively
suppress wildland fire would be improved.
Spotted Owl Prey
All harvest treatments have some short-term negative effects on understory plants and below ground
fungi. As a result short-term reductions in flying squirrels and forest floor rodents such as woodrats and
deer mice would likely occur. However the need to maintain some habitat patchiness or heterogeneity
was recognized. Consequently all treatments include the following project design features that are
intended to maintain habitat and prey diversity within sites proposed for treatment.
Existing coarse woody debris (CWD) on the ground will be and protected from disturbance and
between 5 and 10 tons of CWD will be provided. In order to provide small mammal habitat, sites
proposed for machine pile and burn will leave 1-2 unburned piles per acre. Piles should be 20 ft.
wide by 20 ft. long, by six feet high.
Retain existing snags greater than 20 inches in diameter. Provide a minimum of 1.5 snags/acre
greater than 15 inches in diameter and 20 ft. in height on matrix lands, and between 4 and 7
snags/acres greater than 15 inches in diameter within the LSR.
Within spotted owl NRF habitat proposed for thinning, ¼ acre for each 5 acres harvested will be
uncut. These areas should include pockets of herbaceous vegetation, large diameter trees, rock
outcrops, den trees, pockets of concentrated snags, CWD, shrubs or understory or midstory
conifers.
Within lodgepole regeneration sites at least 15% of the overstory will be retained to provide
patches of late successional forest. Patches should include features such as thermal cover, natural
suppression and mortality, small trees, natural size differentiation and undisturbed debris.
Within sites proposed for growth reduction thinning in the LSR, 10 percent or more will be in un-
thinned patches to retain processes and conditions such as thermal cover, natural suppression and
mortality, small trees, natural size differentiation and undisturbed debris.
While short-term (25-30 years) reductions in prey species would occur, woodrat researchers suggest that
the retention of brushy vegetation in patches as small as roughly 16 feet wide within clearcuts could
provide suitable habitat for woodrats (Sakai and Noon 1993). As a result and with implementation of
project design features to maintain shrubs and understory vegetation (See Table 6) it is expected that
adequate prey populations would continue to be available to maintain spotted owl viability under all
alternatives. Additionally,
There will be no treatments within any spotted owl territory
80% or more of the foraging habitat within the LSR, spotted owl home ranges and action area
will be un-treated.
Harris Vegetation Project Biological Assessment
52
Over 95% of the NRF habitat within the LSR and spotted owl home ranges and over 90% of the
action area will be untreated.
Long-term effects within all sites treated include increased understory diversity, an increase in
late successional characteristics and reduced likelihood of catastrophic wildfire. Collectively this
will result in a long-term improvement in spotted owl prey and foraging habitat.
Foraging habitat within the project area, action area and S-T 218 home range will increase both in
the short (2030) and long-term (2080) under this alternative (See Table 15).
Predators and Competition
Because regeneration treatments would increase early successional habitat and considering that partial
harvest activities (thinning and release treatments) would open up the forest canopy, treatments may
improve habitat for barred owls. As a result, the potential for increased avian predation and possible
increased competition from barred owls within the treatment sites could increase. However no barred
owls have been located within the project area. Additionally; 1) open canopy conditions resulting on 96
percent of the treatments will be short-term in nature (15-20 years), 2) there will be no modification
within the ST-218 or ST-222 territories, 3) over 92 percent of the NRF habitat within the LSR, spotted
owl home ranges and action area will be untreated, and 4) sixty percent and 40 percent canopy closure
will be maintained on 21 percent of 74 percent of the area affected by harvest respectively. Collectively
for these reasons, risks associated with increased competition from barred owls or other predators are
considered low. Further, considering that short and long-term effects include reduced risk from
catastrophic wildfire and a possible long-term loss of spotted owl habitat, the long-term benefits outweigh
the short-term risks.
D. Determination The proposed action will degrade 18 acres 617 acres and 894 acres of spotted owl nest/roost, foraging
habitat and dispersal habitat respectively and remove 7 acres of foraging/dispersal habitat. As a result,
implementation of the proposed action “May affect, and is likely to adversely affect” the Northern
Spotted Owl. However it is also my determination that the proposed actions are “Likely to benefit” the
northern spotted owl by reducing the risk of wildfire and a possible long-term loss of spotted owl habitat.
As a result and based on the above analysis and the following rationale, proposed treatments would result
in the long-term sustainability of northern spotted owl habitat.
There are no treatments proposed within any northern spotted owl territory.
Over the long-term high quality Nest/Roost and Foraging habitat will be increased within all
analysis areas.
Ninety two percent of existing NRF habitat and 93 percent of the NRF habitat within LSR/critical
habitat will be unaffected. Also while approximately eight percent of the available NRF will be
degraded, effects will be short-term. As a result and with implementation of project design
features including the retention of large predominant (legacy) conifers, larger snags (>19”),
pockets of understory shrubs and vegetation, CWD, and decadent conifers large enough to
provide owl nest sites, all sites will continue to provide key structural characteristics consistent
with spotted owl use.
Of the proposed treatments, 98 percent would result in short-term effects. Also while there will be
a long-term reduction in NRF habitat on 61 acres proposed for lodgepole regeneration, sites

Harris Vegetation Project Biological Assessment
53
currently provide marginal habitat conditions and over the long-term, habitat quality NRF habitat
would be improved.
Implementation of the LOP greatly reduce the likelihood that nesting, foraging and dispersing
individuals would be affected by treatment and no direct mortality to individuals loss of
reproduction is anticipated.
Adverse effects of LSR habitat will be short-term in nature and treatments will result in a long-
term improvement in PCEs. Additionally due to the reduced risk from stand-replacing wildfire,
the long-term sustainability of spotted owl critical habitat will be improved.
Of the sites proposed for treatment, 1,352 acres or 66 percent have been modified to reduce
harvest and maintain greater levels of canopy closure than standard thinning and another 162
acres (8 percent) of regeneration harvest (under the original proposed action) have been modified
to only remove dead trees. Because most late successional species appear to be tolerant of light
thinning (Vanderwel 2009) and with the increased canopy closure, spotted owl prey availability
would be greater on these sites and the likelihood of avian mortality and competition with barred
owls reduced.
Recovery objectives for dry forests include maintaining sufficient northern spotted owl habitat in
the short-term to allow owls to persist in the face of threats from barred owl expansion and
habitat loss from wildland fires (USFWS 2008a p. 107). Considering that 1) 90 percent of the
available NRF habitat will be unaffected, 2) that 60 percent and 40 percent canopy closure will be
maintained on 21 and 74 percent of area affected by harvest respectively, 3) that treatment
modifications were made on 66 percent of the proposed harvest to maintain elevated levels of
canopy cover and increased stand structure and 4) that the risk of wildfires and long-term loss of
habitat is reduced, these recovery objectives are achieved.
It is believed that active management to address fuel loading concerns and restore forests to
within a natural range of variability is necessary to reduce risks and protect the late successional
forest structure (USDI FWS 2006 p. 7). Proposed treatments will promote late successional
characteristics, reduce fuels, re-introduce fire and promote development of fire tolerant species.
Collectively these benefits will increase available high quality spotted owl habitat, reduce risk
from catastrophic fire, and help to ensure the long-term availability of spotted owl habitat. As a
result, long-term benefits outweigh anticipated short-term risks.
VII. Critical Habitat The Final Revised Critical Habitat (CH) for the northern spotted owl was designated by the U.S. Fish and
Wildlife Service on September 12, 2008. The revised critical habitat designation included the Harris
Mountain LSR, which totals 2,210 acres in the Harris Project Area (Shasta McCloud Unit 29, subunit CA-
73). The 2008 designation of critical habitat for the NSO addresses the primary constituent elements
(PCEs) which are used to identify the known physical and biological features essential to the conservation
of the northern spotted owl. These PCEs are summarized below and displayed in Table 20.
(i) Forest types that support the northern spotted owl across its geographic range. In the southern
portion of its range, specifically in the project area, this includes mixed conifer, ponderosa pine,
and white fir.
(ii) A home range provides the habitat components essential for the survival and successful
reproduction of a resident breeding pair of northern spotted owls. The amount, quality, and

Harris Vegetation Project Biological Assessment
54
configuration of these habitat types required for a home range varies according to local conditions
and factors, such as the degree of habitat fragmentation, proportion of available nesting habitat,
and primary prey species.
o (A) Nesting habitat is essential to provide structural features for nesting, protection from
adverse weather conditions, and cover to reduce predation risks. It includes moderate to
high canopy closure (60-80%); a multilayered, multi species canopy with large (generally
over 30 inches dbh) overstory trees; a high incidence of large trees with various
deformities; large snags; large accumulations of fallen trees and other woody debris on
the ground; and sufficient open space for northern spotted owls to fly.
o (B) Roosting habitat is essential to provide thermoregulation, shelter, and cover to reduce
predation risk while resting or foraging. It differs from nesting habitat in that it need not
contain those specific structural features used for nesting, but does contain moderate to
high canopy closure (60-80%); a multi-layered, multi-species canopy; large
accumulations of fallen trees and other woody debris on the ground; and open space
below the canopy for northern spotted owls to fly.
o (C) Foraging habitat is essential to provide a food supply for survival and reproduction. It
contains some roosting habitat attributes, but can consist of more open and fragmented
forests or, especially in the southern portion of the range where some younger stands may
have high prey abundance and structural attributes similar to those of older forests.
Foraging may also function as dispersal habitat.
(iii) Dispersal habitat is essential to maintaining stable populations by filling territorial vacancies
when resident spotted owls die or leave their territories; and to provide adequate gene flow across
the range of the species. Dispersal habitat can occur in intervening areas between or within larger
blocks of nesting, roosting, and foraging habitat. These can occur as younger stands such as even
aged pole sized stands containing some roosting structures and foraging habitat; or in roosting
and foraging habitat in smaller amounts needed to support nesting pairs.
It is believed that CHU 29 was established for a number of reasons, one of which was to protect a
reproductively successful pairs of owls. Additionally the Shasta-McCloud area is near the southern edge
of the range for the northern spotted owl and the northern boundary for the California spotted owl. As a
result the Shasta-McCloud Unit is considered a stepping stone for east/west and/or north/south dispersal
(USDA FS 1999 p. 152). Although the final rule (USFWS 2008) does not give us a specific reason for
designation as critical habitat, it is assumed that the intent of designation is to provide connectivity with
suitable habitat in adjacent LSRs and Critical Habitat.
Environmental Baseline The status and environmental baseline for the Harris Project is discussed in Section VI and the Harris
Mountain (ST-218) activity center occurs within the Harris Mountain LSR and subunit CA-73 of CHU
29. This activity center has been surveyed since 1989 and had protocol surveys (3 visit) in 2004 and
2007-2010. The last documented nest activity at Harris Mountain was 1996 (See Table 14).
The following is a summary of the habitat conditions that exist within the subunit CA-73 including a
discussion of the northern spotted owl habitat conditions, the likelihood of re-colonization, past
treatments and long-term sustainability.

Harris Vegetation Project Biological Assessment
55
Early and mid successional vegetation predominates (99%) with white fir, ponderosa pine and mixed
conifer comprising 46% of the CHU. Because much of the critical habitat occurs at lower elevations,
lodgepole pine occurs on over 50% of the area. This has implications for long-term critical habitat
sustainability, because lodgepole mortality has been high (See Figure 2), which has greatly increased fuel
loading, increased the risk of catastrophic fire and reduced the suitability of northern spotted owl habitat.
This is partially reflected by the larger amount of capable/dispersal habitat in the western half of the CHU
(See Map 2 in Attachment 2).
Critical habitat has also been affected by past actions (Harris Salvage) in the last 10 years which have
included 248 acres of sanitation salvage, pile burning and underplanting in the northern third of the CHU.
Because of the large lodgepole component, tree mortality has been high on these sites and past treatments
within CH were designed to reduce fuels and the risk of fire and improve stand diversity. Also recent tree
mortality has reduced canopy closure and the area affected by these treatments consisted largely of
capable and dispersal habitat interspersed with low quality foraging. Because recent vegetation data was
collected and used for Harris (McCusker 2009), changes in spotted owl habitat resulting from insect and
disease related mortality as well as past treatments were considered in the baseline habitat used. Existing
northern spotted owl suitable habitat and PCEs within subunit CA-73 are displayed in Table 19.
Table 19: Northern Spotted Owl Critical Habitat
Spotted Owl Habitat
Spotted owl Critical Habitat
Subunit CA-73
Acres (%)
High Quality
Nest/Roost 335 (15)
Moderate Quality
Nest/Roost 57 (2)
Total Nest/Roost 392 (18)
Foraging 949 (43)
Total NRF 1,341 (61)
Dispersal 339 (15)
Capable 530 (24)
Total Suitable 2,210 (100)
Connectivity 1,732 (78)
Although late successional habitat has been slow to develop due to overcrowded stand conditions, the
western half of the CHU contains larger blocks of closed canopy nesting, roosting and foraging habitat
(See Map 2). As a result and considering 1) approximately 60% of the CHU contains suitable
nesting/roosting or foraging habitat, 2) active northern spotted owl nesting occurs 1.25 miles southwest of
the project area (See Table 10) and 3) suitable foraging/connectivity habitat occurs within and adjacent to
the CHU, adequate conditions currently exist to provide for northern spotted owl colonization.
Records show that fire has had little influence on the vegetative matrix within subunit CA-73 during this
century. Stand management, fire suppression and lack of treatment to control stand density have had a
primary role in shaping the development of current forest conditions. Stand density is also a contributing
factor to the slow development of late successional habitat, as there are numerous dense mid-successional
and pole stands (USDA FS 1999 p. 154). Forest protection and management of these stands is critical to
the future development of late successional habitat (USDA FS 1999 p. 154). In the last ten years,
treatments within the CHU have emphasized fuel reduction and release of overcrowded plantations.

Harris Vegetation Project Biological Assessment
56
Activities have included; 248 acres of sanitation salvage harvest to remove dead and dying lodgepole and
reduce future mortality of remaining trees, 339 acres of burning/chipping to reduce fuels within sites
harvested and 466 acres of pre-commercial thinning within plantations.
The Northwest Forest Plan (USDA FS 1994) states that there are areas of warmer, drier physiographic
provinces where decades of fire exclusion and timber harvest have resulted in changes to forest
composition and structure, increasing the potential for stand-replacing wildfires in areas within late
successional reserves (USDI FWS 2006). This is a consideration for subunit CA-73 because of the dry
conditions that exist and elevated fuel conditions including pockets of dead and down woody material,
large quantities of brush, low level shrubs and ladder fuels. Collectively these conditions can create high
burning intensities during ground fires that can easily spread through the understory to the crowns of
dominant conifers. Consequently the fire risk CA-73 has been rated as Moderate to High (USDA FS 1999
p. 154). Additionally there is a concern for potential fire effects from adjacent private lands to the east due
to the levels of harvest that has occurred there (USDA FS 1999).
Direct and Indirect Effects
Direct effects to Critical Habitat are those effects that will alter the current suitability of the habitat
necessary to maintain Primary Component Elements (PCEs) or that will affect the potential of the area to
develop and maintain these PCEs. These direct effects to Critical Habitat are similar to the indirect effects
described above under Section VI, although effects to critical habitat PCEs may occur whether or not the
animal is present. Consequently indirect effects could occur to dispersing juveniles, displaced adult
floaters, or migrating birds, as surveys are only completed in the spring and summer to detect breeding
birds and nesting success. In addition, vegetation manipulation that affects the potential of the site to
provide PCEs is also a concern under ESA. Consequently direct effects to critical habitat are also
evaluated by looking at the following indirect effects to critical habitat and PCEs.
Primary Constituent Elements
With the revised designation of northern spotted owl Critical Habitat (USDI 2008), the Service
determined that the Primary Constituent Elements (PCEs) for the northern spotted owl are: 1) forest types
that support the northern spotted owl across its geographic range; 2) nesting, roosting, and foraging
habitat; 3) dispersal habitat; and 4) forest types that are capable of producing suitable nesting, roosting,
and foraging habitat in the future. The following is a discussion of each.
Forest types
The forest types within the project area that support the northern spotted owl includes mixed conifer,
mixed conifer hardwood, eastside pine and spruce. While proposed landing construction will result in the
creation of four ¼ to ½ ac openings, these are small inclusions within the larger forested stand. As a
result, none of the proposed treatments would reduce suitable or capable forest types or successional/seral
stages within Critical Habitat. Therefore, there would be no effect on this primary constituent element.
While some large trees will be removed, to the extent that larger trees make better habitat, treatments
would have a positive effect because competition for resources would be reduced and growth rates would
increase (See Table 20). Further, the reduction of fuels, both surface and ladder, would mitigate the risk
of high intensity wildfire which could change forest types or successional stages at large scales. Changes
in the large tree component are displayed in Table 20.

Harris Vegetation Project Biological Assessment
57
Table 20: Changes in large diameter trees in critical habitat
Treatment Time LSR Thinning Fuel Reduction
GT >20 inches DBH
(TPA)
2010 21.0 12.6
2012 20.5 11.5
2030 2407 17.4
2050 38.6 32.1
2080 47.9 41.2
GT >26 inches DBH
(TPA)
2010 2.6 1.6
2012 2.6 2.0
2030 6.1 4.3
2050 13.6 10.1
2080 27.0 21.8
QMD
2010 9.2 10.6
2012 13.0 13.2
2030 15.3 13.8
2050 17.6 16.2
2080 20.7 20.1
Nest, Roosting, Foraging and Dispersal Habitat
Treatments proposed within critical habitat include LSR Thinning and Fuel Reduction. Effects from these
treatments on nest, roosting, foraging and dispersal habitat are displayed in Table 21 and Table 22.
Because stand data does not exist to predict changes to un-treated stands, changes in northern spotted owl
habitat are only displayed within the stands proposed for treatment, or those original treatment stands that
were deferred. Consequently for the purpose of this analysis, it is assumed that non-treatment stands will
continue to provide existing habitat conditions both in the short and long-term. Overall effects to these
PCEs are summarized below.
Table 21: Effect Intensity to Spotted Owl Critical Habitat
Pre-treatment
Acres (%) Intensity
Habitat Affected
Acres (%)
Post Treatment
Acres (%)
Nest/ Roost
Foraging Dispersal Nest/ Roost
Foraging Dispersal Total Nest/ Roost
Foraging Dispersal
392
(18)
949
(43)
339
(15)
Removed 0 2 1 3 392
(18)
947
(43
338
(15) Downgraded 0 0
NA 0
Degraded 0 95 95
Table 22: Short and Long-Term Changes to NRF and Connectivity within Critical Habitat
Habitat Current
Acres
Alternative 2
Short Term
2030
Acres
Long Term
2080
Acres
High Quality Nest/Roost 335 335 562
Moderate Quality Nest/Roost 57 57 57
Foraging 949 1,024 894
Total NRF 1,341 1,416 1,513
Connectivity 1,732 1,742a

Harris Vegetation Project Biological Assessment
58
a – change due to a 10 acre increase in dispersal habitat
Because all treatments within Nest/Roost habitat have been deferred, there will be no NR habitat affected
in the short-term. However over the long-term, proposed treatments, in combination with increased
structure/canopy closure on sites deferred will result in a long-term increase in NR habitat of 227 acres.
Because all increases will be in high quality NR, there will be no change within moderate quality NR
within critical habitat.
Proposed treatments will degrade 95 acres of existing foraging habitat due to the reduced structure that
will result from proposed fuel reduction. However because only dead trees will be removed, canopy cover
will be relatively un-changed. As a result by 2030, foraging habitat will increase by 75 acres (8 percent).
Over the long-term, foraging habitat will decrease by 55 acres (6 percent) because the amount of existing
foraging habitat that will become NR exceeds the amount of dispersal/capable habitat that will move into
the foraging category. However total NRF habitat within critical habitat will increase by 6 percent and 13
percent over the short and long-term respectively under the proposed action.
Although there will be a 3 acre reduction in forested habitat due to landing construction, because of their
small size (1/2 acre), spotted owl habitat will be determined largely by the surrounding forested condition.
Consequently these openings are not expected to alter the habitat function of the overall stands because
they would re-vegetate relatively quickly and are well below the 10 acre opening threshold for an old
growth component established in the NWFP ROD (USDA FS 1994).
The following is a summary of effects to Nest, Roost and Foraging Habitat:
The proposed treatments would protect crown closure by retaining 40% or greater overstory
canopy closure in foraging habitat and 60 percent in roosting habitat. .
The existing mid and upper canopy layering would be protected by the interaction of retained
basal area, canopy closure standards and implementation of project design features to maintain
understory diversity.
All large snags would be retained unless determined to be a safety hazard and snag retention will
meet guidelines established in the Late Successional Reserve Assessment and continue to be
available to provide roosting and foraging habitat. Total snags will continue to occur at 12.5/acre
in all treatment sites.
Large coarse woody debris would be retained at required levels in all treatment sites.
All hardwoods would be retained in the short-term and increased over the long-term providing
both platforms for nesting and roosting and for prey base habitat.
Most ladder fuels (trees less than 10-inch dbh and brush) would be removed. However, a portion
of the existing conifer regeneration and shrub patches would be retained in scattered clumps in all
treatment units.
Harvesting equipment is restricted to specified trails during harvest, which would leave a majority
of the soil, ground level vegetation, and under-ground fungi undisturbed (CT).
Felling of hazard trees within Critical Habitat along roads could reduce one of the components of
the primary constituent elements required by nesting spotted owls. Removal of this component
would have limited effects due to the low percentage of hazardous dead trees over 18 inches,
leaning towards a road (maximum of 150 foot distance), and within suitable nesting habitat.

Harris Vegetation Project Biological Assessment
59
Although these hazard trees would be felled, they would remain on site as coarse woody debris
and provide another component of a primary constituent element for spotted owl habitat. These
trees would be felled regardless of the implementation of the Harris project.
The following is a summary of effects to Dispersal habitat:
All of these Units are part of a large area of habitat supporting dispersal of northern spotted owls.
While some dispersal habitat will be degraded, at a minimum, affected units provide adequate
tree sizes and canopy closures to provide protection from avian predators and some limited
foraging opportunities. Dispersal habitat would be maintained in the short-term in all treatment
units after treatments are completed and enhanced over the long-term.
While there will be a small reduction in dispersal habitat outside of the CH (52 acres),
connectivity will be maintained in the short-term and enhanced in the long term between this CH
unit and adjacent lands, facilitating spotted owl dispersal and sustainability.
Summary
The purpose of CH is to contribute to species conservation. Although some components of the primary
constituent elements may be modified, this action would not impair spotted owl survival or recovery. The
most concentrated and highest quality habitat is being left un-treated and in the majority of this CH and
vegetation is dense enough to prevent flight and hunting access. Treatments would not interfere with, and
would actually enhance, the ability of the CH to contribute fully to spotted owl recovery in the future.
Treatments would re-establish healthy stands of conifer, conifer hardwood, and promote hardwood
inclusions. Enhancement of this habitat would strengthen the ability of the CH to continue contributing to
landscape connectivity by increasing its resilience to large stand replacing fires and to increase spotted
owl habitat suitability. Benefits would include accelerated growth in the remaining stand, reduced
competition for water and nutrients, and minimize ladder fuels to reduce the potential for large stand
replacing fires. Components of the primary constituent elements within the treatment units may be altered
to some degree, however overall suitability would be maintained. The age and successional mix within
the watershed would not change with implementation of this project, however, the results of the treatment
would increase the late successional habitat percentage in the near future (2030). Snags and large logs
would be maintained at sufficient levels to provide for nesting structures and prey species. Stand structure
attributes required for nesting, foraging, and dispersal would be retained.
Insects and Fire
Infestation of a stand by insects and disease increases with stand stocking or density. As a result proposed
treatments will decrease insect related mortality on 248 acres. Also due to proposed planting within fuel
reduction stands, there will be a shift toward fire tolerant species on 162 acres
Effects on fire behavior will be similar to those described above under Section V and include reduced fire
risk (move from moderate or high to low) on 214 acres of critical habitat and maintenance of low fire risk
on another 34 acres.
Cumulative Effects
Because all lands within CHU 29, Subunit CA-73 occur on National Forest System Lands, there are no
future State, Tribal or Private actions anticipated within critical habitat. As a result there are no
cumulative effects anticipated and effects to critical habitat would be the same as those described under
direct and indirect effects.
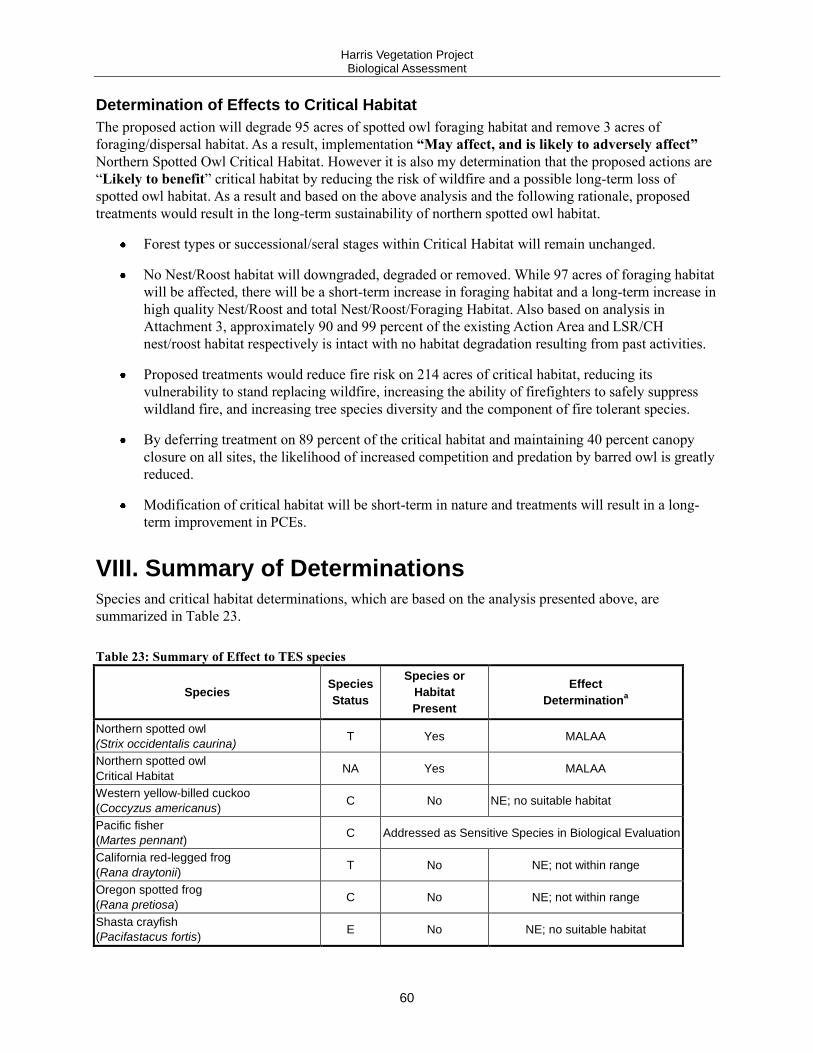
Harris Vegetation Project Biological Assessment
60
Determination of Effects to Critical Habitat
The proposed action will degrade 95 acres of spotted owl foraging habitat and remove 3 acres of
foraging/dispersal habitat. As a result, implementation “May affect, and is likely to adversely affect”
Northern Spotted Owl Critical Habitat. However it is also my determination that the proposed actions are
“Likely to benefit” critical habitat by reducing the risk of wildfire and a possible long-term loss of
spotted owl habitat. As a result and based on the above analysis and the following rationale, proposed
treatments would result in the long-term sustainability of northern spotted owl habitat.
Forest types or successional/seral stages within Critical Habitat will remain unchanged.
No Nest/Roost habitat will downgraded, degraded or removed. While 97 acres of foraging habitat
will be affected, there will be a short-term increase in foraging habitat and a long-term increase in
high quality Nest/Roost and total Nest/Roost/Foraging Habitat. Also based on analysis in
Attachment 3, approximately 90 and 99 percent of the existing Action Area and LSR/CH
nest/roost habitat respectively is intact with no habitat degradation resulting from past activities.
Proposed treatments would reduce fire risk on 214 acres of critical habitat, reducing its
vulnerability to stand replacing wildfire, increasing the ability of firefighters to safely suppress
wildland fire, and increasing tree species diversity and the component of fire tolerant species.
By deferring treatment on 89 percent of the critical habitat and maintaining 40 percent canopy
closure on all sites, the likelihood of increased competition and predation by barred owl is greatly
reduced.
Modification of critical habitat will be short-term in nature and treatments will result in a long-
term improvement in PCEs.
VIII. Summary of Determinations Species and critical habitat determinations, which are based on the analysis presented above, are
summarized in Table 23.
Table 23: Summary of Effect to TES species
Species Species
Status
Species or
Habitat
Present
Effect
Determinationa
Northern spotted owl
(Strix occidentalis caurina) T Yes MALAA
Northern spotted owl
Critical Habitat NA Yes MALAA
Western yellow-billed cuckoo
(Coccyzus americanus) C No NE; no suitable habitat
Pacific fisher
(Martes pennant) C Addressed as Sensitive Species in Biological Evaluation
California red-legged frog
(Rana draytonii) T No NE; not within range
Oregon spotted frog
(Rana pretiosa) C No NE; not within range
Shasta crayfish
(Pacifastacus fortis) E No NE; no suitable habitat

Harris Vegetation Project Biological Assessment
61
Species Species
Status
Species or
Habitat
Present
Effect
Determinationa
Vernal pool fairy shrimp
(Branchinecta lynchi) E No NE; no suitable habitat
Mardon skipper
(Polites mardon) C No NE; no suitable habitat
Green Sturgeon
(Acipenser medirostirs) T No NE; no suitable habitat
Shortnose sucker
(Chasmistes brevirostris) E No NE; no suitable habitat
Lost river sucker
(Deltistes luxatus) E No NE; no suitable habitat
South coho salmon
(Oncorhynchus kisutch) T No NE; no suitable habitat
Central valley steelhead
(Oncorhynchus mykiss) T No NE; no suitable habitat
Central Valley fall/late fall chinook salmon
(Ohcorhynchus tshawytscha C No NE; no suitable habitat
Central valley spring-run chinook salmon
(Oncorhynchus tshawytscha) T No NE; no suitable habitat
Winter-run chinook salmon
(Oncorhynchus tshawytscha) E No NE; no suitable habitat
a– MALAA – May Affect, Likely to Adversely Affect, NE – No Effect, NLAA – May Affect, Not Likely to Adversely Affect
IX. Management Recommendations 1. In the event that a new nest is discovered after project activities have begun, the FWS will be notified
and if deemed necessary, a limited operating period for nesting owls (no activity from February 1 –
September 15) will be required within ¼ mile of the nest sites for the northern spotted owl.
2. If a new nest is discovered after project activities have begun and the project is unlikely to affect the
nesting grove, then the District Biologist will assess the potential for disturbance due to project
operations and, in consultation with the FWS, will require a limited operating period for disturbance
if necessary (February 1 through July 10th).
X. Contributors Debbie Derby, District Wildlife Biologist, Mt. Shasta Ranger District, Shasta-Trinity National Forest.
Keith Paul, Wildlife Biologist, U.S. Fish and Wildlife Service, Red Bluff Fish and Wildlife Office.
Michelle Havens, Wildlife Biologist, U.S. Fish and Wildlife Service, Red Bluff Fish and Wildlife
Office
Kelly Wolcott, Forest Wildlife Biologist, Shasta-Trinity National Forest
Harris Vegetation Project Biological Assessment
62
XI. Literature Bartos, D.L. 2001. Landscape Dynamics of Aspen and Conifer Forests. Rocky Mountain Research
Station. RMRS-P-18-2001
Blakesley, J.A., Franklin, A.B., and R.J. Gutiérrez. 1992. Spotted owl roost and nest site selection in
northwestern California. 1992. Journal of Wildlife Management, 56(2):388-392.Collins et al 2007
Collins, B.M., J.J. Moghaddas and S.L. Stephens. Initial Changes in Forest Structure and Understory
Plant Communities Following Fuel Reduction Activities in a Sierra Nevada Mixed Conifer
Forest. Forest Ecology and Management. 239 (2007) 102-111.
Council of Environmental Quality. 2005. June 24, 2005 Memorandum to Federal Agency Heads
Providing Guidance on the Consideration of Past Actions in Cumulative Effect Analysis. 4 pp.
Fire Science. 2009 – Masticating Fuels: Effects on Prescribed Fire Behavior and Subsequent Vegetation
Effects. Issue 47. May 2009. 4 pp.
Forsman, E.D., Meslow, E.C., and H.M. Wight. 1984. Distribution and biology of the spotted owl in
Oregon. Wildlife Monographs 87:1-64.Gutierrez 1996 – species status Gutiérrez, R.J. 1996.
Biology and distribution of the northern spotted owl. Pages 2-5 in E.D. Forsman, S. DeStefano,
M.G. Raphael, and R.J. Gutierrez (eds). Studies in Avian Biology No. 17.
Franklin, A.B., D.R. Anderson, R.J. Gutiérrez, and K.P. Burnham. 2000. Climate, habitat quality, and
fitness in northern spotted owl populations in northwestern California. Ecological Monographs
70(4):539-590.
Irwin, L., D. Rock, and S. Rock. 2010. Spotted owls and barred owl resource selection in Southwestern
Washington. Progress Report, February 2010. 12 pp.
LaHaye, W.S. and R.J. Gutiérrez. 1999. Nest sites and nesting habitat of the northern spotted owl in
northwestern California. Condor 101(2):324-330.
McCusker, Neil. 2009. Process Narrative Describing Project Level Updates to hrlsr_strata. Harris
Vegetation Management Project. Unpublished report on file at the Shasta-Trinity National Forest,
Redding, California. 2 pp.
LaHaye, W.S. and R.J. Gutiérrez. 1999. Nest sites and nesting habitat of the northern spotted owl in
northwestern California. Condor 101(2):324-330.McCusker 2009.
Meyer, J.S., Irwin, L.L., and M.S. Boyce. 1998. Influence of habitat abundance and fragmentation on
northern spotted owls in western Oregon. Wildlife Monographs 139:1-51.
Oliver, William W. and Fabian C. C. Uzho 1997. Maximum stand densities for ponderosa pine and red
and white fir in Northern California. In: Proceedings 18th Annual Forest Vegetation Management
Conference; 1997 January 14-16; Sacramento, CA. Forest Vegetation Management Conference,
Redding, CA. pg 62-63.
Personal communication with Keith Paul-5/31/09
Personal communication with Keith Paul-7/7/09

Harris Vegetation Project Biological Assessment
63
Personal communication between Keith Paul and Debbie Derbie-7/23/09
Personal communication between Scott Reitz and Red Bluff USFWS Office-9/28/10
Personal communication between Scott Reitz and Michelle Havens-9/29/10
Personal communication between Scott Reitz and Michelle Havens-10/15/09
Personal communication with Debbie Derbie-3/4/10
personal communication with Rhonda Posey-3/15/10
Russell, R.E., J.F. Lehmkuhl, S.T. Buckland and V.A. Saab. 2010. Short-term Responses of Red Squirrels
to Prescribed Burning in the Interior Pacific Northwest, USA. Journal of Wildlife Management.
74(1):12-17.
Sakai, H.F and B. R. Noon. 1993. Between-Habitat Movement of Dusky-Footed Woodrats and
Vulnerability to Predation. Journal of Wildlife Management. 61 (2): 343-250.
Singleton, P.H., J.F. Lehmkuhl, W.I. Gaines and S. A. Graham. 2010. Barred owl space use and habitat
selection in the Eastern Cascades, Washington. Journal of Wildlife Management 74 (2): 285-294.
Solis, D.M., and R.J. Gutiérrez. 1990. Summer habitat ecology of northern spotted owls in northwestern
California. The Condor 92:739-748.
Thomas, J.W., E.D. Forsman, J.B. Lint, E.C. Meslow, B.R. Noon, and J. Verner. 1990. A Conservation
Strategy for the Northern Spotted Owl. Interagency scientific committee to address the
conservation of the northern spotted owl.
USDA FS and USDI BLM. 1994 – NW forest plan USDA Forest Service and USDI Bureau of Land
Management. 1994. Record of Decision for Amendments to Forest Service and Bureau of Land
Management Planning Documents within the Range of the Northern Spotted Owl (Northwest
Forest Plan). Portland, Oregon.
USDA FS. 1995. Shasta-Trinity National Forests Land and Resource Management Plan. Shasta-Trinity
National Forests, Redding CA.
USDA FS. 1999. Shasta-Trinity NF Forest Wide LSR Assessment. Redding, CA.
USDA FS. 2003. Porcupine Watershed Analysis. Shasta-Trinity National Forest. Redding CA. 141 pp.
USDI FWS. 2002. Recovery Plan for the California Red-legged Frog. U.S. Fish and Wildlife Service,
Portland, Oregon. 173pp.
USDI FWS. 2006. Silviculture Practices Supporting Northern Spotted Owl Habitat in Dry Forest
Ecosystems. Southern Oregon University, Ashland Oregon. Workshop Report.
USDI FWS. 2008a. Recovery Plan for the Northern Spotted Owl (Strix occidentalis caurina) Region 1
Portland, Oregon 142 pp.
USDI FWS. 2008b. Federal Register. Endangered and Threatened Wildlife and Plants; Revised
Designation of Critical Habitat for the Northern Spotted Owl; Final Rule. Vol. 73; No. 157 pp.
47326-47522. August 13, 2008.

Harris Vegetation Project Biological Assessment
64
USDI FWS. 2009 - Arcata Fish and Wildlife Office website http://arcata.fws.gov dated January 4, 2010,
document number: 317478880-143316
USDI FWS. 2009a. U.S. Fish and Wildlife Species Assessment and Listing Priority Assignment Form.
Rana pretiosa. Oregon Spotted Frog. 71 pp.
USDI FWS. 2009b. Mardon Skipper Species Profile. U.S. Fish and Wildlife. Pacific Southwest Region.
Arcata Office. 3 pp.
USDA FS 2010a. Harris Vegetation Management Project. Hydrologist Report. 39 pp.
Vanderwell, M.C. S.C. Mills and J.R. Malcom. 2009. Effects of Partial Harvesting on Vertebrate Species
Associated with Late-successional Forests in Ontario’s Boreal Region. The Forestry Chronicle.
Vol 85 No. 1. 14 pp.
Youngblood, A.Y., T. Max and K. Coe. 2004. Stand Structure in eastside old growth ponderosa pine
forests of Oregon and northern California. Forest Ecology and Management 199. 191-217.
Zabel, C. J., J.R. Dunk, H.B. Stauffer, L.M. Roberts, B.S. Mulder, and A. Wright. 2003. Northern spotted
owl habitat models for research and management application in California (USA). Ecological
Applications 13(4):1027-1040.

Harris Vegetation Project Biological Assessment
65
Attachment 1: Species List

Harris Vegetation Project Biological Assessment
66
Listed/Proposed Threatened and Endangered Species for Siskiyou County (Candidates Included)
March 25, 2011
Document number: 615772918-72542
==============================================================
KEY:
(PE) Proposed Endangered Proposed in the Federal Register as being in danger of extinction
(PT) Proposed Threatened Proposed as likely to become endangered within the foreseeable future
(E) Endangered Listed in the Federal Register as being in danger of extinction
(T) Threatened Listed as likely to become endangered within the foreseeable future
(C) Candidate which may become a proposed species Habitat Y = Designated, P = Proposed, N = None
Designated
* Denotes a species Listed by the National Marine Fisheries Service
Type Scientific Name Common Name Category Critical Habitat
Plants
Arabis macdonaldiana McDonald's rock-cress E N
Astragalus applegatei Applegate's milk-vetch E N
Calochortus persistens Siskiyou mariposa lily C N
Fritillaria gentneri Gentner's frittilary E N
Orcuttia tenuis slender Orcutt grass T P
Phlox hirsuta Yreka phlox E N
Invertebrates
Branchinecta lynchi vernal pool fairy shrimp T Y
Pacifastacus fortis Shasta crayfish E N
Polites mardon mardon skipper C N
Fish
* Acipenser medirostris green sturgeon T Y
Chasmistes brevirostris shortnose sucker E P
Deltistes luxatus Lost River sucker E P
* Oncorhynchus kisutch S. OR/N. CA coho salmon T Y
* Oncorhynchus mykiss Central Valley steelhead T Y
* Oncorhynchus tshawytscha Central Valley fall/late-fall chinook salmon
C N
* Oncorhynchus tshawytscha Central Valley spring-run chinook salmon
T Y
* Oncorhynchus tshawytscha winter-run chinook salmon E Y
Amphibians
Rana draytonii California red-legged frog T Y
Rana pretiosa Oregon spotted frog C N
Birds
Coccyzus americanus Western yellow-billed cuckoo C N
Strix occidentalis caurina northern spotted owl T Y
Mammals
Martes pennanti fisher, West Coast DPS C N

Harris Vegetation Project Biological Assessment
67
Attachment 2: Project Maps

Harris Vegetation Project Biological Assessment
68

Harris Vegetation Project Biological Assessment
69

Harris Vegetation Project Biological Assessment
70

Harris Vegetation Project Biological Assessment
71
Attachment 3: Harris Baseline Habitat Summary

Harris Vegetation Project Biological Assessment
72
Harris Vegetation Management Project Spotted Owl Action Area Natural/Human History
December 20, 2010
Introduction This attachment augments the information concerning the ‘Existing Environment/Environmental Baseline
presented in Harris Biological Assessment (BA) which assess potential impacts of treatments proposed in
the Harris Vegetation Management Project (Harris Project) on the northern spotted owl. This attachment
provides insight into the natural and human history that played a broad-scale role in why owl habitat
conditions are what we see today in the Harris Vegetation Management Project Spotted Owl Action Area
(Action Area). It also identifies the current spotted owl habitat that would be unaffected by past or
anticipated future activities within the Harris Action Area and spotted owl critical habitat, as described in
the Harris BA.
Climatic Pattern Climatic patterns have affected and continue to affect both the condition of spotted owl habitat and its
vulnerability to fire within the Action Area. The contemporary climatic phase appears to have become
established about 3,500-4,000 years ago (Skinner et al, in Fire in Californias Ecosystems 2006, edited by
Neil G. Sugihara, Jan W. van Wagtendonk, Kevin E. Shaffer, Jo Ann Fites-Kaufman and Andrea E.
Thode). The climate for the Porcupine watershed, which includes the Harris Project is characterized as hot
and dry in the summer and it receives less rainfall than most of the Shasta-Trinity National Forest (USDA
FS 2004 p. 1-3). Mean annual precipitation is less than 40 inches and drops below 25 inches in the
southeast portion of the watershed. Most of the precipitation is from winter storms of several days’
duration and moderate intensity. Approximately 90% of annual precipitation occurs from October through
April, with convective storms producing occasional precipitation during the summer.
This weather pattern combined with the soil conditions that characterize much of the action area affects
the distribution of both vegetation and wildlife within the watershed. For example, fir occurs largely at
higher elevations on moister sites, whereas pine dominates lower elevations. Also as described in the BA,
there is little upland water and due to the dry porus soils, absence of perennial streams and low
precipitation, the suitability spotted owl habitat in the eastern half of the Action Area is greatly reduced.
Climate Change In a recent publication (Population trends in northern spotted owls: Associations with climate in the
Pacific Northwest, Glenn et al. 2010; available online with the following link:
http://dx.doi.org/10.1016/j.biocon.2010.06.021) scientists indicate that climate change predictions of
warmer, wetter winters and hotter, drier summers for the Pacific Northwest in the first half of the 21st
century have the potential to negatively affect annual survival, recruitment, and consequently population

Harris Vegetation Project Biological Assessment
73
growth rates for northern spotted owls. These researchers recognize that natural resource managers cannot
control climate variation and barred owls are likely to persist and increase in the range of the northern
spotted owl. Consequently maintaining sufficient high quality habitat on the landscape remains the most
important management strategy for the conservation of this subspecies This was recognized in Harris
Project purpose and need, which emphasized promoting the development of species diversity and
reducing the risk of catastrophic wildfire to provide for the long-term sustainability of spotted owl habitat.
Fire, Fuels and Vegetation Management The following characterization of the Harris Project Spotted Owl Action Area is drawn largely from the
“Porcupine Watershed Analysis (USDA FS 2004). This watershed analysis provides a landscape-scale
evaluation of the physical and ecological conditions and processes that occur within the Action Area. The
Porcupine analysis compares existing conditions with historic conditions to evaluate impacts, describe
trends and infer the possible causes of change through time that can provide insight into what lead to
current spotted owl habitat conditions. Fire & fuels and vegetation management are emphasized because
as described below, these issues have shaped the current spotted owl habitat conditions within the Action
Area.
Fire Regime
Fire/Fuel Management - Pre-European Settlement to Pre-1850
Evidence of past fires can be detected from tree rings of large trees that have lived a century or more. Fire
scars on the stumps of trees that remain in previously logged areas record the occurrence of fires
throughout the history of the tree. Evidence of fires recorded in tree rings provides the most accurate
long-term record of fires that occurred before the twentieth century (Skinner 1997).
Fire occurrence histories were determined from sites located in the Northwest Sacramento Province by
fire specialist Carl Skinner (FS Pacific Southwest Research Station). Results suggest that fires were
frequent (ranging from 15 to 58 year return intervals) during the 400 to 500 years before the second half
of the 20th century. Also these fires appear to have been typically small and mostly of low to moderate
intensity. Both Native Americans and lightning were sources of historical fire disturbance, with Native
Americans regularly burning the forest. Also research on fire modeling based on long-term climatic data
including lightning frequency suggests that much of the early fire history can be explained by lightning
occurrence alone. As a result lightning caused fire starts probably accounted for the majority of fire
ignitions which occurred at 5-25 year intervals, as well as occasional smaller stand replacement fires
characteristic of the watershed fire regime.
Consequently fire was a major disturbance factor in the Porcupine Watershed prior to European
settlement and fire drought disturbances controlled forest structure and composition and created a fire-
adapted ecosystem that was dependent on recurring fire.
The process of stand development in pine forests is a result of shade intolerance of ponderosa pine
species, sporadic years of adequate seed establishment, adequate precipitation, and frequent fire. Prior to
1850 the Porcupine watershed (at least 80%) was probably dominated by fire adapted Ponderosa Pine.
Frequent low intensity fires burned understory vegetation keeping fuel concentrations low and
maintaining open pine stands. Low intensity fires scarred but generally did not kill larger trees and there
are documented accounts of large free burning wildfires that generally did not burn the forest overstory.
However, while recurring fire checked many shade tolerant species in the understory, early Ponderosa
Pine forest still contained considerable understory vegetation, particularly in the moist, high elevation
mixed conifer stands.

Harris Vegetation Project Biological Assessment
74
Grasses were the primary understory vegetation in the pine dominant forests of the watershed. The typical
fire in Ponderosa Pine forest likely only removed the cured component of herbaceous fuels above the
ground. Bitterbrush was likely much less common across the watershed than it is today. It is also doubtful
that large logs remained long on the forest floor in this regime to provide wildlife habitat as they were
likely consumed after several years of frequent fires.
Fire and Fuels – 1850 to Present
Fire regimes in the watershed were altered following the arrival of European settlers. Lightning has been
the primary ignition source and the porcupine watershed is one of the more intense lightning
concentration areas on the Shasta-Trinity National Forest. The porcupine watershed also ranks high in
terms of the total number of acres burned in historical fires (USDA FS 2004).
By the early 1900s logging was beginning to change the landscape in many western forests. The
continued practice of removing the large overstory, leaving heavy amounts of fuels on the surface, and the
development of surface to crown fuel ladders gradually contributed to this transition and large wildfires
occurred early in the 20th century. Between 1917 and 1928 over 123,000 acres of the porcupine watershed
burned, including a 33,000 acre wildfire in 1928, which included 3,200 acres in the northeast portion of
the Action Area . While an era of strong fire suppression over the last 70 years has greatly reduced the
large wildfires that occurred during the early years of the 20th century, this policy has largely led to the
complete exclusion of fire in this fire-adapted ecosystem. As a result there have been no wildfires in the
Action Area in over 80 years and currently the Action Area is outside of its historical frequent, low
intensity fire regime.
This modification of the historical fire regime has also altered action area vegetation. For example while
Ponderosa Pine and mixed conifer are the dominant vegetation types, there is currently a large lodgepole
component on lower elevation lands in the western half of the action area that increased following the
large wildfires early in the 20th century. Also historically, periodic wildfires limited the species
composition of dry sites to mainly pine and with fire exclusion, stand composition within the action area
is shifting from pine, to pine mixed with white fir (USDA Forest Service 1999; USDA Forest Service
2004 p. 5-5). The shift in species composition from pine to fir increases potential tree mortality from
wildfire because fir is more susceptible to fire-caused mortality than pine due to its branch characteristics
and bark qualities (USDA Forest Service 2010). The exclusion of fire has also encouraged the
development of understory vegetation which has formed live fuel ladders that extend into the forest
canopy (USDA Forest Service 2004 p. 2-3). Consequently stands throughout the Action Area have
accumulated surface (e.g. brush) and ladder fuels that would increase overstory tree mortality in the event
of a wildfire (USDA FS 1999). While changes are less evident on moister sites at higher elevations, on
lower drier sites, the encroachment of shade tolerant species has clearly changed vertical stand structure
and enhanced the potential for crowning and high severity fire behavior.
Much of the private property has been heavily managed for timber production in the last two decades. As
a result and due to active fire suppression, the fuel loading has increased in the last twenty years on these
private lands and there are many young stands of timber in plantations in private portions of the Action
Area that are especially vulnerable to wildfire.
Summary
Historically, fire has been a natural influence on the landscape within the Action Area. Before the
influence of humans, wildfires started from lightning strikes and spread across large tracts of land with
hot dry winds before burning out. Such frequent, low intensity fires burn quickly through under brush,
preserving large trees and maintaining diverse, multistory forests. Forest management practices over the

Harris Vegetation Project Biological Assessment
75
past 70+ years, however, have suppressed fire on many of the public lands and have profoundly affected
the structure and composition of vegetation in low to middle elevation forests (Weatherspoon 1996).
Conifer stands have become denser and consist mainly of small and medium-sized shade-tolerant and
fire-sensitive species. Additionally, due to drought, disease or pest infestation, dead and downed trees
have increased the amount of fuels on the forest floor. One consequence of these changes has been a large
increase in the amount and continuity of both live and dead forest fuels, resulting in a substantial increase
in the probability of large, severe wildfires (Weatherspoon and Skinner 1996). The conditions are now set
for hot stand replacement type fires that consume underbrush, overstory trees and the duff layer. Stand
replacement type fires burn hotter, longer and are usually more difficult to control and fire size is
predicted to increase under these conditions.
Vegetation Management
Pre-European Settlement
Natural and human-caused fires have been a source of disturbance to and have altered vegetation within
the watershed for thousands of years, influencing the development of plant characteristics and vegetative
patterns (including owl habitat) on the landscape (USDA FS 2004).
The general pattern of forest types probably existed then, as they do today, although forest types and
stocking levels probably varied somewhat by disturbance regime. Naturally caused fires occurred
frequently due to annual weather patterns and seasonal climatic extremes, although these frequent, low-
intensity fires burn out quickly, preserving large trees, and maintaining diverse, multi-story forests
(Weatherspoon 1996). A general model of the disturbance regimes and resulting vegetation is that
ponderosa pine stands likely occurred at lower elevations and had a short interval fire regime and open
stands, whereas fir stands occurred at higher elevations with lengthened fire intervals and a disturbance
cycle resulting in low to high stocking levels.
As described above, the climate of the Action Area is currently dry and there is no evidence to suggest
that drought conditions and effects under Pre-European Settlement Conditions were very dissimilar from
current conditions. Rainfall records dating back to 1905 show periods of drought that are probably
indicative of the pre-settlement climatic pattern. Such droughts probably created the same opportunity for
insect infestation and caused a similar pattern of tree mortality as is seen today (USDA FS 2004).
1850 to Present
European man entered the watershed in the mid 1800s and, in the ensuing years of settlement, completely
altered both the vegetation and landscape. Early timber harvest consisted primarily of limited selective
harvest, taking mostly the largest and most accessible trees for a supply to localized markets associated
with settlement. From 1900 to 1930, timber activities were accomplished largely by railroad logging,
which was a major land use activity within the watershed. By 1936, the number of railroads had grown
and many were built on the same corridors as earlier wagon roads. Many watershed lands, including
steeper slopes were now accessible to logging and harvest subsequently increased. Starting in the mid
1950s more roads were built to accommodate tractor/truck logging and to provide public access, although
up until the late 1960s most logging activity was on private lands owned by timber companies.
Timber harvest on public lands started in the mid to late 1960s and during this time key roads were
improved to provide better access for commercial logging and recreational traffic. Access into the area
increased even more rapidly from the 1970s on, with the development of additional road systems for
timber sales and logging of both public and private lands continues across the watershed.
Harris Vegetation Project Biological Assessment
76
As described above, historical large fire history as well as fire exclusion has also played a significant role
in vegetation successional patterns throughout the watershed and catastrophic fires early in the 20th
century resulted in conversions from mixed conifer and pine stands to brush, knobcone pine and
lodgepole pine. Fire suppression has also allowed the incursion of white fir into the understory of mixed
conifer and ponderosa pine stands. While this phenomenon has added diversity within stands by creating
vegetation layering and a wider distribution of tree size classes, it has also reduced the diversity of seral
stages as fewer and smaller openings were created.
The combination of past timber harvest and fire suppression has greatly altered vegetation within the
Action Area and the following is a summary of changes to vegetation within the Porcupine watershed
(USDA FS 2004).
Stands currently contain much higher stocking levels and have developed dense understories of
shade tolerant species that contribute to vertical fuel continuity.
Species composition is changing and stands that were traditionally dominated by pine or mixed
conifers are shifting to shade tolerant and fire intolerant species.
Past actions have reduced seral diversity among stands. Openings and early seral stages are
reduced from pre-suppression conditions.
Logging has affected species composition through a prolonged practice of selecting the most
valuable species for harvest. Sugar pine, ponderosa pine, and Douglas-fir were selected over
incense cedar and white fir. Logging also maintained openings that permitted shade-intolerant
species such as black oak to persist even in the absence of fire.
Logging has affected the diversity of seral stages. The pre-settlement forest was dominated by
older seral stages. Early logging caused a widespread shift to early seral stages. The second
growth stands are now mostly mid-mature and, in some extensive areas, are homogenous in age
and demonstrate little seral diversity.
Timber Harvest
National Forest
Between 1965 and the present (2010) timber harvest on National Forest System (NFS) lands included a
mix of timber harvest treatments including 1) partial harvest, or harvest where much of the overstory was
retained on the site (e.g. commercial thinning, transition harvest, selection harvest), 2) final harvest, or
harvest where most of the overstory was removed (e.g. stand clearcutting, overstory and shelterwood
removal harvest) and 3) sanitation salvage, or harvest of dead and dying material where removal of the
overstory varied.
Within the last 45 years approximately 58 percent of the National Forest System (NFS) lands within the
action area have been affected by timber harvest and Table 24 displays partial, final and salvage harvest
that has occurred since 1965. General effects of these types of harvest to spotted owl habitat include the
following 1) final harvest treatments would have resulted in habitat removal for approximately 50 years,
2) sanitation salvage could have resulted in habitat degradation for approximately 10 to 20 years or
downgrading for longer periods, depending on the amount of live overstory left on site and 3) partial
harvest would have resulted in habitat degradation, for 10 to 15 years (as discussed in the BA). As a
result, it is unlikely that habitat degradation would still be occurring on partial harvest sites completed
prior to 1996.

Harris Vegetation Project Biological Assessment
77
Table 24: Summary of National Forest Timber Harvest within the Action Area
Period of Harvest
Partial
Harvest
Final
Harvest
Sanitation/
Salvage Total
Acres % Acres % Acres % Acres %
1965-1985 1,572 64.9* 849 35.1* 0* 0* 2,421 16.9**
1986-1995 1,955 41.5* 2,537 53.9* 214 4.5* 4,706 32.9**
1996-2005 2,881 60.0* 42 0.9* 1,880 39.1* 4,805 33.6**
2006-2010 1,668 70.7* 0 0 690 29.3* 2,359 16.5**
Total 8,078 56.5** 3,428 24.0** 2,785 19.5** 14,291 100
*-percent of period total **-percent of total harvest
Harvest prior to the mid-1990 on NFS lands was conducted primarily to reduce stocking and to obtain
timber volume. Also because many stands were at their rotation age, final harvest activities made up
between 35 and 54 percent of the harvest between 1965 and 1995. However management objectives
driving timber harvest have changed since 1995. For example due to the increased mortality of lodgepole
pine (due to insect infestation and disease), sanitation salvage harvest greatly increased after 1995. Also
because many stands were overstocked due to fire exclusion, increased mortality of other species was
occurring, including mortality of large diameter trees. As a result since 1995 partial harvest activities were
being implemented primarily to reduce overstocking and large tree mortality, increase stand health and
vigor, promote fire tolerant species and reduce fuels and associated fire risk. Additionally with
implementation of the Northwest Forest Plan, treatments within the LSR were implemented to promote
the development of late successional forest conditions and improve spotted owl habitat.
Management of NFS lands within the Action Area since the mid-1960s has also included a variety of
treatments other than timber harvest that are designed to promote species diversity, reduce fuels and
improve vegetation and wildlife conditions across the watershed. While this information is provided to
identify all human activities that have occurred within the Action Area, most of these activities occur
within areas that are not currently suitable (nesting/roost or foraging) spotted owl habitat (e.g. plantations)
or occur as supplemental treatments on sites following harvest (e.g. planting, site preparation and weed
and release to promote desired species). As a result these activities are not likely to adversely affect
additional areas of suitable spotted owl habitat. These activities as well as the timber harvest displayed in
Table 24 are summarized by project for the Action Area and LSR/CH in Table 25 and Table 26
respectively.
Table 25: Past Action Area activities on National Forest System lands by project
Project NEPA Name Treatments Acres Units Years ESA
Consultation
Harris LSR Fuel Reduction
Sanitation salvage, area release and weeding, planting, site preparation
1482 2 2007-2009
Informal
7/11/2005
Harris Salvage Sanitation Salvage, pile burning 48 2 2005-2007
Informal
12/18/2003
Powder Commercial thinning, burning of piled material, disease control, jackpot burning, soil stability improvement,
1517 10 2006-2008
Informal 5/5/2003
Hemlock
Area release and weed, burning of piles, commercial thinning, disease control, planting, wildlife leave trees, site preparation, plantation thinning, clearcutting, pruning, wildlife leave trees
2652 15 2004-2008
Informal
9/24/2002

Harris Vegetation Project Biological Assessment
78
Project NEPA Name Treatments Acres Units Years ESA
Consultation
Davis
Area and individual tree release and weeding, pile burning, fuel chipping, commercial thinning, disease control, planting, piling of fuels, group selection harvest, improvement cutting, sanitation salvage, site preparation, stand clearcutting, hazardous fuel thinning
4376 67 2003-2008
Informal,
3/26/02
Bartle commercial thinning, plantation thinning, disease control, TSI thinning, fuel chipping
1633 13 1997-2008
Informal
11/14/97
Precommercial Thin in LSR
Plantation thinning, chipping of fuels, TSI thinning
907 10 2008
Lookout Salvage Sanitation salvage 246 2 2007
Plantation Thin Commercial thinning 1518 24 1999-2007
McCloud Flats Plantation thinning, chipping of fuels, pruning
736 20 2005-2007
OSO Wind Throw Salvage
Salvage 51 2 2004
Un-named Pruning 516 31 2004
Un-named Soil productivity improvement 93 1 2004
Dry Commercial thinning, plantation thinning
222 3 2001
Iron
Area and individual release and weeding, burning of piled material, commercial thinning, planting, site preparation, overstory removal cutting, patch clearcutting, plantation thinning, stand clearcutting, wildlife habitat seeding and planting, sanitation cutting
3396 25 1990-2002
Dry Lake
Area and individual tree release and weeding, burning of piled material, planting, site preparation, patch clearcutting, plantation thinning
145 5 1986-2002
Horse Peak Commercial thinning 13 2 2000
Chippy Commercial thinning 9 2 1999
Chippy/Chippy II Commercial thinning 5 1 1998-1999
Toad Salvage Sanitation salvage 300 1 1998
Point Salvage Sanitation salvage 448 1 1997
Sight Salvage Sanitation salvage 448 1 1997
TALC Salvage Sanitation salvage 161 1 1996
Powder Salvage Sanitation salvage 205 2 1994
Un-named Area release and weeding 904 2 1994-1998
Lookout
Area and individual tree release and weeding, burning of piled material, planting, site preparation, patch clearcutting, fuel piling, plantation thinning, sanitation salvage,
2100 12 1986-1999

Harris Vegetation Project Biological Assessment
79
Project NEPA Name Treatments Acres Units Years ESA
Consultation
Losthopper
Area and individual tree release and weeding, burning of piled material, commercial thinning, planting, site preparation, patch clearcutting, plantation thinning, wildlife habitat seeding and planting
1480 11 1988-1998
Slag
Burning of piled material, planting, individual tree release and weeding, site preparation, patch clearcutting, plantation thinning,
1055 12 1989-2000
Crack
Area and individual release and weeding, burning of pile material, planting, site preparation, seed tree harvest, overstory removal harvest, stand clearcutting
1092 26 1986-1995
Buck Thinning Commercial thinning 100 1 1990
Frogger
Area and individual tree release and weeding, burning of piled material, planting, site preparation, stand clearcutting, plantation thinning
329 1 1985-1998
Dry Lake
Area and individual tree release and weed, burning of piled material, planting, site preparation, patch clearcutting, plantation thinning,
144 1 1987
Cub Planting, site preparation, plantation thinning
365 5 1969-1986
Hunt
Area and individual tree release and weeding, burning of piled material, commercial thinning, planting, site preparation, overstory removal harvest, patch and stand clearcutting
1332 16 1983-1997
Ninebuck Burning of piled material, commercial thinning, planting, site preparation, plantation thinning
1534 8 1967-1975
Well 85
Area and individual tree release and weeding, burning of piled material, commercial thinning, planting, site preparation, overstory removal harvest, patch clearcutting, plantation thinning,
4509 23 1989-2002
Toad II
Area and individual tree release and weeding, burning of piled material, planting, site preparation, patch and stand clearcutting, plantation thinning,
634 6 1985-2002
Toad
Area and individual tree release and weeding, burning of piled material, commercial thinning, planting, site preparation, overstory removal harvest, patch clearcutting, piling of fuels, plantation thinning, stand clearcutting, strip clearcutting
9873 35 1978-2003
Toad Mountain Burning of piled material, planting, site preparation, stand clearcutting
1090 4 1977-1991

Harris Vegetation Project Biological Assessment
80
Project NEPA Name Treatments Acres Units Years ESA
Consultation
Un-named
Burning of piled material 1464 27 1968-1981
Site preparation 4568 59 1965-1981
Planting 3924 46 1966-1993
Plantation thinning 4687 52 1979-2007
Watershed non-structural Improvement 207 1 Prior to 1980
Total 62,518
Table 26: Past LSR/Critical habitat activities on National Forest System lands
Project Treatments Acres Units Years ESA
Consultation
Harris LSR Fuel
Reduction
Area release and weeding, burning of piled material, disease control, site preparation, sanitation salvage
1482 2 2007-2009 Informal
7/11/2005
LSR Plantation thinning
Chipping of fuels, plantation thinning 591 10 2007-2008
McCloud Plantation thinning, pruning 2 1 2006-2007
Davis Burning of piled material, commercial thinning 4 1 2000-2006 Informal,
3/26/02
Un-known Plantation thinning, pruning 676 4 2000-2006
Iron
Area and individual tree weed and release, burning of piled material, commercial thinning, planting, site preparation, overstory removal, patch clearcutting, plantation thinning, stand clearcutting
1515 23 1990-2002
Well 85
Area and individual tree weed and release, burning of piled material, commercial thinning, planting, site preparation, overstory removal, patch clearcutting, plantation thinning
2705 19 1989-1999
Frogger Animal damage control, burning of piled material, planting, individual tree release, site preparation, plantation thinning, stand clearcutting
27 2 1986-1996
Lost Hopper Planting, site preparation, patch clearcutting 1 1 1989-1991
Un-known Burning of piled material, planting, site preparation, 100 23 1966-1981
Consultation Synopsis and LSR/Critical Habitat Treatments
The Shasta-Trinity National Forest has consulted on six projects within the Action Area since 1992
including the Bartle, Davis, Hemlock, Powder, Harris salvage and Harris LSR fuel reduction projects. The
Bartle, Davis, Hemlock and Powder projects utilized primarily thinning to reduce stand stocking and
improve forest health, whereas the Harris salvage and LSR fuel reduction projects emphasized fuel
reduction within and adjacent to the LSR.
All projects resulted in a May Affect, Not Likely to Adversely Affect determination and no take was
issued for any project within the Action Area. However foraging habitat degradation was anticipated on
up to 1,428 acres, 2,304 acres and 2,468 acres for the Powder, Hemlock and Davis projects respectively,
with Hemlock treatments also degrading up to 45 acres of nest/roost habitat. In addition, up to 3000 acres

Harris Vegetation Project Biological Assessment
81
of dispersal habitat degradation was anticipated for the Bartle project. Each of the projects used limited
operating periods to reduce the possible disturbance effects on owls. Also treatments were modified in
both the Davis (selection harvest) and Powder (maintenance of 60% canopy closure in thinning adjacent
to LSR) projects in order to reduce impacts to northern spotted owl habitat.
Two projects (Harris LSR Fuel Reduction and Davis) included activities within the Harris LSR, and these
are displayed in Table 26. However the Harris LSR was only recently designated as spotted owl critical
habitat (Unit 29, subunit CA-73) (USFWS 2008) and the Harris Project is the first project to consult on
critical habitat within the Action Area.
Private
Past activity (timber harvest) on private land is summarized in Table 27 and Table 28 (data on other
reforestation treatments was not available). Although some sites have had more than one treatment, over
5000 acres or approximately 94 percent of the private lands within the Action Area have had some level
of harvest. As a result, there is little nest/roost and foraging habitat (15 percent) and over 75 percent of the
private land within the action area is considered capable habitat. For these reasons and as described in the
Harris BA, it is assumed that NFS lands must provide adequate habitat to ensure spotted owl viability
within the Action Area.

Harris Vegetation Project Biological Assessment
82
Table 27: Action area activities on private land
Landowner THP No. Clearcut
(CLCT)
Comm.
Thin
(CMTH)
Sanitation Salvage
(SASV)
Shelterwood
Removal
(SWRC)
SWRC/
CMTH
Transition
Harvest
(TRAN)
Selection Harvest
(SLCN)
Group Selection
(GSLN_
Total
Acres
Balsam Pacific 158 37 0 0 0 649 0 0 0 686
Balsam Pacific 73 0 0 0 6 0 98 0 0 104
Balsam Pacific 157 0 0 217 0 0 0 0 0 217
Balsam Pacific 165 467 299 952 235 0 0 22 0 1,975
Balsam Pacific 172 210 66 0 99 0 1909 0 0 2,284
Campbell Bascom
Pacific Log Corp.
202 0 10 0 0 0 0 0 36 46
Sierra Pacific Holding Company
172 87 35 0 1 0 0 0 0 123
Sierra Pacific Holding Company
326 59 0 0 62 0 0 0 0 121
Total 860 410 1,169 403 649 2,007 22 36 5,556

Harris Vegetation Project Biological Assessment
83
Table 28: Private land THPs completed with the Action Area by Year
Silvicultural Operation
2003 2006 2008 2011-2012
Total
Clearcut (CLCT) 0 526 247 87 860
Commercial Thin - (MMTH_
0 299 76 35 410
Sanitation Salvage - (SASV)
0 952 0 217 1,169
Shelterwood Removal - SHRC
6 298 99 1 404
Transition Harvest - TRAN
99 0 1,909 0 2,008
Selection Harvest - SLCN
0 22 0 0 22
Group Selection Harvest - GSLN
0 0 35 0 35
Shelterwood Removal/Commercial
Thin - SHRT 0 0 649 0 649
Total 104 2,097 3,015 340 5,556
All Ownerships
Table 29 summaries by activity all past actions within the Action Area and the Harris LSR/CH. Activities
that are likely to adversely affect spotted owl habitat are shown in bold. Also because virtually all sites
harvested also receive reforestation (e.g. planting, weed and release) or fuels treatments, several activities
occur on the same site and the acres treated is much greater than the acres affected.
Table 29: Past Action Area activities by treatment
Action Area Critical Habitat
Activitya
NFS
acres
Private
Acres % of AA
% of NFS land
Acres %
Animal Damage Control 687 0 2.2 2.8 3 <1
Area release and weeding 6,769 0 22.2 27.5 1410 63
Burning of Piled Material 6,736 0 22.1 27.4 600 27
Chemical site prep for planting 211 0 0.7 0.9 0 0
Chipping of Fuels 272 0 0.9 1.1 61 3
Commercial thinning 6,522 410 38.7 46.3 141 6
Disease Control 2505 0 8 10 247 11
Fill in planting w/o site preparation
1,888 0 6.2 7.7 0 0
Fill in planting with site preparation
7,666 0 25.2 31.2 876 40
Group Selection Cut 6 35 <0.1 <0.1 0 0
Improvement cut 37 0 0.1 0.2 0 0
Individual tree release and weeding
1,729 0 5.6 7.0 63 3
Jackpot burning 238 0 0.8 1.0 0 0
Leave trees for wildlife* 21 0 <0.1 <0.1 0 0

Harris Vegetation Project Biological Assessment
84
Action Area Critical Habitat
Activitya
NFS
acres
Private
Acres % of AA
% of NFS land
Acres %
Mechanical site preparation 7,770 0 25.5 31.6 934 42
Other site preparation 1,748 0 4.7 5.8 324 15
Overstory removal cut 783 0 2.6 3.2 343 16
Patch clearcutting 1,460 0 4.8 5.9 347 16
Piling of Fuels, machine or hand
643 0 2.1 2.6 0 0
Precommercial thinning 7,423 0 24.4 30.2 1358 61
Pruning* 1607 0 5.3 6.5 1
Salvage Cut 51 0 0.2 0.2 0 0
Sanitation salvage cut 2,725 1,169 12.8 11.0 247 11
Seed tree seed cut 45 0 0.2 0.2 0 0
Selection Harvest 0 22 0.1 0 0 0
Shelterwood Removal cut 0 404 1.3 0 0 0
Shelterwood Removal/commercial Thinning
0 649 2.1 0 0 0
Site preparation for planting 429 0 1.4 1.7 0 0
Soil productivity improvement* 376 0 1.2 1.5 0 0
Stand clearcutting 1,861 860 8.9 7.8 146 7
Strip clearcutting 13 <0.1 <0.1 0 0
Thinning for hazardous fuels reduction
9 0 <0.1 <0.1 0 0
Transition Harvest 0 2,008 6.6 0 0 0
Non-structural erosion control* 207 0.7 0.8 0 0
Wildlife habitat seeding and planting
81 0 0.3 0.3 0 0
Total 62,518 5,556 NA NA 7,101 NA
a - activities are not mutually exclusive and several activities occur on the same site
Past and Anticipated Future Activities
Past activities identified above, as well as anticipated future activities on private land and those proposed
activities within the Harris Project are summarized in Table 30, with activities likely to adversely affect
spotted owl habitat shown in bold. Also because virtually all sites harvested also receive reforestation
(e.g. planting, weed and release) or fuels treatments, several activities occur on the same site and the acres
treated is much greater than the acres affected. Spotted owl habitat unaffected by past or future activities
is displayed below in Table 31.

Harris Vegetation Project Biological Assessment
85
Table 30: Past and Anticipated Future Action Area activities by treatment1
Action Area LSR/Critical Habitat
Activitya
NFS
acres
Private
Acres % of AA
% of NFS Land
Acres %
Animal Damage Control 687 0 2.2 2.8 3 <1
Area release and weeding 6,769 0 22.2 27.5 1,410 63.8
Aspen release 14 0 <0.1 <1 21 1.0
Burning of Piled Material 6,736 0 22.1 27.4 600 27.2
Campground Thin (60% CC) 14 0 <0.1 <1 14 0.6
Chemical site prep for planting 211 0 0.7 0.9 0 0
Chipping of Fuels 272 0 0.9 1.1 61 2.8
Commercial thinning* 7,138 445 25 29 141 6
Disease Control 2,505 0 8 10 247 11.1
Fill in planting w/o site preparation
1,888 0 6.2 7.7 0 0
Fill in planting with site preparation
7,666 0 25.2 31.2 876 39.6
Fuel reduction 211 0 0.7 0.9 162 7.3
Green tree retention harvest 103 0 0.3 0.4 0 0
Group Selection Cut 6 35 <0.1 <0.1 0 0
Improvement cut 37 0 0.1 0.2 0 0
Individual tree release and weeding
1,729 0 5.6 7.0 63 2.9
Individual Tree Selection* 1,006 0 3.3 4.1 0 0
Jackpot burning 238 0 0.8 1.0 0 0
Leave trees for wildlife* 21 0 <0.1 <0.1 0 0
LSR Thinning 65 0 0.2 0.3 62 2.8
Mechanical site preparation 7,770 0 25.5 31.6 934 42.2
Other site preparation 1,748 0 4.7 5.8 324 14.7
Overstory removal cutting 783 0 2.6 3.2 343 15.5
Patch clearcutting 1,460 0 4.8 5.9 347 15.7
Piling of Fuels, machine or hand
643 0 2.1 2.6 0 0
Precommercial thinning 7,423 0 24.4 30.2 1,358 61.4
Pruning* 1,607 0 5.3 6.5 1 <0.1
Salvage Cut 51 0 0.2 0.2 0 0
Sanitation salvage cut 2,725 1,384 13.5 11.1 247 11.2
Seed tree seed cut 45 0 0.2 0.2 0 0
Selection Harvest 0 22 0.1 0 0 0
Shelterwood Removal cut 0 404 1.3 0 0 0
Shelterwood Removal/commercial Thinning
0 649 2.1 0 0 0
Site preparation for planting 429 0 1.4 1.7 0 0
Soil productivity improvement* 376 0 1.2 1.5 0 0
Stand clearcutting 1,861 947 9.2 7.8 146 6.6
Strip clearcutting 13 <0.1 <0.1 0 0
Thinning for hazardous fuels reduction
9 0 <0.1 <0.1 0 0
Transition Harvest 0 2,008 6.6 0 0 0
Underburning 660 0 2.2 2.7 0 0

Harris Vegetation Project Biological Assessment
86
Action Area LSR/Critical Habitat
Activitya
NFS
acres
Private
Acres % of AA
% of NFS Land
Acres %
Non-structural erosion control* 207 0.7 0.8 0 0
Wildlife habitat seeding and planting
81 0 0.3 0.3 0 0
Total 65,207 5,894 NA NA 7,346 NA
a - activities are not mutually exclusive and several activities occur on the same site *-includes standard treatment and treatment modified to maintain 60% canopy closure
In an effort to identify how much spotted owl habitat would be unaffected by any past or anticipated
future activity, a GIS analysis was completed across all ownerships within the action area. This analysis
overlaid all past and anticipated future (Harris Project and private) actions on existing (2010 baseline as
described in the BA) spotted owl habitat. The unaffected habitat displayed in Table 31 includes those
lands where no past or future treatment occurred during the analysis period (1965 to 2015). Twenty
fifteen was chosen as the end of the analysis period, as this is the time when all proposed activities are
likely to be completed. Information displayed in Table 31 shows the total amount and category (e.g.
nest/roost, forage etc) of spotted owl habitat that currently exists within the action area (2010), as well as
the amount of habitat that will have been unaffected by any past or proposed treatments during this
analysis period.
In addition to displaying the total existing habitat affected by any past and anticipated future treatment,
Table 31 also displays only that habitat that would have been affected by adverse activities (shown in
bold in Table 29 and Table 30) during the analysis period (1965-2015), as well as only that Action Area
habitat that would have been affected since 1995 (1991 for the LSR). This latter category is displayed
because as described in the Harris BA, habitat degradation of partial harvest activities only lasts
approximately 15 years. As a result, this acreage is a better measure of the amount of suitable habitat that
would have no habitat degradation.
Table 31: NSO habitat unaffected by past and future activities (1965-2015)
Analysis
Area
Nest/Roost Foraging Dispersal Capable
Available*
Acres
Un-treated
Acres (%)
Available*
Acres
Un-treated
Acres (%)
Available*
Acres
Un-treated
Acres (%)
Available*
Acres
Un-treated
Acres (%)
All Treatments
Action Area 1,149 733 (64) 7,008 2,999 (43) 6,259 2,163 (35) 14,396 3,708 (26)
LSR/CH 392 249 (63) 949 473 (50) 339 152(45) 530 87 (16)
Treatments with Adverse Effects (timber harvest and underburning)
Action Area 1,149 749 (65) 7,008 3445 (49) 6,259 3042 (49) 14,396 4,809 (33)
LSR/CH 392 249 (64) 949 494 (52) 339 159 (47) 530 97 (18)
Treatments with no adverse effects since 1995** (e.g. habitat with no degradation)
Action Area 1,149 1,030 (90) 7008 4,027 (57) 6,259 3,269 (52) 14,396 7,381 (51)
LSR/CH 392 389 (99) 949 723 (76) 339 171 (50) 530 450 (85)
*-based on 2010 baseline conditions described in the Harris Biological Assessment **- acreage displayed for the LSR shows areas not affected by adverse impacts since 1991.
Because most of the nest/roost habitat occurs in and around Harris Mountain, much of nest/roost habitat
currently available has not been affected by past actions and approximately 64 percent of the available
nest/roost habitat within the action area will be unaffected by any past or anticipated future actions. Also
because there has been little harvest within nest/roost in the last 15-19 years, habitat affected in the past

Harris Vegetation Project Biological Assessment
87
would be largely restored and approximately 90 and 99 percent of the existing Action Area and LSR/CH
nest/roost habitat respectively would be intact with no habitat degradation.
While a larger amount of foraging habitat has been affected, particularly on private land, 43 and 50
percent of existing Action Area and LSR/CH foraging habitat respectively has been unaffected by any
past or proposed actions. If only treatments with adverse effects are considered, unaffected habitat
increases to 49 and 52 percent of the available foraging habitat within the Action Area and LSR/CH
respectively, whereas 57 percent of the Action Area foraging habitat and 79 percent of the LSR/CH
foraging habitat would be relatively intact with little or no habitat degradation.
Because most of the private lands have had some level of harvest and considering that many of the
capable and dispersal lands would have received some reforestation treatment (e.g. release and weeding,
pre-commercial thinning), approximately 65 percent and 75 percent of the dispersal and capable habitat
within the action area has been affected by some treatment, although approximately 50 percent of each is
intact with little or no habitat degradation.
In summary, while all spotted owl habitat categories have been affected by Action Area activities, adverse
activities, particularly on NFS lands have been reduced in the last fifteen years and currently over 90
percent of the Action Area and LSR nest/roost habitat is intact and would be expected to provide fully
functioning spotted owl habitat. Although a larger amount of foraging and dispersal habitat has been
affected, 57 and 76 percent of the existing Action Area and LSR/CH foraging habitat and 51 and 85
percent of the Action Area and LSR/CH dispersal habitat is intact with no residual adverse impacts. This
information, in combination with the analysis provided in the Harris BA was used to assess potential
impacts to the northern spotted owl from the Harris Project.
References Skinner et al, in Fire in Californias Ecosystems 2006, edited by Neil G. Sugihara, Jan W. van
Wagtendonk, Kevin E. Shaffer, Jo Ann Fites-Kaufman and Andrea E. Thode
Glenn et al. 2010; available online at http://dx.doi.org/10.1016/j.biocon.2010.06.021.
Skinner, Carl N. 1997. Toward an understanding of fire history information. Proceedings of the Sixth
Biennial Watershed Management Conference. S Sommarstrom, editor. Water Resources Center
Report No 92. University of California Davis. 9 pp.
USDA FS. 1999. Shasta-Trinity NF Forest Wide LSR Assessment. Redding, CA.
USDA FS. 2004. Porcupine Watershed Analysis. Shasta-Trinity National Forest. Redding CA. 141 pp.
USDA FS 2010a. Harris Vegetation Management Project. Fuels Report. 16 pp.
Weatherspoon, C. Phillip. 1996. Fire-silviculture relationships in Sierra forests. In: Sierra Nevada
Ecosystem Project: final report to Congress. Vol. II Assessments and Scientific Basis for
Management options. Water Resources Center Report No 37. Davis: Centers for Water and
Wildland Resources, University of California: 1167-1176


![[Vegetation and Remote Sensing] Vegetation](https://img.dokumen.tips/doc/110x75/577cdfd71a28ab9e78b21a32/vegetation-and-remote-sensing-vegetation.jpg)