Embed Size (px)
Citation preview

1
Water reliability, irrigation adoption, and land use changes in the presence of
biofuel production
By
Farzad Taheripour, Thomas W. Hertel, and Jing Liu
Authors’ Affiliation
Farzad Taheripour is Research Assistant Professor, Thomas W. Hertel is Distinguished
Professor, and Jing Liu is Ph.D. student in the Department of Agricultural Economics at Purdue
University.
Corresponding Author
Farzad Taheripour
Department of Agricultural Economics
Purdue University
403 West State St.
West Lafayette, IN 47907-2056
765-494-4612
Fax 765-494-9176
E-mail: [email protected]
Selected Paper prepared for presentation at the Agricultural & Applied Economics Association’s
2013 AAEA & CAES Joint Annual Meeting, Washington, DC, August 4-6, 2013.
Copyright 2013 by Farzad Taheripour, Thomas W. Hertel, and Jing Liu. Readers may make
verbatim copies of this document for non-commercial purposes by any means, provided that this
copyright notice appears on all such copies.

2
Water reliability, irrigation adoption, and land use changes in the presence of
biofuel production
Farzad Taheripour, Thomas W. Hertel, and Ling Liu
1. Introduction
The role of irrigation in agriculture is expected to gain greater promise over the coming
decades. This will be fueled by increasing global demand for food and biofuels as well as
irrigations-based adoption to higher temperatures and uncertain rainfall. The economic
incentives to expand irrigation, biophysical factors on water availability for irrigation in some
regions, and future changes in climate condition will force significant adjustment in current
irrigation pattern and mix of crops produced across the world. These changes which affect the
global distribution of crop production will eventually alter trade of these commodities which in
turn will affect international trade and the future global economy.
For the first time in the history of economic modeling, this paper introduces water
resources as an explicit input into a global general equilibrium modeling framework at a river
basin level to examine economic and land use consequences of changes in crop yields due to
climate change in the presence of water constraints and biofuel production. The current paper
addresses important issues related to water resources and their interaction with agricultural
activates, climate changes, choices between rainfed, and irrigation practices at a global scale.
This paper first reviews the literature in three different yet related areas of economic
modeling, climate change and food production, and water availability for crop production. Then
it introduces the implemented modeling approach and the experiments which are designed to
assess the consequences of changes in climate conditions and water availability for irrigation in

3
the presence of biofuel production. Finally, it presents the results on three important subjects of
changes in crop production, crop trade balances, and land use implications at a global scale. The
paper indicates that: 1) Future changes in the climate conditions could increase crop outputs at
the global scale and improve profitability of irrigated crops. 2) Changes in water supply have the
potential to reverse some positive impacts of climate change and limit crop outputs in China,
India, South and South East Asia, and Middle East and North Africa; 3) Finally, biofuel
production alters the mix of crops produced in favor of corn and oilseeds across the world,
reallocating distribution of water among irrigated crops, and increasing incentives to adopt
irrigation.
2. Literature Review and Background
Numerous studies have examined the consequences of global warming for food security
at regional, national, and international levels (few examples are: Parry et al. (2007); Lobell et al.
(2007); Nelson et al. (2009); Nelson et al. (2010), Lobell et al. (2011); and Lobell and Gourdji
(2012)). A group of these studies estimated the impacts of changes in temperature, precipitation,
and CO2 concentration on crop yields by region and then projected supplies of and demands for
food items under alternative assumptions on: technological progress in crop production; the
expected changes in climate variables in future decades; and expansion in income and population
in future (for example see Lobell et al. (2007)). In an alternative approach several studies have
used a combination of biophysical and economic models to examine food security. In this
approach impacts of changes in climate variables on crop yields are obtained from biophysical
models and then the results are introduced into either partial or general equilibrium economic
models which represent agricultural activities and some macro aspects of the global economy at
regional levels and capture changes in consumer’s demands for food items due to income and

4
population growth (for example see Nelson et al. (2010)). These studies provide valuable
economic and biophysical analyses, demonstrating how changes in climate variables and CO2
concentration in atmosphere affect food security across the world, determine the gap between
supply and demand for food under alternative climate scenarios, and discuss policy options
which can be used to mitigate adverse impacts of climate change. However, they do not provide
a clear picture on interactions between climate variables and available water resources at the
global scale in an economic environment with limited land, labor, and capital resources.
Today there are many partial and general equilibrium models which are designed and/or
modified to assess the impacts of changes in climate factors on economic variables and vise
versa. These models are typically capable of examining the impacts of climate variables on
agricultural and non-agricultural activities, asses environmental consequences of national air
pollution mitigation policies, study land use implications of biofuel production and polices, trace
the economic and environmental consequences of international agreements on trade and GHG
emissions reduction policies, and to accomplish many other tasks and goals. However, in general
the existing global economic models, except for a few cases1, do not bring water as an explicit
input into their analytical frameworks.
Water is an important factor of production in many industries and particularly in
agriculture. Additionally, water is vital in maintaining human life. While the need for water for
agricultural, industry, power generation, and municipal uses are growing rapidly worldwide,
water resources are shrinking in some regions due to climate change. Furthermore, depletion of
underground water reserves and lack of investment in expanding water resources limit
1 Some partial equilibrium multiregional models (e.g. IMPACT model (Rosegrant et al. (2002) and Rosegrant et al.
(2010)) have introduced demand for and supply of water into their modeling framework. Some national general
equilibrium economic models have introduced water into their modeling framework as well (e.g. Jonas et al. 2011).

5
sustainable supply of water in several river basins across the world. A few studies have
investigated future challenges regarding water resources and examined the expected regional
gaps between the demand for and supply of water based on biophysical data with limited
economic analysis and insights (examples are: Rosegrant et al. (2010) and Addams et al. (2009)).
Introducing water resources into a multi-regional economic model which represents the
global economy is a challenging task. To accomplish this task, an immense amount of
information is needed to quantify demands for water in its alternative uses and determine
supplies of surface and groundwater water resources at the global scale. Collecting reliable data
on regional demands and supplies of water is not an easy task. Furthermore, since water is not a
tradable commodity in the market place, in almost all regions across the world, it is difficult to
determine the monetary value of water as a commodity and introduce it into an economic model.
In this paper for the first time in the history of economic modeling activities, we
introduce water as an explicit input into the production functions of irrigated crop industries of a
multiregional general equilibrium model which traces production, consumption, and trade of a
wide range of economic activities at a global scale. The goal is to assess the economic and
environmental impacts of changes in climate conditions and available water for irrigation in the
presence of biofuel production.
3. Method
Global warming and GHG emissions affect agricultural activities in many parts of the
world. However, the impacts of these factors vary across regions, crops, management practices,
and nature of agricultural activates (Lobell et al. 2011). On the other hand, water resources are
subject to changes in the future due to economic and biophysical factors. The combination of
these two factors will alter the global supply of agricultural commodities and its geographical
6
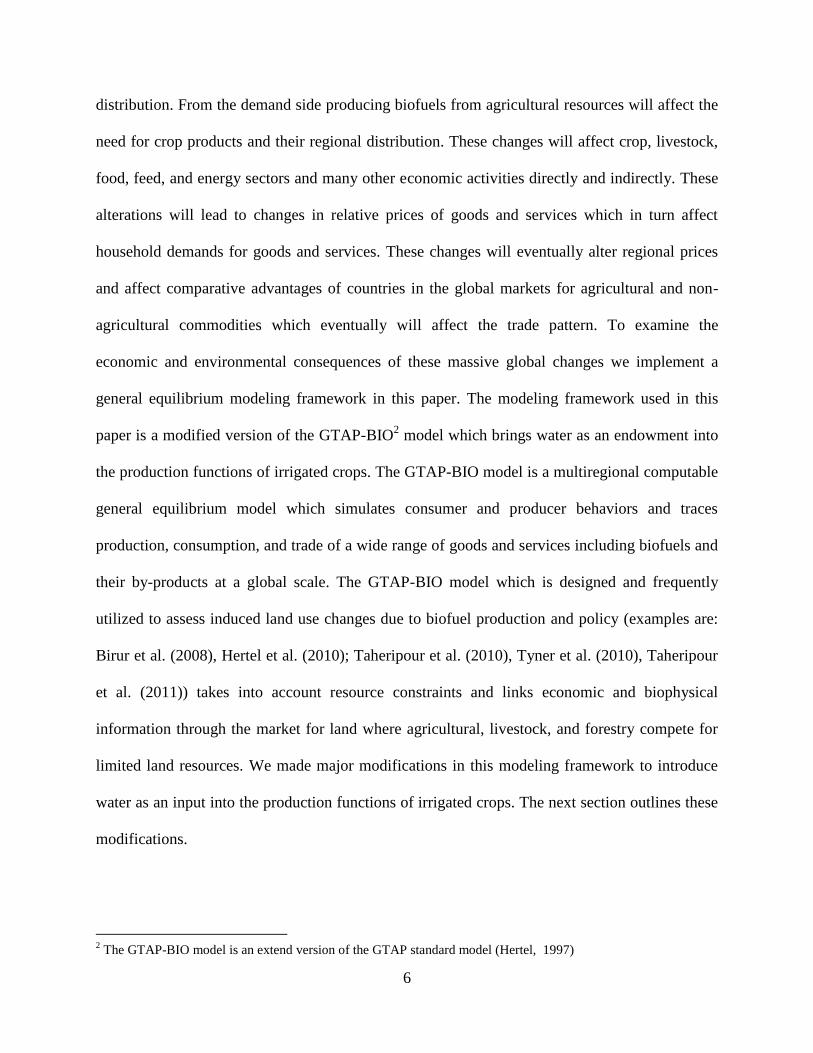
distribution. From the demand side producing biofuels from agricultural resources will affect the
need for crop products and their regional distribution. These changes will affect crop, livestock,
food, feed, and energy sectors and many other economic activities directly and indirectly. These
alterations will lead to changes in relative prices of goods and services which in turn affect
household demands for goods and services. These changes will eventually alter regional prices
and affect comparative advantages of countries in the global markets for agricultural and non-
agricultural commodities which eventually will affect the trade pattern. To examine the
economic and environmental consequences of these massive global changes we implement a
general equilibrium modeling framework in this paper. The modeling framework used in this
paper is a modified version of the GTAP-BIO2 model which brings water as an endowment into
the production functions of irrigated crops. The GTAP-BIO model is a multiregional computable
general equilibrium model which simulates consumer and producer behaviors and traces
production, consumption, and trade of a wide range of goods and services including biofuels and
their by-products at a global scale. The GTAP-BIO model which is designed and frequently
utilized to assess induced land use changes due to biofuel production and policy (examples are:
Birur et al. (2008), Hertel et al. (2010); Taheripour et al. (2010), Tyner et al. (2010), Taheripour
et al. (2011)) takes into account resource constraints and links economic and biophysical
information through the market for land where agricultural, livestock, and forestry compete for
limited land resources. We made major modifications in this modeling framework to introduce
water as an input into the production functions of irrigated crops. The next section outlines these
modifications.
2 The GTAP-BIO model is an extend version of the GTAP standard model (Hertel, 1997)

7
Model
We begin with the modeling framework developed by Taheripour, Hertel, and Liu
(2013): henceforth THL). These authors considered water as an implicit input embedded in
irrigated cropland. Then they extended the crop industries of the GTAP-BIO model into rainfed
and irrigated categories and modified the GTAP-BIO model to handle crop production by
irrigation type. This approach can be effectively used to examine impacts of changes in
economic and biophysical factors which affect supply of cropland to the irrigated and rainfed
crop industries. However, since this method considers water as an implicit input embedded in
irrigated land, it has limited application in analyzing impacts of changes in water supply to
agricultural activities. In general, supply of water to agricultural activities can change over time
due changes in economic and biophysical factors. While investment in water resources can
increase the water supply to agriculture, expansion in water demand for non-agricultural uses
(such as increases in municipal and industrial uses) limits supply of water to irrigated agriculture.
Climate change also could affect available water for irrigation. To examine consequences of
changes in water supply for irrigated agriculture we introduce water as an explicit input in
irrigated crop production of the GTAP-BIO model.
As shown in Figure 1 the new model, henceforth called GTAP-BIO-W, traces both water
and land resources at a regional level by River Basin (RB) and Agro-Ecological Zone (AEZ) and
allows competition between rainfed and irrigated crop industries to compete in market for each
crop. In this model producers (including land using industries) compete for scarce resources such
as labor and capital at a national level. However, the competition for land and water occurs at a
RB-AEZ level. In each region there are several RBs (maximum 20 RBs) and each river basin
serves water among its AEZs (maximum 18 AEZs). In each RB-AEZ land using sectors

8
(including forestry, crop, and livestock) compete for land resources. Then irrigated and rainfed
agriculture compete for available cropland in each RB-AEZ. On the other hand, irrigated crop
producers compete for limited water resources for irrigation at the RB level. In this model, water
can move across AEZs of each river basin. Hence, the model traces competition for land among
crops, livestock, and forest industries at a RB-AEZ level in each region and assumes completion
for water occurs at a RB level within each region. The model assumes no water trade among RBs
and regions and takes supply of water for irrigation as an exogenous variable in each river basin.
Finally, as shown in Figure 2 the model assumes that water and land are compliment inputs at the
RB-AEZ level. The land supply component of this model follows the land supply structure
developed by THL at the RB-AEZ level.
Unlike the standard GTAP model which uses a one-to-one relationship between
industries and commodities, in the GTAP-BIO-W model some industries produce two
commodities (e.g. ethanol or vegetable oil industries) and each crop product is produced by two
industries (irrigated and rainfed). In the new model the irrigated and rainfed industries which
produce the same crop (e.g. wheat) receive the same price, irrigated and rainfed industries
operate at zero profit condition, and irrigated industries pay for water for irrigation. In this model
it is possible for irrigated production of any given crop to be completely eliminated if completion
for irrigation is sufficiently intense in a RB-AEZ. This is the case for rainfed production if
productivity goes down significantly due to external shocks such as climate change.
In the new model the market clearing condition for land operates at RB-AEZ level by
industry. This means than the price of land (and hence productivity of land) varies across RB-
AEZs and industries. However, the marker clearing condition for water operates at the RB level
in each region and hence the price of water varies only among RBs in each region and within

9
each RB producers who irrigate crops pay the same price for water. Several major changes are
made in the GTAP code to handle these modifications.
Data
THL has used the SAGE data-base documented in Monfreda et al. (2008) and the data
base developed by Portmann et al. (2010) to incorporate crop industries by irrigation type into
the GTAP-BIO model. The data base developed by THL represents the global land cover,
harvested areas and crops produced by region at the AEZ level. We reconstruct these data items
at the RB-AEZ level. In addition, the data base developed by Siebert and Döll (2010) is utilized
to introduce water used for irrigation by region and crop at the RB-AEZ level into our
biophysical data base. THL has distinguished between irrigated and rainfed cropland rents in
each region by crop and AEZ. In this paper we assigned the difference between the irrigated and
rainfed cropland rents in each RB-AEZ to the water used for irrigation in that RB-AEZ.
The new data base aggregates land cover, harvested areas, crop production, water used,
and payments to land and water into 20x18 matrixes by region, industry and irrigation type. In
each matrix rows represent river basins and columns represent AEZs. The maximum numbers of
river basins and AEZs in each region are about 20 and 18, respectively. In this paper, crops are
aggregated into six crop categories and each crop is divided into two subcategories of irrigated
and rainfed. In this work, the whole world is divided into 125 river basins and 19 geographical
regions. Some river basins serve more than two geographical regions. When a river basin serves
more than one region, we divided that river basin into independent segments. Hence there is no
water trade between the segments of a river basin which serves more than one region. Appendix
A lists these river basins.

10
Experiments
In this paper we develop three different experiments to examine and highlight only the economic
and land use consequences of changes in climate variables and water supply for irrigation in the
presence of biofuel production at a global scale. Hence in developing our experiments we
assume only these factors are changing and other factors which could alter the global economy
will remain unchanged. To isolate the impacts of climate change, water supply for irrigation, and
biofuels from other major drivers of the global economy we developed three sets of different
exogenous shocks for a two-decade time horizon, 2001-2021. The first shock measures impacts
of changes in temperature of CO2 concentration on crop yields. The second shock represents
changes in water supply for irrigation. The last shock considers expansion in the global biofuel
industry. These shocks and our experiments are defined below.
Experiment 1
This experiment isolates the joint impacts of changes in temperature, precipitation, and
CO2 concentration on crop yields from other economic and biophysical factors which may affect
crop yields and evaluates the consequences of changes in yields due to these factors for the
global agricultural markets, regional crop trade balances, and land use changes.
Numerous studies have examined impacts of changes in temperature, precipitation, and
CO2 concentration on crop yields by region (examples are: Parry et al. (2007); Lobell et al.
(2007); Nelson et al. (2009); Nelson et al. (2010), Lobell et al. (2011); and Lobell and Gourdji
(2012)). In general, these studies confirms that: higher levels of CO2 concentration contribute to
higher crop yields, particularly for C3 crops; global warming negatively affected crop
productivities in many regions across the world, particularly for rainfed crops; and changes in
precipitation do not significantly contribute to changes in crop yields. Unlike these general

11
agreements there are huge uncertainties about the magnitudes of these impacts. A common
approach has been used to estimate impacts of climate change and CO2 fertilization on crop
yields. In this approach, estimates for changes in these factors at a grid cell level along with
some assumptions on adoption strategies are introduced into biophysical models to determine
how they will affect productivities of crops by region. Since there is no common ground on the
future of climate change and there are major differences among biophysical models used in this
area, the estimates for impacts of climate change vary from on study to another one significantly
even for a particular crop in a certain region.
Unlike this common approach, some studies have estimated the impacts of changes in
temperature, precipitation, and CO2 on crop yields using econometric methods and historical
observations. For example, Lobell et al. (2011) estimated the impacts of these variables on corn,
wheat, rice and soybean yields by region from real observation for the time period of 1980 to
2008. In another attempt, Lobel and Gourdji (2013) have conjectured future impacts of climate
and CO2 trends on crop yields from their past trends. We will use the results of these two studies
to define a set of productivity shocks in crop products due to the expected future changes in
temperature and CO2 emissions. In determining these shocks we used the following assumptions:
i. Climate trends in 2001-2021 will be follow its trend in 1980-2008,
ii. Irrigated crops will not be affected by temperature and precipitation,
iii. Change in CO2 concentration will improve irrigated and rainfed crop yields by 1% per
decade except for coarse grains.

12
In addition to these assumptions, following Nelson et al. (2010 and 2011) it is assumed that
the climate trend impacts on non-soybean oilseeds are identical to the trend impacts on soybean
and for sugarcane and other crops are equal to the average impacts for soybean, wheat, and rice.
Experiment 2.
This experiment imposes two sets of shocks on the global economy. The first sock is
identical to the shock defined in the first experiment. The second shock captures the impacts of
changes in available water for irrigation. Hence the second experiment highlights the
consequences of changes in water supply for irrigation and climate change and their interactions
for the global economy.
In the future, supply of water for irrigation could vary due to changes in demand for
water in non-agricultural uses and/or due to changes in investment in water management
projects. Liu et al. (2013) have estimated changes in available water for irrigation by river basin
for 2001-2030. We relied on this work and defined a set of shocks which represent changes in
water supply by river basin for the time period of 2001-2021.
Experiment 3
In addition to the shocks defined in the second experiment, here we impose a set of
biofuel shocks on the global economy to evaluate consequences of producing biofuels in the
presences of changes in water supply for irrigation and climate change. To define the biofuel
shocks it is assumed that in 2021 the US, EU27, and Brazil will produce: 15 billion gallons of
ethanol and 1 billion gallons of biodiesel; 2 billion gallons of ethanol and 4 billion gallons of
biodiesel; and 6 billion gallons of sugarcane ethanol respectively.

13
4. Simulation Results
Crop Production
The anticipated changes in the climate conditions will affect the irrigated and rainfed
yields at different rates among crops and across regions around the world. In general the
simulation results obtained from the first experiment show that the changes in climate conditions
will increase the global output of irrigated crops by 4.2% (about 153.4 million metric tons (MT))
for a two-decade time period (i.e. 2001-2021), if we ignore other factors which may affect the
supply side of crop markets. A big portion of this gain will happen in China, Russia, regions
categorized under other parts of former Soviet Union, and Brazil. In response to the expansion in
irrigated crops, the global rainfed crop production will be decreased by 2.7% (about 138.7
million MT). The rainfed crop output will be decreased in several regions, mainly those which
gain in irrigated crops. Hence the global crop output is expected to increase by 14.7 million MT
during a two-decade time period due to changes in climate conditions. In general, these results
confirm that the changes in climate conditions enhance irrigation and penalize rainfed agriculture
at the global scale. The results obtained from the first simulation show than at the global scale
the changes in climate conditions negatively affect production of wheat and coarse grains. On the
other hand this factor improves production of rice, oilseeds, sugar crops and other crops.
Several regions such as EU27, Brazil, Russia and regions classified under other parts of
former Soviet Union, and Oceania will lose a portion of their crop products while some other
regions in particular, US, China, India, and countries located in East and South East of Asia will
gain from changes in temperature, precipitation, and CO2 concentration. Table 1.1 illustrates the
expected changes in irrigated and rainfed crops due to changes in climate conditions by regions.

14
Adding the impacts of changes in water supply for irrigation to the changes in climate
condition significantly affects the simulation results of the first experiment, as shown in Table
1.2. The important changes are:
1) The changes in water supply wash out the positive impacts of the changes in climate
conditions on the global crop output. In experiment 2 the global crop output goes up only
by only 2.9 million MT which is significantly lower than the corresponding figure
obtained from the first experiment (i.e. 14.7 million MT).
2) Changes in water supply wash out the positive impacts of changes in climate conditions
in several regions including China, India, East and South East Asia, Middle East and
North Africa. These regions are expected to lose a portion of their available water for
irrigation in future decades.
3) Changes in water supply in combination with climate impacts on yields will improve the
agricultural outputs of several regions including but not restricted to US, EU, and Brazil.
These regions will not face major reduction in water resources for irrigation in general.
4) Changes in water supply wash out the positive impact of changes in climate conditions on
the global output of rice. Alterations in climate condition increase global rice production
by about 4.1million MT. This effect becomes slightly negative in the second experiment
when both water and climate changes were included. However, rice production shifted
from irrigated to rainfed.
5) Changes in climate condition increase irrigated wheat (by 25.4 million MT) and reduce
rainfed wheat (by 27 million MT) in the first experiment. In the second experiment, when
we include both the reduction in water supply and changes in climate conditions, the

15
production of irrigated wheat only goes up by 16.3 million MT, and the production of
rainfed wheat goes down 20.6 million MT. This means that the changes in water supply
exacerbate the negative impacts of changes in climate condition on wheat production.
The negative impact of the joint imposed shocks on the global production of wheat (-4.3
million MT) is larger than the impact of the first set of shocks alone (-1.6 million MT).
6) In the absence of changes in water supply, the changes in climate conditions alter the
global outputs of irrigated and rainfed coarse grains by 36.1 million MT and -38.5 million
MT, respectively. Adding the changes in water supply slightly alter these figures to 28
million MT and 31.6 million MT.
7) The expected changes in water supply worsen the positive impacts of the changes in
climate conditions on the irrigated oilseeds (from -1.2 million MT in the first experiment
to -1.3 MT in the second experiment) and elevate the impacts on the rainfed oilseeds
(from 1.6 million MT in the first experiment to 5.2 MT in the second experiment).
8) The changes in climate conditions increase the global output of sugar crops by 3.7
million MT in the first experiment. Adding the changes in water supply reduces the
global output of this crop category by 1.5 million MT.
9) Finally the expected changes in water supply significantly deflate the impacts of the
changes in climate conditions on the outputs of other crops.
We now examine the impact of biofuel production on the crop outputs in the presence of
changes in water supply and climate conditions in the third experiment. Biofuel production
extends croplands and diverts agricultural resources toward the feedstock crops needed for
biofuel production. As a result, outputs of coarse grains, oilseeds and sugar crops go up

16
significantly and outputs of rice, wheat, and other crops go down as shown in Table 3. In this
process the following phenomena can be observed:
1) Expansion in water supply in some regions, such as USA, EU27, Brazil and some
other regions expands irrigated crops.
2) Reduction in water supply in some regions such as China, India, and several other
regions transfers the available water to the less water intensive crops and more
productive AEZs in each river basin.
3) These changes plus yield improvements due to changes in climate conditions lead to
expansion in irrigated crop outputs even in the areas which will be faced with
reduction in water for irrigation.
4) Biofuel production in the USA, EU27 and Brazil alters the mix of crops produced in
these regions and all across the world in favor of corn, oilseeds, and sugarcane.
Finally, the results obtained from experiments 1, 2, and 3 confirm that biofuel production
increases the share of irrigation in crop production at the global scale. This confirms the positive
impacts of biofuel production on irrigation adoption. Biofuels increase crop prices significantly
and that induces incentives to invest in irrigated crops more than rainfed crops.
Trade impacts
The simulation results obtained from the first experiment indicate that changes in the
climate condition worsen the crop trade balances of EU27, Brazil, Russia and regions classified
under other parts of Former Soviet Union On the other hand the crop trade balances of several
regions including USA, China, India, East and South East Asia, and Middle east will be
improved due to changes in climate condition. Table 2.1 represent changes in crop trade balances

17
by region and crop obtained from the first experiment. This table indicates that changes in
climate conditions have minor impacts on the trade of sugar crops. In addition, this table
demonstrates that: 1) the US will gain on wheat, coarse grains, and other crops and lose on rice
and oilseeds; 2) EU27 will lose on almost all crop categories, except for oilseeds; 3) Brazil will
lose on almost all crop categories, except rice; 4) China, India, and East and South East Asia will
gain on almost all crops; and 5) Russia will lose on all crop categories and Sub Saharan Africa
will not observe important changes.
Including the impacts of changes in water supply in the second experiment worsens the
crop trade balance of China, India, East and South East of Asia, and Middle East and North
Africa and improves the trade balances of several regions including US, EU27 and several of
other regions. Finally, allocating a portion of crop outputs to biofuel production worsens the crop
trade balances of USA and EU27 (major biofuel producers) and improves the balances of many
other regions. This is because USA and EU27 reduce their net crop exports and other regions
reduce their net crop imports due to higher crop products.
Land Use Impacts
The simulation results obtained from the first experiment confirms that changes in
climate conditions have major land use consequences, as shown in table 3.1. The global irrigated
and rainfed cropland areas will change by about 21.7 million hectares and -25.5 million hectares
during a two-decade time period due to changes in climate conditions. This shows that the
changes in climate condition will increase profitability of irrigated crops and reduce profitability
of their rainfed counter parts. Due to the changes in the irrigated and rainfed cropland, the global
cropland area will go down by 3.5 million hectares. This is because in several regions across the
world the crop yields will be improved due to the changes in climate conditions. The reduction in

18
cropland will occur almost across the world except for Russia. As shown in table 3.1 changes in
the climate conditions increase/decrease irrigated/rainfed areas everywhere.
Including the impacts of changes in water supply reduces the expansion in irrigated areas
in the second experiment to 12.4 million hectares due to the shortage in water supply for
irrigation in several regions such as China, India, and South and South East Asia. In the second
case the reduction in the global rainfed area is limited to 10.8 million hectares and the global
cropland goes up only by 1.6 million hectares. This means than unlike the climate factors which
positively affect crop yields and hence reduce the demand for cropland, the limits in water for
irrigation increase the need for cropland.
Finally, the simulation results obtained from the third experiment indicate that the area of
global cropland goes up by about 15.5 million hectares in response to the changes in available
water for irrigation, climate change, and biofuel production. Compared to the second case we can
conclude that about 13.9 million hectares of this expansion is due to the biofuel production.
Compared to the second case where rainfed cropland goes down and irrigated cropland goes up,
in the third case both irrigated and rainfed land go up to satisfy the demand for biofuel feedstock.
5. Conclusion
This paper first reviews the literature in three different yet related areas of economic
modeling, climate change and food production, and water availability for crop production. Then
it introduces the implemented modeling approach and the experiments which are designed to
assess the consequences of changes in climate conditions and water availability for irrigation in
the presence of biofuel production. Finally, it presents the results on three important subjects of
changes in crop production, crop trade balances, and land use implications at a global scale. The
paper indicates that: 1) Future changes in the climate conditions could increase crop outputs at

19
the global scale and improve profitability of irrigated crops. 2) Changes in water supply have the
potential to reverse some positive impacts of climate change and limit crop outputs in China,
India, South and South East Asia, and Middle East and North Africa; 3) Finally, biofuel
production alters the mix of crops produced in favor of corn and oilseeds across the world,
reallocating distribution of water among irrigated crops, and increasing incentives to adopt
irrigation. Biofuels increase crop prices significantly and that induces incentives to invest in
irrigated crops more than rainfed crops.

20
References
- Addams L, G. Boccaletti, M. Kerlin, M. Stuchtey. 2009. Charting our water future: economic
frameworks to inform decision-making. McKinsey & Company, New York, USA.
- Birur D., T. Hertel, and W. Tyner. 2008. “Impact of biofuel production on world agricultural
markets: A computable general equilibrium analysis.” GTAP Working Paper 53. Center for
global trade analysis, Purdue University, West Lafayette, IN, USA.
- Hertel TW .1997. Global trade analysis, modeling and applications.Cambridge University
Press, Cambridge, USA.
- Hertel T., A. Golub, A Jones, M. O’Hare, R. Pelvin, D. Kammen (2010) Effects of U.S. maize
ethanol on global land use and greenhouse gas emissions: estimating market-mediated
responses. BioScience 60(3):223-231.
- Jonas L., K. Siddig, D. Flaig and H. Grethe. 2011. “A general equilibrium approach to model
water scarcity in Israel.” Paper presented at the 15th
Annual Conference on Global Economic
Analysis, Venice, Italy, June 16-18, 2011.
- Lobell D., M. Burke, C. Tebaldi, M. Mastrandrea, W. Falcon, and R. Naylor. 2007.
“Prioritizing Climate Change Adaptation Needs for Food Security in 2030.” Science, 319: 607-
610.
- Lobell D., W., Schlenker, and J. Costa-Roberts. 2011. “Climate Trends and Global Crop
Production since 1980,” Science, 333: 616-620.
- Lobell D. and S. Gourdji. 2012. “The Influence of Climate Change on Global Crop
Productivity.” Plant Physiology, 160: 1686–1697.
21
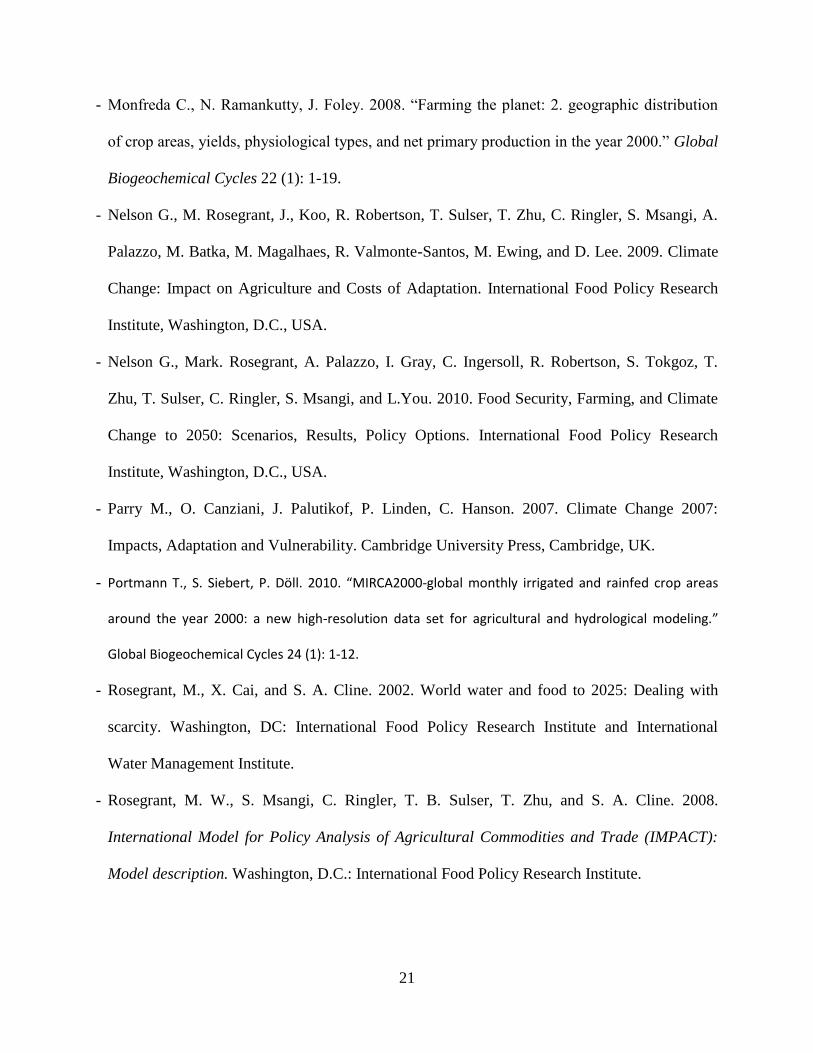
- Monfreda C., N. Ramankutty, J. Foley. 2008. “Farming the planet: 2. geographic distribution
of crop areas, yields, physiological types, and net primary production in the year 2000.” Global
Biogeochemical Cycles 22 (1): 1-19.
- Nelson G., M. Rosegrant, J., Koo, R. Robertson, T. Sulser, T. Zhu, C. Ringler, S. Msangi, A.
Palazzo, M. Batka, M. Magalhaes, R. Valmonte-Santos, M. Ewing, and D. Lee. 2009. Climate
Change: Impact on Agriculture and Costs of Adaptation. International Food Policy Research
Institute, Washington, D.C., USA.
- Nelson G., Mark. Rosegrant, A. Palazzo, I. Gray, C. Ingersoll, R. Robertson, S. Tokgoz, T.
Zhu, T. Sulser, C. Ringler, S. Msangi, and L.You. 2010. Food Security, Farming, and Climate
Change to 2050: Scenarios, Results, Policy Options. International Food Policy Research
Institute, Washington, D.C., USA.
- Parry M., O. Canziani, J. Palutikof, P. Linden, C. Hanson. 2007. Climate Change 2007:
Impacts, Adaptation and Vulnerability. Cambridge University Press, Cambridge, UK.
- Portmann T., S. Siebert, P. Döll. 2010. “MIRCA2000-global monthly irrigated and rainfed crop areas
around the year 2000: a new high-resolution data set for agricultural and hydrological modeling.”
Global Biogeochemical Cycles 24 (1): 1-12.
- Rosegrant, M., X. Cai, and S. A. Cline. 2002. World water and food to 2025: Dealing with
scarcity. Washington, DC: International Food Policy Research Institute and International
Water Management Institute.
- Rosegrant, M. W., S. Msangi, C. Ringler, T. B. Sulser, T. Zhu, and S. A. Cline. 2008.
International Model for Policy Analysis of Agricultural Commodities and Trade (IMPACT):
Model description. Washington, D.C.: International Food Policy Research Institute.

22
- Siebert S., and P. Döll. 2010. "Quantifying blue and green virtual water contents in global crop
production as well as potential production losses without irrigation." Journal of Hydrology 384
(3): 198-217.
- Taheripour F., T. Hertel, W. Tyner, J. Bechman, and D. Birur. 2010. “Biofuels and their by-
products: global economic and environmental implications.” Biomass and Bioenergy 34(3):
278-289.
- Taheripour F., T. Hertel, W. Tyner. 2011. “Implications of biofuels mandates for the global
livestock industry: a computable general equilibrium analysis.” Agricultural Economics 42(3):
325-342.
- Taheripour F., T., Hertel, and J. Liu. 2012. “The Role of Irrigation in Determining the Global
Land Use Impacts of Biofuels”, Energy, Sustainability, and Society, 3(4): 1-18.
- Tyner W., F. Taheripour, Q. Zhuang, D. Birur, U. Baldos. 2010. “Land use changes and
consequent CO2 emissions due to U.S. corn ethanol production: a comprehensive analysis.”
Department of Agricultural Economics, Purdue University.

23
Managed/Accessible Land
Forest Crops Pasture
AEZ i+1 AEZ i
Pasture Crops Forest
Rainfed Irrigated Rainfed Irrigated
Crop Outputs Crop Outputs Crop Outputs
Competition for managed water
Crop Outputs Supply of crops including energy
crops from river basin j
River Basin 1 River Basin j Last River Basin
AEZ 1 Last AEZ
National competition for labor, capital, and other resources except for land and water
Supply of water to irrigated
crops
National Supply of Crops
Managed/Accessible Land
Figure 1. Modeling framework

24
Figure 2. Primary inputs used in crop industries
Primary Inputs in Crop Industries
Land-
Water
Skilled
Labor
Basin 1
Capital-
Energy
Land Water
Unskilled
Labor
Basin 2 Basin i Basin 20
AEZ 1 AEZ 18 AEZ 2 AEZ n

25
Table 1.1. Changes in crop production due to changes in temperature, participation, and CO2 concentration in a two-decade time
period (figures are in 1000 metric ton)
Production Paddy Rice Wheat Coarse Grains Oilseeds Sugar Crops Other Crops
Irrigated Rinfed Irrigated Rinfed Irrigated Rinfed Irrigated Rinfed Irrigated Rinfed Irrigated Rinfed
USA -2.4 -34.5 322.8 2484.0 3559.6 -3418.0 345.9 207.7 -107.0 142.2 2830.1 6280.7
EU27 -131.4 0.8 520.2 -2101.2 4224.9 -5227.4 -1473.0 1603.5 1566.1 -1780.1 -912.0 648.0
BRAZIL -411.6 437.7 5.4 -416.5 169.3 -1414.9 36.0 -1302.0 10063.6 -10545.0 169.6 -3086.2
China 1563.8 292.8 5382.0 -3622.4 17523.1 -15649.7 2132.0 -1891.4 867.3 -933.6 17627.3 -15974.5
India 1342.7 -660.7 1258.3 -684.1 13.9 119.2 69.8 172.2 1163.6 54.4 3738.2 -2572.1
E. & S. E. Asia 2241.4 -536.8 722.4 -299.0 261.8 -316.8 20.2 1354.0 656.8 189.2 1367.4 977.7
Russia & FSU -101.4 0.1 14166.0 -21373.0 8240.5 -10414.1 23.8 -247.3 4823.9 -2956.0 31913.5 -32565.3
M. E. & N. Afr. 77.6 -0.6 2005.8 -1065.7 653.1 -454.0 20.2 -0.7 182.3 -1.5 5005.3 -4139.8
S. S. Afr. 181.4 -104.7 142.2 -50.2 129.4 -80.8 11.5 202.7 289.3 -28.5 1243.8 -571.6
Others -28.3 72.4 874.9 63.3 1343.2 -1665.0 55.1 1551.9 875.3 -804.1 2579.2 -6566.8
Total 4731.8 -533.5 25400.1 -27064.9 36118.7 -38521.5 1241.5 1650.6 20381.2 -16662.9 65562.4 -57569.8

26
Table 1.2. Changes in crop production due to changes in available water for irrigation, temperature, participation, and CO2
concentration in a two-decade time period (figures are in 1000 metric ton)
Production Paddy Rice Wheat Coarse Grains Oilseeds Sugar Crops Other Crops
Irrigated Rinfed Irrigated Rinfed Irrigated Rinfed Irrigated Rinfed Irrigated Rinfed Irrigated Rinfed
USA 96.6 10.7 479.3 2965.0 3314.5 -3050.2 346.0 468.9 -168.2 201.4 3514.1 6421.6
EU27 40.5 1.3 525.5 -1509.7 4401.1 -5366.2 -1443.5 1719.7 1824.0 -2009.9 185.2 2068.7
BRAZIL -146.7 226.0 5.3 -410.5 151.5 -1342.2 54.6 -1183.3 8229.8 -9052.4 106.5 -2584.0
China -1929.8 1096.8 1992.0 -1666.5 12308.6 -11715.1 1094.0 -1429.0 -1987.0 1641.5 10392.4 -11282.6
India -1324.5 1105.8 210.3 -315.7 -737.0 778.0 -1159.1 1220.3 -573.7 294.3 -3198.1 3024.2
E. & S. E. Asia -1704.5 2130.5 -1955.2 71.9 -146.4 11.0 -155.5 2489.0 -2070.5 1801.9 -3167.2 3380.4
Russia & FSU -93.1 0.3 12939.9 -19953.9 7435.5 -9484.7 -48.5 -187.0 3462.6 -2246.8 29163.4 -29551.5
M. E. & N. Afr. 36.6 -0.2 1124.0 -462.6 226.7 -178.6 -55.1 58.5 -456.1 164.1 1844.8 -1716.1
S. S. Afr. -145.4 100.7 142.5 -18.5 -188.4 238.3 6.3 241.8 -909.5 194.0 755.6 1031.0
Others 96.1 50.5 886.0 687.4 1285.3 -1503.8 43.6 1833.8 841.7 -755.5 2714.1 -4364.9
Total -5074.2 4722.4 16349.5 -20613.2 28051.4 -31613.4 -1317.1 5232.9 8193.1 -9767.4 42310.8 -33573.2

27
Table 1.3. Changes in crop production due to changes in available water for irrigation, temperature, participation, and CO2
concentration in the presence of biofuel production in a two-decade time period (figures are in 1000 metric ton)
Production Paddy Rice Wheat Coarse Grains Oilseeds Sugar Crops Other Crops
Irrigated Rinfed Irrigated Rinfed Irrigated Rinfed Irrigated Rinfed Irrigated Rinfed Irrigated Rinfed
USA -1140.9 187.6 -1335.0 -772.1 27092.1 24566.8 1627.9 2833.0 -638.4 339.1 -10726.3 -21945.2
EU27 35.3 2.6 220.5 1362.0 2916.9 -8079.0 3031.1 6546.2 2808.1 -2750.4 -10454.5 -1589.0
BRAZIL -400.8 275.4 1.3 -486.5 30.2 -1774.9 45.2 2576.7 95531.2 8966.0 -1330.3 -1419.7
China -2465.0 1185.0 2911.2 -1596.7 12834.3 -10976.3 1859.9 -284.0 -2165.9 1688.5 11273.3 -10437.7
India -1666.3 1486.0 411.0 -233.7 -780.0 763.2 -908.9 1651.5 -1272.5 305.6 -3256.4 4677.0
E. & S. E. Asia -2625.0 2395.9 -1696.2 128.5 -146.7 36.3 119.4 18163.4 -2170.4 1578.9 -3237.6 4930.4
Russia & FSU -80.0 0.3 11371.5 -17427.9 6440.9 -7926.3 158.8 438.0 1908.2 -1445.0 27836.0 -26827.8
M. E. & N. Afr. -56.4 0.2 1305.9 -15.5 310.5 13.0 270.1 84.7 -1058.4 345.2 830.5 512.3
S. S. Afr. -443.8 166.6 240.5 84.2 -240.2 541.0 268.1 2372.3 -2428.4 693.6 1416.9 5736.1
Others 360.1 100.8 320.5 1684.8 592.4 198.5 723.1 7917.6 558.6 -584.5 -2049.7 2961.0
Total -8482.6 5800.3 13751.2 -17273.0 49050.2 -2637.9 7194.7 42299.5 91072.1 9137.0 10302.0 -43402.7

28
Table 2.1. Changes in crop trade balance due to changes temperature, participation, and CO2 concentration for a two-decade time
period (figures are in million US dollar)
Production Paddy
Rice Wheat
Coarse
Grains Oilseeds
Sugar
Crops Other Crops Total
USA -11.7 204.9 73.8 -46.7 0.1 500.3 720.7
EU27 -10.2 -97.5 -15.1 7.8 -0.3 -42.4 -157.7
BRAZIL 6.7 -51.2 -31.2 -188.6 0.0 -266.5 -530.8
China 2.4 26.3 10.7 98.7 0.1 91.4 229.7
India 13.5 51.4 1.7 15.6 0.3 98.8 181.2
E. & S. E. Asia 41.8 71.5 -23.3 68.2 0.4 341.5 500.1
Russia & FSU -19.6 -495.3 -36.9 -55.3 -0.4 -635.6 -1243.1
M. E. & N. Afr. 4.9 294.7 -2.7 14.1 0.2 140.9 452.1
S. S. Afr. -0.3 16.0 1.9 2.9 -0.2 -21.8 -1.5
Others -28.8 -17.1 23.0 78.8 0.1 -171.1 -115.2

29
Table 2.2. Changes in crop trade balance due to changes in water supply for irrigation, temperature, participation, and CO2
concentration for a two-decade time period (figures are in million US dollar)
Production Paddy
Rice Wheat
Coarse
Grains Oilseeds
Sugar
Crops Other Crops Total
USA 4.5 317.6 136.4 33.6 0.1 594.2 1086.5
EU27 16.2 -14.3 -8.9 -3.1 0.5 179.0 169.6
BRAZIL 11.6 -59.3 -22.2 -144.0 0.0 -218.1 -431.9
China -6.5 -1.3 -5.1 25.7 -1.1 -107.7 -96.0
India -8.3 3.3 2.1 -2.7 -0.9 -46.4 -52.9
E. & S. E. Asia -34.4 -101.4 -58.6 13.7 0.9 -61.8 -241.7
Russia & FSU -21.1 -479.5 -34.6 -51.7 -0.3 -618.8 -1205.9
M. E. & N. Afr. 5.6 177.8 -33.6 0.2 0.0 45.8 195.8
S. S. Afr. -0.2 11.7 2.3 7.7 0.3 137.7 159.4
Others 31.1 140.8 23.7 114.6 0.5 138.1 448.7

30
Table 2.3. Changes in crop trade balance due to changes in water supply for irrigation temperature, participation, and CO2
concentration in the presence of biofuel production for a two-decade time period (figures are in million US dollar)
Production Paddy
Rice Wheat
Coarse
Grains Oilseeds
Sugar
Crops Other Crops Total
USA -46.9 89.5 212.3 305.8 -0.8 -1922.0 -1362.0
EU27 -0.6 -399.7 -12.7 -2037.5 -0.6 -1555.7 -4006.8
BRAZIL -2.0 -92.5 37.7 825.4 -0.1 -468.5 300.0
China 0.4 34.1 93.4 65.7 -0.8 412.6 605.3
India 5.5 97.0 4.8 114.3 -0.7 143.1 364.0
E. & S. E. Asia -39.6 -136.6 -121.4 -141.3 2.0 630.2 193.4
Russia & FSU -20.5 -296.7 29.8 198.1 -0.1 -85.2 -174.6
M. E. & N. Afr. 9.7 289.2 -140.6 38.1 -0.4 355.9 552.0
S. S. Afr. -0.8 10.6 40.2 120.0 0.9 1107.5 1278.3
Others 92.5 429.9 -115.7 416.5 0.4 1338.5 2162.2

31
Table 3.1. Land cover changes due to changes in temperature, participation, and CO2 concentration
(figures are in 1000 hectare)
Region Forestry Cropland
Pasture Irrigated Rainfed Total
USA -26.3 308.1 -339.7 -31.6 57.9
EU27 -31.9 660.4 -649.8 10.6 21.3
BRAZIL 324.3 178.4 -776.0 -597.6 273.3
China 122.9 6549.8 -6905.9 -356.1 233.2
India 465.7 697.7 -1533.8 -836.1 370.4
E. & S. E. Asia 136.4 379.3 -628.9 -249.6 113.2
Russia & FSU -135.3 11276.5 -10911.6 364.8 -229.5
M. E. & N. Afr. 7.0 772.6 -1297.4 -524.8 517.8
S. S. Afr. 267.2 380.0 -1221.9 -841.9 574.6
Others 145.0 576.6 -973.2 -396.5 251.5
Total 1274.9 21779.4 -25238.2 -3458.8 2183.8

32
Table 3.2. Land cover changes due to changes in available water for irrigation, temperature, participation, and CO2 concentration
(figures are in 1000 hectare)
Region Forestry Cropland
Pasture Irrigated Rainfed Total
USA -89.2 355.0 -194.2 160.9 -71.6
EU27 -205.5 751.0 -448.3 302.7 -97.3
BRAZIL 247.2 258.1 -650.4 -392.2 145.0
China -16.4 5098.1 -5076.5 21.6 -5.2
India -27.4 -2944.3 2963.8 19.5 7.9
E. & S. E. Asia -91.6 -2250.3 2524.1 273.7 -182.2
Russia & FSU -128.6 10177.3 -9451.7 725.6 -596.9
M. E. & N. Afr. -2.8 206.7 -50.4 156.3 -153.5
S. S. Afr. -94.3 135.8 103.2 239.0 -144.7
Others 8.1 636.4 -508.7 127.7 -135.7
Total -400.5 12423.9 -10789.2 1634.7 -1234.2

33
Table 3.3. Land cover changes due to changes in available water for irrigation, temperature, participation, and CO2 concentration in
the presence of biofuel production (figures are in 1000 hectare)
Region Forestry Cropland
Pasture Irrigated Rainfed Total
USA -1028.2 2576.6 -532.6 2044.0 -1015.8
EU27 -1737.6 915.3 1631.5 2546.8 -809.2
BRAZIL -714.5 209.3 1216.1 1425.4 -710.9
China 188.5 5363.8 -5195.8 168.0 -356.5
India -392.3 -2810.1 3519.6 709.5 -317.2
E. & S. E. Asia -212.0 -2553.6 3081.0 527.4 -315.4
Russia & FSU 351.2 9030.8 -7694.2 1336.6 -1687.8
M. E. & N. Afr. -8.5 23.6 952.4 976.0 -967.6
S. S. Afr. -846.3 246.9 2892.2 3139.1 -2292.8
Others -323.1 127.0 2554.6 2681.6 -2358.5
Total -4722.8 13129.6 2424.9 15554.5 -10831.7

34
Appendix A
List of river basins

35
Table A1 Water used for irrigation by river basin in 2000 (Figures are in KM3)
River Basin Name River Basin Name River Basin Name
Amazon Iberia_West_Atla Philippines
Amudarja India_East_Coast Red_Winnipeg
Amur Indonesia_East Rhine
Arabian_Peninsul Indonesia_West Rhone
Arkansas Indus Rio_Colorado
Baltic Ireland Rio_Grande
Black_Sea Italy SE_Asia_Coast
Borneo Japan Sahara
Brahmaputra Kalahari Sahyada
Brahmari Krishna Salada_Tierra
Britain Lake_Balkhash San_Francisco
California Lake_Chad_Basin Scandinavia
Canada_Arctic_At Langcang_Jiang Seine
Carribean Limpopo Senegal
Cauvery Loire_Bordeaux Songhua
Central_African Lower_Mongolia South_African_Co
Central_America Luni South_Korea_Peni
Central_Australi Madagascar Southeast_Africa
Central_Canada_S Mahi_Tapti Southeast_US
Chang_Jiang Mekong Sri_Lanka
Chile_Coast Middle_Mexico Syrdarja
Chotanagpui Mississippi Thai_Myan_Malay
Colorado Missouri Tierra
Columbia Murray_Australia Tigris_Euphrates
Congo New_Zealand Toc
Cuba Carribean_C_A Niger US_Northeast
Danube Nile Upper_Mexico
Dnieper North_African_Co Upper_Mongolia
East_African_Coa North_Euro_Russi Ural
Easten_Ghats North_Korea_Peni Uruguay
Eastern_Australi North_S_Amer_Coast Volga
Eastern_Med Northeast_Brazil Volta
Elbe Northwest_Africa West_African_Coa
Ganges Northwest_S_Amer Western_Asia_Ira
Godavari Ob Western_Australi
Great_Basin Oder Western_Gulf_Mex
Great_Lakes Ohio Yenisey
Hail_He Orange Yili_He
Horn_of_Africa Orinoco Yucatan
Hual_He Papau_Oceania Zambezi
Huang_He Parana Zhu_Jiang
Iberia_East_Med Peru_Coastal