Embed Size (px)
Citation preview

Biofilms as Sources of Fecal Bacteria Contamination in theStormwater Drainage System in Singapore
by ARCH1VESMASSACHUSETTS I4STTE
Tsung Hwa Burkhart OF TECHNOLOGY
B.S. Civil Engineering JUL 0 8 2013University of Washington, 2012
LIBRARIES
Submitted to the Department of Civil and Environmental Engineeringin Partial Fulfillment of the Requirements of the Degree of
Master of Engineeringin Civil and Environmental Engineering
at the
MASSACHUSETTS INSTITUTE OF TECHNOLOGY
June 2013
0 2013 Massachusetts Institute of Technology.All rights reserved.
Signature of AuthorU Tsung Hwa Burkhart
Department of Civil and Environmental EngineeringMay 10, 2013
Certified ByPeter Shanahan
Senior Lecturer of Civil and Environmental EngineeringThesis Supervisor
Accepted By di N pf
Chair, Departmental Committee for Graduate Students


Biofilms as Sources of Fecal Bacteria Contamination in theStormwater Drainage System in Singapore
by
Tsung Hwa Burkhart
Submitted to the Department of Civil and Environmental Engineeringon May 10, 2013 in Partial Fulfillment of the
Requirements for the Degree of Master of Engineering inCivil and Environmental Engineering
ABSTRACT
A study was performed to examine a possible source of fecal bacteria contamination originatingfrom within the stormwater drainage system in Singapore. The extent of fecal bacteria presencein storm drain biofilms was evaluated as a pathway for fecal bacteria contamination. In theresearch, biofilms were evaluated as reservoirs for fecal indicator bacteria (FIB), FIBconcentrations were measured over time within biofilms and stormwater, and relationshipsbetween FIB in biofilms and FIB in stormwater were examined. The concentrations of threebacterial groups (total coliform, Escherichia coli, and enterococci) were used as indicators offecal bacteria contamination. In the Singaporean districts of Choa Chu Kang and Toa Payoh, fivelocations within the storm drains were monitored once per week each between January 8, 2013and January 22, 2013. Well-developed biofilms were observed and measured using concretecoupons in the storm drains at Choa Chu Kang Crescent, Verde View, Lorong 6 Toa Payoh, andtwo points at Lorong 8 Toa Payoh. An initial biofilm growth condition was observed forsecondary research at Nanyang Technological University.
The biofilms in the storm drains were observed to be reservoirs for FIB due to measuredconcentrations of each fecal indicator. The measured FIB concentrations fluctuated over time inthe biofilms and the overlying storm drainage waters due to natural processes within the biofilmsand the storm drain environments. Greater fluctuations in FIB concentrations in biofilms than instorm drainage waters indicate that the stormwater is more stable and has additional sources ofFIB contributing to the contamination. FIB detachment from biofilms is a potential pathway forfecal bacteria contamination of stormwater.
Thesis Supervisor: Peter ShanahanTitle: Senior Lecturer of Civil and Environmental Engineering
3

Acknowledgments
I want to thank Dr. Peter Shanahan for his encouragement throughout my time at theMassachusetts Institute of Technology. I appreciate him for motivating me to think critically andstrive for my best throughout this year. I am grateful to know someone who is so passionateabout the work of his students, yet patient enough to bring the best out of me.
I also want to thank Eveline Ekklesia from whom I learned numerous new things aboutfieldwork and laboratory work while at Nanyang Technological University and aroundSingapore. Her commitment and strong work ethic encouraged me to put all my effort in myproject.
Many thanks are extended to Syed Alwi Bin Sheikh Bin Hussein Alkaff, whose aid in fieldworkand data collection in Singapore was much appreciated.
Thanks are given to Janelle Thompson and Kyle Peet for advice and aid in laboratory work at theMassachusetts Institute of Technology, which gave me greater insight to my research.
Thank you to my colleagues of the Master of Engineering program, particularly Ndeye AwaDiagne, Margaret Hoff, and Halle Ritter for being so kind, friendly, and easy to work with.
Last but not least, I thank my family and friends for supporting me throughout my education. Iam endlessly grateful for their support.
5


Table of Contents
A bA str act ........................................................................................................................................... 3
A cknow ledgm ents........................................................................................................................... 5
List of Figures ................................................................................................................................. 9
List of Tables ................................................................................................................................ 11
I Introduction ............................................................................................................................ 131. 1 Background ...................................................................................................................... 13
1.1.1 Singapore W ater M anagem ent............................................................................... 131.1.2 Singapore W ater Quality Concerns ........................................................................ 15
1.2 Past W ork......................................................................................................................... 151.3 Purpose and Scope ...................................................................................................... 151.4 G oals and Objectives ................................................................................................... 16
2 Literature Review ................................................................................................................... 192.1 Water Quality Monitoring with Fecal Contamination Indicators ................................. 19
2.1.1 Total Coliform s...................................................................................................... 192.1.2 Fecal Coliform s (Escherichia coli)........................................................................ 192.1.3 Fecal Streptococci (Intestinal Enterococci)........................................................... 19
2.2 Drawbacks of and Alternatives to Indicator Bacteria.................................................. 202.3 Fecal Bacteria Presence in Biofilm s ............................................................................. 20
2.3.1 Sedim ents of A quatic Environm ents ...................................................................... 212.3.2 Biofilm s in W ater System s................................................................................... 23
2.4 Water Contamination of Fecal Bacteria from Environmental Sources............ 23
3 Experim ental M ethods, M aterials, and Procedures............................................................. 253.1 Field W ork: Collection of Field Data.......................................................................... 25
3.1.1 Sam pling Locations ............................................................................................... 253.1.2 W ater Sam pling ...................................................................................................... 253.1.3 Biofilm and Sedim ent Sam pling............................................................................. 26
3.2 Laboratory Procedures................................................................................................. 273.2.1 Bacteria A nalysis in W ater.................................................................................... 273.2.2 Bacteria A nalysis in Biofilm .................................................................................. 27
4 Results .................................................................................................................................... 294.1 V isual Exam ination of Biofilm s ................................................................................... 294.2 Fecal Indicator Bacteria in Biofilm s ............................................................................. 324.3 Fecal Indicator Bacteria in Storm D rainage W aters ........................................................ 374.4 Relationships Between Biofilms and Storm Drainage Waters .................. 404.5 Lim itations ....................................................................................................................... 42
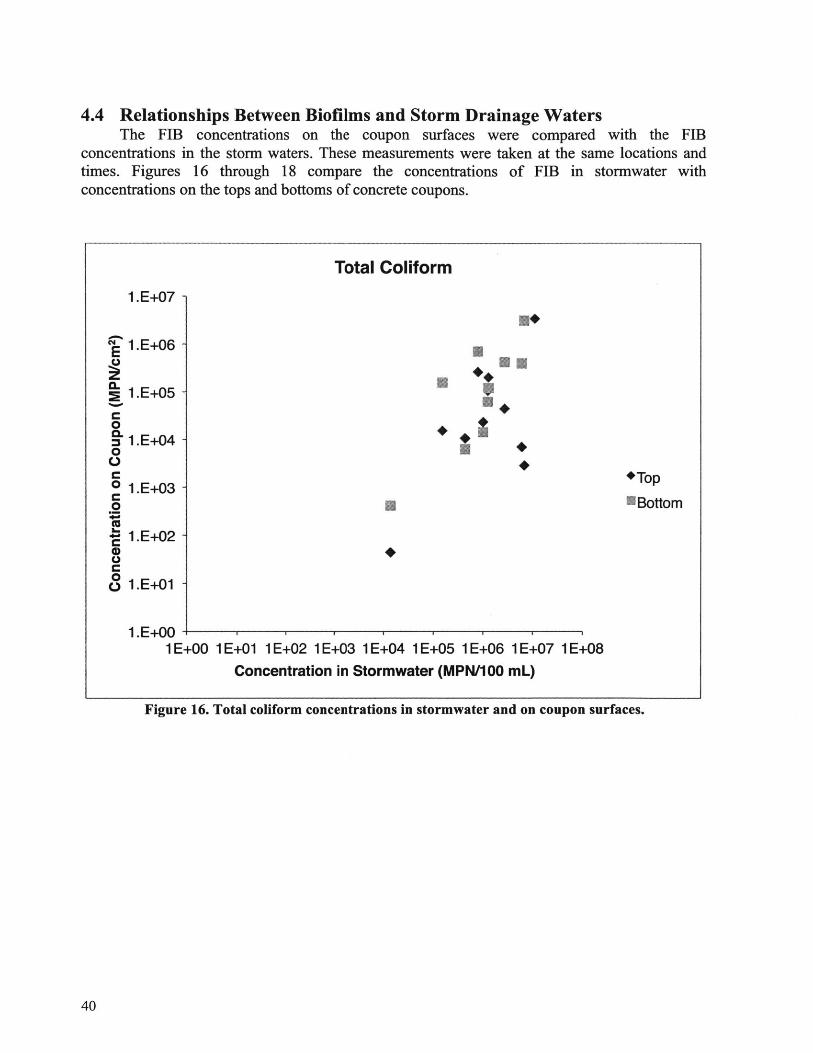
5 A nalysis and Interpretation.................................................................................................. 435.1 Biofilm Structure.............................................................................................................. 435.2 Fecal Bacteria Concentrations in Biofilms and Storm Drainage Waters........... 435.3 Biofilm D etachm ent to Storm Drainage W ater................................................................ 455.4 M odel of Biofilm in Storm w ater Drain......................................................................... 47
7

5.4.1 Storm w ater FIB M ass Balance Equation................................................................ 485.4.2 Biofilm FIB M ass Balance Equation...................................................................... 495.4.3 Param eter D esignation........................................................................................... 505.4.4 Solution...................................................................................................................... 51
6 Sum m ary, Conclusions, and Recom m endations .................................................................. 536.1 Sum m ary.......................................................................................................................... 536.2 Conclusions...................................................................................................................... 536.3 Recom m endations for Future W ork.............................................................................. 53
References..................................................................................................................................... 55
Appendix I M aps........................................................................................................................... 63
8

List of Figures
Figure 1. Biofilm growth and accumulated leaves around concrete coupon in a storm drainlocated in the Verde View neighborhood of Singapore on December 28, 2012(E kklesia 20 12)........................................................................................................... 16
Figure 2. The biofilm life cycle (Cunningham et al. 2010).................................................... 20
Figure 3. Map of Singapore districts (Property Market SG 2013)........................................ 25
Figure 4. A biofilm specimen collected in a storm drain at Lorong 8 Toa Payoh magnified400x ............................................................................................................................. 29
Figure 5. A biofilm algal cell from a storm drain at Lorong 8 Toa Payoh at 400xm agnification. ............................................................................................................. 29
Figure 6. A portion of a gram stained biofilm sample from a storm drain in Lorong 8 ToaPayoh viewed at 1000x in (a) and 400x in (b) and (c)............................................. 30
Figure 7. Bacteria cells fluorescing bright green in a biofilm sample from a storm drain inLorong 8 Toa Payoh at 400x (top) and 1 000x (bottom) magnification.................. 31
Figure 8. Chlorophyll-containing algal cells fluorescing red in a biofilm sample from astorm drain in Lorong 8 Toa Payoh, viewed at 1000x magnification. .................... 32
Figure 9. Concrete coupon C1 in the tributary at Lorong 8 Toa Payoh with a verticalconcrete coupon upstream to block debris............................................................. 34
Figure 10. Coupon C2, located downstream of C1 at Lorong 8 Toa Payoh, with a verticalcoupon upstream to block debris. ........................................................................... 35
Figure 11. The main drain at Lorong 8 Toa Payoh, where C1 and C2 are located.................. 35
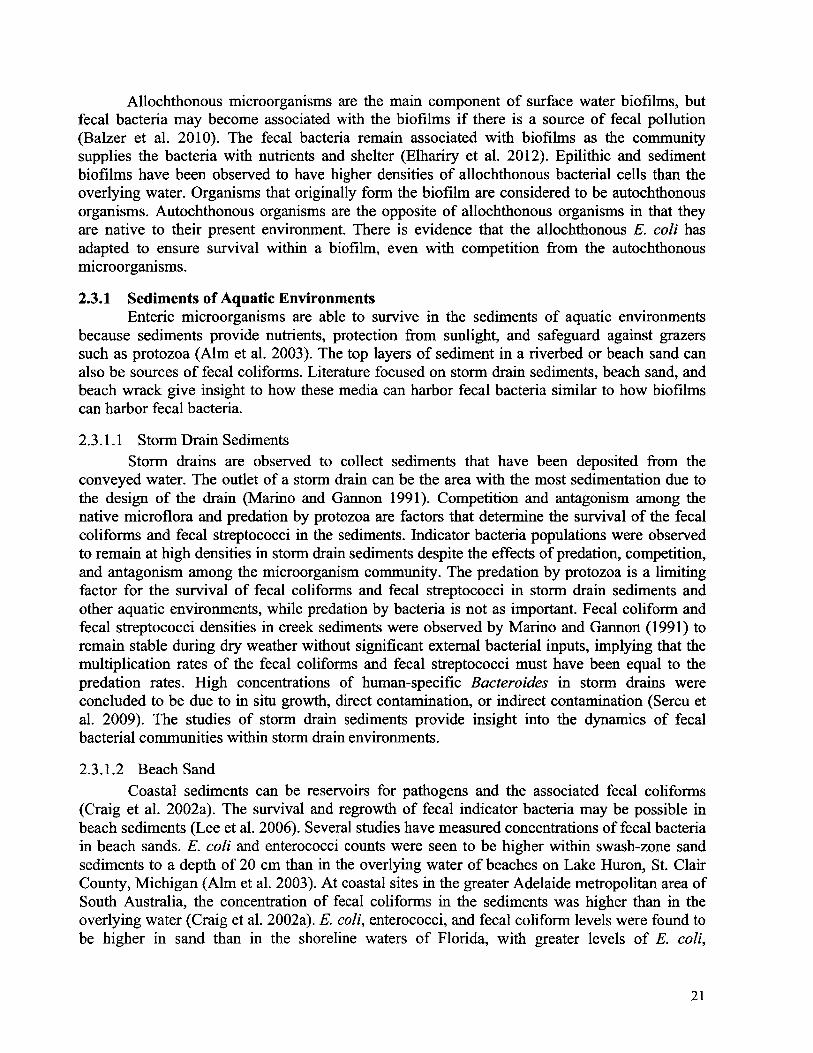
Figure 12. Fecal indicator bacteria concentrations over time on the top and bottom surfacesof the upstream coupon (C1) at Lorong 8 Toa Payoh............................................. 36
Figure 13. Fecal indicator bacteria concentrations over time on the top and bottom surfacesof the downstream coupon (C2) at Lorong 8 Toa Payoh......................................... 37
Figure 14. Fecal indicator bacteria concentrations over time in the stormwater immediatelydownstream of the upstream coupon (C1) at Lorong 8 Toa Payoh........................ 39
Figure 15. Fecal indicator bacteria concentrations over time in the stormwater immediatelydownstream of the downstream coupon (C2) at Lorong 8 Toa Payoh................... 39
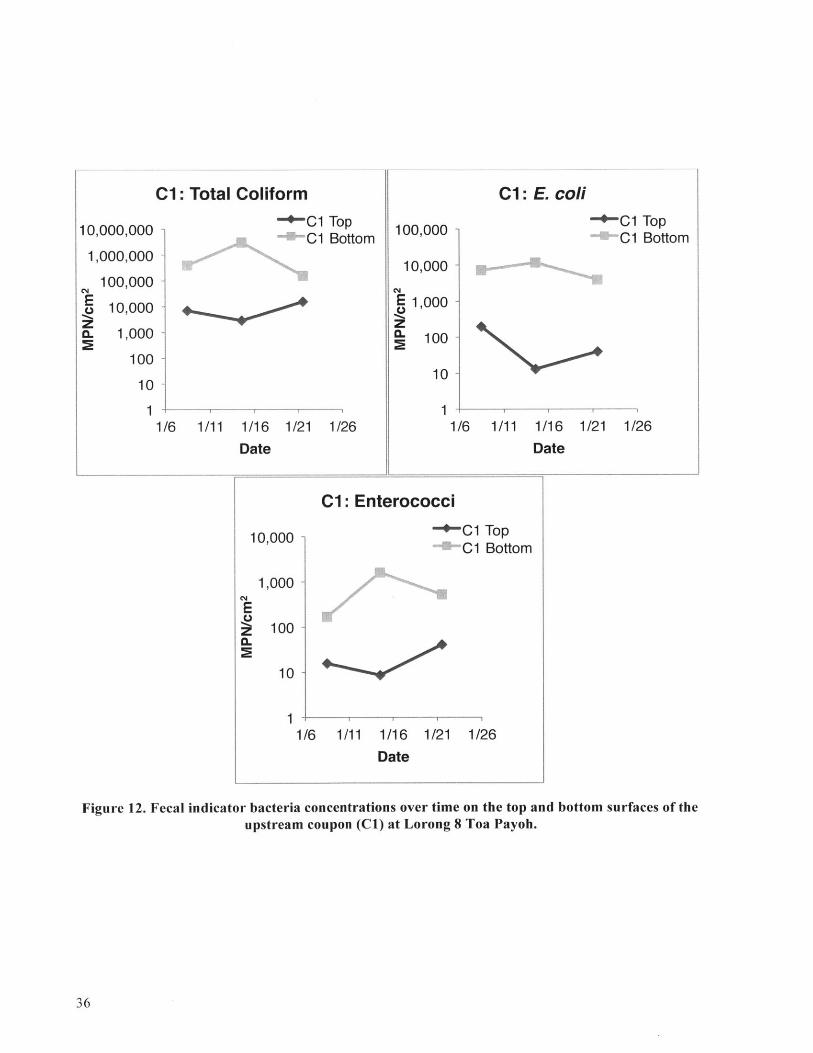
Figure 16. Total coliform concentrations in stormwater and on coupon surfaces. .................. 40
9
Figure 17. Escherichia coli concentrations in stormwater and on coupon surfaces. ............... 41
Figure 18. Enterococci concentrations in stormwater and on coupon surfaces. ...................... 41
Figure 19. Examples of attached algae (USEPA 1977). ......................................................... 44
Figure 20. Detachment of a biofilm particle to the bulk fluid flow (Stewart 1993). ................ 46
Figure 21. An activated biofilter schematic (Metcalf and Eddy 2003).................................... 47
Figure 22. FIB mass balance control volumes for stormwater and biofilm............................. 48
Figure 23. Map of Lorong 8 Toa Payoh sampling locations, the upstream coupon C1 markedwith a blue pin, and the downstream coupon C2 marked with a yellow pin(G oogle M aps 2013). .............................................................................................. 63
Figure 24. Map of Lorong 6 Toa Payoh sampling location for coupon C5, marked with a redpin (Google M aps 2013) ........................................................................................ 63
Figure 25. Map of Verde View sampling location for coupon C3, marked with a green pin(G oogle M aps 2013) ............................................................................................... 64
Figure 26. Map of Choa Chu Kang Crescent sampling location for coupon C4, marked witha purple pin (Google M aps 2013) ........................................................................... 64
10
List of Tables
Table 1. The number of generations of fecal bacteria after 4 days. Escherichia coli was keptat 30 *C and enterococci were maintained at 20 *C (Hartz et al. 2008)..................... 22
Table 2. Fecal indicator bacteria concentrations in MPN/cm 2 on concrete coupon surfaces...... 33
Table 3. Fecal indicator bacteria concentrations in MPN/cm 2 for experimental controls..... 34
Table 4. Fecal indicator bacteria concentrations in MPN/100 mL in storm drainage water. ...... 38
11


1 Introduction
1.1 BackgroundThis section was written in collaboration with Ndeye Awa Diagne, Margaret Hoff, and
Halle Ritter.
1.1.1 Singapore Water ManagementSingapore is commended by many organizations, including the World Health
Organization, as model for integrated water resources management (Chen et al. 2011). Thisrecognition is not because the small city-state has abundant water. Instead, Singapore lackssufficient naturally occurring water resources to sustain its population of 4.8 million. Waterlimitations are serious enough to warrant Singapore's inclusion by the United Nations on its listof water-scarce countries (Ong 2010). Though the country's average annual rainfall of 2,400 mmis above the global average, Singapore's land area is not sufficient to harvest an adequate amountof that precipitation (Tan et al. 2009). Furthermore, the small island has no other natural sourcesof renewable freshwater, such as large surface water bodies and groundwater. Singaporeconsumes approximately 1.36 billion liters of water per day (Tortajada 2006), and that demandfor water is projected to grow as the population will reach 6.5 million in the next 50 years (Chenet al. 2011). The country's scarce water resources will be further stressed in the future.
Much of Singapore's population has access to adequate water quantity and quality. AsChen et al. (2011) report, 100% of the population has consistent access to water of sufficientquantity to meet their consumption demands. Furthermore, 99.96% or higher of that water supplymeets the World Health Organization (WHO) drinking water standard, which is generallyconsidered sufficient to ensure water potability. Similarly, 100% of the population is reported tohave access to adequate sanitation (Chen et al. 2011). The country's high performance despite ofwater scarcity is due to the careful management by Singapore's national water utility, the PublicUtilities Board (PUB), of the country's four "National Taps" (Tan et al. 2009). The NationalTaps are Singapore's four sources of water.
Even though Singapore has an above-average amount of rainfall, the country does nothave enough land area to collect most of the rainwater that falls. This spatial limitation has beenthe target of engineering projects in Singapore's history and has resulted in an intricate networkof rainwater collection channels and reservoirs, which are considered the country's first NationalTap (Tan et al. 2009). The rainwater collection system provides approximately 50% (Chen et al.2011) of Singapore's daily water consumption of 1.36 billion liters (Tortajada 2006). Efforts toexpand the collection of precipitation are continuing, including progressive rooftop harvestingschemes and a continuous expansion of the reservoir network, with the aim of transforming 90%of Singapore's land area into water catchment. Despite the advanced technology and thegovernment's expansion of rainwater collection systems, physical limitations still necessitateother sources of water to meet the country's needs (Tan et al. 2009).
Singapore's second National Tap is imported water from Johor, Malaysia, making upanother 40% of the country's water supply (Chen et al. 2011). Singapore has imported a largepercentage of its water since it separated from the Federation of Malaysian States in 1965, butthe relationship has often been tense and uncertain in the intervening years. At various times,Malaysia has threatened to discontinue the water supply for political or economic reasons and
13
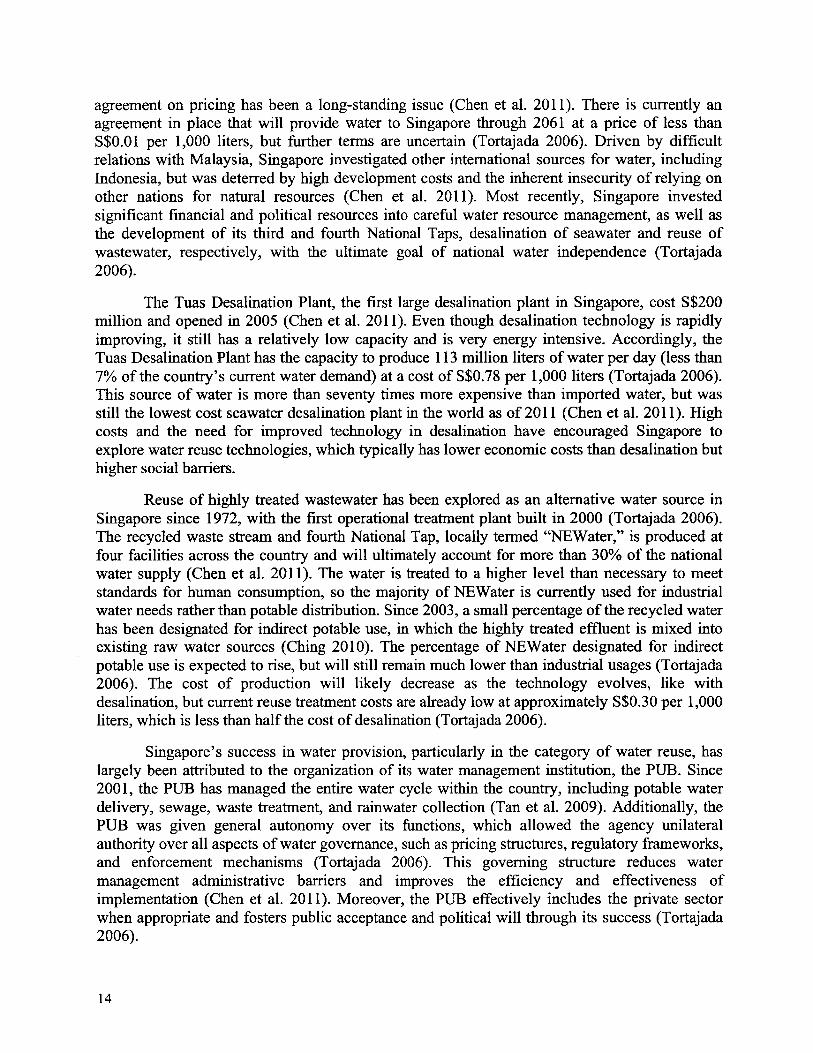
agreement on pricing has been a long-standing issue (Chen et al. 2011). There is currently anagreement in place that will provide water to Singapore through 2061 at a price of less thanS$0.01 per 1,000 liters, but further terms are uncertain (Tortajada 2006). Driven by difficultrelations with Malaysia, Singapore investigated other international sources for water, includingIndonesia, but was deterred by high development costs and the inherent insecurity of relying onother nations for natural resources (Chen et al. 2011). Most recently, Singapore investedsignificant financial and political resources into careful water resource management, as well asthe development of its third and fourth National Taps, desalination of seawater and reuse ofwastewater, respectively, with the ultimate goal of national water independence (Tortajada2006).
The Tuas Desalination Plant, the first large desalination plant in Singapore, cost S$200million and opened in 2005 (Chen et al. 2011). Even though desalination technology is rapidlyimproving, it still has a relatively low capacity and is very energy intensive. Accordingly, theTuas Desalination Plant has the capacity to produce 113 million liters of water per day (less than7% of the country's current water demand) at a cost of S$0.78 per 1,000 liters (Tortajada 2006).This source of water is more than seventy times more expensive than imported water, but wasstill the lowest cost seawater desalination plant in the world as of 2011 (Chen et al. 2011). Highcosts and the need for improved technology in desalination have encouraged Singapore toexplore water reuse technologies, which typically has lower economic costs than desalination buthigher social barriers.
Reuse of highly treated wastewater has been explored as an alternative water source inSingapore since 1972, with the first operational treatment plant built in 2000 (Tortajada 2006).The recycled waste stream and fourth National Tap, locally termed "NEWater," is produced atfour facilities across the country and will ultimately account for more than 30% of the nationalwater supply (Chen et al. 2011). The water is treated to a higher level than necessary to meetstandards for human consumption, so the majority of NEWater is currently used for industrialwater needs rather than potable distribution. Since 2003, a small percentage of the recycled waterhas been designated for indirect potable use, in which the highly treated effluent is mixed intoexisting raw water sources (Ching 2010). The percentage of NEWater designated for indirectpotable use is expected to rise, but will still remain much lower than industrial usages (Tortajada2006). The cost of production will likely decrease as the technology evolves, like withdesalination, but current reuse treatment costs are already low at approximately S$0.30 per 1,000liters, which is less than half the cost of desalination (Tortajada 2006).
Singapore's success in water provision, particularly in the category of water reuse, haslargely been attributed to the organization of its water management institution, the PUB. Since2001, the PUB has managed the entire water cycle within the country, including potable waterdelivery, sewage, waste treatment, and rainwater collection (Tan et al. 2009). Additionally, thePUB was given general autonomy over its functions, which allowed the agency unilateralauthority over all aspects of water governance, such as pricing structures, regulatory frameworks,and enforcement mechanisms (Tortajada 2006). This governing structure reduces watermanagement administrative barriers and improves the efficiency and effectiveness ofimplementation (Chen et al. 2011). Moreover, the PUB effectively includes the private sectorwhen appropriate and fosters public acceptance and political will through its success (Tortajada2006).
14

1.1.2 Singapore Water Quality ConcernsIn 2006, the Public Utilities Board (PUB) launched the Active Beautiful Clean (ABC)
Waters Programme. The main objective of the ABC Waters Programme is to encourageSingaporeans to be more conscious of water scarcity and the country's water bodies (PUB 2009).The ABC Waters Programme is a strategic initiative to open Singapore's reservoirs andwaterways to the public for recreational activities. The recreational activities include kayaking,fishing, barbecuing, and picnicking, which may involve direct contact with the water bodies.However, water quality of the reservoirs and waterways has been a concern for the PUB. In fact,recent studies have observed contamination in the reservoirs and the storm drains feeding them.Urban runoff has been reported to contain high levels of pollutants including suspended solids,nutrients, heavy metals, and pathogenic bacteria (Wang 2012). In order to protect public health,ongoing studies and investigations have been conducted to evaluate the levels of contaminationwithin reservoir catchments and bacteria loading to the reservoirs and waterways (Chua et al.2010).
1.2 Past WorkStudent teams from the Massachusetts Institute of Technology have collected water
quality data at several locations across Singapore. In the past, bacterial, physical, and chemicalwater quality parameters have been analyzed from water samples taken over different timescales(Ekklesia 2011). Due to the observations of fecal indicator bacteria (FIB) presence inSingapore's storm drains, pathways for fecal contamination have been investigated. Doshi(2012) began an investigation of the pathways for underground sewer line leakage into stormdrains and discovered the sewer pipe connections between buildings and sewer networks to beprone to damage. As a result, the leakage of sewage at building connections may significantlycontribute to fecal contamination in the nearby stormwater. Another study analyzed the temporaland spatial patterns among land use, sewer age, and FIB concentrations (Shin 2012). Shin (2012)found greater concentrations of FIB in the relatively older sewers than the relatively newersewers, suggesting sewer leakage to be a factor. However, without a diurnal pattern of fecalindicator concentrations, other factors can contribute to the FIB present in stormwater runoff.
1.3 Purpose and ScopeTo support the request of the Public Utilities Board of Singapore in evaluating the quality
of stormwater runoff, this research has been completed to aid in the understanding of bacterialcontamination sources to water in the storm drains. A thorough understanding of contributingsources provides information essential to the eventual development of remedial options fordrains and the protection of public health. This research aims to consider an alternative source ofFIB in the stormwater runoff: the storm drain itself. Biological activity has been observed to bepresent in several storm drains in Singapore in the form of biofilm growths (Ekklesia 2012).Such a biofilm is illustrated in Figure 1, in which a concrete coupon (a thin cylinder of concrete)is obscured by some leaves and is surrounded by a biofilm growth. With the presence of sewagein the stormwater, FIB from sewage can come into contact with biofilms. Some FIB in thestormwater may attach to the biofilm surface, leading to in-place survival and growth of bacteria.As with the nature of biofilms, the detachment of clusters of FIB-rich biofilm into the flowingstormwater is inevitable.
15

Figure 1. Biofilm growth and accumulated leaves around concrete coupon in a storm drain locatedin the Verde View neighborhood of Singapore on December 28, 2012 (Ekklesia 2012).
1.4 Goals and ObjectivesThis research provides insight into a previously uninvestigated source of fecal bacteria
contamination in Singapore's water conveyance systems. It evaluates the importance ofbacteriological contamination that originates from within the stormwater drainage system to theoverall fecal contamination problem in Singapore's waters. The goals of this research arefulfilled through the completion of three objectives.
The first objective is to determine if biofilms in the storm drains are indeed reservoirs forFIB. The FIB targeted in the study are total coliform, Escherichia coli, and enterococci. Thisobjective is fulfilled through the sampling of existing biofilm growths in several storm drains andanalyses for FIB concentrations. Given previous observations (Ekklesia 2012), the hypothesis isthat when biofilm exist in a storm drain, there will likely be FIB presence in the biofilm.
The project's second objective is to measure any FIB growth within biofilms. In order todetermine growth, the same biofilm colony is sampled over time and the FIB concentrations aremeasured and compared. It is hypothesized that if there is FIB presence in biofilm, the FIBconcentrations in the biofilm will increase over time, given steady stormwater flow in the drain.However, stormwater flow is inherently unsteady due to erratic occurrences of rainstorms in
16

Singapore, so FIB concentrations in biofilm may not be observed to increase over time within athree-week sampling period.
The final objective is to identify possibilities for FIB detachment from biofilms andsubsequent contamination of the overlying stormwater. To accomplish this objective, thestormwater directly downstream of a sampled biofilm is analyzed for FIB concentrations. Ihypothesize that by measuring the FIB concentrations in stormwater, I can determine how theFIB concentrations in biofilms are correlated to those stormwater concentrations, if at all.
With the evaluation of a potential source of fecal bacteria contamination in Singapore'swater, a better understanding of the country's stormwater quality can be achieved. The results ofthis study will provide insights into the role biofilms in the stormwater drainage system have instormwater quality. If biofilms are indeed observed to be reservoirs for fecal bacteria and mediafor fecal bacteria multiplication and growth, future studies will be necessary in evaluating themagnitude and extent of their contribution to issues concerning fecal bacteria contamination ofstormwater.
17


2 Literature Review
2.1 Water Quality Monitoring with Fecal Contamination IndicatorsPathogens are bacteria, protozoa, and viruses that cause disease in humans. Surface water
can become contaminated with pathogens by sewage, wastes from humans and animals, andagricultural runoff entering the water (Alm et al. 2003). To monitor water quality, indicatorbacterial levels are observed and the measured concentrations are compared with theconcentrations defined in regulations. Though, it is not common practice to monitor for allpossible pathogens that can be present in water (Savichtcheva and Okabe 2006; Rowny andStewart 2012). Fecal indicator bacteria (FIB) for enteric pathogens such as Escherichia coli andintestinal enterococci are allochthonous bacteria (Balzer et al. 2010). Allochthonous bacteria arebacteria that originated from an environment a significant distance away from their currentlocation. Allochthonous bacterial levels are typically used to determine the presence and extentof fecal contamination in surface water. The survival of these bacteria in aquatic environmentsdepends on predation by grazers, transfer of plasmids among bacteria, nutrients, salinity,temperature, and sunlight intensity (Barcina et al. 1997). Guidelines from the United StatesEnvironmental Protection Agency (U.S. EPA) set FIB to include E. coli and Enterococcus sp.(USEPA 1986). Tests for total coliform bacteria, E. coli, and enterococci are often used tomonitor water quality.
2.1.1 Total ColiformsTotal coliform bacteria can be present in the feces of humans and animals, soil, and
submerged wood (USEPA 2012). Total coliforms are recommended for testing in drinking waterbut not in recreational waters.
2.1.2 Fecal Coliforms (Escherichia coli)Fecal coliforms are a subgroup of total coliforms. A species of fecal coliform bacteria
used to test recreational waters is E. coli (USEPA 2012). E. coli is only present in the feces ofwarm-blooded animals and humans. Low temperatures have been observed to prolong thesurvival of fecal coliforms within aquatic environments (Vasconcelos and Swartz 1976; Flint1987; Terzieva and McFeters 1991; Craig et al. 2002a). In freshwater systems, the U.S. EPAstandards recommend that E. coli levels do not exceed 126 colony-forming units (CFU) per 100mL.
2.1.3 Fecal Streptococci (Intestinal Enterococci)Fecal streptococci are present in the digestive tracts of warm-blooded animals and
humans (USEPA 2012). A subcategory of fecal streptococci is enterococci. The most relevantspecies of enterococci from true fecal sources are Enterococcusfiecalis, Enterococcusfaecium,Enterococcus hirae, Enterococcus durans, Enterococcus casseliflavus, Enterococcus gallinarum,and Enterococcus raffinosus (Pinto et al. 1999; Balzer et al. 2010). The most common species ofenterococci found in human feces are Enterococcus faecalis and Enterococcus fiecium(Converse et al. 2009). Other species of enterococci may be environmental bacteria. The U.S.EPA standards for recreational waters recommend enterococci densities to not exceed 33 CFUper 100 mL in freshwater and 35 CFU per 100 mL in marine water (USEPA 1986).
19

2.2 Drawbacks of and Alternatives to Indicator BacteriaNo ideal fecal indicators are known, but the concentration in water of the commonly used
FIB positively correlates with instances of human illness. For a fecal indicator to be ideal, it mustbe detected effectively analytically, be absent in water without pollution, have concentrationsthat correlate with the contamination amount, and have a longer life than pathogens (USEPA2001). FIB detection cannot be distinguished between fecal contamination that originates fromhumans or other animals.
Bacteroides spp. may be a better indicator for fecal pollution because they are present inhuman feces in high concentrations and are not likely to survive or reproduce in a waterenvironment (Converse et al. 2009). These anaerobic bacteria are found in the intestinal tract ofhumans and animals. They are able to adapt to the environment and nutrients provided in ahuman gastrointestinal tract. Bacteroides spp. are present in human feces in numbers of 1010 cellsper gram dry weight of human feces (Salyers 1984). Fecal Bacteroides spp. can be quantifiedusing quantitative polymerase chain reaction (QPCR) methods. A QPCR assay is executed byextracting DNA from samples and performing QPCR reactions.
2.3 Fecal Bacteria Presence in BiofilmsBoth point sources and non-point sources contribute fecal bacteria to surface water,
resulting in fecal bacteria being typically present in both the waters and sediments of marine andfreshwater environments (Craig et al. 2002a; Byappanahalli et al. 2003; Balzer et al. 2010).Furthermore, several studies have discovered fecal bacteria to be very persistent in marine andfreshwater sediments (Burton et al. 1987; Marino and Gannon 1991; Davies et al. 1995; Craig etal. 2002b, 2004). The sediments are bacterial reservoirs, which thereby create conditions underwhich bacteria can survive and multiply in aquatic environments.
Bacteria are commonly found in biofilms that form on any surface in a natural waterenvironment (Castonguay et al. 2006). Microorganisms are able to attach to a surface, develop abiofilm colony, and eventually disperse into the water column after growth. Biofilms arestructured communities of microorganisms contained by an extrapolymeric substance (Hall-Stoodley and Stoodley 2005). Figure 2 illustrates the three steps of a typical biofilm life cycle.
Figure 2. The biofilm life cycle (Cunningham et al. 2010).
20
Allochthonous microorganisms are the main component of surface water biofilms, butfecal bacteria may become associated with the biofilms if there is a source of fecal pollution(Balzer et al. 2010). The fecal bacteria remain associated with biofilms as the communitysupplies the bacteria with nutrients and shelter (Elhariry et al. 2012). Epilithic and sedimentbiofilms have been observed to have higher densities of allochthonous bacterial cells than theoverlying water. Organisms that originally form the biofilm are considered to be autochthonousorganisms. Autochthonous organisms are the opposite of allochthonous organisms in that theyare native to their present environment. There is evidence that the allochthonous E. coli hasadapted to ensure survival within a biofilm, even with competition from the autochthonousmicroorganisms.
2.3.1 Sediments of Aquatic EnvironmentsEnteric microorganisms are able to survive in the sediments of aquatic environments
because sediments provide nutrients, protection from sunlight, and safeguard against grazerssuch as protozoa (Alm et al. 2003). The top layers of sediment in a riverbed or beach sand canalso be sources of fecal coliforms. Literature focused on storm drain sediments, beach sand, andbeach wrack give insight to how these media can harbor fecal bacteria similar to how biofilmscan harbor fecal bacteria.
2.3.1.1 Storm Drain SedimentsStorm drains are observed to collect sediments that have been deposited from the
conveyed water. The outlet of a storm drain can be the area with the most sedimentation due tothe design of the drain (Marino and Gannon 1991). Competition and antagonism among thenative microflora and predation by protozoa are factors that determine the survival of the fecalcoliforms and fecal streptococci in the sediments. Indicator bacteria populations were observedto remain at high densities in storm drain sediments despite the effects of predation, competition,and antagonism among the microorganism community. The predation by protozoa is a limitingfactor for the survival of fecal coliforms and fecal streptococci in storm drain sediments andother aquatic environments, while predation by bacteria is not as important. Fecal coliform andfecal streptococci densities in creek sediments were observed by Marino and Gannon (1991) toremain stable during dry weather without significant external bacterial inputs, implying that themultiplication rates of the fecal coliforms and fecal streptococci must have been equal to thepredation rates. High concentrations of human-specific Bacteroides in storm drains wereconcluded to be due to in situ growth, direct contamination, or indirect contamination (Sercu etal. 2009). The studies of storm drain sediments provide insight into the dynamics of fecalbacterial communities within storm drain environments.
2.3.1.2 Beach SandCoastal sediments can be reservoirs for pathogens and the associated fecal coliforms
(Craig et al. 2002a). The survival and regrowth of fecal indicator bacteria may be possible inbeach sediments (Lee et al. 2006). Several studies have measured concentrations of fecal bacteriain beach sands. E. coli and enterococci counts were seen to be higher within swash-zone sandsediments to a depth of 20 cm than in the overlying water of beaches on Lake Huron, St. ClairCounty, Michigan (Alm et al. 2003). At coastal sites in the greater Adelaide metropolitan area ofSouth Australia, the concentration of fecal coliforms in the sediments was higher than in theoverlying water (Craig et al. 2002a). E. coli, enterococci, and fecal coliform levels were found tobe higher in sand than in the shoreline waters of Florida, with greater levels of E. coli,
21

enterococci, and fecal coliform occurring in dry sand than in wet sand (Hartz et al. 2008). Acomparison of the generations of fecal bacteria in sand versus water in the Florida study is givenin Table 1. Regardless of the temperature and salinity conditions of the sand and waterenvironments, the number of generations of E. coli and enterococci produced in the experimentswere greater in the sand than in the water.
Table 1. The number of generations of fecal bacteria after 4 days. Escherichia coli was kept at 30 *Cand enterococci were maintained at 20 *C (Hartz et al. 2008).
E. coil EnterococciParameter Sand Water Sand Water
Temperature ("C)20 14 1 9 030 18 0 4 040 9 0 4 0
Salinity (PSU)6 10 0 7 0
13 15 0 4 032 18 1 9 0
38.5 15 0 6 0
In situ growth, runoff from land, or filtering of bacteria from tidal water by the sandcould cause the numbers of indicator bacteria to be greater in sand than water. High levels ofindicator bacteria in beach sand have been observed in areas that have no nearby source ofsewage contamination (Bonilla et al. 2007). Microorganisms such as enterococci andBacteroidales human-specific fecal markers were observed to survive for up to 20 days onaverage in beach sand after sewage deposition (Yamahara et al. 2012). High moisture sands havegreater concentrations of fecal indicator bacteria than relatively dry sands. Fecal coliforms insediments of freshwater and coastal water are often present in concentrations of at least one orderof magnitude greater than the concentrations of fecal coliforms in the overlying water(Byappanahalli et al. 2003; Craig et al. 2002; Obiri-Danso and Jones 1999; Valiela et al. 1991).Beach sand performs many of the same functions as biofilms in providing a better habitat forfecal bacteria survival than the overlying waters of aquatic environments.
2.3.1.3 Beach WrackBeach wrack is composed of animal remains and detached marine vegetation, such as
seaweed or marine algae, which have been washed to the tidelines of beach areas (FMSA 1999).The wrack may be present on dry sand above the coastal water line, on wet sand in the swashzone, or suspended in seawater in the surf zone (Imamura et al. 2011). In a study at CowellBeach, Santa Cruz, California, FIB were found to be present in wrack, the highest concentrationsbeing in dry wrack and the lowest in surf wrack. At beaches with wrack, FIB may be able tosurvive for a longer period of time than at beaches without wrack. Wrack can maintain moisturefor FIB survival, provide nutrients, and protect again UV radiation from the sun. Storm drainscontain debris that can mirror the function beach wrack has on beaches. Clusters of leaves ortrash could be the "wrack" of storm drains.
22

2.3.2 Biofilms in Water SystemsBacteria are often present in water distribution systems. Measurements of E. coli,
enterococci, total coliforms, and sulfide-reducing bacteria are used to monitor drinking waterquality within these systems (Batte et al. 2006). Bacteria grow in the pipes of water distributionsystems and have greater regrowth on rough surfaces and sediments, where biofilms are mostlikely to be present (Chowdhury 2012). Biofilms in the pipes of water distribution systems mayprotect pathogenic bacteria from disinfection residuals. Nutrients are also provided tomicroorganisms by biofilms (Elhariry et al. 2012). Thus, biofilms in distribution systems can besources of contamination as bacteria detach from the biofilm into the water (Batte et al. 2006).More FIB are present in the water of distribution systems with high residence times, low residualof disinfectant, and high temperatures. Fecal bacteria have particularly been observed to growwithin biofilms in the end regions of water distribution systems (Lee and Kim 2003). Theliterature that describes the potential for biofilms to harbor FIB in water distribution systemsimplies that this phenomenon is also possible in the stormwater drainage systems of interest tothis study.
Coupons are pieces of material that are used to observe biofilm growth. Biofilms indrinking water systems have been sampled by the use of coupons of test materials (Schwartz etal. 1998). Hardened polyethylene, hardened polyvinyl chloride (PVC), copper, and stainless steelare examples of coupon materials that meet the requirements for drinking water systems. Otherstudies have used cement, cast iron (Sibille et al. 1997), or plastics such as cross-linkedpolyethylene (PEX), high-density polyethylene (HDPE), and polypropylene (PP) (Manuel et al.2007). These coupons are immersed in the water for several days to allow a biofilm to develop.The collection of biofilm samples either involves scraping the biofilm from the coupon into avolume of water, or immersing the coupon in a solution and sonicating it to remove the bacteriafrom the coupon. Biofilm grow on nearly every coupon material, but greater densities have beenobserved on cast iron, cement, and plastic materials.
Biofilns and sediments are potential sources of bacteria in storm drains. Groups inSouthern California have studied biofilms within their storm drainage systems. Storm drains inSouthern California were observed to convey fecal bacteria from upstream sources todownstream biofilms (Ferguson et al. 2011). Fecal coliform bacteria and enterococci havespecifically regrown in storm drains and street gutters in Newport Beach, California (Skinner etal. 2010). Masses of bacteria in those storm drains have been detected to detach from the biofilmand enter the water column. As fecal bacteria do survive in various aquatic environmentsaccording to the literature, the aquatic environment provided by the stormwater drainage systemin Singapore is likely supporting fecal bacterial survival and growth.
2.4 Water Contamination of Fecal Bacteria from Environmental SourcesSurface water can be contaminated by runoff pollution that is associated with increased
flow rates. A common source of nonpoint source pollution is stormwater runoff (Parker et al.2010), which often contains elevated concentrations of FIB (Pan and Jones 2012). Contaminantconcentrations in stormwater are often represented by the "event mean concentration." The eventmean concentration is a single sample value that is compiled from a set of samples that weretaken at different times during a runoff event; it is calculated as the total mass of contaminant (ornumber of organisms) divided by the total flow. The event mean concentration of FIB is oftengreater than the water quality criteria set by the U.S. EPA, but varies with the season. The overall
23

load of FIB in a stream can be due to stormwater runoff when high water flows release thebacteria from sediments (Craig et al. 2002a, 2004; Reeves et al. 2004; Surbeck et al. 2006;Krometis et al. 2007; Balzer et al. 2010; Stumpf et al. 2010). In the summer, the event meanconcentration of FIB is relatively greater than in the spring (Pan and Jones 2012). Theconcentration of FIB in runoff is greater with greater concentration of dissolved organic carbon(Surbeck et al. 2010). Survival of E. coli and enterococci is also higher with greaterconcentrations of dissolved organic carbon and phosphorus.
If a site has low flows and little turbulence, fecal coliforms may have better survivalduring the winter (Craig et al. 2002a). Low temperatures and low levels of sunlight arecharacteristics of the winter season. Furthermore, peak concentrations of fecal coliform havebeen observed during high rainfall periods. The FIB levels in sediments of beaches in SantaMonica Bay, California were observed to peak with a storm (Lee et al. 2006).
24

3 Experimental Methods, Materials, and Procedures
3.1 Field Work: Collection of Field Data
3.1.1 Sampling LocationsBiofilm and water samples were collected from two districts in Singapore, Toa Payoh and
Choa Chu Kang. The districts of Singapore are shown in Figure 3. In the Toa Payoh district,stormwater drainage sites near Lorong 6 Toa Payoh and Lorong 8 Toa Payoh were sampled.Samples were also taken from sites near Choa Chu Kang Crescent and Verde View in the ChoaChu Kang district. All locations were near high-density or low-density residential areas. Thesampling locations were selected based on previous observations of bacteria presence in thestormwater and the ease of storm drain access (Shin 2011). A secondary study was done in astorm drain adjacent to Nanyang Technological University (NTU), which is in the WesternWater Catchment district. In total there were five sampling points, one sampling point each atLorong 6 Toa Payoh, Choa Chu Kang Crescent, Verde View, and NTU, and two sampling pointsat Lorong 8 Toa Payoh. Samples were collected following protocols given by Techniques ofWater-Resources Investigations, Book 9 (Myers et al. 2007).
Figure 3. Map of Singapore districts (Property Market SG 2013).
3.1.2 Water SamplingWater samples were collected from each of the five sampling points. Samples were
collected from Lorong 6 Toa Payoh on January 14, 2013 and January 21, 2013. One sample eachwas collected from Verde View and Choa Chu Kang Crescent on January 16, 2013. The two
25

sampling points at Lorong 8 Toa Payoh were each sampled once on January 21, 2013. OnJanuary 22, 2013, a sample was taken from the Nanyang Technological University (NTU) point.Each sample was collected by gloved hand directly downstream of a concrete coupon in thedrain. A 532-mL Whirl-Pak@ sampling bag (Nasco, Fort Atkinson, WI, USA) was used to drawa sample of stormwater. Water was poured into the sampling well of an Ultrameter 11 Model6PFC water quality meter (Myron L Company, Carlsbad, CA, USA) to measure the watertemperature and pH on site. The samples were stored in ice chests at 4 'C at the sampling sitesand transported in the ice chests to the refrigerator in the Environment Laboratory 11 at NTU.
3.1.3 Biofilm and Sediment SamplingBiofilms and sediments were sampled from each of the five sampling points. Concrete
coupons that had been sterilized in an oven and stored in plastic bags were used to measurebiofilm growth. The method of using concrete coupons to measure biofilm growth was adaptedfrom the procedure performed by Ferguson et al. (2011).
On December 11, 2012, a single hole to fit a PVC nail was drilled into six 10-cmdiameter concrete coupons at the Nanyang Technological University (NTU) HydraulicsLaboratory. Five of the coupons were deployed in drains: one at Lorong 6 Toa Payoh, two atLorong 8 Toa Payoh (one upstream in a tributary and one downstream in a larger channel), oneat Verde View, and one at Choa Chu Kang Crescent. The coupons were attached to the drainsurfaces by using a PVC nail hammered through the hole in the coupon into a depression drilledin the drain surface. Cable ties were used to attach the coupon in place. Two coupons wereplaced in the large drain near the NTU Civil and Environmental Engineering Departmentbuildings on January 16, 2013 but the coupons were washed away by January 17, 2013. Twomore coupons were placed in the same drain on January 21, 2013 and remained in place onJanuary 22, 2013.
The concrete coupons were detached from the storm drains by cutting the cable ties andlifting them off of the PVC nails. During sampling, the concrete coupons were held on therounded edges. Both the top (flat surface facing up) and the bottom (flat surface resting on thestorm drain bottom) of each concrete coupon were sampled. The area to be sampled was initiallyestimated using a marked grid on a transparent sheet, a method that was demonstrated imprecisein the field because of its difficulty. Consequently, a 3-cm 2 surface area to be wipe-sampled wasscribed in the biofilm surface prior to sampling by the use of the edge of a rectangular plasticcontainer. The plastic container was washed with Milli-Q water, pressed into the biofilm surface,and then removed. Sterile cotton swabs were used to wipe samples of biofilms and sedimentsfrom the concrete coupon surfaces that were within the scribed area. The used cotton swab wasplaced in 30 mL of Milli-Q water in an amber glass vial and capped on site. The amber glassvials was washed three times with a 1:10 bleach dilution in the NTU Hydraulics Laboratory andthree times with Milli-Q water on site prior to sample collection. Vials were stored in ice chestsat 4 'C at the sampling sites and transported in the ice chests to the refrigerator in theEnvironment Laboratory II at NTU.
On January 8, 2013 at Lorong 8 Toa Payoh, the top of the coupon at the upstream pointand the top and bottom of the coupon at the downstream point were sampled by gloved handusing a sterile cotton swab to wipe I cm2 of the coupon surface. A blank 30-mL sample of Milli-Q water was prepared at Lorong 8 Toa Payoh and stored with the other samples. On January 9,2013 and January 16, 2013, 3-cm 2 samples of the top and bottom of the coupons at Verde View
26

and Choa Chu Kang Crescent were swabbed. On January 14, 2013 and January 21, 2013, 3-cm 2
samples of the top and bottom of the coupons at Lorong 6 Toa Payoh and Lorong 8 Toa Payohwere collected. The tops of two unused coupons were swabbed in the same manner on January14, 2013 and January 21, 2013 in the NTU Hydraulics Laboratory. On January 22, 2013 3-cm 2
samples of the top and bottom of a coupon in a drain near the NTU Civil and EnvironmentalEngineering Department buildings were collected. A 30-mL Milli-Q water sample blank wasprepared in the NTU Hydraulics Laboratory on January 22, 2013.
3.2 Laboratory Procedures
3.2.1 Bacteria Analysis in WaterThe water samples were undisturbed in the refrigerator for 24 hours or less before
bacteria analysis was performed. The most probable number (MPN) method was used to analyzethe concentrations of total coliform, Escherichia coli, and enterococci in the water samples. Inthe MPN method, the concentrations of microorganisms present in a sample are estimated byperforming a replicate 10-fold dilution series (Sutton 2010). Total coliforms and E. coli werequantified using Colilert- 18@ growth media and Quanti-Tray/2000@ sample trays (IDEXXLaboratories, Inc., Westbrook, ME, USA). The procedure for the detection and enumeration ofE. coli and coliform bacteria is provided in the package inserts for Colilert- 18@ and Quanti-Tray/2000@ (IDEXX 2012a). The procedure involves mixing the contents of a Colilert-18@packet into a sterile vessel containing the sample and dilution water, then emptying the vesselinto the Quanti-Tray/2000@ sample tray. Enterococci were quantified using EnterolertTM growthmedia and Quanti-Tray/2000@ sample trays (IDEXX Laboratories, Inc., Westbrook, ME, USA).The ASTM-approved procedure for testing for enterococci in water using EnterolertTM is alsoprovided in the package insert (IDEXX, 2012b). The procedure is nearly identical to those forthe E. coli and total coliform. Dilutions of 1:1, 1:100, and 1:1,000 of the water sample withMilli-Q water were used in order to account for cell counts exceeding 2,419 MPN per 100 mL ofwater sample, which is the maximum that can be counted with the IDEXX procedure (IDEXX2011). A volume of 100 mL ± 1 mL of mixed water sample dilution and growth media waspoured into a Quanti-Tray/2000@ and sealed immediately. The Quanti-Tray/2000@ sample traysfor total coliform and E. coli analysis were incubated at 35 'C. The Quanti-Tray/2000@ sampletrays for enterococci were incubated at 41 "C. All Quanti-Tray/2000@ sample trays wereincubated for 24 to 28 hours. After the incubation period, the Quanti-Tray/2000@ sample trayswere removed for MPN enumeration based on indications of color or fluorescence in accordancewith the IDEXX procedure (IDEXX 2011). For total coliform counts, the numbers of yellowwells of the 49 large wells and 48 small wells were each counted. Yellow wells indicate apositive total coliform presence. For E. coli and enterococci counts, the numbers of yellow wellsthat were fluorescent with 365-nm ultraviolet light were counted as positive. The MPN per 100mL was determined from the positive well counts using the IDEXX conversion table.
3.2.2 Bacteria Analysis in BiofilmThe biofilm and sediment samples (consisting of cotton swabs and 30 mL of Milli-Q in
amber vials) were undisturbed in the refrigerator for 24 hours or less before bacteria analysis wasperformed. To prepare for analysis, the amber vials containing samples were removed from therefrigerator and manually shaken vigorously for 30 seconds to dislodge the biofilm andsediments from the cotton swabs and homogenize the liquid in the vials. The cotton swabs wereinspected through the vials to determine if any material was still attached, and if so, were shaken
27

for an additional 10 seconds. Total coliforms, E. coli, and enterococci were analyzed with thesame method as the water samples except for the dilutions. For the biofilm samples, the dilutionsused were 1:10, 1:1,000, and 1:100,000. The most probable number method was used to analyzethe concentrations of total coliform, E. coli, and enterococci in the biofilm and sediment samples.
28

4 Results
4.1 Visual Examination of BiofilmsA large sample of biofilm was collected from the concrete floor of the storm drain near
the upstream coupon (C1) at Lorong 8 Toa Payoh on January 21, 2013 and preserved in afreezer. To the naked eye, the sample appeared to consist of fibrous brown-colored material. OnApril 12, 2013 the sample was examined under a microscope using three methods. Lightmicroscopy was used to examine the general structure of the biofilm, as shown in Figure 4. Thebiofilm appears to contain a variety of organic matter and long filaments. Figure 5 illustrates adifferent section of the biofilm, and highlights an algal cell.
Figure 4. A biofilm specimen collected in a storm drain at Lorong 8 Toa Payoh magnified 400x.
Figure 5. A biofilm algal cell from a storm drain at Lorong 8 Toa Payoh at 400x magnification.
29

Another method used to examine the biofilm was gram staining of the sample. In a gram-stained sample, the gram-positive microorganisms are blue or violet in color and the gram-negative microorganisms are pink or red in color (ASM 2013). Gram-positive cells, such asenterococci cells, have thick peptidoglycan layers and gram-negative cells, such as total coliformand Escherichia coli cells, have thin peptidoglycan layers. In gram staining, the sample that hasbeen air-dried and heat-fixed to a slide is flooded with a crystal violet staining agent. After oneminute, the sample is rinsed with tap water and then flooded with Gram's iodine. Again, thesample is washed with tap water but is flooded with a decolorizing agent. After rinsing, safraninis used as a counterstain and the sample is rinsed again. The samples were viewed under aBrightfield microscope. Gram-positive, gram-negative, and few gram-variable cells appeared tobe present in the biofilm sample, as indicated in Figure 6 (a). Though, the sample contained moregram-negative cells than any other type. Two algal filaments are shown in Figure 6 (b) and (c).
Figure 6. A portion of a gram stained biofilm sample from a storm drain in Lorong 8 Toa Payohviewed at 1000x in (a) and 400x in (b) and (c).
Fluorescence microscopy was used to examine the sample for cells of bacteria. Thesample was stained with a green fluorescent nucleic acid stain. Bacteria will fluoresce greenunder green fluorescent ultraviolet light (Haberkorn et al. 2011). When exposed to redfluorescent ultraviolet light, chlorophyll fluoresces red. The red fluorescence is shown in Figure7, while the green fluorescence is illuminated in Figure 8. The fluorescence microscopy showedthat different types of microorganisms gather in groups within the biofilm structure. The green
30

fluorescence photographs indicate clusters of bacteria cells are present within an extracellularpolymeric substance, while the red fluorescence photograph highlights clusters of largerphotosynthetic cells.
The biofilm specimen collected from Lorong 8 Toa Payoh was highly varied incomposition and structure. The biofilm appeared to contain organic matter and photosyntheticmaterials. Different microorganisms were present among the separate filaments within thebiofilm structure, and separate portions of the biofilm structure harbored different colonies ofbacterial and algal cells.
Figure 7. Bacteria cells fluorescing bright green in a biofilm sample from a storm drain in Lorong 8Toa Payoh at 400x (top) and 1000x (bottom) magnification.
31

Figure 8. Chlorophyll-containing algal cells fluorescing red in a biofilm sample from a storm drainin Lorong 8 Toa Payoh, viewed at 1000x magnification.
4.2 Fecal Indicator Bacteria in BiofilmsAn analysis of the concentrations of fecal indicator bacteria (FIB) was performed on the
biofilm samples collected between January 8, 2013 and January 22, 2013 at Choa Chu Kang(CCK) Crescent, Verde View, Lorong 6 Toa Payoh, Lorong 8 Toa Payoh, and NanyangTechnological University (NTU). To determine the MPN per 100 mL values of FIB, Colilert-18@ growth media and Quanti-Tray/2000@ sample trays (IDEXX Laboratories, Inc., Westbrook,ME, USA) were used to analyze for total coliforms and E. coli and EnterolertiM growth mediaand Quanti-Tray/2000@ sample trays (IDEXX Laboratories, Inc., Westbrook, ME, USA) wereused to analyze for enterococci. Dilutions of 1:10, 1:1,000, and 1:100,000 were performed on thesamples to determine the most representative MPN per 100 mL of FIB.
A total of 25 biofilm samples were collected, along with two wash water controls(COBLAW and C 12BLAW) and two concrete coupon controls (C6BLAC and C 11 BLAC). Thewash water controls were prepared by placing an unused sterile cotton swab into an amber vialfilled with 30 mL of water, while the concrete coupon controls were prepared by swabbing anunused concrete coupon. Both controls were analyzed in the same fashion as the biofilmsamples, except only a 1:10 dilution was performed.
The FIB concentrations are better expressed in terms of MPN per surface area of concretecoupon surface. Instead of having FIB suspended in a certain volume, the FIB-containingbiofilms were attached to the surfaces of the concrete coupons and were sampled within adesignated surface area. In order to calculate the MPN per cm 2 of concrete coupon surface, theMPN per 100 mL values were first multiplied by the volume of water used in the initial rinse ofthe cotton swab wash (30 mL). It is assumed that the sample of biofilm attached to the cottonswab was negligible in volume compared to the 30 mL of wash water. Finally, the calculatedMPN values were divided by the values for the surface areas sampled on the concrete coupons.The calculated concentrations of total coliform, E. coli, and enterococci in the biofilm samplesare presented in Table 2, and the analysis results for the controls are shown Table 3.
32

Table 2. Fecal indicator bacteria concentrations in MPN/cm2 on concrete coupon surfaces.
Sample Date & Time Sampling Area Total E. coli EnterococciName Sampled Location Sampled olorm 2 (MPN/cm2) (MPN/cm2
ClTOP 8 Jan 2013 11:00 Lorong 8 1.0 6,990 197 16Toa Payoh 1.6,9
C1aBOT 8 Jan 2013 11:00 TPayoh 1.0 390,000 7,140 167
C2TOP 8 Jan 2013 11:30 Lorong 8 1.0 3,390,000 6,330 321Toa Payoh
C3TOP 9 Jan 2013 13:40 Verde View 3.0 7,330 54 4
C3BOT 9 Jan 2013 13:40 Verde View 3.0 341,000 3,180 160
C4TOP 9 Jan 2013 14:45 Crscent 3.0 15,200 613 23
C4BOT 9 Jan 2013 14:45 CcK 3.0 63,000 4,200 411Crescent ______ ______
C5TOP 14 Jan 2013 11:15 ToaPayoh 3.0 199,000 4,500 365
C5BOT 14 Jan 2013 11:15 Lorong6 3.0 120,000 1,730 517______ ____________Toa Payoh 3.12,0 17057
C1TOP2 14 Jan 2013 12:50 Loronayo 3.0 2,850 13 9_________ Toa Payoh 3.2,5
C1TBOT2 14 Jan 2013 12:50 LorPayoh 3.0 3,080,000 11,600 1,610
C2TOP2 14 Jan 2013 12:40 Toa Payoh 3.0 22,800 51 18
C2BOT2 14 Jan 2013 12:40 Lorong 3.0 14,000 11 <1______ ____________Toa Payoh 301,0
C3TOP2 16 Jan 2013 10:18 Verde View 3.0 43,500 60 21
C3BOT2 16 Jan 2013 10:20 Verde View 3.0 420,000 3,150 125
C4TOP2 16 Jan 2013 11:00 Crscent 3.0 105,000 214 30
C4BOT2 16 Jan 2013 11:05 Crescent 3.0 61,300 152 19
C5TOP2 21 Jan 2013 11:20 Lorong 3.0 259,000 3,180 122Toa Payoh 3.25,0 3,812
C5BOT2 21 Jan 2013 11:20 Lorong 3.0 691,000 7,380 69_______ _____________Toa Payoh 306100 7306
C1TOP3 21 Jan 2013 12:25 Toa P 3.0 15,300 40 41____________Toa Payoh 301,0
C1aBOT3 21 Jan 2013 12:25 TPayoh 3.0 155,000 3,930 517
C2TOP3 21 Jan 2013 12:15 Toa P 3.0 10,500 62 8Toa Payoh 301,0
C2BOT3 21 Jan 2013 12:15 Loronayo 3.0 6,200 8 2C9O_2Jn21 10:12____NTU___DrToa Payoh 3.0 6,200C9TOP 22 Jan 2013 10:12 NTU Drain 3.0 44 <1 <1
O9BOT 22 Jan 2013 10:12 NTU Drain 3.0 411 <1 <1
33

Table 3. Fecal indicator bacteria concentrations in MPN/cm 2 for experimental controls.
Sample Date & Sampling Area Total E. coil EnterococciName Sampled Location (cm2 (MPN/cm 2) (MPN/cm2 ) (MPN/cm2
COBLAW 8 Jan 2013 Lorong 8 Toa - 1 <1 <111:00 . Payoh
14 Jan 2013 NTU HydraulicsC6BLAC 15:00 Lab Briefing 3.0 488 1 <1
Room
21 Jan 2013 NTU HydraulicsC11BLAC 9:08 Lab Briefing 3.0 18 <1 <1
Room
22 Jan 2013 NTU HydraulicsC12BLAW 9:30 Lab Briefing - <1 <1 <1
Room
Lorong 8 Toa Payoh was selected for a case study because the most samples over timewere collected at this location. Two concrete coupons were examined at Lorong 8 Toa Payoh, anupstream coupon (C 1), and a downstream coupon (C2), depicted in Figures 9 and 10. Figure 11illustrates the drain in which C2 is located and the tributary where C 1 is located drains into. FIBconcentrations on the coupon surfaces were compared over time and organized by each fecalindicator bacterium analyzed: total colifon, E. coli, and enterococci, demonstrated in Figures 12and 13.
Figure 9. Concrete coupon C1 in the tributary at Lorong 8 Toa Payoh with a vertical concretecoupon upstream to block debris.
34

Figure 10. Coupon C2, located downstream of C1 at Lorong 8 Toa Payoh, with a vertical couponupstream to block debris.
Figure 11. The main drain at Lorong 8 Toa Payoh, where C1 and C2 are located.
35
Cl: Total Coliform
10,000,000 -
1,000,000 -
100,000
10,000
1,000 -
100
10
1
*C1 TopS C1 Bottom
1/6 1/11 1/16Date
1/21 1/26
100,000 7
10,000
E 1,000 -
100 -
10 -
1
Cl: Enterococci
10,000 -
1,000 1E
0.100 -
10 -
1
-+-C1 Top+ C1 Bottom
1/6 1/11 1/16 1/21 1/26
Date
-- C1 TopC1 Bottom
/6 1/11 1/16 1/21 1/26
Date
Figure 12. Fecal indicator bacteria concentrations over time on the top and bottom surfaces of theupstream coupon (Cl) at Lorong 8 Toa Payoh.
36
Cl: E. coli
a.-

C2: Total Coliform
10,000,000
1,000,000
100,000
10,000
C. 1,000
100
10
11/6 1/11 1/16
Date
'"-C2 Top- "C2 Bottom
1/21 1/26
C2: Enterococci
1,000 -
E
a.
100-
10 -
11/6 1/11 1/16 1
Date
--- C2 Top-- C2 Bottom
1/21 1/261/6 1/11 1/16Date
E
n.
10,000 -
1,000
100-
10 -
1
--4 C2 Top--- C2 Bottom
/21 1/26
Figure 13. Fecal indicator bacteria concentrations over time on the top and bottom surfaces of thedownstream coupon (C2) at Lorong 8 Toa Payoh.
4.3 Fecal Indicator Bacteria in Storm Drainage WatersStorm drainage waters associated with the studied biofilms were also sampled between
January 8, 2013 and January 22, 2013. An analysis of these water samples was performed todetermine concentrations of FIB in the stormwater immediately downstream of the concretecoupons in the storm drains. The water samples were analyzed in the laboratory for the same FIBas the biofilm samples: total coliform, E. coli, and enterococci. However, the most representativeMPN per 100 mL results were derived from 1:1, 1:100, and 1:1,000 dilutions and used without
37
i
C2: E coli

adjustments, as demonstrated in Table 4. The pH and temperatures of the water samples weremeasured in the field for 9 out of 11 samples.
Table 4. Fecal indicator bacteria concentrations in MPN/100 mL in storm drainage water.
Sample Date & Sampling Temp. Total Coliform E. coil Enterococci
Name Time Location pH 'C) (MPN/ (MPN/ (MPN/100 mL) 100 mL) 100 mL)
C2WAT1 8 Jan 2013 Lorong8 - - 11,200,000 253,000 4,080________ 11:48 Toa Payoh ________________________
C1WAT1 8 Jan 2013 Lorong8 - - 6,130,000 512,000 15,700________ 12:00 Toa Payoh ________________________
C5WAT1 14 Jan 2013 Lorong 6 7.32 27.1 1,310,000 28,500 3,550_______ 11:15 Toa Payoh I_____ _______________
C2WAT2 14 Jan 2013 Lorong 8 7.33 27.8 1,020,000 5,560 3,550________ 12:38 Toa Payoh __________________
C1WAT2 14 Jan 2013 Lorong 8 8.11 28.2 6,870,000 51,700 15,000_______ 12:38 Toa Payoh ______ __________
C3WAT1 16 Jan 2013 Verde View 7.60 27.0 2,760,000 141,000 100________ 10:15 VreVe .0 2. ,6,0 4,0 0
C4WAT1 16 Jan 2013 CCK 8.17 26.9 1,270,000 48,800 2,990________ 10:55 Crescent __ ___ _____
C5WAT2 21 Jan 2013 Lorong6 7.49 26.7 809,000 16,600 1,733________ 11:10 Toa Payoh __ ___ _____
C2WAT3 21 Jan 2013 Lorong 8 7.39 20.3 155,000 3,930 517_______ 12:12 Toa Payoh _______________
C1WAT3 21 Jan 2013 Lorong 8 8.13 27.5 441,000 3,110 2,880_______ 12:23 Toa Payoh _______________
C9WAT1 22 Jan 2013 NTU Drain 7.25 25.0 13,800 921 1,710_________ 10:09__ _ _ _ _ _ __ _ _ _ _ _ __ _ _ _ _ _ _ _ _ _
Lorong 8 Toa Payoh is revisited as a case study for the concentrations of FIB in stormdrainage water associated with the upstream coupon (Cl) and downstream coupon (C2). Figures14 and 15 compare total coliform, E. coli, and enterococci MPN/100 mL observed over time.
38

Upstream at C1
10,000,000 -
1,000,000 -
100,000 -
10,000 -
1,000 -
100-
10-
11/6 1/11 1/16
Date
1/21
-+-C1 Total Coliform
-in-C1 E. coli
,ir-C1 Enterococci
1/26
Figure 14. Fecal indicator bacteria concentrations over time in the stormwater immediatelydownstream of the upstream coupon (Cl) at Lorong 8 Toa Payoh.
Downstream at C2
100,000,000 -
10,000,000 -
1,000,000 -
100,000 -
10,000 -
1,000 -
100 -
10 -
1
-+-C2 Total Coliform-i0-C2 E. coli
"-C2 Enterococci
1/6 1/11 1/16Date
1/21 1/26
Figure 15. Fecal indicator bacteria concentrations over time in the stormwater immediatelydownstream of the downstream coupon (C2) at Lorong 8 Toa Payoh.
39
-'E
z0.
-jE0
4.4 Relationships Between Biofilms and Storm Drainage WatersThe FIB concentrations on the coupon surfaces were compared with the FIB
concentrations in the storm waters. These measurements were taken at the same locations andtimes. Figures 16 through 18 compare the concentrations of FIB in stormwater withconcentrations on the tops and bottoms of concrete coupons.
Total Coliform
1.E+07
1.E+06
1.E+05
08= 1.E+040
o 1.E+03C
* 1.E+02
L 1.E+01
1.E+001 E+00
U
*Top
1 E+01 1 E+02 1 E+03 1 E+04 1 E+05 1 E+06 1 E+07 1 E+08Concentration in Stormwater (MPN/100 mL)
Figure 16. Total coliform concentrations in stormwater and on coupon surfaces.
40

1.4E+04 -E
1.2E+04 -
1.OE+04 -
08.OE+03 -
0
6.OE+03 *Topo MBottom0 4.OE+03 11
y 2.OE+03 -
8 O.OE+00O O.OE+00 1.OE+05 2.OE+05 3.OE+05 4.OE+05 5.OE+05 6.OE+05
Concentration in Stormwater (MPN/100 mL)
Figure 17. Escherichia coli concentrations in stormwater and on coupon surfaces.
Figure 18. Enterococci concentrations in stormwater and on coupon surfaces.
41
E. coli

4.5 LimitationsSeveral limitations arise from the laboratory procedures and calculation methods used. In
the fecal indicator bacteria laboratory analysis, human errors were likely to occur. When theQuanti-Tray/2000@ sample trays were sealed, some wells contained more liquid than others dueto the presence of air bubbles. On two occasions, one well of the Quanti-Tray/2000@ sample traywas empty of fluid due to unusually large air bubbles. In the cases where a well was empty, thewell was counted as negative for bacteria presence unless all other wells were counted aspositive. Additionally, errors could occur in counting the number of colored or fluorescing wells,as there was a spectrum of color and fluorescence intensity and only visual comparisons with theIDEXX standards were performed.
In the calculation of the MPN per 100 mL for four of the samples (total coliform analysesof ClBOT3 and C1WAT3, and E. coli analyses of C5WAT2 and C1WAT3), a value that wasnot the most representative out of each sample's three dilutions (1:1, 1:100, or 1:100,000 forstormwater, and 1:10, 1:1,000, or 1:10,000,000 for biofilms) was selected by following theenumeration methods specified by IDEXX for the use of the MPN conversion tables. However,these values indicated by the IDEXX procedure were considered not the most representativebecause the selected values, from the set of results for the three dilutions completed for eachsample, had the greatest ranges for the confidence intervals. A value with the smallest confidenceinterval is considered most representative. The MPN-per-100-mL values for the four samplesused in the final analysis were instead selected as larger MPN-per-100-mL values of the dilutionswith smaller confidence intervals. The four samples were analyzed from the field samplescollected on January 21, 2013 at Lorong 6 Toa Payoh and Lorong 8 Toa Payoh.
42
5 Analysis and Interpretation
5.1 Biofilm StructureFrom the visual examination of biofilm samples, it is clear that the biofilm is varied in
structure and composition. The organic matter observed with light microscopy in the biofilmlikely provides nutrients and shelter to microorganisms living within the biofilm. By observing amore detailed structure using gram staining, gram-positive and gram-negative bacteria areobserved to attach to the larger structures of the biofilm. Some of the structures present withinthe biofilm sample appear to be very similar to some attached algae depicted in Figure 19, whichis Plate II from Algae and Water Pollution (USEPA 1977). A more detailed examination of thebiofilm with fluorescence microscopy confirms the presence of bacteria clusters within thebiofilm. These clusters of bacteria indicate that certain parts of the biofilm are more favorable forgrowth than others, and the bacteria may be multiplying at those locations.
5.2 Fecal Bacteria Concentrations in Biofilms and Storm Drainage WatersA comparison of concentrations of fecal indicator bacteria (FIB) over time illustrates the
environmental variability for both the biofilm and the stormwater. By examining theconcentrations of FIB over 2 to 3 days on the coupons at Lorong 8 Toa Payoh, threeinterpretations can be made.
The first interpretation is that there is a clear variation over time, as each measurement ofthe concentrations of FIB increases or decreases compared to the previous measurement (Figures12 through 15). The high variation is likely due to large fluctuations in stormwater flows withprecipitation events, which cause erosion and sloughing of biofilm from the storm drain surface.As most of the ground at Lorong 8 Toa Payoh is covered with impervious materials, such aspavement and concrete, any rain will quickly be transported to the storm drains. At the upstreamcoupon (C1), the stormwater flows are smaller in magnitude than the downstream coupon (C2)because the drain in which C I was placed joins the larger drain where C2 was located. Thestormwater flow above C1 on a typical day in March 2013 was measured to be 67 cubiccentimeters per second (Alkaff, 2013). Many intense rainstorms were observed betweensampling times, so that high frequency may contribute to the generally decreasing concentrationsover time of FIB on the downstream coupon C2 (Figure 13) while the concentrations of FIBobserved on the upstream coupon C1 (Figure 12) did not decrease between the first sample dayand the last sample day. The concentrations of FIB in the stormwater at C 1 and C2 (Figures 14and 15) did not fluctuate much over time, but did follow a generally decreasing trend over time.The decrease in FIB concentration in the stormwater over time could likely be due to dilutioneffects as fresh rainwater runoff mixes with the storm drainage water. However, all measuredbiofilm FIB concentrations at Lorong 8 Toa Payoh during January 2013 were greater than thoseobserved on unused "clean" coupons.
43

ATTACHED ALGAE
Figure 19. Examples of attached algae (USEPA 1977).
44
A further analysis of these trends focuses on the individual FIB types that were analyzed.On both the coupons and in the storm drainage waters, the concentrations of total coliform werethe greatest and the concentrations of enterococci were the least. The concentrations ofEscherichia coli were in the middle of the range of FIB concentrations. This makes sensebecause E. coli is a subset of fecal coliforms. By observing the gram-stain photograph at 1000xmagnification in Figure 6 (a), most of the biofilm material is stained red, indicating gram-negative cell dominance in the biofilm structure. As total coliform and E. coli are gram-negativebacteria, the measured concentrations correspond well with what was visually observed.
Finally, for the upstream coupon (Cl) at Lorong 8 Toa Payoh, the measuredconcentrations of FIB on the top surface were always less than those measured on the bottomsurface. The upstream location at C1 had relatively lower stormwater flows than the downstreamlocation at C2, and occasionally the top surface of the coupon at Cl was not submerged instormwater. Also, the bottom surface of a coupon provided shelter to biofilm because low flowsof stormwater passed between the coupon and the storm drain surface and sunlight did not reachthe bottom surface. These factors are in favor of bacteria survival and less detachment of biofilmon a coupon bottom. However, for the downstream coupon (C2), the measured FIBconcentrations on the bottom surface were less than the FIB concentrations on the top surface.This result suggests that up to a threshold, the surface of a coupon that is always submerged inthe stormwater encounters more bacteria, leading to a better-developed biofilm. Severalenvironmental factors such as stormwater flow rate, temperature, and sunlight could contribute tothe threshold above which the shelter the bottom surface provides biofilm is not advantageous inbacterial survival over the top surface environment.
5.3 Biofilm Detachment to Storm Drainage WaterBiological, chemical, and physical processes control the development of a biofilm
(Picioreanu et al. 2001). For a biofilm in a stormwater drain, bacteria are transported to the drainsurface, attach to the drain surface or existing biofilm, detach from the biofilm, and are generatedby cell growth. As bulk stormwater containing fecal bacteria flows over a stationary biofilm,some fecal bacteria may attach to the exposed biofilm surface while the remaining fecal bacteriacontinue on downstream in the bulk flow. Correspondingly, fecal bacteria may detach from thebiofilm either from the biofilm surface or from some depth in the biofilm as a cluster and join thebulk flow. The difference between attachment and detachment contributes to the development ofa biofilm on the storm drain surface in addition to the in situ growth of bacteria cells in thebiofilm. If the biofilm system operates as a steady-state system, the biofilm volume will beconstant over time despite the gains and losses of bacteria.
Bacteria attachment to a biofilm is assumed to occur by virtue of the fact that a biofilmhas developed in the drain. A bioflim grows as bacteria attach to the drain surface and eventuallythe biofilm can reach a steady-state thickness as more microorganisms are attached to theexisting biofilm and grow than are lost from the biofilm. The mechanisms of biofilm detachmentare more complex than biofilm attachment. As stormwater moves across the biofilm surface,internal stress is created on the biofilm and detachment occurs (Picioreanu et al. 2001). Biofilmdetachment is illustrated in Figure 20. The detachment of bacteria from biofilms may be due toshearing forces increasing in the water, starvation of the bacteria, or a colonization strategy(Hall-Stoodley and Stoodley 2005). The major mechanisms for biofilm detachment are abrasion,
45

erosion, grazing, and sloughing (Rittmann 1989). Abrasion and grazing are neglected in thisanalysis.
Biofilm can detach from a surface by erosion (Rittmann and McCarty 2001). Biofilmerosion is a continuous process that occurs due to shear stress on the biofilm. High turbulencecauses perpendicular forces on the biofilm surface causing pieces of biofilm to detach from thesurface of the biofilm. Single cells or a small number of cells are removed from a biofilm surfaceduring erosion (Stewart 1993). The specific biofilm-detachment loss coefficient for erosion canbe calculated quantitatively for fixed media.
LfEl
I bulkfluidflowbiofilm *
Figure 20. Detachment of a biofilm particle to the bulk fluid flow (Stewart 1993).
Sloughing is an important parameter in the operation of biological wastewater treatmentsystems (Elenter 2007). Biofilm sloughing occurs whether fluid shear is constant or increasingand can occur within hours after biofilm development. Biofilm detachment can be modeled inseveral ways. One-dimensional surface detachment, one-dimensional volume detachment, multi-dimensional fracture mechanics, multi-dimensional decay, and multi-dimensional erosion havebeen used in the literature to model detachment of biofilm. In this research, a simple one-dimensional surface detachment model was used to examine biofiln detachment from concretecoupon surfaces to the overlying stormwater.
Trickling filters are used in biological wastewater treatment for biochemical oxygendemand (BOD) oxidation (Rittmann and McCarty 2001). Wastewater is distributed over a filterconsisting of plastic packing or rocks (Metcalf and Eddy 2003). Biofilms develop on the mediaof the filter and can consist of microorganisms such as facultative bacteria, algae, protozoa, andothers. As the environmental conditions of the filter change, there occur sloughing events inwhich pieces of biofilm detach (Rittmann and McCarty 2001). A sloughing event is when thebiofilm structure breaks down and detaches from the packing. Tricking filter effluent has beenseen to contain more BOD and total suspended solids after sloughing occurs (Hawkes 1963).Sloughing is not often studied quantitatively because the mechanism of sloughing is difficult toquantify.
46
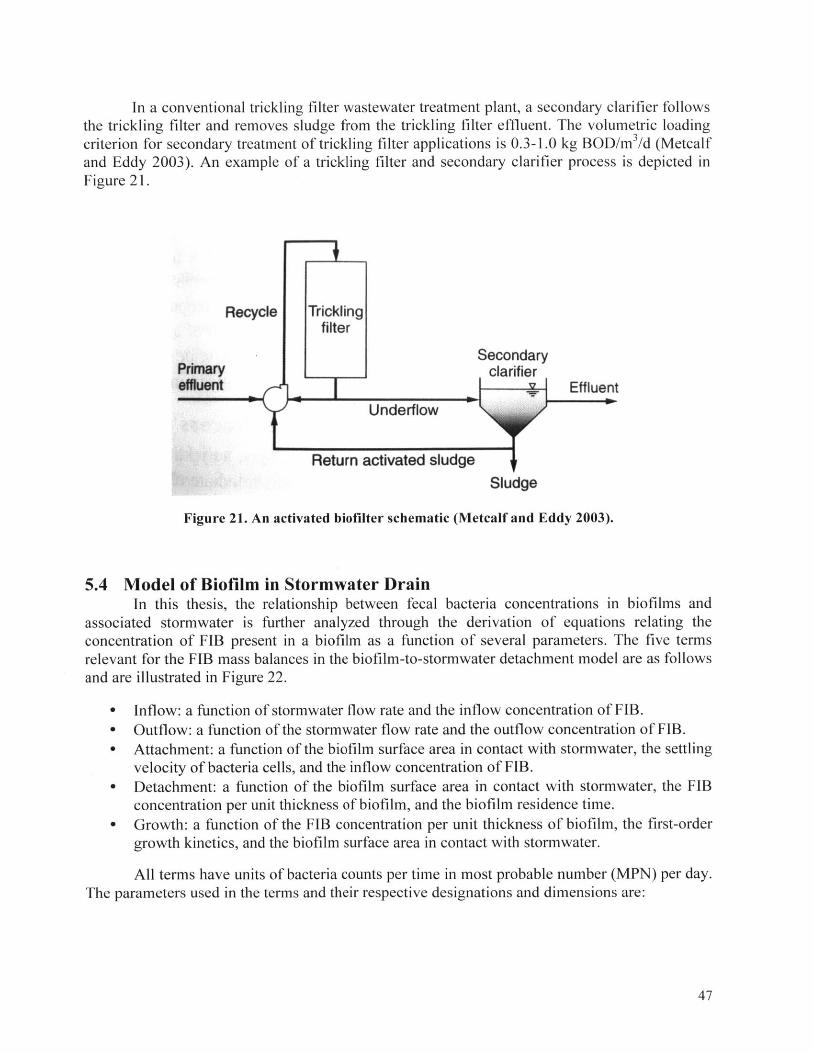
In a conventional trickling filter wastewater treatment plant, a secondary clarifier followsthe trickling filter and removes sludge from the trickling filter effluent. The volumetric loadingcriterion for secondary treatment of trickling filter applications is 0.3-1.0 kg BOD/hn 3/d (Metcalfand Eddy 2003). An example of a trickling filter and secondary clarifier process is depicted inFigure 21.
Recycle
Peiunaryefltt /-
Secondary
Effluent
Return activated sludge #Sludge
Figure 21. An activated biofilter schematic (Metcalf and Eddy 2003).
5.4 Model of Biofilm in Stormwater DrainIn this thesis, the relationship between fecal bacteria concentrations in biofilms and
associated stormwater is further analyzed through the derivation of equations relating theconcentration of FIB present in a biofilm as a function of several parameters. The five termsrelevant for the FIB mass balances in the biofilm-to-stormwater detachment model are as followsand are illustrated in Figure 22.
- Inflow: a function of stormwater flow rate and the inflow concentration of FIB.
e Outflow: a function of the stormwater flow rate and the outflow concentration of FIB.e Attachment: a function of the biofilm surface area in contact with stormwater, the settling
velocity of bacteria cells, and the inflow concentration of FIB.- Detachment: a function of the biofilm surface area in contact with stormwater, the FIB
concentration per unit thickness of biofilm, and the biofilm residence time.- Growth: a function of the FIB concentration per unit thickness of biofilm, the first-order
growth kinetics, and the biofilm surface area in contact with stormwater.
All terms have units of bacteria counts per time in most probable number (MPN) per day.The parameters used in the terms and their respective designations and dimensions are:
47
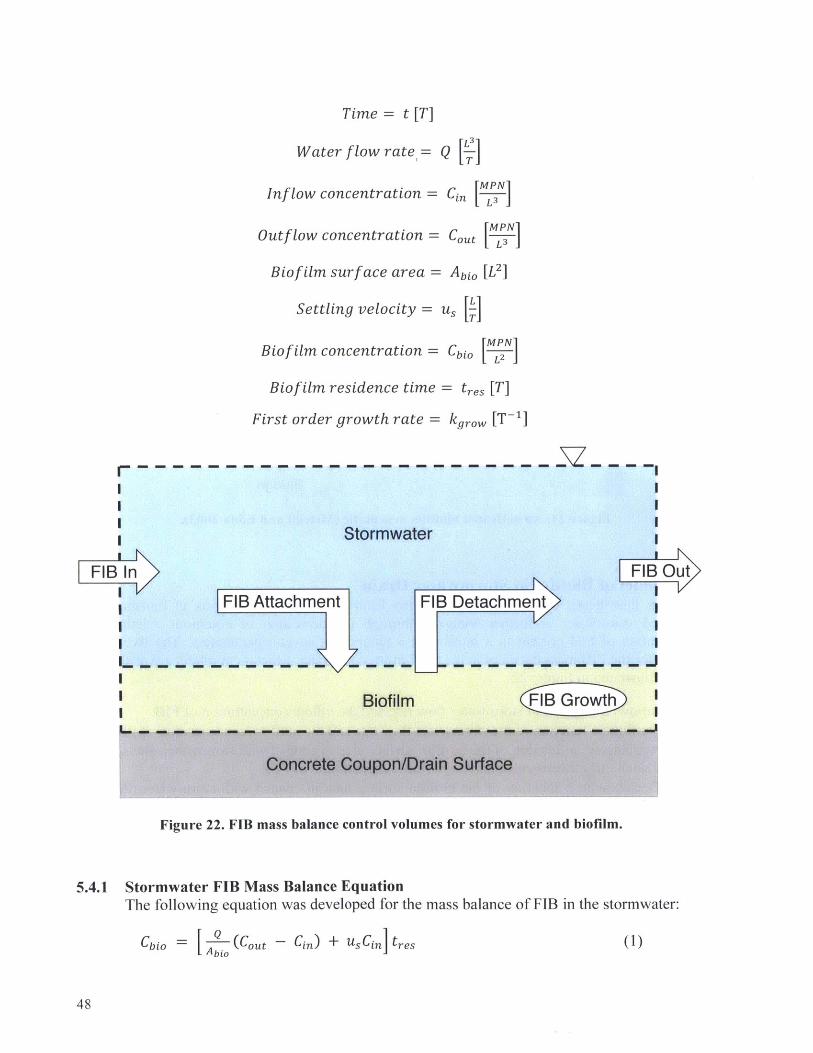
Time = t [T]
Water flow rate = Q
Inflow concentration = CL 3 I
Outflow concentration = Cut ['N7
Biofilm surface area = Abio [L2]
Settling velocity = us I]
Biofilm concentration = Cbio [Biofilm residence time = tres [T]
First order growth rate = kgrow [T-1]
Stormwater
FIB Attachment F1
Biofilm
FIB Out
Detachment
FI rowth
Figure 22. FIB mass balance control volumes for stormwater and biofilm.
5.4.1 Stormwater FIB Mass Balance EquationThe following equation was developed for the mass balance of FIB in the stormwater:
CbiO = [ A2- (C0 Ut - Cin) + UsCin tresAbioI
(1)
48
r" " " " ~ ~ ~ ~ " " " " ~ ~ ~
FIB In
Below is the derivation of equation (1) for FIB in the stormwater. The overall mass balance forthe water column considers the following mass fluxes:
(Inflow) - (Attachment) + (Detachment) = (Outflow) (2)
(QCin) - (AbiousCin) + (AbL~ci*) = QCout) (3)
Rearranging equation (3) yields:
AbioCbio Q C0 ut - QCin + AbiousCin (4)tres
Equation (1) is the result of solving equation (4) for Cbi.. The stormwater FIB mass balance isnot examined further because Cout data was not collected in this research.
5.4.2 Biofim FIB Mass Balance EquationLikewise, equation (5) was developed for the mass balance of FIB in the biofilm:
CbL~t= CLOo (kyrow - 1) t + ( 1rwL [(kgrow -i;1; t - i S~ 5Cbio,t = Cbjo,0 e( t'""~kgr + - ,- [ '"T~es) -1 Us cin (5)"rwtres)
Note that the biofilm concentration, Cbio, is in terms of mass per unit area while the water-column concentrations, Cin and Cout, are in terms of mass per unit volume. Equation (5) for FIBin the biofilm is derived as follows.
(Rate of bacteria biomass change with time) =
(Attachment rate) - (Detachment rate) + (Growth rate) (6)
(Abio = (AbiousCin) (Abiocbi*)+(kgrowCbioAbio) (7)
dt = uscin - + kgrowCbjo (8)
= uscin + (- + kgrow)Cbio (9)dt te
= (kgrow - 1LCo + usCin (10)
Equation (10) is a first-order linear ordinary differential equation and Cbi. is a function of time.
The relationship krow - Cbio + usCin) = (kgrow - 1 ) (cbio) is only valid if Cia isdt [( r ire2.) trs G---(k
assumed to be constant over time. Equation (10) is rearranged as followed to derive equation (5):
( dCd= / 1 (11)kgrow - I )Cbio + usCin]
( dCba'f I dti + s' n dt = fo' dt (12)
[(kgrow - Tr-)ci+ucf]
49

By integrating equation (12), a constant of integration (C) is introduced, as shown in equation(13).
n[(kgrow Cbiot + UsCin]1n1krw- r-s)+ C =t (13)(kgrow - r-e
Equation (13) is simplified to equation (15) by substituting in the following variable:
k= kgrow - 1 (14)tres
l ln(k'CtO,t + usCin) + C = t (15)
The initial condition CbjO(t = 0 days) = CiO,o is introduced in equation (16) to determine thevalue of the constant of integration (C).
I ln(k'COLOo + usCin) + C = 0 (16)
Simplifying equation (16) results in equation (17), the expression for C.
C = - 1 ln(k'CjO,O + usCin) (17)
Equation (17) is substituted into equation (15) to give equation (18).
In(k'Co,t + usCin) + [- 1 n(k'COO + usCi,) = t (18)
Equation (18) is simplified and solved for Cbio,t in equation (19).
Cbio,t = CbjOo ek't + 1 usCin(ek't - 1) (19)
The expression in equation (14) is substituted into equation (19) to derive equation (5).
5.4.3 Parameter DesignationSeveral parameters require further definition: the settling velocity, the biofilm residence
time, and the first-order growth rate.
5.4.3.1 Settling VelocityThe settling velocity was estimated using Stokes' law. In Stokes' law, the settling
velocity of a particle (or bacteria cell) is reached as the drag force and the buoyant force on aparticle balance the force caused by gravity. Stokes' law is given as follows in equation (20):
(,)( " -1)r2)
Us= "'water (20)
The mean water sample temperature was 26.3 ± 2.4 'C, so a value of 26.3 *C was used asthe environmental temperature in the calculation of the settling velocity. The density of water,Pwater, is estimated to be 996.7055 kg/m3 at 26.3 *C (Haynes 2013). At 300 K (or 26.9 "C), thekinematic viscosity of water, Vwater, is estimated to be 8.5669x 10⁻⁷ m2/s.
50
The bacteria included in the total coliforms group are generally rod-shaped. E. coli cellsare rod-shaped, while enterococci are spherical. Bacteria have an average length of 1-2 pm or anaverage diameter of 0.5-1 pm (Maier, Pepper, and Gerba 2009). Therefore, in assuming thatbacteria cells are spherical to simplify calculations and considering 1 pm to be an averagediameter, the radius of a bacteria cell is approximately 0.5 pm or 5x10⁻⁷ m. The volume of abacteria cell is calculated using the radius value to be 0.52 prm3 or 5.2x10.19 M3 . The mass of asingle E. coli cell is 9.5x10⁻¹³ g or 9.5x10⁻¹⁶ kg (Neidhardt 1996). As a result, the density of amodel bacteria cell is approximately 1.8x 10³ kg/m 3. The setting velocity is thus:
u, = 5.13x10- = 4.4x10-s d
5.4.3.2 Biofiln Residence TimeAn average solids residence (or retention) time is applicable to a steady-state biofilm
(Rittmann and McCarty 2001). The solids residence time is the ratio of the active biomass in thebiofilm to the active biomass production rate, averaged over an entire biofilm. Simplified, thesolids residence time is the inverse of the biofilm specific detachment rate. The biofilmdetachment rate depends on the water shear stress on the biofilm surface. The biofilm residencetime was estimated to equal a common value for an aeration basin solids residence time (Daiggerand Boltz 2011). The value is a typical design criterion for a roughing filter and activated sludgeprocess. Therefore:
tres ~ 8.0 days
5.4.3.3 First-Order Growth Kinetics Rate FactorThe first-order growth rate of fecal indicator bacteria in a biofilm was estimated from
biofilm model studies. Horn et al. (2003) used a mean maximum growth rate of 5 per day forheterotrophic biofilm and this value is assumed to be sufficient for this study's purposes. Thus:
kgrow ~ 5 day~1
5.4.4 SolutionThe equation for FIB mass balance within the biofilm becomes equation (21). The values
of the parameters were substituted into the equation with the following units: Cbio,t and Cbio,o inMPN/cm 2, t in days, and Cin in MPN/100 mL.
Cbio,t = Cbio,oe 4 . 75 t + (9.026x10⁻³)(e 4 .8 7 5 t - 1)Cin (21)
In equation (21), the growth of FIB in biofilm dominates the detachment of FIB from thebiofilm. Without occasional erosion and sloughing events, the growth in the biofilm would beunlimited. By examining the relationship between the stormwater total coliform concentration inMPN/100 mL and the biofilm total coliform concentration in MPN/cm 2, one sees that the valuesfor the biofilm concentrations increase and exceed the values for the stormwater concentrationswithin a few days. If Cbio,t is to be less than Cia in equation (21), the timescale t must a fraction ofa day.
51


6 Summary, Conclusions, and Recommendations
6.1 SummaryIn this research, three fecal indicator bacteria (FIB), total coliform, Escherichia coli, and
enterococci, were measured once per week in biofilms and storm drainage waters at six locationsin Singapore. Well-developed biofilm conditions were observed at Choa Chu Kang Crescent,Verde View, Lorong 6 Toa Payoh, and two points in Lorong 8 Toa Payoh. An initial biofilmgrowth condition was observed for a secondary study at Nanyang Technological University. Allsamples were collected between January 8, 2013 and January 22, 2013. The main objectives ofthe research were to conclude if biofilms are reservoirs for FIB, to measure FIB over time withinbiofilms and stormwater, and to examine the relationships between FIB in biofilms and FIB instormwater. All three of the original objectives were accomplished in this research and aided inthe development of a model for FIB in storm drain biofilms.
6.2 ConclusionsThe biofilms in storm drains were observed to be reservoirs for FIB. In all of the samples
taken from the well-developed biofilms, total coliform, E. coli, and enterococci concentrationswere countable and prominent. The analysis confirms what Ekklesia observed previously inSingapore storm drains (2012). As debris and sediments were commonly observed in the stormdrains, the additional structure, nutrients, and protection these provided to biofilms promotessurvival of microorganisms. The analysis supports the conclusions of studies of sediment biofilmbehavior in various aquatic environments, particularly studies of beach sand and beach wrack. Inthose studies, beach sand and beach wrack were found to be reservoirs for fecal bacteria becausethese media were observed to prolong fecal bacteria survival (Craig et al. 2002a; Alm et al. 2003;Lee et al. 2006; Hartz et al. 2008; and Imamura et al. 2011). The presence of FIB within biofilmsindicates that sewage leakage may not be the only pathway of stormwater contamination.
The measured FIB concentrations fluctuated over time in both the biofilm and the stormdrainage waters during the three weeks of observation. These changes could be due to processeswithin the biofilms or phenomena in the storm drain environment. The concentrations of FIB inbiofilms could change over time due to the natural growth and death processes of bacteria. FIBconcentrations could increase as bacteria deposit from the overlying stormwater and attach to thebiofilm surface. Otherwise, the stormwater could inflict shearing and erosion on the biofilmduring high stormwater flows, leading to decreases in FIB concentrations.
The detachment of bacteria from biofilms is a likely pathway for FIB contamination ofstormwater. Greater fluctuations in FIB concentrations in biofilms than in storm drainage watersindicate that the stormwater is more stable and has additional sources of FIB contributing to thecontamination. However, with a preliminary model of FIB detachment from biofilms to stormdrainage waters, the biofilms may be significant, at least locally, in contributing to bacteriacontamination in the stormwater drainage system. Nevertheless, the results confirm poorstormwater quality and that fecal contamination can originate from within the storm drains.
6.3 Recommendations for Future WorkFor future studies of the contamination of storm drainage waters by fecal bacteria that
originate from within the storm drains, I would suggest both detailed research in biofilms andexpanding the research to other locations.
53

First, the environment of the storm drain can be better characterized. Relationshipsamong observed FIB concentrations with parameters such as temperature, pH, and salinity mayprovide better insight into why certain locations within the drains have different types andquantities of biofilm growth. The biofilms present in different storm drains can be visuallyexamined for comparisons as well. As only one biofilm sample from Lorong 8 Toa Payoh wasexamined, the observations were assumed to be applicable to all samples collected, even thoughthey were collected from different locations. Further research would involve the confirmation ofthis assumption that all the biofilms in Singapore are essentially the same for the purposes of theproject. The research might involve determining different methods for examination, such asalternative microscopy techniques or using biofilm and algae field guides. Other fecal indicatorssuch as fecal Bacteroides can be pursued in an equivalent research project. By examining otherfecal indicators, the results observed in the research can be reinforced or expanded.
Another area requiring further studies is to produce more detailed time series of FIBconcentrations at a single point and correspond those with stormwater flow measurements.Biofilms can be sampled more frequently over time, such as over a 12-hour period so that theopportunity to record multiple rain events and the resulting effects observed in the storm drainmay arise. Alternatively, multiple locations along a storm drain can be sampled during arelatively short period to better examine upstream influences on the downstream environment.By visiting a well-studied location, such as at Lorong 8 Toa Payoh, more biofilm and stormwatersampling points could be added for this research. Therefore, more detailed contributions of eachtributary into the main drain or other features of the drain, such as leaks, can be determined.
Finally, the research can be expanded to encompass other sampling locations aroundSingapore. More detailed studies can be focused within single neighborhoods such as Toa Payohor Choa Chu Kang, or more sampling locations can be investigated in other districts ofSingapore. The study can also encompass samples at locations within the Charles River basin inMassachusetts, U.S.A.
54
References
Alkaff, S. (2013). Personal communication.
Alm, E.W., J. Burke, and A. Spain, 2003. Fecal indicator bacteria are abundant in wet sand atfreshwater beaches. Water Research. Vol. 37, No. 16, Pg. 3978-3982. September 2003.
ASM, 2013. Gram Stain Protocols. Microbe Library. American Society for Microbiology.Retrieved from http://www.microbelibrary.org/component/resource/gram-stain/2886-gram-stain-protocols, 24 April 2013.
Balzer M., N. Witt, H.-C. Flemming, and J. Wingender, 2010. Faecal indicator bacteria in riverbiofilms. Water Science and Technology. Vol. 61, No. 5, Pg. 1105-1111.
Barcina, I., P. Lebaron, and J. Vives-Rego, 1997. Survival of allochthonous bacteria in aquaticecosystems: a biological approach. FEMS Microbiology Ecology. Vol. 23, No. 1, Pg. 1-9.May 1997.
Batte M., C. Feilers, P. Servais, V. Gauthier, J.-C. Joret, and J.-C. Block, 2006. Coliforms andother microbial indicators occurrence in water and biofilm in full-scale distributionsystems. Water Science and Technology. Vol. 54, No. 3, Pg. 41-48.
Bonilla, T.D., K. Nowosielski, M. Cuvelier, A. Hartz, M. Green, N. Esiobu, D. McCorquodale, J.Fleishner, and A. Rogerson, 2007. Prevalence and distribution of fecal indicatororganisms in South Florida Beach Sand and preliminary assessment of health effectsassociated with beach sand exposure. Marine Pollution Bulletin. Vol. 54, Pg. 1472-1482.
Burton, G.A., D. Gunnison Jr., and G.R. Lanza, 1987. Survival of pathogenic bacteria in variousfreshwater sediments. Applied and Environmental Microbiology. Vol. 53, Pg. 633-638.
Byappanahalli, M., M. Fowler, D. Shively, and R. Whitman, 2003. Ubiquity and persistence ofEscherichia coli in a Midwestern coastal stream. Applied and EnvironmentalMicrobiology. Vol. 69, No. 8, Pg. 4549-4555. August 2003.
Castonguay, M.-H., S. van der Schaaf, W. Koester, J. Krooneman, W. van der Meer, H.Harmsen, and P. Landini, 2006. Biofilm formation by Escherichia coli is stimulated bysynergistic interactions and co-adhesion mechanisms with adherence-proficient bacteria.Research in Microbiology. Vol. 157, Pg. 471-478. 2006.
Chen, D.C., C. Maksimovic, and N. Voulvoulis, 2011. Institutional capacity and policy optionsfor integrated urban water management: a Singapore case study. Water Policy. Vol. 13,Pg. 53-68.
Ching, L., 2010. Eliminating 'Yuck': A Simple Exposition of Media and Social Change in WaterReuse Policies. International Journal of Water Resources Development. Vol. 26, No. 1,Pg. 111-124.
55
Chowdhury S., 2012. Heterotrophic bacteria in drinking water distribution system: A review.Environmental Monitoring and Assessment. Vol. 184, No. 10, Pg. 6087-6137. October2012.
Chua, L.H.C., P. Shanahan, E.Y.M. Lo, E.B. Shuy, J. Thompson, C.C. Dixon, K.B. Kerigan, J.P.Nshimyimana, J.M. Yeager, L.J. Lee, and Y.L. Por, 2010. Dry weather bacteriamonitoring and variation with land use for Kranji reservoir catchment, Singapore. 7thCongress of the Asia and Pacific Division of the International Association of HydraulicEngineering and Research, Auckland, New Zealand.
Converse, R.R., A.D. Blackwood, M. Kirs, J.F. Griffith, and R.T. Noble, 2009. Rapid QPCR-based assay for fecal Bacteroides spp. as a tool for assessing fecal contamination inrecreational waters. Water Research. Vol. 43, Pg. 4828-4837.
Craig, D.L., H.J. Fallowfield, and N.J. Cromar, 2002a. Enumeration of faecal coliforms fromrecreational coastal sites: Evaluation of techniques for the separation of bacteria fromsediments. Journal ofApplied Microbiology. Vol. 93, Pg. 557-565.
Craig, D.L., H.J. Fallowfield, and N.J. Cromar, 2002b. Comparison of decay rates of faecalindicator organisms in recreational coastal water and sediment. Water Science andTechnology: Water Supply. Vol. 2, No. 3, Pg. 131-138.
Craig, D.L., H.J. Fallowfield, and N.J. Cromar, 2004. Use of microcosms to determinepersistence of Escherichia coli in recreational coastal water and sediment and validationwith in situ measurements. Journal ofApplied Microbiology. Vol. 96, Pg. 922-930.
Cunningham, A.B., J.E. Lennox, and R.J. Ross, 2008. What are biofilms? The BiofilmsHypertextbook. Retrieved from http://www.hypertextbookshop.com/biofilmbook/v004/r003/index.html, 7 December 2012.
Daigger, G.T. and J.P. Boltz, 2011. Trickling filter and trickling filter-suspended growth processdesign and operation: A state-of-the-art review. Water Environment Research. Vol. 8,No. 5, Pg. 388-404.
Davies, C.M., J.A.H. Long, M. Donald, and N. Ashbolt, 1995. Survival of fecal microorganismsin marine and freshwater sediments. Applied and Environmental Microbiology, Vol. 61,Pg. 1888-1896.
Doshi, J., 2012. An investigation of leaky sewers as a source of fecal contamination in thestormwater drainage system in Singapore. Master of Engineering Program, Departmentof Civil and Environmental Engineering, Massachusetts Institute of Technology,Cambridge, Massachusetts. June 2012.
Ekklesia, E., 2011. Identification of Suitable Indicators for Tracing Human Fecal Contaminationand Sewage in Urban Catchments. Confirmation of Candidature Report, Department ofCivil and Environmental Engineering, Nanyang Technological University, Singapore.
Ekklesia, E., 2012. Personal communication. 2012.
56

Elenter, D., K. Milferstedt, and W. Zhang, 2007. Influence of detachment on substrate removaland microbial ecology in a heterotrophic/autotrophic biofilm. Water Research. Vol. 41,Pg. 4657-4671. 19 June 2007.
Elhariry H., Y. Gherbawy, B. El-Deeb, and A. Altalhi, 2012. Molecular identification andbiofilm-forming ability of culturable aquatic bacteria in microbial biofilms formed indrinking water distribution networks. Geomicrobiology Journal. Vol. 29, No. 6, Pg. 561-569.
Ferguson, D.M., Y. Cao, and J.F. Griffith, 2011. Use of concrete coupons to assess attachment,growth and diversity. of Enterococcus in storm drains. American Society forMicrobiology. May 2011.
Flint, K.P., 1987. The long-term survival of Escherichia coli in river water. Journal ofAppliedBacteriology. Vol. 63, Pg. 261-270.
FMSA, 1999. Beach Wrack. Gulf of the Farallones Marine Sanctuary Association. SanFrancisco, CA. Retrieved from http://www.farallones.org/documents/education/beachwrack_1.pdf, 7 December 2012.
Granger, E.C., 2010. Water quality modeling in Kranji Catchment. Master of EngineeringProgram, Department of Civil and Environmental Engineering, Massachusetts Institute ofTechnology, Cambridge, Massachusetts. June 2010.
Google Maps, 2013. Google Maps. Retrieved from https://maps.google.com, 30 April 2013.
Haberkorn, H., H. Hegaret, D. Marie, C. Lambert, and P. Soudant, 2011. Flow cytometricmeasurements of cellular responses in a toxic dinoflagellate, Alexandrium minutum,upon exposure to thermal, chemical and mechanical stresses. Harmful Algae. Vol. 10,No. 5, Pg. 463-471.
Hall-Stoodley, L. and P. Stoodley, 2005. Biofilm formation and dispersal and the transmission ofhuman pathogens. Trends in Microbiology. Vol. 13, No. 1, Pg.7-10. January 2005.
Hartz, A., M. Cuvelier, K. Nowosielski, T.D. Bonilla, M. Green, N. Esiobu, D.S. McCorquodale,and A. Rogerson, 2008. Survival Potential of Escherichia coli and Enterococci inSubtropical Beach Sand: Implications for Water Quality Managers. Journal ofEnvironmental Quality. Vol. 37, No. 3, Pg. 898-905. May 2008.
Hawkes, H.A., 1963. The Ecology of Waste Water Treatment. The Macmillan Co., New York,Pg. 82-99.
Haynes, W.M., 2013. CRC Handbook of Chemistry and Physics, 9 3 rd Edition (Internet Version2013). CRC Press/Taylor and Francis, Boca Raton, FL. Retrieved fromhttp://www.hbcpnetbase.com, 30 April 2013.
Horn, H., H. Reiff, and E. Morgenroth, 2003. Simulation of growth and detachment in biofilmsystems under defined hydrodynamic conditions. Biotechnology and Bioengineering.Vol. 81, No. 5. 5 March 2003.
57
IDEXX, 2011. IDEXX Instructions. Retrieved from http://www.idexx.com/view/xhtml/enus/water/quanti-tray.jsf, 7 December 2012.
IDEXX, 2012a. Colilert-18@ Package Insert. IDEXX Laboratories, Inc., Westbrook, Maine.
IDEXX, 2012b. EnterolertTM Package Insert. IDEXX Laboratories, Inc., Westbrook, Maine.
Imamura, G. J., R.S. Thompson, A.B. Boehm, and J.A. Jay, 2011. Wrack promotes thepersistence of fecal indicator bacteria in marine sands and seawater. FEMS MicrobiologyEcology. Vol. 77, No. 1, Pg. 40-49. July 2011.
Krometis, L.H., G.W. Characklis, O.D. Simmons III, J.D. Mackenzie, C.A. Likirdopulos, andM.D. Sobsey, 2007. Intra-storm variability in microbial partitioning and microbialloading rates. Water Research. Vol. 41, No. 2, Pg. 506-516.
Lee D.G. and S.J. Kim, 2003. Bacterial species in biofilm cultivated from the end of the Seoulwater distribution system. Journal ofApplied Microbiology. Vol. 95, No. 2, Pg. 317-324.
Lee, C.M., T.Y. Lin, C.-C. Lin, G.A. Kohbodi, A. Bhatt, R. Lee, and J.A. Jay, 2006. Persistenceof fecal indicator bacteria in Santa Monica Bay beach sediments. Water Research. Vol.40, Pg. 2593-2602.
Maier, R.M., I.L. Pepper, and C.P. Gerba, 2009. Environmental Microbiology. Elsevier Inc.,China, Pg. 10-11.
Manuel, C.M., O.C. Nunes, and L.F. Melo, 2007. Dynamics of drinking water biofilm inflow/non-flow conditions. Water Research. Vol. 41, No. 3, Pg. 551-562.
Marino, R.P. and J.J. Gannon, 1991. Survival of fecal coliforms and fecal streptococci in stormdrain sediment. Water Research. Vol. 25, No. 9, Pg. 1089-1098.
Metcalf and Eddy, Inc., 2003. Wastewater Engineering: Treatment and Reuse. McGraw-Hill,New York.
Myers, D.N., D.M. Stoeckel, R.N. Bushon, D.S. Francy, and A.M.G. Brady, 2007. BiologicalIndicators Fecal Indicator Bacteria. In: Techniques of Water-Resources Investigations,Book 9, Chapter A7, Section 7.1. U.S. Geological Survey, Washington, D.C.
Neidhardt F.C., 1996. Escherichia coli and Salmonella: Cellular and Molecular Biology. ASMPress, United States, Vol. 1., Pg. 14.
Obiri-Danso, K. and K. Jones, 1999. Distribution and seasonality of microbial indicators andthermophilic campylobacters in two freshwater bathing sites on the River Lune inNorthwest England. Journal ofApplied Microbiology. Vol. 87, Pg. 822-832.
Ong, I.B.L., 2010. Singapore Water Management Policies and Practices. International Journal ofWater Resources Development. Vol. 26, No. 1, Pg. 65-80.
58

Pan, X.B. and K.D. Jones, 2012. Seasonal variation of fecal indicator bacteria in storm eventswithin the US stormwater database. Water Science and Technology. Vol. 65, No. 6, Pg.1076-1080.
Parker, J.K., D. McIntyre, and R.T. Noble, 2010. Characterizing fecal contamination instormwater runoff in coastal North Carolina, USA. Water Research. Vol. 44, No. 14, Pg.4186-4194. July 2010.
Picioreanu, C., M.C.M. van Loosdrecht, and J.J. Heijnen, 2001. Two-dimensional model ofbiofilm detachment caused by internal stress from liquid flow. Biotechnology andBioengineering. Vol. 72, No. 2, Pg. 205-218. 20 January 2001.
Pinto, B., R. Pierotti, G. Canale, and D. Reali, 1999. Characterization of 'faecal streptococci' asindicators of faecal pollution and distribution in the environment. Letters in AppliedMicrobiology. Vol. 29, Pg. 258-263.
Property Market SG, 2013. (http://propertymarket.sg/map) 12 March 2013.
PUB, 2009. ABC Waters Design Guidelines. Public Utilities Board. Singapore.
Reeves, R.L., S. B. Grant, R.D. Mrse, C.M. Copil-Oancea, B.F. Sanders, and A.B. Boehm,2004. Scaling and management of fecal indicator bacteria in runoff from a coastal urbanwatershed in Southern California. Environmental Science and Technology. Vol. 38, No.9, Pg. 2637-2648.
Rittmann, B.E., 1989. Structure andfunction of biofilms. John Wiley & Sons, New York. Pg.49-58.
Rittmann, B.E., and P.L. McCarty, 2001. Environmental Biotechnology: Principles andApplications. McGraw-Hill, New York.
Rowny, J.G. and J.R. Stewart, 2012. Characterization of nonpoint source microbialcontamination in an urbanizing watershed serving as a municipal water supply. WaterResearch. Vol. 46, Pg. 6143-6153.
Savichtcheva, 0. and S. Okabe, 2006. Alternative indicators of fecal pollution: relations withpathogens and conventional indicators, current methodologies for direct pathogenmonitoring and future application perspectives. Water Research. Vol. 40, No. 13, Pg.2463-2476.
Schwartz, T., S. Hoffmnan, and U. Obst, 1998. Formation and bacterial composition of young,natural biofilms obtained from public bank-filtered drinking water systems. WaterResearch. Vol. 32, No. 9, Pg. 2787-2797.
Sercu, B., L.C. Van De Werfhorst, J. Murray, and P.A. Holden, 2009. Storm drains are sourcesof human fecal pollution during dry weather in three urban southern Californiawatersheds. Environmental Science and Technology. Vol. 43, No. 2, Pg. 293-298.
59

Shin, S., 2012. An Analysis of Spatial and Temporal Variation in Fecal Indicator Concentrationsin Singapore. Master of Engineering Program, Department of Civil and EnvironmentalEngineering, Massachusetts Institute of Technology, Cambridge, Massachusetts. June2012.
Sibille, I., L. Mathieu, J.L. Paquin, D. Gatel, D., and J.C. Block, 1997. Microbial characteristicsof a distribution system fed with nanofiltered drinking water. Water Research. Vol. 31,Pg. 2318-2326.
Skinner, J.F., J. Kappeler, and J. Guzman, 2010. Regrowth of enterococci & coliform in biofilm.Stormwater, Santa Barbara, California. Retrieved from http://www.stormh2o.com/SW/Articles/1 1064.aspx?format-2, 7 December 2012.
Stewart, P.S., 1993. A model of biofilm detachment. Biotechnology and Bioengineering. Vol. 41,No. 1, Pg. 111-117. January 5, 1993.
Stumpf, C.H., M.F. Piehler, S. Thompson, and R.T. Noble, 2010. Loading of fecal indicatorbacteria in North Carolina tidal creek headwaters: hydrographic patterns and terrestrialrunoff relationships. Water Research. Vol. 44, Pg. 4704-4715.
Surbeck, C.Q., S.C. Jiang, J.H. Ahn, and S.B. Grant, 2006. Flow fingerprinting fecal pollutionand suspended solids in stormwater runoff from an urban coastal watershed.Environmental Science and Technology. Vol. 40, No. 14, Pg. 4435-4441.
Surbeck, C.Q., S.C. Jiang, S.B. Grant, 2010. Ecological control of fecal indicator bacteria in anurban stream. Environmental Science and Technology. Vol. 44, No. 2, Pg. 631-637, 15January 2010.
Sutton, S., 2010. The Most Probable Number Method and its uses in enumeration, qualification,and validation. Journal of Validation Technology. Vol. 16, No. 3, Pg. 35-38.
Tan, Y.S., T.J. Lee, and K. Tan, 2009. Clean, Green andBlue. Singapore: Institute of SoutheastAsian Studies. Print.
Terzieva, S.I. and G.A. McFeters, 1991. Survival and injury of Escherichia coli, Campylobacterjejuni, and Yersinia enterocolitica in stream water. Canadian Journal of Microbiology.Vol. 37, Pg. 785-790.
Tortajada, C., 2006. Water Management in Singapore. International Journal of Water ResourcesDevelopment. Vol. 22, No. 2, Pg. 227-240.
USEPA, 1977. Algae and Water Pollution. Report Number EPA-600/9-77-036. U.S.Environmental Protection Agency, Municipal Environmental Research Laboratory,Office of Research and Development, Cincinnati, OH. December 1977.
USEPA, 1986. Ambient water quality criteria for bacteria - 1986. U.S. Environmental ProtectionAgency, Office of Water, Washington, DC. January 1986.
60
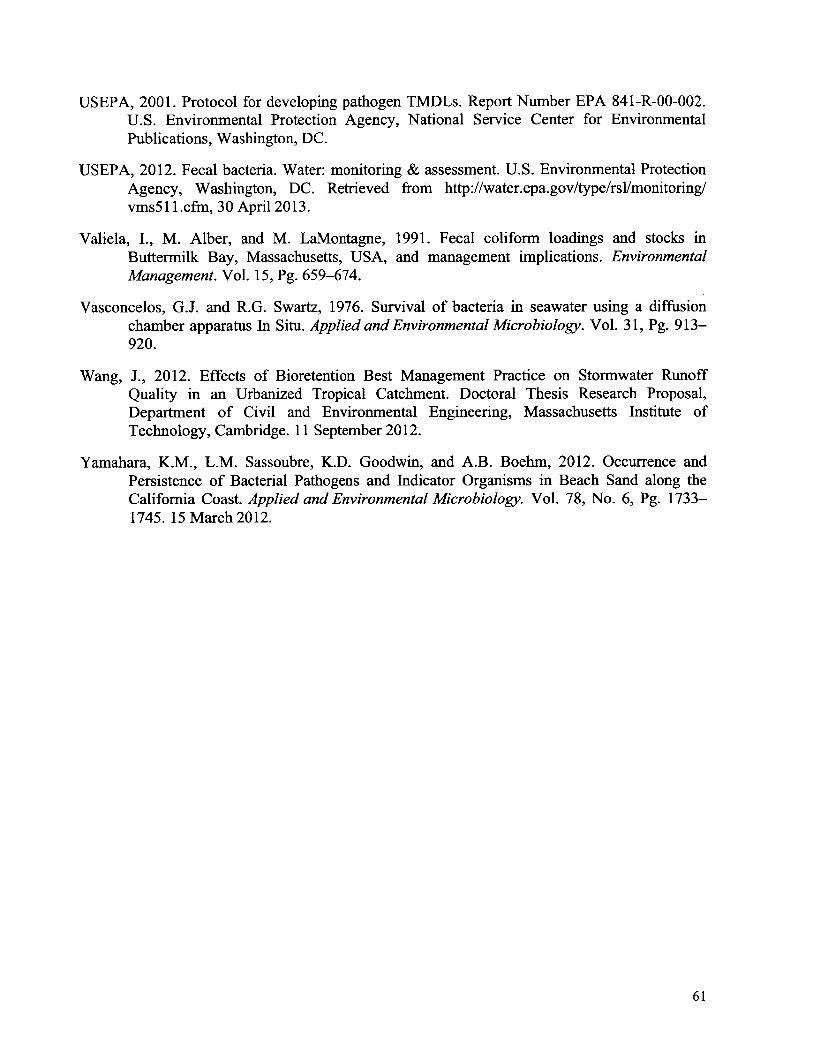
USEPA, 2001. Protocol for developing pathogen TMDLs. Report Number EPA 841-R-00-002.U.S. Environmental Protection Agency, National Service Center for EnvironmentalPublications, Washington, DC.
USEPA, 2012. Fecal bacteria. Water: monitoring & assessment. U.S. Environmental ProtectionAgency, Washington, DC. Retrieved from http://water.epa.gov/type/rsl/monitoring/vms511.cfm, 30 April 2013.
Valiela, I., M. Alber, and M. LaMontagne, 1991. Fecal coliform loadings and stocks inButtermilk Bay, Massachusetts, USA, and management implications. EnvironmentalManagement. Vol. 15, Pg. 659-674.
Vasconcelos, G.J. and R.G. Swartz, 1976. Survival of bacteria in seawater using a diffusionchamber apparatus In Situ. Applied and Environmental Microbiology. Vol. 31, Pg. 913-920.
Wang, J., 2012. Effects of Bioretention Best Management Practice on Stormwater RunoffQuality in an Urbanized Tropical Catchment. Doctoral Thesis Research Proposal,Department of Civil and Environmental Engineering, Massachusetts Institute ofTechnology, Cambridge. 11 September 2012.
Yamahara, K.M., L.M. Sassoubre, K.D. Goodwin, and A.B. Boehm, 2012. Occurrence andPersistence of Bacterial Pathogens and Indicator Organisms in Beach Sand along theCalifornia Coast. Applied and Environmental Microbiology. Vol. 78, No. 6, Pg. 1733-1745. 15 March 2012.
61

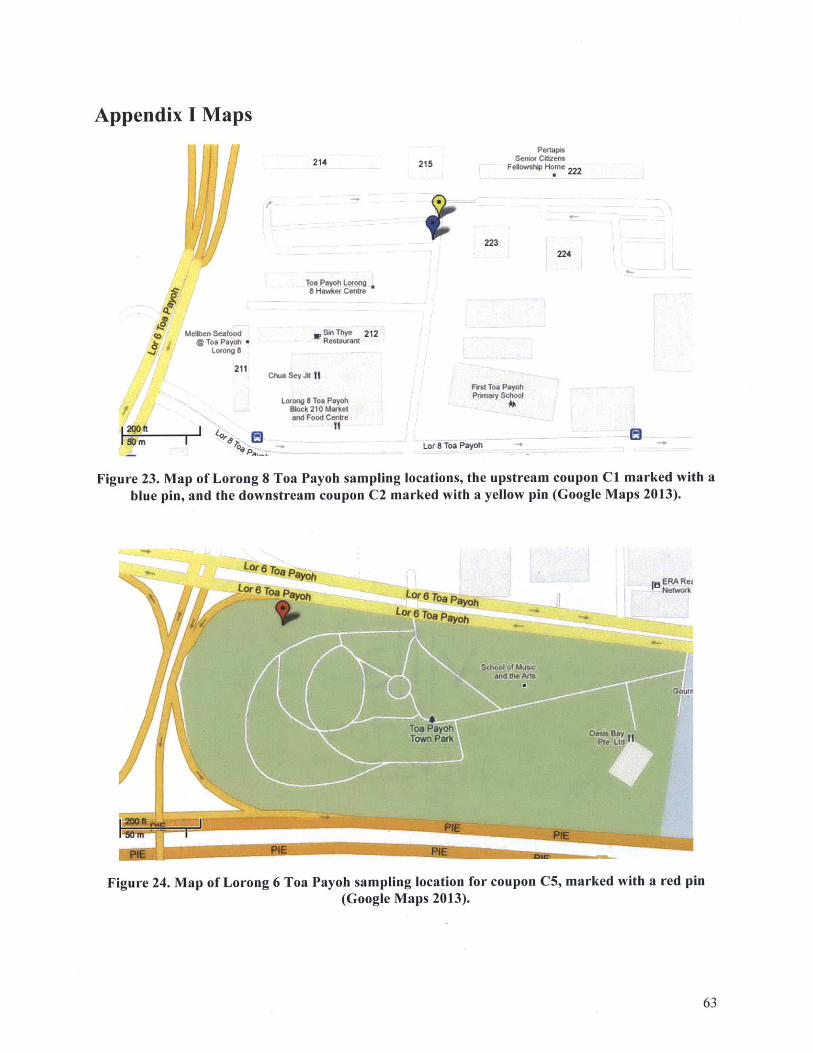
214 215
223
PertapisSenior Citzens
Fellowship Home
224
Too Payoh Lorong8 Hawker Centre
Sin Thye 212Restaurant
Chua Sey Jit t
Lorong 8 Too Payoh8lock 210 Marketand Food Centre
11
First Too PayohPrimary Schoot
Lor 8 Toa Payoh
Figure 23. Map of Lorong 8 Toa Payoh sampling locations, the upstream coupon C1 marked with a
blue pin, and the downstream coupon C2 marked with a yellow pin (Google Maps 2013).
L Toe pr
Figure 24. Map of Lorong 6 Toa Payoh sampling location for coupon C5, marked with a red pin(Google Maps 2013).
63
Appendix I Maps
I
IMelben Seafood
Toa PayohuLorong 8
211
/W
.... .............. . .... . ....... .. ........ ......... .. . ............ .....
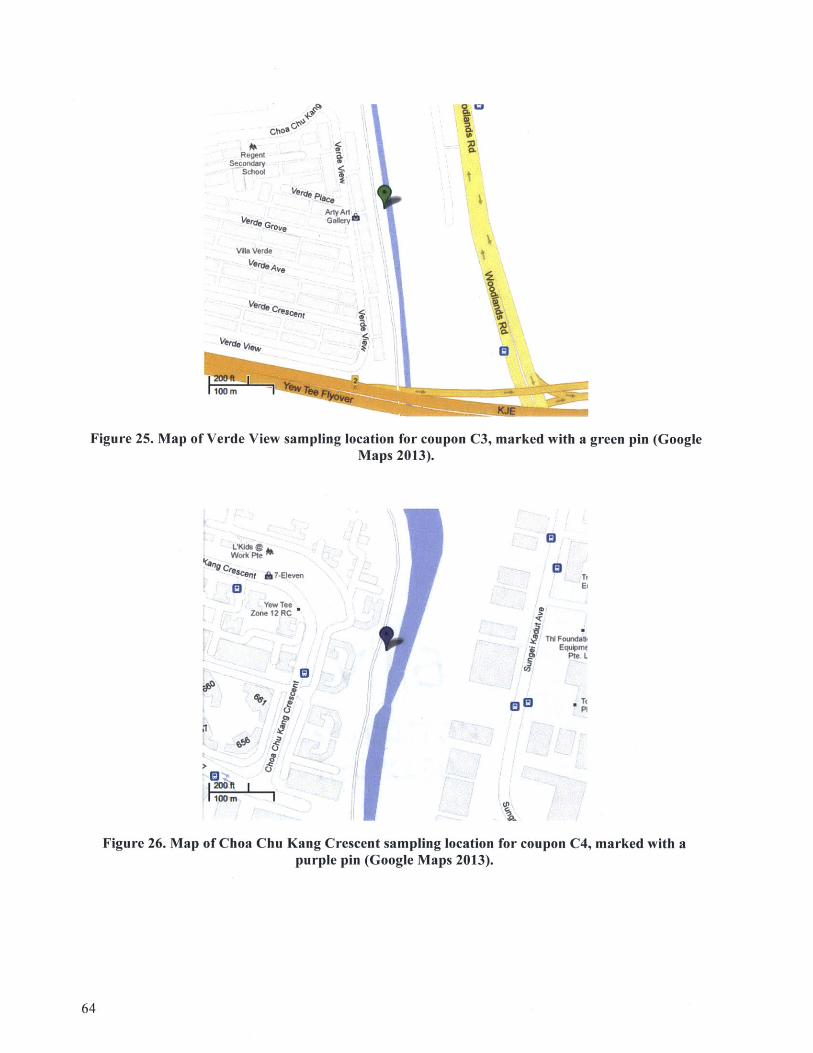
ChO
RegentSecondary
ScIho*1
~. i;i
I0~
Galler
Villa Verde
Ve reaj
Ver* ,, 4,f
Figure 25. Map of Verde View sampling location for coupon C3, marked with a green pin (GoogleMaps 2013).
L-Kici0AWork Pte 7
CCs., 1& 7Eleven
Yew TeeZone 12 RC
4P,
19~
TN FoundEqulpmt
tb PteL
PI
Figure 26. Map of Choa Chu Kang Crescent sampling location for coupon C4, marked with apurple pin (Google Maps 2013).
64
- - - --------
te" Grove
TfEi
LO
![Fecal contamination and related health effects at a ... contamination and related health effects at a ... Aeromonas hydrophila Aeromonas hydrophila ... Ewers 125.ppt [Read-Only]](https://img.dokumen.tips/doc/110x75/5ada57817f8b9aee348ca8a5/fecal-contamination-and-related-health-effects-at-a-contamination-and-related.jpg)