Embed Size (px)
Citation preview
PNNL-17943
Bioenergy with CO2 Capture and Geologic Storage
EPRI Global Climate Change Research SeminarWashington, DC
May 19, 2009
Joint Global Change Research Institute (JGCRI)
Presented byJae Edmonds

2
ACKNOWLEDGEMENTS
Thanks to Rich Richels for the invitation to talk today.
Thanks to EPRI for research support that has been essential to the development of our program in particular and integrated assessment in general.

3
Why are we interested in bioenergy with CCS?
4
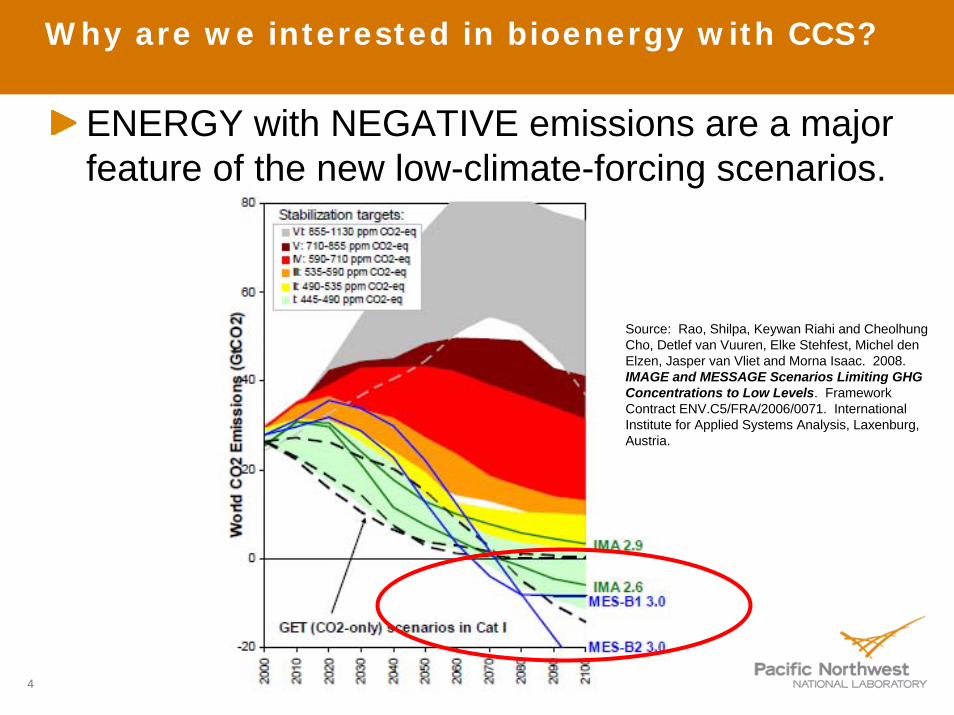
ENERGY with NEGATIVE emissions are a major feature of the new low-climate-forcing scenarios.
Why are we interested in bioenergy with CCS?
Source: Rao, Shilpa, Keywan Riahi and CheolhungCho, Detlef van Vuuren, Elke Stehfest, Michel den Elzen, Jasper van Vliet and Morna Isaac. 2008. IMAGE and MESSAGE Scenarios Limiting GHG Concentrations to Low Levels. Framework Contract ENV.C5/FRA/2006/0071. International Institute for Applied Systems Analysis, Laxenburg, Austria.

5
Bioenergy and CCS
Both bioenergy and CCS are technologies that exist today.
The combination of both is also being explored.
CCS is not deployed at scale.Deployment of each depends on the institutional environment.
Carbon priceInstitutional framework that facilitates a business model for deployment.
Sequestration of CO2 from bioethanol synthesisUniversity of Illinois – DOE –Archer Daniels Midland

6
CO2 Capture and Storage

7
CO2 Capture and Geologic Storage
CO2 capture and geologic storage (CCS).
Isolation of CO2 from the exhaust gas stream.Transport to an injection site.Injection into a deep reservoir.

8
Potential CO2 Storage Reservoirs
Deep saline formationsDepleted oil and gas fieldsCO2 driven enhanced oil recoveryDeep unminable coal seamsCO2 driven enhanced coal bed methane recoveryDeep saline filled basalt formations and other formations.

9
CCS and Cumulative Emissions
Cumulative emissions from MiniCAM CCSP SAP 2.1aPotential geologic storage from Dooley et al. (2004) and subsequent updates.
Ratio of Cumulative Emissions 1990 to 2095 to Maximum Potential Geologic Storage Capacity by Region
0% 10% 20% 30% 40% 50% 60% 70% 80% 90% 100%
USA
Canada
Western Europe
Eastern Europe
Former Soviet Union
Australia_NZ
Japan
Korea
China
India
Southeast Asia
Middle East
Africa
Latin America
0
500
1,000
1,500
2,000
2,500
3,000
MaximumPotentialStorage
A1g 450ppm
A1g 550ppm
A1g 650ppm
A1g 750ppm
GTSP 450 GTSP 550 GTSP 650 GTSP 750
PgC
Unminable CoalDepleted Oil ReservoirsDepleted Gas ReservoirsDeep Saline Reservoirs Off ShoreDeep Saline Reservoirs On Shore
Cumulative global CO2 capture and maximum potential global storage capacity.

10
Present State of CCS Technology
CCS systems have been used with coal and gas power generation systems since the 1970’s. (But not at scale.)3,900 miles of CO2 transport systems.CO2 has been used with EOR for 35 years.CCS can potentially be applied to a wide range of industrial systems ranging from fossil fuel power generation (coal, gas and oil), cement kilns, refineries, chemical manufacture, etc.There are 4 end-to-end commercial systems in place today.

11
Four Sites with CO2 Capture-to-Storage-to-MMV
• CO2 storage began in 2000•2 MtCO2/year being injected via approximately 85 injection wells over a 40 km2 area•Projected 30 MtCO2 lifetime storage
Weyburn
• CO2 storage began in 2004• Three 1.5 km horizontal CO2injector wells are used to inject 1.2 MtCO2/year• Projected 17 MtCO2 lifetime storage
In Salah
Snøhvit• CO2 storage began April 2008• 0.7 MtCO2/year injected into DSF• 23 MtCO2 injected over 30 years• 150 km of the Norwegian coast
•Started injection in 1996 •More than 10 MtCO2 have been injected via 1 injection well with a plume approximately 5 km2 with •Projected 20 MtCO2 lifetime storage•150 km of the Norwegian coast
Sleipner

12
Institutional arrangement for CCS
CCS is a CO2 emissions mitigation technology.It raises capital costs by 50%.It takes a substantial fraction of a power plant’s power production to run.
There is no business model for deploying CCS without either a significant positive price on carbon, or a regulatory requirement.
New plants would be cheapest.Retrofits are possible at extra cost.
For most of the world’s carbon emissions, the price of carbon is zero.The regulatory model that governs CCS for most of the world’s carbon emissions is still under development.
Exceptions exist, e.g. NorwaySignificant progress in many parts of the OECD in defining CCS rules.

13
Bioenergy

14
Bioenergy
Bioenergy is derived from plant material—a very young hydrocarbon.
Bioenergy derives its carbon from the air.If the plant material is oxidized, then there in no NET change in carbon in the atmosphere. Though there are indirect emissions to be discussed shortly.
Bioenergy is generally considered a renewable energy form.Bioenergy was the dominant preindustrial energy form.
It was supplanted by higher energy density forms, e.g. fossil fuels and nuclear power.
It is still used today, e.g. the pulp and paper industry but also traditional bioenergy use in developing regions.It is a major source of liquid fuel in Brazil today.

15
Bioenergy today
There is more bioenergy used today than when it was the dominant energy form.Bioenergy is not cheap and without a subsidy, it does not compete effectively with energy forms such as fossil fuels.The relative attractiveness of bioenergy use could be dramatically different if under a carbon price regime.
0
50
100
150
200
250
300
350
400
450
500
1850 1900 1950 2000
EJ/
year
.
.
Biomass Coal Oil Natural Gas Nuclear Non-biomass renewable
Historical Global Energy Use

16
Indirect Land-use Change Emissions (ILUC)
Bioenergy production requires land, a limited resource.Any number of papers have identified the problem of indirect land-use emissions (ILUC).
Fargione et al. (2008); Searchinger et al. (2008); Edmonds et al. (2003); and Wise et al. (2009).
ILCU occurs when a major new demand for land is introduced in the face of a fixed land resource.
Increased demand for land for purpose-grown bioenergy crops results in higher rental rates for crops and potentially expansion into “unmanaged” lands.
Crutzen et al. (2008) also raised the question of expanded non-CO2 GHG emissions, most notably as a consequence of N2O from fertilizer applications.

17
ILUC and Limiting Atmospheric CO2Concentrations
There are more than 2000 billion tons of carbon in terrestrial ecosystems including soils and above ground plants.Limiting atmospheric CO2 concentrations to low levels, e.g. 450 or 550 ppm implies limits for total anthropogenic carbon emissions.
450 ppm ⇒ ~500 PgC (2005 to 2100)550 ppm ⇒ ~800 PgC (2005 to 2100)Note that these concentrations are NOT CO2-equivalent
The extent of ILUC depends on the policy environment.

18
BioCCS

19
Carbon Pricing
CCS only deploys in the presence of either a carbon price of a regulatory requirement.Purpose-grown bioenergy production is enhanced by the presence of a carbon price.
The BioCCS combination produces a negative emissionNeed for a mechanism that allows for payment for negative emission.Note that negative global emission scenarios not only produce norevenue, but are a net public expenditure.

20
Carbon Pricing in for Two Contrasting Scenarios
Immediate, universal participation by all regions to limit CO2 concentrations in 2095.Two alternative carbon pricing regimes
1. Fossil fuel and industrial carbon tax (FFICT)—in this regime only fossil fuel and industrial carbon emissions are valued. Bioenergy is treated as having no net carbon. Terrestrial carbon is valued at zero.
2. Universal carbon tax (UCT)—in this regime all carbon is valued equally regardless of either its origins or the activity that introduces it to (or removes it from) the atmosphere.

21
Carbon Prices: FFICT and UCT
$0
$500
$1,000
$1,500
$2,000
$2,500
$3,000
$3,500
2005 2020 2035 2050 2065 2080 2095
2005
USD
/tC
UCT 550UCT 500UCT 450Reference550 FFICT500 FFICT450 FFICT
Carbon Price

22
Net Land Use Change Emissions & Fossil Fuel and Industrial CO2 Emissions
-5,000
0
5,000
10,000
15,000
20,000
25,000
2005 2020 2035 2050 2065 2080 2095
TgC
/yr
550 UCT500 UCT450 UCTReference550 FFICT500 FFICT450 FFICT
Land Use Change Emissions
For a given CO2 concentration limitIn the UTC regime ILUC disappears as an issue.
In the FFICT regime high carbon prices drive bioenergy demands and ILUC
-5,000
0
5,000
10,000
15,000
20,000
25,000
2005
2020
2035
2050
2065
2080
2095
TgC
/yr
Reference550 UCT500 UCT450 UCT550 FFICT500 FFICT450 FFICT
Fossil Fuel and Industrial CO2
23
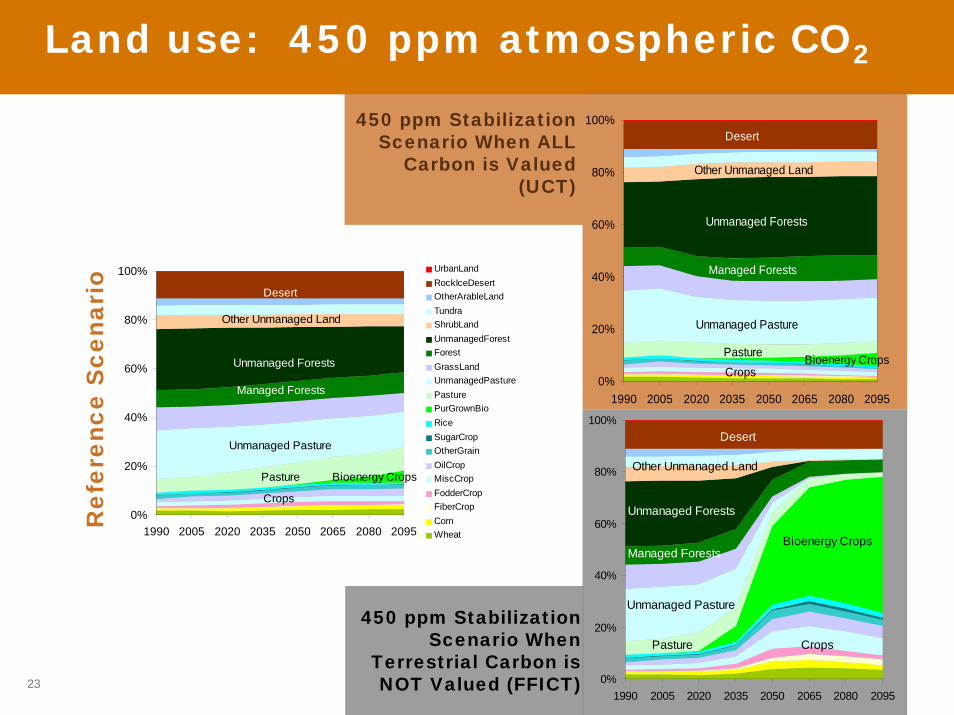
Land use: 450 ppm atmospheric CO2
0%
20%
40%
60%
80%
100%
1990 2005 2020 2035 2050 2065 2080 2095
UrbanLandRockIceDesertOtherArableLandTundraShrubLandUnmanagedForestForestGrassLandUnmanagedPasturePasturePurGrownBioRiceSugarCropOtherGrainOilCropMiscCropFodderCropFiberCropCornWheat
Other Unmanaged Land
Unmanaged Forests
Managed Forests
Pasture
Crops
Unmanaged Pasture
Desert
Bioenergy Crops
Ref
eren
ce S
cena
rio
0%
20%
40%
60%
80%
100%
1990 2005 2020 2035 2050 2065 2080 2095
Other Unmanaged Land
Unmanaged Forests
Managed Forests
PastureCrops
Unmanaged Pasture
Desert
Bioenergy Crops
450 ppm Stabilization Scenario When
Terrestrial Carbon is NOT Valued (FFICT) 0%
20%
40%
60%
80%
100%
1990 2005 2020 2035 2050 2065 2080 2095
Other Unmanaged Land
Unmanaged Forests
Managed Forests
Pasture Crops
Unmanaged Pasture
Desert
Bioenergy Crops
450 ppm Stabilization Scenario When ALL
Carbon is Valued (UCT)

24
Where does the bioenergy go? Carbon taxes and bioenergy use
Bioenergy can play many roles in climate stabilization:
Provider of liquid fuels for transportation ( ), orIf CO2 capture and storage (CCS) is an available technology, bioenergy could be used in power generation with CCS ( ) and provide a means of achieving negative global CO2 emissions.Bioenergy with CCS is a key technology for achieving low climate stabilization levels.
0
50
100
150
200
250
300
2005 2020 2035 2050 2065 2080 2095
EJ/y
r
biomass to H2biomass to H2 CCSBiomass (IGCC)_CCSBiomass (IGCC)Biomass (existing)Biomass (conv)refined liquids industrialrefined liquids endusewholesale gasindustrybuilding
UCT 500 ppm
$174/tC
$362/tC

25
BioCCS and carbon prices
0%
20%
40%
60%
80%
100%
$0 $1,000 $2,000 $3,000 $4,000
Carbon Price ($/tC)
Frac
tion
of B
ioen
ergy
to B
ioC
CS
550 FFICT500 FFICT450 FFICTUCT 550UCT 500UCT 450

26
BioCCS and carbon prices
0%
20%
40%
60%
80%
100%
$0 $1,000 $2,000 $3,000 $4,000
Carbon Price ($/tC)
Frac
tion
of B
ioen
ergy
to B
ioC
CS
550 FFICT500 FFICT450 FFICTUCT 550UCT 500UCT 450
0%
10%
20%
30%
40%
50%
$150 $300 $450Carbon Price ($/tC)
Frac
tion
of B
ioen
ergy
to B
ioC
CS
550 FFICT500 FFICT450 FFICTUCT 550UCT 500UCT 450

27
BioCCS and Electric Power Generation
BioCCS in electricity is a minor energy form in the first half of the century.
Even in the 450 ppm case
Total BioCCS energy use for power production in 2095
16% of total for the 450 ppm case
0
100
200
300
400
500
600
700
800
900
1000
1100
1990 2005 2020 2035 2050 2065 2080 2095
EJ/y
ear
hydrogeothermalexoticPV_storagePVCSP_storageCSPw ind_storagew indGen_IIIGen_II_LWRBiomass (IGCC)_CCSBiomass (IGCC)Biomass (existing)Biomass (conv)Coal (IGCC)_CCSCoal (IGCC)Coal (existing)Coal (conv pul)Gas (peak load conv)Gas (existing)Gas (CC)_CCSGas (CC)Gas (base load conv)Oil (peak load conv)Oil (IGCC)_CCSOil (IGCC)Oil (existing)Oil (base load conv)
Global Fuel Consumption in Electric Power Generation—450 ppm Limit

28
Final Thoughts
BioCCS holds the potential to deliver negative carbon emissions and energy.While the “seeds” of BioCCS are with us now, much needs to change before the potential of this technology could be realized:
A price on carbon (and a payment for negative emissions)Institutions that recognize CCS and manage risksInstitutions that manage indirect land-use carbon emissions (ILUC).
Even with the realization of the many conditions for success, the higher cost of BioCCS—relative to CCS with fossil fuels—places it at least 15 years behind fossil fuel CCS in deployment in our scenarios.
29
END
A technical report on "The Implications of Limiting CO2 Concentrations for Agriculture, Land Use, Land-use Change Emissions and Bioenergy” can be found on our website at:
http://WWW.PNL.GOV/GTSP/publications/2009/200902_co2_landuse.pdf
A GTSP special report on CCS can be found at:http://WWW.PNL.GOV/GTSP/docs/ccs_report.pdf