Embed Size (px)
Citation preview

Mater Engineering, Ltd/ Pinchot Institute
1Bioenergy and Wood Products Conference
Catherine M. MaterJanuary 2004
Public Timber Sales and Sustainability
Who Buys; Who Benefits; and Why CROP is a Vital Key
Presented byCatherine M. Mater
President—Mater EngineeringSenior Fellow – The Pinchot Institute for Conservation
Corvallis, Oregon; Washington, DCTel: 541-753-7335 Fx: 541-752-2952
E-mail: [email protected]

Mater Engineering, Ltd/ Pinchot Institute
2Bioenergy and Wood Products Conference
Catherine M. MaterJanuary 2004
Since we’re in Denver …
Let’s meditate on new protocol to relieve stress regarding supply issues.
Mater Engineering, Ltd/ Pinchot Institute
3Bioenergy and Wood Products Conference
Catherine M. MaterJanuary 2004
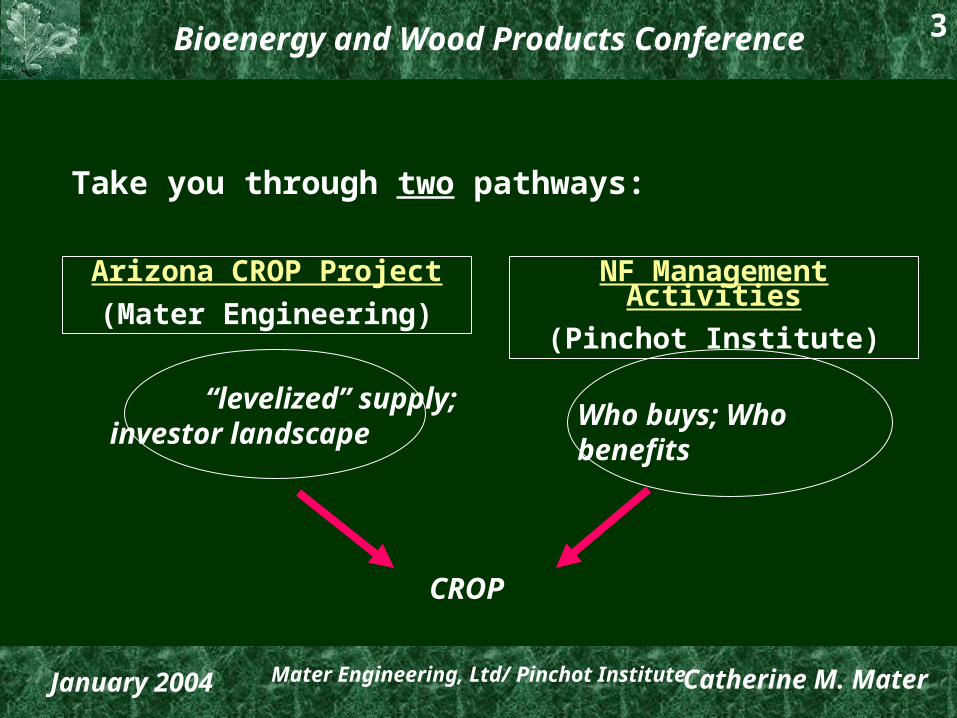
Take you through two pathways:
Arizona CROP Project
(Mater Engineering)
“levelized” supply; investor landscape
NF Management Activities
(Pinchot Institute)
Who buys; Who benefits
CROP

Mater Engineering, Ltd/ Pinchot Institute
4Bioenergy and Wood Products Conference
Catherine M. MaterJanuary 2004
. . . where and why it all began
To explain “investor landscape”, “levelized” and “CROP”, you have to know . . .

Mater Engineering, Ltd/ Pinchot Institute
5Bioenergy and Wood Products Conference
Catherine M. MaterJanuary 2004
Grand Canyon Trust
Greater Forests Flagstaff Partnership
Arizona

Mater Engineering, Ltd/ Pinchot Institute
6Bioenergy and Wood Products Conference
Catherine M. MaterJanuary 2004
Foundations of the Partnership
Restore natural ecosystem functions within Flagstaff Urban Interface.
Reduce catastrophic wildfire risk.
Research, test, and demonstrate key ecological, economical (ie wood utilization), and social dimensions of restoration.

Mater Engineering, Ltd/ Pinchot Institute
7Bioenergy and Wood Products Conference
Catherine M. MaterJanuary 2004
For economics –
•Technology should not drive the wood flow.
•Restoration/stewardship practices should define the technology choices for investment
reverse the formula!!

Mater Engineering, Ltd/ Pinchot Institute
8Bioenergy and Wood Products Conference
Catherine M. MaterJanuary 2004
Timber Volume Sold by Diameter and YearA-S, Coconino, Kaibab (Williams RD)
Small logs sold
Large logs sold
19891990
19911992
19931994
020406080
100120140160180
Small logs sold
020406080
100120140160180
mm
bf
Mater Engineering, Ltd/ Pinchot Institute
9Bioenergy and Wood Products Conference
Catherine M. MaterJanuary 2004
1995 1996 1997 1998 1999 2000 2001 2002
Harvested
Off ered
0
0
10
20
30
40
50
60
70
80
90
100
mm
bf
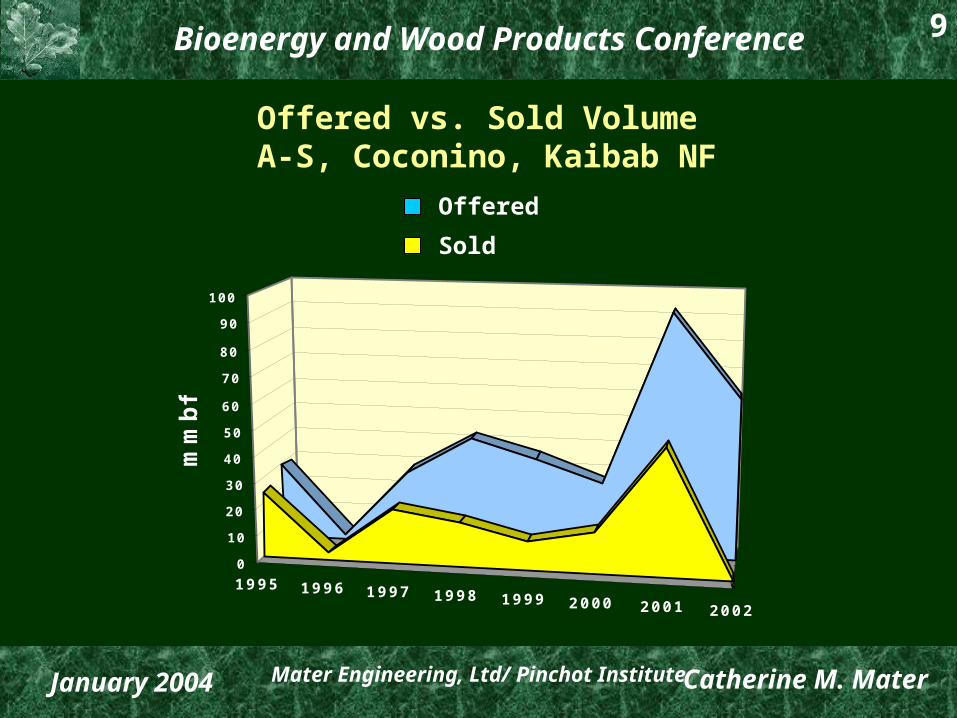
Offered vs. Sold Volume A-S, Coconino, Kaibab NF
Offered
Sold

Mater Engineering, Ltd/ Pinchot Institute
10Bioenergy and Wood Products Conference
Catherine M. MaterJanuary 2004
Flagstaff
~200 miles
Investor Landscape

Mater Engineering, Ltd/ Pinchot Institute
11Bioenergy and Wood Products Conference
Catherine M. MaterJanuary 2004
0
2
4
6
8
10
12
14
16
18
20
95 96 97 98 99 00 01 02
Mormon Lake
Offered
Sold
0
2
4
6
8
10
12
95 96 97 98 99 00 01 02
Blue Ridge
0
2
4
6
8
10
12
95 96 97 98 99 00 01 02
Williams
0
2
4
6
8
10
12
14
16
18
20
95 96 97 98 99 00 01 02
Peaks
0
2
4
6
8
10
12
95 96 97 98 99 00 01 02
Long Valley
Coconino and Kaibab Timber Offering by Ranger District 1995 - 2002
Stable
Unstable

Mater Engineering, Ltd/ Pinchot Institute
12Bioenergy and Wood Products Conference
Catherine M. MaterJanuary 2004
0 2 4 6 8 10
12 14 16 18
Unstable
Mater Engineering, Ltd/ Pinchot Institute
13Bioenergy and Wood Products Conference
Catherine M. MaterJanuary 2004
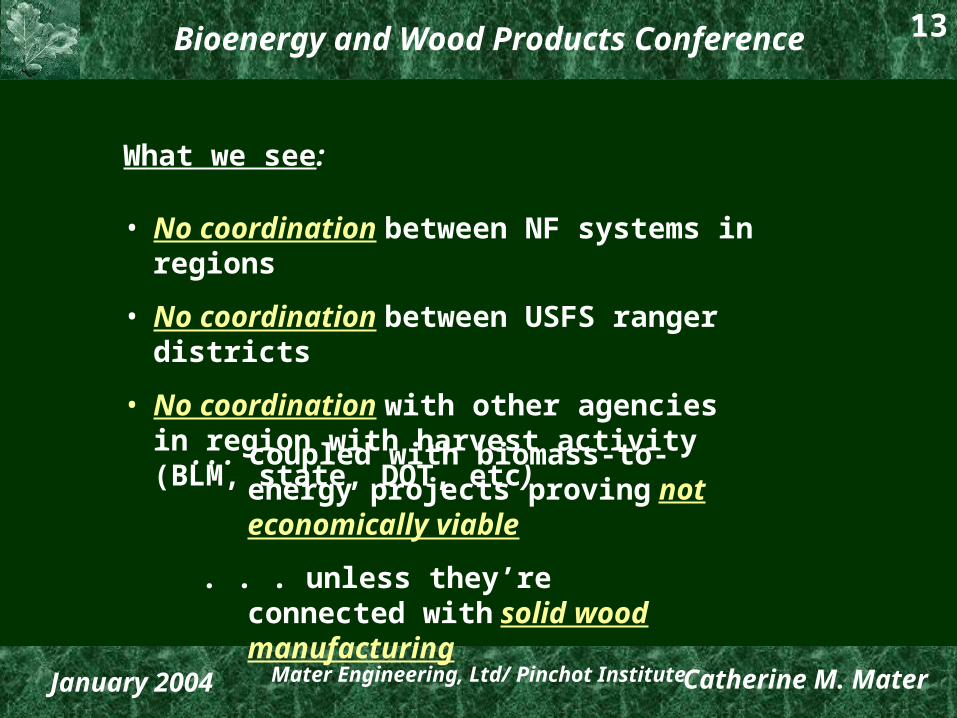
What we see:
• No coordination between NF systems in regions
• No coordination between USFS ranger districts
• No coordination with other agencies in region with harvest activity (BLM, state, DOT, etc)
. . . coupled with biomass-to-energy projects proving not economically viable
. . . unless they’re connected with solid wood manufacturing

Mater Engineering, Ltd/ Pinchot Institute
14Bioenergy and Wood Products Conference
Catherine M. MaterJanuary 2004
What investors see:
Erratic supply at best; no level playing field
Uncertainty where or when supply will come from in an investment landscape (~200 mile radius)
Little information on resource characteristics to be supplied
No investor risk mitigation efforts within the investor landscape (agency coordination targeting risk factors)

Mater Engineering, Ltd/ Pinchot Institute
15Bioenergy and Wood Products Conference
Catherine M. MaterJanuary 2004
What to do with small logs (5”-12”) and biomass (< 5”) material.
How to invite new investment into the region.
Key Questions:
Mater Engineering, Ltd/ Pinchot Institute
16Bioenergy and Wood Products Conference
Catherine M. MaterJanuary 2004
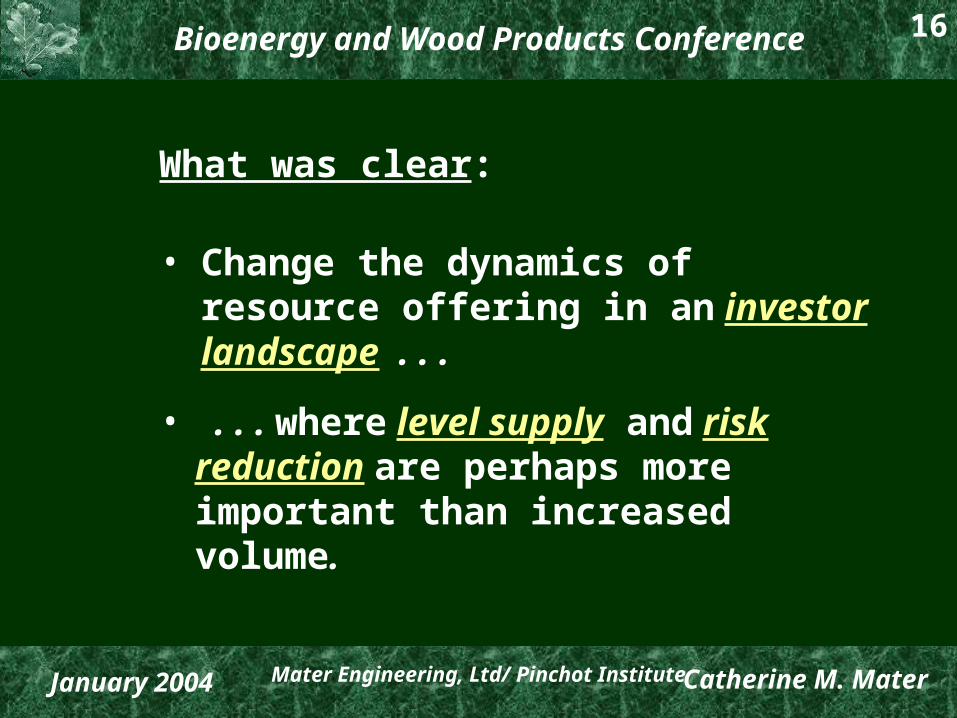
What was clear:
• Change the dynamics of resource offering in an investor landscape . . .
• . . . where level supply and risk reduction are perhaps more important than increased volume.

Mater Engineering, Ltd/ Pinchot Institute
17Bioenergy and Wood Products Conference
Catherine M. MaterJanuary 2004
Solution . . . Seed the CROP
(Coordinated Resource Offering Protocol)

Mater Engineering, Ltd/ Pinchot Institute
18Bioenergy and Wood Products Conference
Catherine M. MaterJanuary 2004
CROP (coordinated resource offering protocol)
Nation’s first benchmark project in investor landscape coordination of projected resource offering:
Within agencies (ie RD’s within NF system)
Between agencies (USFS, BLM, state, Counties, Indian nations, etc.)

Mater Engineering, Ltd/ Pinchot Institute
19Bioenergy and Wood Products Conference
Catherine M. MaterJanuary 2004
CROP
Premise: • Focus is on “levelized” supply between key players, not necessarily adding more supply.
• “Levelized” effort must apply to volume, diameter, and species in locational context.

Mater Engineering, Ltd/ Pinchot Institute
20Bioenergy and Wood Products Conference
Catherine M. MaterJanuary 2004
Why levelized?

Mater Engineering, Ltd/ Pinchot Institute
21Bioenergy and Wood Products Conference
Catherine M. MaterJanuary 2004
USDA FS Southern Research StationMater Engineering, Ltd
University of Oregon Ecosystem Workforce ProgramPinchot Institute for Conservation
Assessing Community Benefits from Land Management Activities on the National Forests
New research results soon to be released:

Mater Engineering, Ltd/ Pinchot Institute
22Bioenergy and Wood Products Conference
Catherine M. MaterJanuary 2004
1. Who buys Forest Service timber sales?
2. Who performs service contracts for the Forest Service?
Demographics, Consistency, Impacts
Three simple questions?
3. Who benefits?

Mater Engineering, Ltd/ Pinchot Institute
23Bioenergy and Wood Products Conference
Catherine M. MaterJanuary 2004
Six National Forests Selected:
Willamette, Deschutes
Coconino
Arapaho-Roosevelt
Nantahala
Bitterroot

Mater Engineering, Ltd/ Pinchot Institute
24Bioenergy and Wood Products Conference
Catherine M. MaterJanuary 2004
Methodology:
• 1998 – 2002 FY timber sale and service contract data analyzed.
• 71 timber sale purchasers interviewed 71; at least 50% response for each forest.
• 131 service contractors interviewed; 74% average response rate .

Mater Engineering, Ltd/ Pinchot Institute
25Bioenergy and Wood Products Conference
Catherine M. MaterJanuary 2004
Contracts typically undertaken with local employees.
60-70% subcontract work; 65-70% goes to local companies.
70-74% primarily purchase supplies from local businesses.
Most work done by distant contractors.
90% “rarely” or “never” hire locals for contracts.
61% pay food and lodging; but lodging mostly described as camping.
Timber Service

Mater Engineering, Ltd/ Pinchot Institute
26Bioenergy and Wood Products Conference
Catherine M. MaterJanuary 2004
How do timber purchasers perceive FS programs? Do perceptions match performance?

Mater Engineering, Ltd/ Pinchot Institute
27Bioenergy and Wood Products Conference
Catherine M. MaterJanuary 2004
Supply: total volume
78% of timber purchasers noted a decrease in total volume of timber sales offered by the forest service over the last five years.
Performance:
Only the Bitterroot & the Nantahala exhibited continuous declines in sales volume offered between 1998 - 2002. The Arapaho-Roosevelt, Willamette, Deschutes, and Coconino offered sales volumes in 2000 – 2002 which were close to or exceeded sales volumes offered in 1998 – 1999.

Mater Engineering, Ltd/ Pinchot Institute
28Bioenergy and Wood Products Conference
Catherine M. MaterJanuary 2004
Lack of levelized, steady offerings may foster perceptions of diminishing sales volumes and may reduce ability to respond to timber sales offerings in absence of long-term harvest planning protocol.
Willamette Sales by Log S ize
0
20000
40000
60000
80000
100000
FY98 FY99 FY00 FY01 FY02
MB
F
Small logs, pulp
Sawlogs
Coconino Sales by Log Size
0
2000
4000
6000
8000
10000
12000
14000
FY98 FY99 FY00 FY01 FY02
Small logs, pulp
Sawlogs

Mater Engineering, Ltd/ Pinchot Institute
29Bioenergy and Wood Products Conference
Catherine M. MaterJanuary 2004
Timber purchasers:
• 32% reduced wages or employee benefits
• 54% laid off employees
• 14% reduced work hours or shifts
• 23% reduced hiring of outside contractors

Mater Engineering, Ltd/ Pinchot Institute
30Bioenergy and Wood Products Conference
Catherine M. MaterJanuary 2004
Meanwhile, back in Arizona, we began to examine how to . . .
Invite investment to the regions focused on small log processing.
Increase the value of resource sales.
Reduce the disparity between offered and sold.
Increase environmental support for long term removal activity.

Mater Engineering, Ltd/ Pinchot Institute
31Bioenergy and Wood Products Conference
Catherine M. MaterJanuary 2004
. . . but examine through a CROP lens
How much is proposed for removal (5-year period)?
How levelized is the removal flow over time?
Where and who will the volume come from?

Mater Engineering, Ltd/ Pinchot Institute
32Bioenergy and Wood Products Conference
Catherine M. MaterJanuary 2004
5 National Forests
AZ Trust Lands
ADOT
Department of Defense (Camp Navajo)
Indian Nations
Key players in Arizona investor landscape:

Mater Engineering, Ltd/ Pinchot Institute
33Bioenergy and Wood Products Conference
Catherine M. MaterJanuary 2004
11% Williams RD
6%
7% Morman Lake RD
11% Mogollon RD
20% Black Mesa RD
14% Lakeside RD
6% Alpine RD
18% Springerville RD
2% Pleasant Valley RD
2% Payson RD
2% Bradshaw RD
Williams RD - Kaibab NFAnnual Volume by DBH
0100020003000400050006000700080009000
2003 2004 2005 2006 2007
CC
F
vol 5-9"vol 9-12"vol 12+"
ROM #1: 2003-2007: 5” - 12+”
39% unstable supply
54% stable supply
11%
2%
7%
11%
20%
14%
20%
14%
18%
6%2%
2%

Mater Engineering, Ltd/ Pinchot Institute
34Bioenergy and Wood Products Conference
Catherine M. MaterJanuary 2004
5” – 9”: Where 60% or more of the NF volume will come from5-year (total: 340,677 ccf)
= 2003 (5%)
= 2004 (23%)
= 2005 (19%)
= 2006 (23%)
= 2007 (29%)
ROM #2

Mater Engineering, Ltd/ Pinchot Institute
35Bioenergy and Wood Products Conference
Catherine M. MaterJanuary 2004
9” – 12”: Where 60% or more of the NF volume will come from5-year (total: 188,207 ccf)
= 2003 (9%)
= 2004 (24%)
= 2005 (20%)
= 2006 (22%)
= 2007 (26%)
ROM #3

Mater Engineering, Ltd/ Pinchot Institute
36Bioenergy and Wood Products Conference
Catherine M. MaterJanuary 2004
12+”: Where 60% or more of the NF volume will come from5-year (total: 213,020 ccf)
= 2003 (28%)
= 2004 (19%)
= 2005 (17%)
= 2006 (17%)
= 2007 (20%)
ROM #4

Mater Engineering, Ltd/ Pinchot Institute
37Bioenergy and Wood Products Conference
Catherine M. MaterJanuary 2004
Where 60% or more of the NF volume will come from over 5 years
= 5” – 9” (340,677 ccf total)
= 9” – 12” (188,207 ccf total)
= >12” (213,020 ccf total)
X
X
X
X
X
ROM #5

Mater Engineering, Ltd/ Pinchot Institute
38Bioenergy and Wood Products Conference
Catherine M. MaterJanuary 2004
<5" Projected 5-Year Biomass Removal Peaks RD (CCF)
00.10.20.30.40.50.60.70.80.9
1
2003 2004 2005 2006 2007
CC
F
None Projected
<5" Projected 5-Year Biomass Removal Pleasant Valley RD (CCF)
00.10.20.30.40.50.60.70.80.9
1
2003 2004 2005 2006 2007
CC
F
None Projected
<5" Projected 5-Year Biomass Removal Alpine RD (5,659.2 ccf)
0
500
1000
1500
20002500
3000
3500
4000
4500
2003 2004 2005 2006 2007
CC
F
<5" Projected 5-Year Biomass Removal Bradshaw RD (300 ccf)
0
20
40
60
80
100
2003 2004 2005 2006 2007
CC
F
<5" Projected 5-Year Biomass Removal Lakeside RD (10,010.4 ccf)
0
500
1000
1500
2000
2500
3000
3500
2003 2004 2005 2006 2007
CC
F
<5" Projected 5-Year Biomass Removal Williams RD (1,500 ccf)
0100200300400500600700800
2003 2004 2005 2006 2007
CC
F
<5" Projected 5-Year Biomass Removal Springerville RD (16,357.8 ccf)
0
1000
2000
3000
4000
5000
6000
2003 2004 2005 2006 2007
CC
F
<5" Projected Biomass Removal Black Mesa RD (14,211.6 ccf)
01000200030004000
5000600070008000
2003 2004 2005 2006 2007
CC
F
<5" Projected 5-Year Biomass Removal Payson RD (800 ccf)
0
100
200
300
400
500
600
700
2003 2004 2005 2006 2007
CC
F
<5" Projected 5-Year Biomass Removal Mogollon RD (11,600 ccf)
0
100
200
300
400
500
2003 2004 2005 2006 2007
CC
F
<5" Projected 5-Year Biomass Removal Morman Lake RD (14,211.6 ccf)
0
50
100
150
200
250
2003 2004 2005 2006 2007
CC
F
2003-2007: < 5” biomass 3% Williams RD 2% Morman Lake RD
3% Mogollon RD
28% Black Mesa
19% Lakeside RD
11% Alpine RD
32% Springerville RD 2% Payson RD
< 1% Bradshaw RD
None Projected
None Projected
51% stable supply39% unstable supply
ROM # 6

Mater Engineering, Ltd/ Pinchot Institute
39Bioenergy and Wood Products Conference
Catherine M. MaterJanuary 2004
Biomass (<5): Where 60% or more of the NF volume will come from5-year (total: 51,440 ccf)
= 2003 (2%)
= 2004 (26%)
= 2005 (18%)
= 2006 (24%)
= 2007 (30%)
ROM #7

Mater Engineering, Ltd/ Pinchot Institute
40Bioenergy and Wood Products Conference
Catherine M. MaterJanuary 2004
Meanwhile, because of NFP mandates and the N. AZ project, similar efforts unfolding in Oregon:
Central Oregon (Bend -Redmond
South Central (Hines)
Oregon

Mater Engineering, Ltd/ Pinchot Institute
41Bioenergy and Wood Products Conference
Catherine M. MaterJanuary 2004
Oregon investor landscapes include:
Central Oregon:
• 7 National forests
• State lands
• ODOT
• BLM
• Indian nations
• Counties
South-Central Oregon:
• 5 National forests
• ODOT
• BLM
• Counties

Mater Engineering, Ltd/ Pinchot Institute
42Bioenergy and Wood Products Conference
Catherine M. MaterJanuary 2004
O c h o c o N a t i o n a l F o r e s t
Ochoco - Paulina Ranger District
0200400600800
1,0001,2001,4001,600
Offered Sold Offered Sold Offered Sold
12" & Greater 4" - 11" <4"
mbf
2000
2001
2002
Ochoco NF:
Offered vs sold for ’00-’02
Same picture as Arizona
Unstable

Mater Engineering, Ltd/ Pinchot Institute
43Bioenergy and Wood Products Conference
Catherine M. MaterJanuary 2004
OR CROP working circle:100-mile radius
95%
03-07 : Lodgepole Pine
• Deschutes NF: L. Pine
39%
52%
03-07 : Juniper • BLM: Juniper

Mater Engineering, Ltd/ Pinchot Institute
44Bioenergy and Wood Products Conference
Catherine M. MaterJanuary 2004
Marketing plan for new restoration-based high value-add technologies
CROP it . . . And they will come!

Mater Engineering, Ltd/ Pinchot Institute
45Bioenergy and Wood Products Conference
Catherine M. MaterJanuary 2004

Mater Engineering, Ltd/ Pinchot Institute
46Bioenergy and Wood Products Conference
Catherine M. MaterJanuary 2004
Potential for CROP as a new supply/investment tool?
We think excellent potential . . .
. . . Just may have to view things from a different
angle!
![Solennità ta' l-l '1@lf!iS[]l)santamarija.com/.../05/Solennitta-ta-l...sema-Patruna-ta-l-Imqabba.pdf · Mater castissima Mater inviolata Mater intemerata Mater amabi/is Mater admirabi/is](https://img.dokumen.tips/doc/110x75/5ac828de7f8b9a40728c7e15/solennit-ta-l-l-1lfisl-castissima-mater-inviolata-mater-intemerata-mater.jpg)


![The Indianapolis times. (Indianapolis [Ind.]) 1933-05-05 [p ] · 2019. 12. 3. · $2 a week. Mrs. CorneliaBryce Pinchot, wife of Governor Pinchot, inher private investigation of young](https://img.dokumen.tips/doc/110x75/5febfc44c8d3eb365c1c5e37/the-indianapolis-times-indianapolis-ind-1933-05-05-p-2019-12-3-2.jpg)