Embed Size (px)
Citation preview

International Journal of Computational Engineering Research||Vol, 04||Issue, 3||
||Issn 2250-3005 || || March || 2014 || Page 1
Bioelectrical Impedance Analysis (BIA) For Assessing Tbw and
Ffm of Indian Females
1. Munna Khan,
2Shabana Mehfuz,
3. Ghazala PerveenKhan
1Electrical Engineering Department, Jamia Millia Islamia, New Delhi-110025
2Professor, Electrical Engineering Department, Jamia Millia Islamia, New Delhi-110025
3Assistant Professor, Electrical Engineering Department, Jamia Millia Islamia, New Delhi-110025
Methods: Data of reference (1) included vital information about body composition of 60 Indian females such
as age, TBW, FFM, height, weight, impedance and phase at 5KHz., 50KHz., 100KHz. and 200 KHz.. This data
was then used to calculate the impedance index i.e. ( height2/impedance) at the respective frequencies. This
method uses multiple regression analysis to drive prediction equation of Indian females at frequencies of
5KHz.,50KHz.,100KHz.,200KHz., As we Know that in multiple regression analysis wherein the main aim is to
predict dependent variable from the no. of independent variables that are known which is called dependent
variable from 1 or more independent variable also called as predictor variable. One more theme in developing
prediction equation of Here in this study we used TBW and FFM as dependent variable and Weight of females
and Impedance index i.e.(height2/impedance) as independent variable at different frequencies of 5
KHz.,50KHz.,100KHz.,200KHz respectively. Data was fed then into R software, an integrated suite of software
facilities used for data manipulation, calculation and graphical display. It is used for effective data handling and
storage facility. The main use of R software is for regression analysis, which was then used to generate the
prediction equation. The prediction developed here is through multiple regression analysis. In multiple
regression analysis the equation is of the form given below;
Y=m1x1+ m2x2+ m3x3+...........+mnxn+ c; where c is intercept and m1,m2,m3…..mn are the weight’s assigned to
each of the predictor variables by the regression solution.
Result: Data used in commercial software provided 8 BIA equations; 4 for TBW and 4 for FFM at frequencies
of 5 KHz, 50KHz, 100 KHZ and 200 KHz. And so 8 sets of dependent variable were there, This data included
other statistical data such as mean, standard deviation and correlation of Total Body Water (TBW) and Fat Free
Mass(FFM) with Impedance index and Weight. Besides this scatter matrix plot for Total Body Water (TBW)
and Fat free Mass (FFM) ,Normal distribution of standardised residuals showing the relationship between TBW
ABSTRACT Background: The Bioelectrical Impedance analysis is an easy, applicable method for assessing Total
Body water and Fat Free Mass of various groups of people. It has many advantages over other
methods and is safe, rapid, portable, easy to perform and require minimum operator training. It has
been used extensively for developing specific prediction equation for different ethnicity, age, gender,
level of body fatness and physical activity. Regression equations play great role to estimate the body
density and fatness specific to the owing to methodological and biological factors.
Purpose: The purpose of the study was to investigate the utility of multi-frequency BIA for the
estimation of TBW and FFM of Indian females at different frequencies. Earlier scientists have
measured various parameters of body composition of Indian population using MALTRON-II. However,
literature shows that prediction equations have not been developed for Indian females which could
develop the heathy prediction equation for Indian females (unhealthy eating habits). It has been found
in the study that women particularly Indian womens have unhealthy eating habits owing to the fact that
they concentrate only on 1 aspect was their food cooked good enough to eat, but they don’t understand
the meaning of healthy food. In the present research paper, an attempt has been made to develop BIA
equations using data taken from PhD thesis (1). This data was taken from my senior Dr. Goswami, who
collected the data in the college in which he was teaching. Some of the data that my supervisor, co-
supervisor and myself has taken in DRDO have already been utilized in building multi-compartmental
model, developing generalized age and sex specific prediction equation and developing REE of Indian
subjects.
Keywords: R(2.9.2) software, Bio Electrical Impedance Analysis, Prediction Equation, MALTRON-
II, Multiple Regression Analysis, Total Body Water, Fat Free Mass, Impedance index.

Bioelectrical Impedance Analysis (BIA) For Assessing Tbw and Ffm of Indian Females
||Issn 2250-3005 || || March || 2014 || Page 2
and FFM ,Scale location plot, Residual verses leverage plot, standardised residual verses cook’s distance plot at
frequencies of 5 KHz,50KHz,100 KHZ and 200 KHz are plotted. These plots for linear model objects give the
diagnostic information about the linear model.
Conclusions: The final race-combined TBW prediction equations included stature2/resistance and body weight.
Multiple regression analysis was carried out on clinical data through R 2.9 software. The BIA prediction
equation for Total Body water and Fat Free mass was developed at different frequencies of 5 KHz. and 50 KHz.
respectively. The data was taken for Indian females lying in a limited age span of 17-22 years.
I. INTRODUCTION: Developing prediction equation for Indian females for evaluating and monitoring growth and nutritional status is
an important area of research. Assessing the body composition through isotope dilution, hydro densitometry, dual X-ray
absorbtiometry (DXA),air displacement plethysmography, magnetic resonance imaging, are sometimes used for body
composition analysis, but these equipments are not easily available and is expensive to maintain, so their use in clinical and
field studies is limited. One of the most popular methods for body composition analysis is through Bioelectrical Impedance
Analysis. One of the main advantages of using BIA method is that it does not require high technician skill, it is generally
more comfortable and does not intrude much on client’s privacy. Traditional BIA method which is still most frequently used
involves the measurement of impedance at single frequency generally at 50KHz. Although single frequency BIA is most
used in clinical practices, this device could not predict Total Body Water accurately. MF-BIA seems to give a better
estimation of hydration than SF-BIA because the principle of measuring the flow of current through the body (impedance) is
dependent on the frequency applied. At low frequencies, the current cannot bridge the cellular membrane and will pass
predominantly through the extracellular space. At higher frequencies penetration of the cell membrane occurs and the current
is conducted by both the extra-cellular water (ECW) and intra-cellular water (ICW). In India when it comes to general health of people there is a large disparity between urban elite class and rural
class. Obesity is becoming a factor in many nations around the world. According to latest obesity statistics, sponsored by
International Day of Evaluation of Abdominal Obesity;75 percent of Indian women and 58 percent of Indian men are obese.
Besides this, numerous studies indicate that malnutrition is another serious health concern that Indian women face
(Chatterjee, 1990; Desai, 1994; The World Bank, 1996). It threatens their survival as well as that of their children. The
negative effects of malnutrition among women are compounded by heavy work demands, by poverty, by childbearing and
rearing, and by special nutritional needs of women, resulting in increased susceptibility to illness and consequent higher
mortality. Attention, must therefore be paid to determine the body composition of females so that appropriate measures can
be taken if women in India are facing abnormality in their health due to their abnormal nutritional status.
The purpose of the current study was to use the female body composition database to develop and predict TBW
and FFM at the frequencies of 5KHz, 50KHz, 100KHz, 200KHz so that, a general idea about the health status of Indian
female can be observed and for that purpose multiple regression analysis is done.
Subjects and Methods: Data of 60 Indian females from reference(1) was used to develop and predict TBW and FFM at
5KHz,50KHz,100KHz,200KHz which was then used for the descriptive analysis of Indian females which included their
age, weight, height, Total Body Water(TBW), Fat Free Mass (FFM), and Impedance at these frequencies. These data were
then used to calculate the body stature. i.e. (height2/impedance) of females. In this paper, a powerful statistical program R
(version 2.9.2); basically used for statistical analysis is used. Here we have used this software to develop linear model for
Total Body Water(TBW) and Fat Free Mass(FFM) at different frequency and form a prediction equation using weight and
Impedance index i.e. (height2/impedance) of females at these frequencies as independent variables and TBW and FFM as
dependent variables. The obtained equations are of the form:
TBW(f1,f2,f3,f4)=a0Wt.+a1ZI(f1,f2,f3,f4) +C1(f1,f2,f3,f4)………………………………………………..(1)
FFM(f1,f2,f3,f4)=b0Wt.+b1ZI(f1,f2,f3,f4) +C2(f1,f2,f3,f4)……………………………………………….(2)
Where TBW(f1,f2,f3,f4) and FFM(f1,f2,f3,f4) is Total Body Water and Fat Free Mass at frequencies
f1=5KHz.,f2=50KHz.,f3=100KHz.,f4=200KHz. and ZI(f1,f2,f3,f4) is the calculated Impedance index i.e. (height2/impedance) of
females at these frequencies. C1(f1,f2,f3,f4) and C2(f1,f2,f3,f4) are intercepts of equation (1) and (2) respectively and a0, b0 are
coefficients multiplied by weight variable of equation(1) and(2) respectively and a1, b1 are coefficients multiplied by
Impedance index variable of equation(1) and(2) respectively. The flowchart showing the sequence of operations of
algorithm used in R 2.9 software to develop and predict linear model of TBW, FFM at these multiple frequencies is also
shown in Figure(1)

Bioelectrical Impedance Analysis (BIA) For Assessing Tbw and Ffm of Indian Females
||Issn 2250-3005 || || March || 2014 || Page 3
TABLE 1.
Clinical data of 60 Indian females from reference (1), showing age, weight, sex and customer ID of subjects
Serial no. Customer Id Weight(Kg) Sex(Male) Age(Years)
1.
2.
3.
4.
5.
6.
7.
8.
9
10.
11.
12.
13.
14.
15.
16.
17.
18.
19.
20.
21.
22.
23.
24.
25.
26.
27.
28.
29.
30.
31.
32.
33.
34.
35.
36.
37.
38.
39.
40.
41.
42.
43.
44.
45.
46.
47.
48.
49.
50.
51.
52.
53.
54.
55.
56.
57.
58.
59.
60.
187
127
173
108
140
167
169
171
176
183
186
188
189
190
191
192
193
203
206
195
208
207
115
163
164
165
168
170
172
177
178
181
182
184
211
212
214
201
166
194
175
180
185
209
71
179
210
54
119
220
53
51
118
124
144
162
125
174
92
197
44
50
45
53
46
62
52
39
52
57
44
51
39
43
54
50
58
40
54
57
55
51
50
56
63
48
57
45
50
56
60
51
54
60
60
61
52
52
56
47
37
52
47
53
39
50
58
41
42
45
47
54
62
48
72
55
57
56
50
77
1
1
1
1
1
1
1
1
1
1
1
1
1
1
1
1
1
1
1
1
1
1
1
1
1
1
1
1
1
1
1
1
1
1
1
1
1
1
1
1
1
1
1
1
1
1
1
1
1
1
1
1
1
1
1
1
1
1
1
1
17
17
17
18
18
18
18
18
18
18
18
18
18
18
18
18
18
18
18
18
18
19
19
19
19
19
19
19
19
19
19
19
19
19
19
19
19
19
20
21
21
22
22
22
23
23
23
24
24
25
25
26
30
30
31
32
33
37
41
42

Bioelectrical Impedance Analysis (BIA) For Assessing Tbw and Ffm of Indian Females
||Issn 2250-3005 || || March || 2014 || Page 4
TABLE 2.
Clinical data of 60 Indian females from reference(1) showing impedance and impedance index at frequencies
of 5KHz.,50KHz.,100KHz.,200KHz.
S.No. FFM(Kg) TBW(Lt.) Z at
5KHz. Z at 50 KHz.
Z at 100 KHz.
Z at 200 KHz.
ZI at 5KHz.
ZI at 50 KHz.
ZI at 100KHz.
ZI at 200KHz.
1.
2. 3.
4.
5. 6.
7.
8. 9
10.
11. 12.
13.
14. 15.
16.
17. 18.
19.
20. 21.
22.
23. 24.
25.
26. 27.
28.
29. 30.
31.
32.
33.
34. 35.
36.
37. 38.
39.
40. 41.
42.
43. 44.
45.
46. 47.
48.
49. 50.
51.
52. 53.
54.
55. 56.
57.
58. 59.
60.
37.61
38.38 24.02
43.27
39.23 45.91
39.9
34.87 38.31
49.24
36.7 39.2
33.54
36.59 39.86
41.94
40.56 32.93
38.4
44.04 39.88
36.95
40.89 43.19
43.77
38.47 39.25
34.56
39.88 41.2
40.13
41.18
40.16
45.89 44
45.1
41.25 39.17
39.08
37.06 31.91
37.91
6.3 12.33
7.19
12.34 12.73
5.29
5.6 16.6
12.49
13.66 21.16
10.66
30.27 16.6
16.53
15.82 11.07
36.2
24.35
26.22 11.82
27.79
25.28 30.19
25.81
23.27 25.39
27.38
23.06 26.04
21.64
24.03 25.73
26.24
27.16 21.6
25.22
28.66 25.85
24.21
25.93 27.51
29.13
24.35 27.25
23.13
26.08 28.81
27.62
26.24
26.62
28.9 28.3
29.01
25.35 25
26.32
23.51 20.75
25.85
25.49 25.99
21.06
25.74 25.7
23.07
23.88 25.96
23.5
26.21 29.6
26.25
31.27 25.96
29.11
27.61 26.02
32.48
845
793 871
861
890 804
869
843 890
809
954 765
936
869 853
887
881 942
884
827 891
943
953 842
828
878 792
879
822 713
865
893
829
875 868
833
1004 850
900
983 1100
833
870 873
991
803 892
932
967 966
884
920 730
800
819 816
752
803 871
708
769
692 827
766
792 731
794
761 816
739
873 720
872
775 804
785
793 835
838
766 821
860
839 783
743
814 723
805
764 624
766
809
770
801 783
769
910 857
815
911 1006
761
825 808
903
712 827
842
855 876
805
829 645
666
705 745
631
743 780
639
718
654 762
725
755 682
731
723 757
696
846 674
819
728 760
748
723 780
786
722 774
809
798 737
707
759 681
763
725 581
724
771
717
755 740
740
843 810
769
851 938
717
778 765
857
668 768
803
813 819
760
785 613
626
665 702
591
691 739
605
718
619 762
692
723 682
731
723 757
696
846 674
819
728 760
748
723 780
786
722 774
809
763 737
707
759 681
763
725 581
724
771
717
755 740
740
843 810
769
851 938
717
778 765
842
668 768
804
781 819
749
775 584
592
635 702
558
691 722
605
29.17
29.135 28.66
31.33
32.64 35.104
29.09
28.499 26.99
30.857
26.167 31.405
24.634
27.646 29.266
39.066
28.335 22.939
27.177
33.72 28.02
24.83
28.56 32.73
32.088
28.43 29.56
24.919
30.755 33.26228.
134
30.118
30.113
33.81 31.75
33.88
27.78 29.74
27.04
25.39 21.56
28.102
32.83 30.06
22.1
28.772 25.224
27.812
27.476 22.98
24.77
28.526 32.911
28.88
30.48 30.59
31.948
31.88 30.13
34.815
32.05
33.387 30.186
36.41
33.136 38.61
31.84
31.57 29.44
33.781
28.59 33.37
26.495
31 31.05
35.103
31.48 25.88
28.669
36.41 30.41
27.22
32.45 35.19
35.76
30.668 32.37
27.21
33.09 38.006
31.77
33.246
32.42
36.93 35.193
36.7
30.65 29.49
29.86
27.402 23.57
30.76
34.62 32.48
24.256
32.45 27.21
30.785
31.07 25.34
27.21
31.65 37.248
34.69
35.41 33.51
38.074
34.45 33.65
38.57
34.33
35.327 32.76
38.47
34.76 41.384
34.58
34.518 31.737
35.868
29.508 35.645
28.21
33.001 32.8473
6.84
34.53 27.71
30.566
38.63 32.25
28.94
34.117 37.389
37.58
32.89 34.37
28.71
34.87 40.82
33.613
34.884
34.817
39.184 37.24
38.14
33.08 31.21
31.646
29.335 25.28
32.648
36.72 34.305
25.56
34.586 29.29
32.28
32.68 27.104
28.82
33.43 39.19
36.91
37.54 35.56
40.65
30.18 35.512
40.74
34.33
37.32 32.76
40.31
36.29 41.384
34.58
33.229 31.737
35.868
29.508 35.645
28.21
33.001 32.84736.8
4
34.53 27.71
30.566
38.63 32.25
28.94
35.68 37.389
37.58
32.89 34.37
28.71
34.87 40.82
33.613
34.884
34.817
39.184 37.24
38.14
33.08 31.21
31.646
29.335 25.28
32.648
36.72 34.305
26.014
34.586 29.29
32.24
34.019 27.104
29.24
33.43 41.138
39.03
39.313 35.56
43.05
37.05 35.512
40.74
Bioelectrical Impedance Analysis (BIA) For Assessing Tbw and Ffm of Indian Females
||Issn 2250-3005 || || March || 2014 || Page 5
Flowchart showing the general process carried to develop and predict TBW and FFM at different
frequencies:
Fig1: Flowchart showing the general process to develop linear model of TBW and FFM at frequencies of
5KHz,50KHz,100KHz and 200KHz
Results and Statistical Analysis: The equation used to predict TBW and FFM were developed at the
frequencies of 5KHz,50KHz,100KHz,200KHz.by using the data from table 1 and 2 .The table below show the
predicted TBW and FFM equation at different frequencies and their statistical analysis:

Bioelectrical Impedance Analysis (BIA) For Assessing Tbw and Ffm of Indian Females
||Issn 2250-3005 || || March || 2014 || Page 6
TABLE 3.
S.N
o.
Prediction Equations developed Freq
uenc
y
Mean Standard
deviation
Standard
error
Residu
al
error
Multi
pleR2
Adj
uste
d R2
1. TBW=0.24689Wt.+0.25593Zi+5.58336 5KHz TBW=25.85
53
Wt.=51.9333 Zi=29.10972
TBW=3.093
788
Wt.=7.717176
Zi=3.152058
Intercept =
2.24234
Wt.=0.04102
Zi=0.10042
1.845
on 57
df
0.656
4
0.64
44
2. TBW=0.22363Wt.+0.9178Zi+4.89741 50KHz
TBW=25.8553
Wt.=51.9333
Zi=32.02492
TBW=3.093788
Wt.=7.71717
6 Zi=3.629973
Intercept=2.06674
Wt.=0.2236
3 Zi=0.08522
1.773 on 57
df
0.6826
0.6714
3. TBW=0.23751Wt.+0.24204Zi+5.31032 100K
Hz
TBW=25.85
53 Wt.=51.9333
Zi=33.921
TBW=3.093
788 Wt.=7.71717
6
Zi=3.837306
Intercept=2.
12356 Wt.=0.0399
6
Zi=0.8057
1.809
on 57 df
0.669
6
0.65
8
4. TBW=0.24689Wt.+0.25593Zi+5.58336 200K
Hz
TBW=25.85
53
Wt.=51.9333 Zi=34.31884
TBW=3.093
788
Wt.=7.717176
Zi=4.070613
Intercept=2.
01648
Wt.=0.03921
Zi=0.07433
1.787
on 57
df
0.677
6
0.66
63
5. FFM=0.12496Wt.+0.56707Zi+15.91914 5KHz FFM=38.91633
Wt.=51.9333
Zi=29.10988
FFM=3.96432
Wt.=7.71717
6 Zi=3.152027
Intercept=3.7801
Wt.=0.0691
5 Zi=0.16929
3.11 on 57 df
0.4054
0.3845
6. FFM=0.11924Wt.+0.50014Zi+16.70689 50K
Hz
FFM=38.916
33 Wt.=51.9333
Zi=32.02492
FFM=3.9643
2 Wt.=7.71717
6
Zi=3.629973
Intercept=3.
62533 Wt.=0.0703
2
Zi=0.14949
3.111
on 57 df
0.405
1
0.38
43
7. FFM=0.1392Wt.+0.42686Zi+17.20422 100K
Hz
FFM=38.916
33
Wt.=51.9333
Zi=33.92158
FFM=3.9643
2
Wt.=7.71717
6
Zi=3.827306
Intercept=3.
70514
Wt.=0.0697
1
Zi=0.14057
3.157
on 57
df
0.387
4
0.36
59
8. FFM=0.21844Wt.+0.34863Zi+15.78796 200K
Hz
FFM=39.109
Wt.=51.9333
Zi=34.35368
FFM=3.9268
Wt.=7.71717
6 Zi=4.160915
Intercept=3.
05025
Wt.=0.06081
Zi=0.11278
2.752
on 57
df
0.525
6
0.50
9

Bioelectrical Impedance Analysis (BIA) For Assessing Tbw and Ffm of Indian Females
||Issn 2250-3005 || || March || 2014 || Page 7
Graphical Analysis: The graphical interpretation of data include scatter matrix plot, Random scatter
distribution, normal distribution, scale location plot, residual verses leverage plot and standardized residual
verses cook’s distance plot at different frequencies
Fig.2: Scatter Plot Matrix distribution of body composition of Indian females showing the relationship between
Total Body Water(TBW)in (litre) , Impedance Index (Height2/Impedance of body at frequencies of
5KHz,50KHz,100KHz,200KHz)in (cm2/Ω) and Weight of body in Kg.
Bioelectrical Impedance Analysis (BIA) For Assessing Tbw and Ffm of Indian Females
||Issn 2250-3005 || || March || 2014 || Page 8
Fig3 :Random scatter distribution of residual versus fitted values of Indian males showing the relationship
between Total Body Water(TBW)in (litre) , Impedance Index (Height2/Impedance of body at
5KHz.frequency)in (cm2/Ω) and Weight of body in Kg. at 5KHz.

Bioelectrical Impedance Analysis (BIA) For Assessing Tbw and Ffm of Indian Females
||Issn 2250-3005 || || March || 2014 || Page 9
Fig.4: Normal distribution versus Standardized residuals of Indian females showing the relationship between
Total Body Water(TBW)in (litre) , Impedance Index (Height2/Impedance of body at frequencies of
5KHz.,50KHz.,100KHz.,200KHz.)in (cm2/Ω) and Weight of body in Kg. at 5 KHz.

Bioelectrical Impedance Analysis (BIA) For Assessing Tbw and Ffm of Indian Females
||Issn 2250-3005 || || March || 2014 || Page 10
Fig5: Scale location plot between the square root of standardized residuals versus fitted values of Indian females
showing the relationship between Total Body Water(TBW)in (litre) , Impedance Index (Height2/Impedance of
body at 5KHz,50KHz.,100KHz.,200KHz.frequencies)in (cm2/Ω) and Weight of body in Kg.

Bioelectrical Impedance Analysis (BIA) For Assessing Tbw and Ffm of Indian Females
||Issn 2250-3005 || || March || 2014 || Page 11
Fig6: Residual versus leverage plot and standardised residuals verses cook’s distance plot of Indian females
showing the relationship between Total Body Water(TBW)in (litre) , Impedance Index (Height2/Impedance of
body at 5KHz,50KHz,100KHz,200KHz.frequencies)in (cm2/Ω) and Weight of body in Kg.
Fig7: Scatter Plot Matrix distribution of body composition of Indian females showing the relationship between
Fat Free Mass(FFM)in Kg. , Impedance Index (Height2/Impedance of body at
5KHz.,50KHz,100KHz,200KHzfrequencies) in (cm2/Ω) and Weight of body.

Bioelectrical Impedance Analysis (BIA) For Assessing Tbw and Ffm of Indian Females
||Issn 2250-3005 || || March || 2014 || Page 12
Fig 8: Random scatter distribution residual versus fitted values of Indian males showing the relationship
between Fat Free Mass(FFM)in Kg. , Impedance Index (Height2/Impedance of body at
5KHz,50KHz,100KHz,200KHz.frequencies) in (cm2/Ω) and Weight of body in Kg.
Bioelectrical Impedance Analysis (BIA) For Assessing Tbw and Ffm of Indian Females
||Issn 2250-3005 || || March || 2014 || Page 13
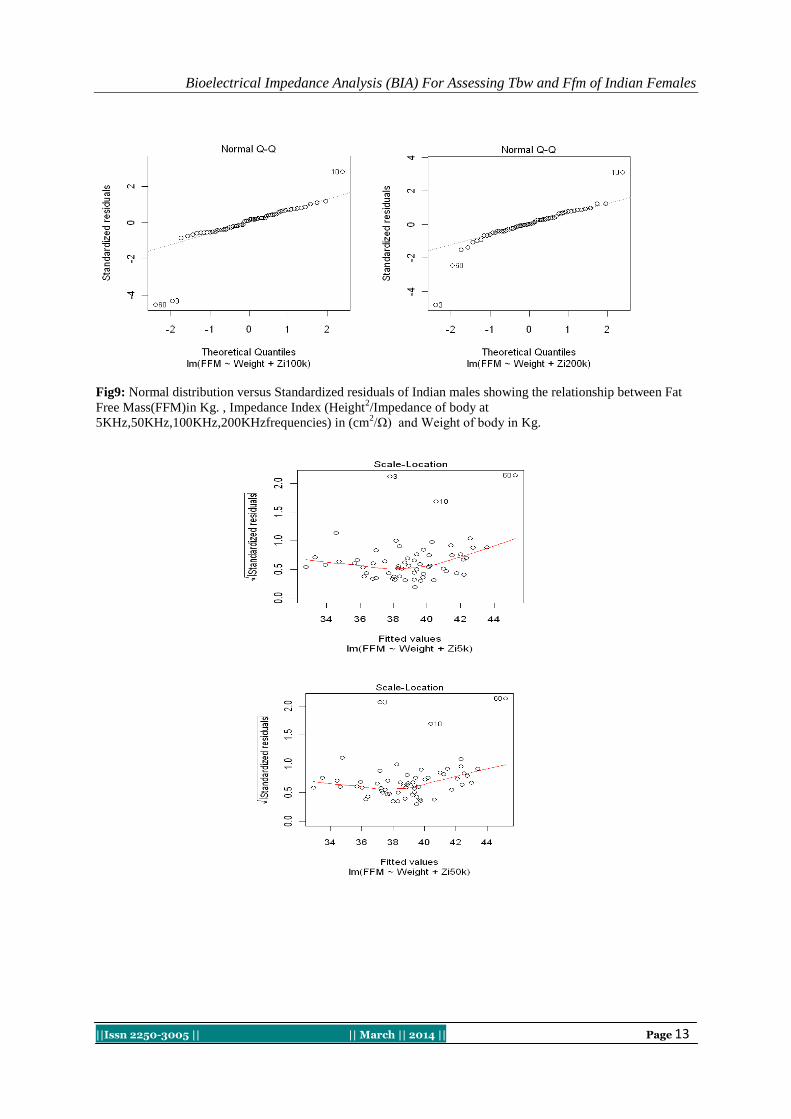
Fig9: Normal distribution versus Standardized residuals of Indian males showing the relationship between Fat
Free Mass(FFM)in Kg. , Impedance Index (Height2/Impedance of body at
5KHz,50KHz,100KHz,200KHzfrequencies) in (cm2/Ω) and Weight of body in Kg.

Bioelectrical Impedance Analysis (BIA) For Assessing Tbw and Ffm of Indian Females
||Issn 2250-3005 || || March || 2014 || Page 14
Fig10: Scale location plot between the square root of standardized residuals versus fitted values of Indian
females showing the relationship between Fat Free Mass(FFM)in (Kg) , Impedance Index (Height2/Impedance
of body at 5KHz,50KHz.,100KHz.,200KHz.frequencies)in (cm2/Ω) and Weight of body in Kg.
Bioelectrical Impedance Analysis (BIA) For Assessing Tbw and Ffm of Indian Females
||Issn 2250-3005 || || March || 2014 || Page 15
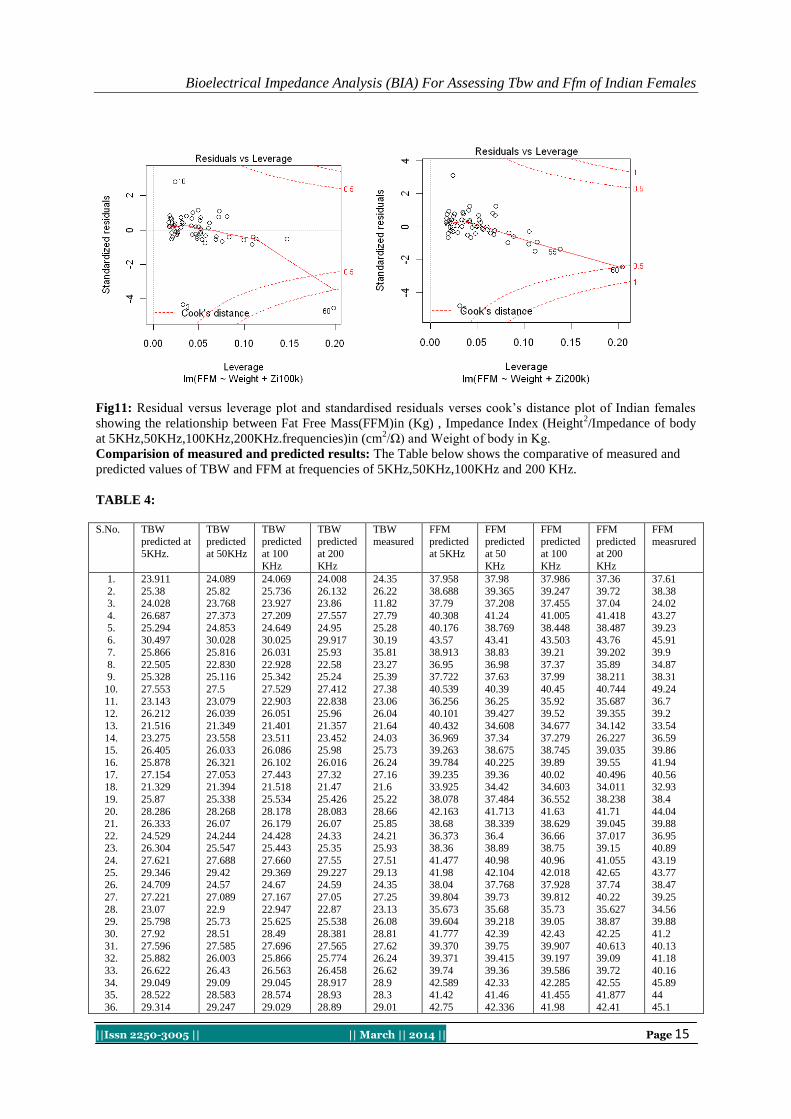
Fig11: Residual versus leverage plot and standardised residuals verses cook’s distance plot of Indian females
showing the relationship between Fat Free Mass(FFM)in (Kg) , Impedance Index (Height2/Impedance of body
at 5KHz,50KHz,100KHz,200KHz.frequencies)in (cm2/Ω) and Weight of body in Kg.
Comparision of measured and predicted results: The Table below shows the comparative of measured and
predicted values of TBW and FFM at frequencies of 5KHz,50KHz,100KHz and 200 KHz.
TABLE 4:
S.No. TBW
predicted at 5KHz.
TBW
predicted at 50KHz
TBW
predicted at 100
KHz
TBW
predicted at 200
KHz
TBW
measured
FFM
predicted at 5KHz
FFM
predicted at 50
KHz
FFM
predicted at 100
KHz
FFM
predicted at 200
KHz
FFM
measrured
1.
2. 3.
4.
5. 6.
7.
8. 9.
10.
11. 12.
13.
14. 15.
16.
17. 18.
19.
20. 21.
22. 23.
24.
25. 26.
27.
28. 29.
30.
31. 32.
33.
34. 35.
36.
23.911
25.38 24.028
26.687
25.294 30.497
25.866
22.505 25.328
27.553
23.143 26.212
21.516
23.275 26.405
25.878
27.154 21.329
25.87
28.286 26.333
24.529 26.304
27.621
29.346 24.709
27.221
23.07 25.798
27.92
27.596 25.882
26.622
29.049 28.522
29.314
24.089
25.82 23.768
27.373
24.853 30.028
25.816
22.830 25.116
27.5
23.079 26.039
21.349
23.558 26.033
26.321
27.053 21.394
25.338
28.268 26.07
24.244 25.547
27.688
29.42 24.57
27.089
22.9 25.73
28.51
27.585 26.003
26.43
29.09 28.583
29.247
24.069
25.736 23.927
27.209
24.649 30.025
26.031
22.928 25.342
27.529
22.903 26.051
21.401
23.511 26.086
26.102
27.443 21.518
25.534
28.178 26.179
24.428 25.443
27.660
29.369 24.67
27.167
22.947 25.625
28.49
27.696 25.866
26.563
29.045 28.574
29.029
24.008
26.132 23.86
27.557
24.95 29.917
25.93
22.58 25.24
27.412
22.838 25.96
21.357
23.452 25.98
26.016
27.32 21.47
25.426
28.083 26.07
24.33 25.35
27.55
29.227 24.59
27.05
22.87 25.538
28.381
27.565 25.774
26.458
28.917 28.93
28.89
24.35
26.22 11.82
27.79
25.28 30.19
35.81
23.27 25.39
27.38
23.06 26.04
21.64
24.03 25.73
26.24
27.16 21.6
25.22
28.66 25.85
24.21 25.93
27.51
29.13 24.35
27.25
23.13 26.08
28.81
27.62 26.24
26.62
28.9 28.3
29.01
37.958
38.688 37.79
40.308
40.176 43.57
38.913
36.95 37.722
40.539
36.256 40.101
40.432
36.969 39.263
39.784
39.235 33.925
38.078
42.163 38.68
36.373 38.36
41.477
41.98 38.04
39.804
35.673 39.604
41.777
39.370 39.371
39.74
42.589 41.42
42.75
37.98
39.365 37.208
41.24
38.769 43.41
38.83
36.98 37.63
40.39
36.25 39.427
34.608
37.34 38.675
40.225
39.36 34.42
37.484
41.713 38.339
36.4 38.89
40.98
42.104 37.768
39.73
35.68 39.218
42.39
39.75 39.415
39.36
42.33 41.46
42.336
37.986
39.247 37.455
41.005
38.448 43.503
39.21
37.37 37.99
40.45
35.92 39.52
34.677
37.279 38.745
39.89
40.02 34.603
36.552
41.63 38.629
36.66 38.75
40.96
42.018 37.928
39.812
35.73 39.05
42.43
39.907 39.197
39.586
42.285 41.455
41.98
37.36
39.72 37.04
41.418
38.487 43.76
39.202
35.89 38.211
40.744
35.687 39.355
34.142
26.227 39.035
39.55
40.496 34.011
38.238
41.71 39.045
37.017 39.15
41.055
42.65 37.74
40.22
35.627 38.87
42.25
40.613 39.09
39.72
42.55 41.877
42.41
37.61
38.38 24.02
43.27
39.23 45.91
39.9
34.87 38.31
49.24
36.7 39.2
33.54
36.59 39.86
41.94
40.56 32.93
38.4
44.04 39.88
36.95 40.89
43.19
43.77 38.47
39.25
34.56 39.88
41.2
40.13 41.18
40.16
45.89 44
45.1

Bioelectrical Impedance Analysis (BIA) For Assessing Tbw and Ffm of Indian Females
||Issn 2250-3005 || || March || 2014 || Page 16
37.
38.
39. 40.
41.
42. 43.
44.
45. 46.
47.
48. 49.
50. 51.
52.
53. 54.
55.
56. 57.
58.
59. 60.
25.53
26.033
26.329 23.684
20.236
25.613 25.589
26.36
20.867 25.388
26.358
22.823 22.984
23.032 23.526
26.216
29.108 24.825
31.159
26.99 27.832
27.568
25.639 33.504
25.469
25.131
26.133 23.403
20.04
25.5 25.51
26.22
20.696 25.547
25.807
23.048 23.355
22.35 23.347
26.208
29.63 25.75
31.33
26.975 28.754
27.472
25.893 33.371
25.667
25.215
26.27 23.573
20.217
25.563 25.361
26.201
20.759 25.557
26.175
22.86 23.196
22.559 23.448
26.227
29.521 25.644
31.497
26.98 28.68
25.91
28.156 33.45
25.57
25.116
26.155 23.496
20.18
25.465 25.29
26.1
20.825 25.47
26.05
22.8 23.47
22.49 23.47
26.12
29.85 26.08
31.75
26.87 29.155
27.466
25.69 33.26
25.35
25s
26.32 23.51
20.75
25.85 25.49
25.99
21.06 25.74
25.7
23.07 23.88
25.96 23.5
26.21
29.6 26.25
31.27
25.96 29.11
27.61
26.02 32.48
38.17
39.28
38.25 36.19
32.77
38.35 40.41
39.59
33.325 38.48
37.47
36.814 36.748
34.574 35.84
38.84
42.33 38.29
42.2
40.138 41.159
40.99
39.25 45.178
41.238
37.656
38.319 36.016
32.91
38.29 39.626
39.27
33.488 38.898
37.232
36.99 37.25
34.75 35.919
38.975
42.73 39.78
43.002
40.024 42.546
40.614
39.499 45.178
38.566
37.76
38.51 36.27
33.149
38.38 39.42
39.23
33.55 38.93
37.78
36.69 37.003
35.042 36.05
38.99
42.56 39.644
43.25
40.04 42.49
37.88
39.326 45.316
38.679
38.03
39.05 36.28
32.68
38.53 38.856
39.325
33.38 38.77
38.67
35.98 36.822
35.07 36.25
39.24
43.67 39.88
45.22
40.199 43.25
40.94
39.09 46.81
41.25
39.17
39.08 37.06
31.91
37.91 40.7
40.67
31.81 37.66
36.27
35.71 36.4
38.4 34.51
40.34
40.84 37.34
41.73
38.4 40.47
40.18
38.93 40.8
Results and Discussion: The physical characteristics of samples are shown in Table 1 and Table 2. The
prediction equations developed for Total Body Water at 5 KHz, 50 KHz, 100 KHz and 200 KHz. are as shown
below:
TBWBIA= (0.24689)×ZI5k + (0.25593)×Body weight + 5.58336 ………………(1)
TBWBIA= (0.0.22363)×ZI50k + (0.29178)×Body weight + 4.89741 ………………(2)
TBWBIA= (0.23751)×ZI100k + (0.24204)×Body weight + 5.31032 ………………(3)
TBWBIA= (0.0.22363)×ZI200k + (0.29178)×Body weight + 4.89741 ………………(4)
Where TBWBIA is Total body water in litres, ZI5k ZI50k, ZI100k, ZI200k is Impedance indexes of the body at
5KHz,50 KHz,100KHz,200 KHz respectively in (cm2/Ω). Body weight is the weight of the body in Kg.
The prediction equations developed for Fat Free Mass at 5 KHz, 50 KHz, 100 KHz and 200 KHz. are as shown
below:
FFMBIA= (0.12496)×ZI5k + (0.56707)×Body weight + 15.91914 ………………(5)
FFMBIA= (0.11924)×ZI50k + (0.50014)×Body weight + 16.70689 ………………(6)
FFMBIA= (0.13920)×ZI100k + (0.42686)×Body weight + 17.20722 ………………(7)
FFMBIA= (0.21844)×ZI200k + (0.34863)×Body weight + 15.78796 ………………(8)
Where FFMBIA is Total body water in Kg, ZI5k ZI50k, ZI100k, ZI200k is Impedance indexes of the body at 5KHz, 50
KHz, 100KHz, 200 KHz respectively in (cm2/Ω). Body weight is the weight of the body in Kg. The other
statistical analysis such as Standard Error of Estimate (S.E.E.) for Intercept, Impedance index at 5KHz, 50KHz,
100KHz and 200 KHz, Residual Standard Error (R.S.E.), Multiple R squared, mean standard deviation of
predictor variable i.e. Impedance index and weight and dependent variable i.e. TBW and FFM at 5KHz, 50KHz,
100KHz and 200 KHz are given in Table 3.
A comparative study of TBW and FFM at frequencies of 5 KHz, 50 KHz, 100 KHz and 200 KHz
is shown in Table 4. From the results obtained it is seen that predicted values are very close to measured values.
However, predicted values of TBW and FFM at 50 KHz, 100 KHz and 200 KHz are much closer to measured
values then the predicted values at 5 KHz. This is due to the fact that at low frequencies, the current cannot
bridge the cellular membrane and will pass predominantly through the extracellular space. At higher frequencies
penetration of the cell membrane occurs and the current is conducted by both the extra-cellular water (ECW)
and intra-cellular water (ICW).

Bioelectrical Impedance Analysis (BIA) For Assessing Tbw and Ffm of Indian Females
||Issn 2250-3005 || || March || 2014 || Page 17
REFERANCES [1] P.N. Goswami Thesis under the supervision of Dr. Munna Khan ;Prediction and measurement of Human Body composition using
Non-Invasive technique. [2] Segal KR. Van Loan M, Fitzgerald PI, Hodgdon JA, Van Itallie TB. Lean body mass estimation by bioelectrical impedence
analysis:a four site cross validation study.Am J Clin Nutr 1988;47:7-14
[3] Kushner RF, Schoeller DA. Estimation of body water by bioelectrical impedence analysis. Am J Clin Nutr 1986;44:417-24 [4] Deurenberg P, Van der Kooy K, Leenen R, Weststrate JA, Seidell JC.Sex and age specific prediction formulas for estimating body
composition from bioelectrical impedence: a cross-validation study. Int J Obes 1991;15:17-25
[5] Jean C Desport, Pierre M Preux, Corinne Boutloup-Demange, Pierre Clavelou, Bernard Beaufrere, Christine Bonnet, and Philippe P Couratier.Validation of bioelectrical impedence analysis in patients with amyotrophic lateral sclerosis1-3.The Amarican Juornal of
Clinical Nutrition (2003).
[6] Verena K Hass, Jane R Allen, Michael R Kohn, Simon D Clark, ShuHua Zhang, Julie N Briody, Margie Gruca, Sloane Madden, Manfred J Muller, and Kevin J Gaskin.Total body protein in healthy adolescent girls: validation of estimates derived from simpler
measures with neutron activation analysis1-3.The American Journal of Clinical Nutrition (2007). [7] P Deurenberg, M Deurenberg-Yap, LF Foo, G Schmidt and J Wang. Differences in body composition between Singapore Chinese,
Beijing Chinese and Dutch children. European Journal of Clinical Nutrition (2003).
[8] Jordan R Moon, Holly R Hull,Sarah E Tobkin, Masaru Teramoto,Murat Karabulut1, Michael D Roberts, Eric D Ryan, So Jung Kim,Vincent J Dalbo, Ashley A Walter, Abbie T Smith, Joel T Cramer and Jeffrey R Stout. Percent body fat estimations in college
women using field and laboratory methods: a three-compartment model approach. Journal of the International Society of Sports
Nutrition 2007,doi:10.1186/1550-2783, pp:4-16 [9] Noe¨l Cameron, Paula L Griffiths, Melanie M Wright, Charlotte Blencowe, Nicola C Davis, John M Pettifor, and Shane A Norris.
Regression equations to estimate percentage body fat in African prepubertal children aged 9. Am J Clin Nutr 2004, Vol. 80, No.
1,pp: 70-75, July 2004 [10] Cameron B Ritchie and Robert T Davidson* Regional body composition in college-aged Caucasians from anthropometric measures,
Nutrition & Metabolism 2007, doi:10.1186/1743-7075,pp:4-29
[11] Carlo Basile, Luigi Vernaglione, Biagio Di Iorio,Vincenzo Bellizzi, Domenico Chimienti, Carlo Lomonte, Anna Rubino, and Nicola D’Ambrosio. Development and Validation of Bioimpedance Analysis Prediction Equations for Dry Weight in Hemodialysis
Patients. Clin J Am Soc Nephrol 2: pp:675-680, 2007
[12] Amir Haider Shah and Rakhshanda Bilal; Body composition, its Significance and model for assessment:Pakistan Journal of Nutrition 2009.Vol-2,pp:198-202
[13] Nyboer J. Percent body fat by four terminal bio-electrical impedance and body density in college freshmen. Proceedings of the V
International Conference on Electrical Bio-impedance 1981, Tokyo.,Vol-8,pp:56-71 [14] Sun SS, Chumlea WC, Heymsfield SB, Lukaski HC, Schoeller D, Friedl K, Kuczmarski RJ, Flegal KM, Johnson CL & Hubbard
Van S (2003) Development of bioelectrical impedance analysis prediction equations for body composition with the use of a
multicomponent model for use in epidemiological suerveys,Vol-77,pp:331-340 [15] Troiano RP, Flegal KM, Kuczmarski RJ. Overweight prevalence and trends for children and adolescents: The National Health and
Nutrition Examination Surveys, 1963 to1991. Arch Pediatr Adolesc Med 1995;Vol-149:1085–91
Author for Corrospondendence: Ghazala Perveen Khan,