Embed Size (px)
Citation preview

t e c h n i c a l s u b c o m m i t t e ec o m p o n e n t r e p o rt
Biodiversity Safety NetGap Analysis
P R E PA R E D B Y: G . L O N G , C O M PA S S R E S O U R C E M A N A G E M E N T L T D.
F O R : T H E B I O D I V E R S I T Y B C T E C H N I C A L S U B C O M M I T T E E
F O R T H E R E P O RT O N T H E S TAT U S O F B I O D I V E R S I T Y I N B C
M AY 2 0 0 7

Technical Sub-Committee Component Report
Biodiversity Safety Net Gap Analysis
Prepared By: G. Long, Compass Resource Management Ltd.
Prepared For: The Biodiversity BC Technical Sub Committee For the Report on the Status on Biodiversity in BC
Date: May 2007

Biodiversity Safety Net Gap Analysis. Compass Resource Management Ltd. May 24, 2007 2
Biodiversity Safety Net Gap Analysis Final Report
Biodiversity BC Steering Committee
Graham Long Partner, Compass Resource Management Ltd.
200 - 1260 Hamilton St. Vancouver, B.C. V6B 2S8
Canada Phone: 604-641-2875
Biodiversity Safety Net Gap Analysis. Compass Resource Management Ltd. May 24, 2007 i
1 Executive Summary The Biodiversity BC (BBC)1 is developing a Biodiversity Action Plan for British Columbia. The process for developing the action plan will include the preparation of an ecological assessment that describes the current status, impacts and trends of biodiversity in British Columbia. This document represents the results of the safety net gap analysis, which identifies the present level of residual impact on biodiversity despite the current mitigative measures (i.e. legislation, policy and programs) in place. Therefore the output will identifies the current gaps in protecting biodiversity despite our current conservation actions. In this study, we have attempted to identify biodiversity gaps through an approach that combines a systematic, quantitative expert judgment approach, which links broad categories of stressors, impact mechanisms and biodiversity ends, with a qualitative, open-ended survey of experts. Over two phases, 25 biodiversity experts with a generalized knowledge of the issues facing the Province were asked to complete a Microsoft Excel spreadsheet based surveys in each phase. In Phase I, 17 experts were asked to express, using both absolute and relative measures, the concern they felt for various biodiversity ‘ends’ (i.e. genetic, species & population, ecosystems in both freshwater and terrestrial realms). They were then asked to identify the relative magnitude of the relationships between those ends, through the mechanisms (e.g. habitat loss) that directly harm them – and the stressors (e.g. resource development) that ultimately give rise to them. The survey also asked numerous open-ended questions about current levels of harm and about policy gaps they felt existed. In the second Phase, a second group of 18 experts (including ten from Phase I and eight new to the process), were asked to review the findings from Phase I, and to propose specific action items for an Action Plan. In our examination of biodiversity ends, we found that in both the terrestrial and freshwater realms, experts are more concerned about mitigative gaps associated with degradation to ecosystems than species / populations or genetic diversity. This concern is reflected in qualitative comments around action items, where there is a strong interest among many for a more ecosystem-based approach to planning and conservation. We examined six categories of impact mechanisms and found that the primary areas of current mitigative failure were Ecosystem Alteration, Ecosystem Loss and Alien Species over other mechanisms: Direct Mortality, Disturbance, and Environmental Contamination. We further examined 12, collectively exhaustive, stressors and elicited from experts the extent to which each gives rise to the six impact mechanisms. By combining the resulting quantitative data through a modified Delphi approach with those already mentioned, we were able to rank the mitigative gaps associated with the stressors. Of the 12, urban / rural development, agriculture, transport and utility corridors, forestry,
1 The BBC is also known as the Conservation Planning Tools Committee under the BC Conservation Land Forum established in 2005

Biodiversity Safety Net Gap Analysis. Compass Resource Management Ltd. May 24, 2007 ii
climate change and oil and gas are the six currently resulting in most concern for biodiversity values. Finally, we asked experts to list areas that should be addressed by an Action Plan. Experts suggested a wide range of ideas, with common themes including:
• More focus on ecosystem / landscape level planning and conservation that would help reduce fragmentation of key habitats and protect species without the need to necessarily understand them
• A more active and hands-on role for government in land use planning, particularly in the conservation of connective corridors of use to multiple species
• A greater focus on freshwater and non-commercial species, perhaps suggesting a need for a more science-based approach to investing resources into understanding and protecting species at risk
• More focus on rapidly developing specific issues, such as climate change adaptation and alien species introductions
• The need to provide funds for basic research into the life histories of many native species for which very little is known.
• The need to communicate to elected officials and the public the value provided by biodiversity and its importance relative to other, more short-term competing resource management objectives
Biodiversity Safety Net Gap Analysis. Compass Resource Management Ltd. May 24, 2007 iii
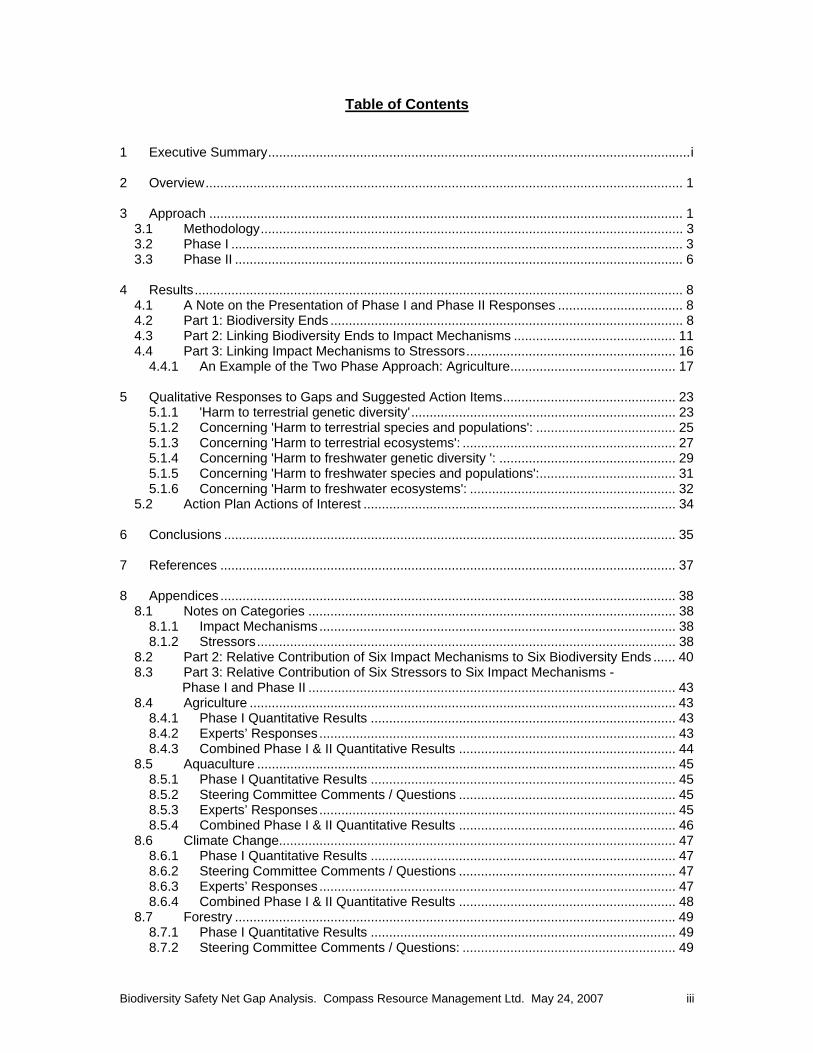
Table of Contents
1 Executive Summary...................................................................................................................i 2 Overview.................................................................................................................................. 1 3 Approach ................................................................................................................................. 1
3.1 Methodology................................................................................................................... 3 3.2 Phase I ........................................................................................................................... 3 3.3 Phase II .......................................................................................................................... 6
4 Results..................................................................................................................................... 8
4.1 A Note on the Presentation of Phase I and Phase II Responses .................................. 8 4.2 Part 1: Biodiversity Ends ................................................................................................ 8 4.3 Part 2: Linking Biodiversity Ends to Impact Mechanisms ............................................ 11 4.4 Part 3: Linking Impact Mechanisms to Stressors......................................................... 16
4.4.1 An Example of the Two Phase Approach: Agriculture............................................. 17 5 Qualitative Responses to Gaps and Suggested Action Items............................................... 23
5.1.1 'Harm to terrestrial genetic diversity'........................................................................ 23 5.1.2 Concerning 'Harm to terrestrial species and populations': ...................................... 25 5.1.3 Concerning 'Harm to terrestrial ecosystems': .......................................................... 27 5.1.4 Concerning 'Harm to freshwater genetic diversity ': ................................................ 29 5.1.5 Concerning 'Harm to freshwater species and populations':..................................... 31 5.1.6 Concerning 'Harm to freshwater ecosystems': ........................................................ 32
5.2 Action Plan Actions of Interest ..................................................................................... 34 6 Conclusions ........................................................................................................................... 35 7 References ............................................................................................................................ 37 8 Appendices ............................................................................................................................ 38
8.1 Notes on Categories .................................................................................................... 38 8.1.1 Impact Mechanisms................................................................................................. 38 8.1.2 Stressors.................................................................................................................. 38
8.2 Part 2: Relative Contribution of Six Impact Mechanisms to Six Biodiversity Ends ...... 40 8.3 Part 3: Relative Contribution of Six Stressors to Six Impact Mechanisms - Phase I and Phase II .................................................................................................... 43 8.4 Agriculture .................................................................................................................... 43
8.4.1 Phase I Quantitative Results ................................................................................... 43 8.4.2 Experts’ Responses................................................................................................. 43 8.4.3 Combined Phase I & II Quantitative Results ........................................................... 44
8.5 Aquaculture .................................................................................................................. 45 8.5.1 Phase I Quantitative Results ................................................................................... 45 8.5.2 Steering Committee Comments / Questions ........................................................... 45 8.5.3 Experts’ Responses................................................................................................. 45 8.5.4 Combined Phase I & II Quantitative Results ........................................................... 46
8.6 Climate Change............................................................................................................ 47 8.6.1 Phase I Quantitative Results ................................................................................... 47 8.6.2 Steering Committee Comments / Questions ........................................................... 47 8.6.3 Experts’ Responses................................................................................................. 47 8.6.4 Combined Phase I & II Quantitative Results ........................................................... 48
8.7 Forestry ........................................................................................................................ 49 8.7.1 Phase I Quantitative Results ................................................................................... 49 8.7.2 Steering Committee Comments / Questions: .......................................................... 49
Biodiversity Safety Net Gap Analysis. Compass Resource Management Ltd. May 24, 2007 iv
8.7.3 Experts’ Responses................................................................................................. 49 9.3.4 Combined Phase I & II Quantitative Results ........................................................... 50
8.8 Grazing......................................................................................................................... 51 8.8.1 Phase I Quantitative Results ................................................................................... 51 8.8.2 Steering Committee Comments / Questions: .......................................................... 51 8.8.3 Experts’ Responses................................................................................................. 51 8.8.4 Combined Phase I & II Quantitative Results ........................................................... 52
8.9 Industrial Development ................................................................................................ 53 8.9.1 Phase I Quantitative Results ................................................................................... 53 8.9.2 Steering Committee Comments / Questions: .......................................................... 53 8.9.3 Experts’ Responses................................................................................................. 53 8.9.4 Combined Phase I & II Quantitative Results ........................................................... 54
8.10 Mining........................................................................................................................... 55 8.10.1 Phase I Quantitative Results ............................................................................... 55 8.10.2 Steering Committee Comments / Questions: ...................................................... 55 8.10.3 Experts’ Responses............................................................................................. 55 8.10.4 Combined Phase I & II Quantitative Results ....................................................... 56
8.11 Oil & Gas ...................................................................................................................... 57 8.11.1 Phase I Quantitative Results ............................................................................... 57 8.11.2 Steering Committee Comments / Questions: ...................................................... 57 8.11.3 Experts’ Responses............................................................................................. 57 8.11.4 Combined Phase I & II Quantitative Results ....................................................... 58
8.12 Recreation .................................................................................................................... 59 8.12.1 Phase I Quantitative Results ............................................................................... 59 8.12.2 Steering Committee Comments / Questions: ...................................................... 59 8.12.3 Experts’ Responses............................................................................................. 59 8.12.4 Combined Phase I & II Quantitative Results ....................................................... 60
8.13 Transportation and Utility Corridors ............................................................................. 61 8.13.1 Phase I Quantitative Results ............................................................................... 61 8.13.2 Steering Committee Comments / Questions: ...................................................... 61 8.13.3 Experts’ Responses............................................................................................. 61 8.13.4 Combined Phase I & II Quantitative Results ....................................................... 62
8.14 Urban / Rural Development.......................................................................................... 63 8.14.1 Phase I Quantitative Results ............................................................................... 63 8.14.2 Steering Committee Comments / Questions: ...................................................... 63 8.14.3 Experts’ Responses............................................................................................. 63 8.14.4 Combined Phase I & II Quantitative Results ....................................................... 64
8.15 Water Development ..................................................................................................... 65 8.15.1 Phase I Quantitative Results ............................................................................... 65 8.15.2 Steering Committee Comments / Questions: ...................................................... 65 8.15.3 Experts’ Responses............................................................................................. 65 8.15.4 Combined Phase I & II Quantitative Results ....................................................... 66

Biodiversity Safety Net Gap Analysis. Compass Resource Management Ltd. May 24, 2007 1
2 Overview In October 2004, the provincial government announced the contribution of $8 million to create the B.C. Trust for Public Lands to support biodiversity conservation in British Columbia. As part of the Trust agreement, the B.C. Conservation Land Forum was established, which consisted of three levels of government and six environmental non-governmental organizations. The B.C. Conservation Lands Forum’s charter includes an independent Conservation Planning Tools Committee (CPTC), known as Biodiversity BC (BBC), with the mandate to develop and facilitate implementation of a comprehensive, science-based Biodiversity Action Plan for British Columbia. Members of the BBC include: Environment Canada, B.C. Ministry of Environment, B.C. Ministry of Agriculture and Lands, Union of B.C. Municipalities, Ducks Unlimited Canada, Nature Conservancy of Canada, The Land Conservancy of B.C., The Nature Trust of British Columbia, Pacific Salmon Foundation, Habitat Conservation Trust Fund, and the World Wildlife Fund. The Biodiversity Action Plan is intended to inform policy development and decision-making processes for both government and non-government organizations in British Columbia. An ecological assessment of biodiversity in British Columbia is being conducted to determine key issues and priorities that will need to be addressed as part of the Action Plan. The Biodiversity BC Committee is mandated to prepare a Biodiversity Action Plan for British Columbia. The process for developing the action plan will include the preparation of an ecological assessment that describes the current status, impacts and trends of biodiversity in British Columbia. The assessment will also identify data gaps and a range of options to address key biodiversity issues in British Columbia. The inclusion of First Nations traditional ecological knowledge will also be an important consideration in the process for conducting an ecological assessment. This document represents one of the steps in the ecological assessment: a safety net gap analysis. The purpose of the safety net gap analysis is to identify the present level of residual impact on biodiversity despite the current mitigative measures (i.e. legislation, policy and programs) in place.
3 Approach The core aim of this work is to provide a snapshot of the present level of impact on biodiversity that is occurring despite current mitigative measures in the terrestrial and freshwater realms (biodiversity in the marine realm will be coordinated with Fisheries and Oceans Canada and others through other planning processes). This is ambitious, given the multifaceted nature of the concept of ‘biodiversity’ itself, the multitude of populations and disparate ecosystems that exist in British Columbia, and the profound data gaps in our knowledge of our environment. Nevertheless, such a study needs to provide a systematic way of considering the whole spectrum of biodiversity issues, even if from a very high level, in order to ensure that every opportunity is given to highlight important gaps or failings in current mitigative efforts. Additionally, it is important to
Biodiversity Safety Net Gap Analysis. Compass Resource Management Ltd. May 24, 2007 2
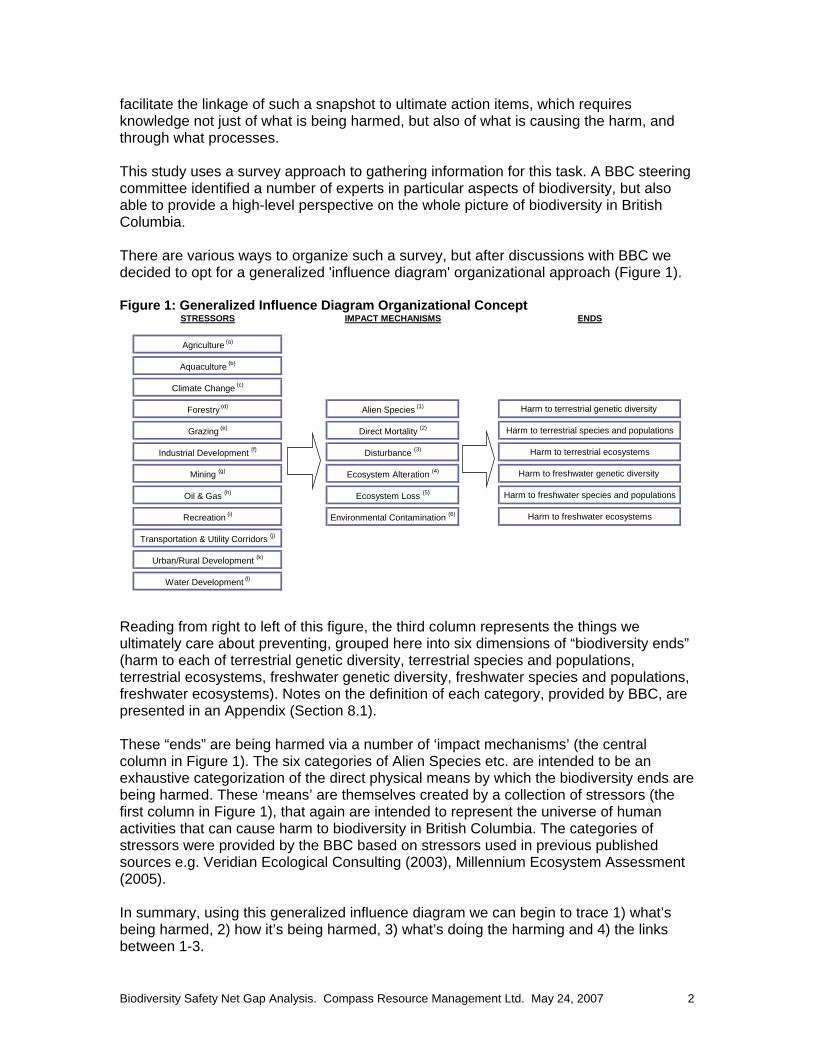
facilitate the linkage of such a snapshot to ultimate action items, which requires knowledge not just of what is being harmed, but also of what is causing the harm, and through what processes. This study uses a survey approach to gathering information for this task. A BBC steering committee identified a number of experts in particular aspects of biodiversity, but also able to provide a high-level perspective on the whole picture of biodiversity in British Columbia. There are various ways to organize such a survey, but after discussions with BBC we decided to opt for a generalized 'influence diagram' organizational approach (Figure 1). Figure 1: Generalized Influence Diagram Organizational Concept
STRESSORS IMPACT MECHANISMS ENDS
Agriculture (a)
Aquaculture (b)
Climate Change (c)
Forestry (d) Alien Species (1) Harm to terrestrial genetic diversity
Grazing (e) Direct Mortality (2) Harm to terrestrial species and populations
Industrial Development (f) Disturbance (3) Harm to terrestrial ecosystems
Mining (g) Ecosystem Alteration (4) Harm to freshwater genetic diversity
Oil & Gas (h) Ecosystem Loss (5) Harm to freshwater species and populations
Recreation (i) Environmental Contamination (6) Harm to freshwater ecosystems
Transportation & Utility Corridors (j)
Urban/Rural Development (k)
Water Development (l)
Reading from right to left of this figure, the third column represents the things we ultimately care about preventing, grouped here into six dimensions of “biodiversity ends” (harm to each of terrestrial genetic diversity, terrestrial species and populations, terrestrial ecosystems, freshwater genetic diversity, freshwater species and populations, freshwater ecosystems). Notes on the definition of each category, provided by BBC, are presented in an Appendix (Section 8.1). These “ends” are being harmed via a number of ‘impact mechanisms’ (the central column in Figure 1). The six categories of Alien Species etc. are intended to be an exhaustive categorization of the direct physical means by which the biodiversity ends are being harmed. These ‘means’ are themselves created by a collection of stressors (the first column in Figure 1), that again are intended to represent the universe of human activities that can cause harm to biodiversity in British Columbia. The categories of stressors were provided by the BBC based on stressors used in previous published sources e.g. Veridian Ecological Consulting (2003), Millennium Ecosystem Assessment (2005). In summary, using this generalized influence diagram we can begin to trace 1) what’s being harmed, 2) how it’s being harmed, 3) what’s doing the harming and 4) the links between 1-3.

Biodiversity Safety Net Gap Analysis. Compass Resource Management Ltd. May 24, 2007 3
We recognize that this categorization is only one of many ways of approaching this complicated subject, and variations on this final form were considered. Of particular note here is the treatment of climate change, which some felt should be treated as an ‘impact mechanism’ rather than a stressor (since it is not a deliberate human activity like the other stressors). However, we decided that climate change manifests its harm via the ‘impact mechanisms’ listed rather than via some other unique means, so it is treated here as a stressor (an unintended human-caused stress on the environment).
3.1 Methodology In parallel to the development of the survey, BBC identified experts they considered would have a valuable overall perspective of biodiversity issues in British Columbia. Experts were chosen that represented individuals that had expertise in British Columbia with species and/or ecosystems and represented government (e.g. Parks Canada, Canadian Wildlife Service, Ministry of Environment, Ministry of Forests), academic institutions (e.g. Simon Fraser University, the University of British Columbia, the University of Northern British Columbia, the University of Victoria), and non-government agencies (e.g. Nature Trust of BC, Nature Conservancy of Canada, Ducks Unlimited Canada). The work was undertaken in two Phases.
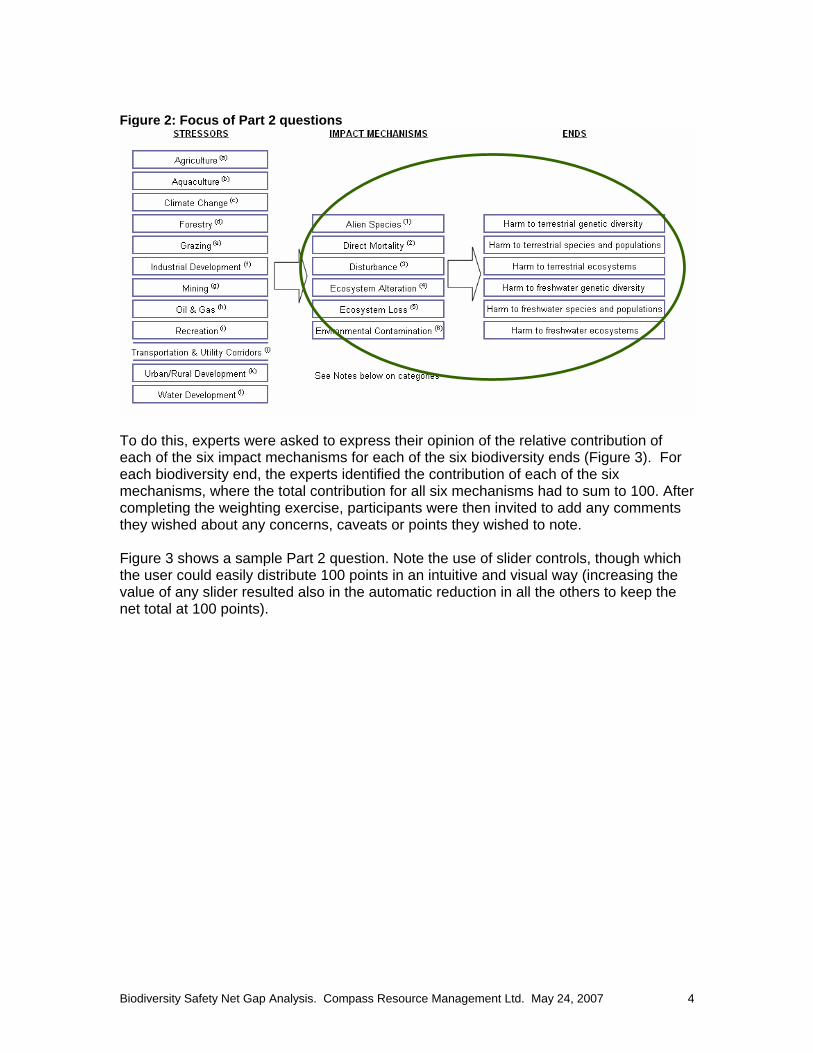
3.2 Phase I In Phase I, we prepared a Microsoft Excel spreadsheet-based survey form, divided into three parts. In part 1, we asked about the concern experts have for the six biodiversity ends across British Columbia. Q1.1 asked: “For the whole of BC, score each aspect of biodiversity on the scale provided.” Rationale: to assess on an absolute scale experts’ understanding of harm to biodiversity ends Q1.2 asked: “For the whole of BC, impacts to which of the six categories concern you most? Distribute 100 'concern points' among the six categories listed.” Rationale: to assess on a relative scale experts’ understanding of harm to biodiversity ends Q1.3 asked three qualitative questions about each of the six biodiversity ends: i) Which species and populations are currently being harmed the most? ii) Are there any specific issues you think policy makers should take special notice of? iii) Where in BC is the most harm occurring (identify geographic area(s))? In Part 2, we probed the links between the impact mechanisms and the biodiversity ends, as shown by the circle in Figure 2.
Biodiversity Safety Net Gap Analysis. Compass Resource Management Ltd. May 24, 2007 4
Figure 2: Focus of Part 2 questions
To do this, experts were asked to express their opinion of the relative contribution of each of the six impact mechanisms for each of the six biodiversity ends (Figure 3). For each biodiversity end, the experts identified the contribution of each of the six mechanisms, where the total contribution for all six mechanisms had to sum to 100. After completing the weighting exercise, participants were then invited to add any comments they wished about any concerns, caveats or points they wished to note. Figure 3 shows a sample Part 2 question. Note the use of slider controls, though which the user could easily distribute 100 points in an intuitive and visual way (increasing the value of any slider resulted also in the automatic reduction in all the others to keep the net total at 100 points).

Biodiversity Safety Net Gap Analysis. Compass Resource Management Ltd. May 24, 2007 5
Figure 3: A sample Question from Part 2 of the Survey
Part 3 followed the same format as Part 2, but focused on the link between Stressors and Impact Mechanisms (circled in Figure 4). Figure 4: Focus of Part 3 questions
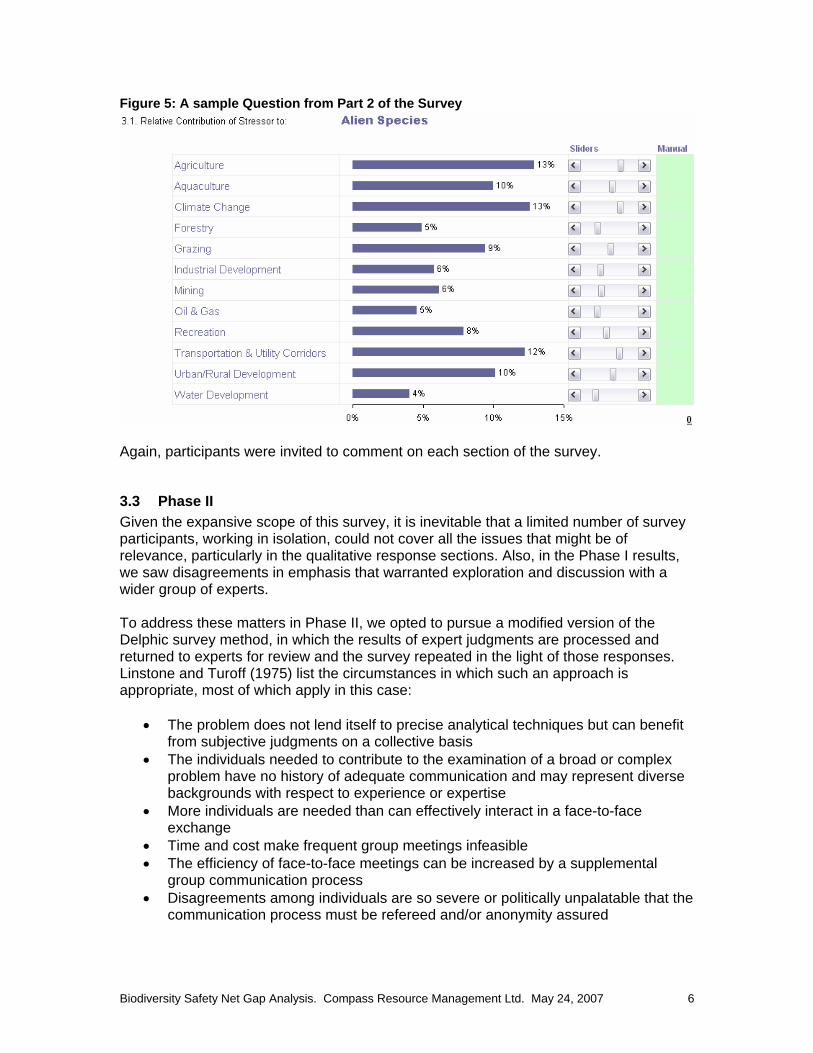
Figure 5 is a screenshot of a sample data entry form for one of the 12 stressors.
Biodiversity Safety Net Gap Analysis. Compass Resource Management Ltd. May 24, 2007 6
Figure 5: A sample Question from Part 2 of the Survey
Again, participants were invited to comment on each section of the survey.
3.3 Phase II Given the expansive scope of this survey, it is inevitable that a limited number of survey participants, working in isolation, could not cover all the issues that might be of relevance, particularly in the qualitative response sections. Also, in the Phase I results, we saw disagreements in emphasis that warranted exploration and discussion with a wider group of experts. To address these matters in Phase II, we opted to pursue a modified version of the Delphic survey method, in which the results of expert judgments are processed and returned to experts for review and the survey repeated in the light of those responses. Linstone and Turoff (1975) list the circumstances in which such an approach is appropriate, most of which apply in this case:
• The problem does not lend itself to precise analytical techniques but can benefit from subjective judgments on a collective basis
• The individuals needed to contribute to the examination of a broad or complex problem have no history of adequate communication and may represent diverse backgrounds with respect to experience or expertise
• More individuals are needed than can effectively interact in a face-to-face exchange
• Time and cost make frequent group meetings infeasible • The efficiency of face-to-face meetings can be increased by a supplemental
group communication process • Disagreements among individuals are so severe or politically unpalatable that the
communication process must be refereed and/or anonymity assured

Biodiversity Safety Net Gap Analysis. Compass Resource Management Ltd. May 24, 2007 7
• The heterogeneity of the participants must be preserved to assure validity of the results, i.e., avoidance of domination by quantity or by strength of personality ("bandwagon effect")
In this case, the Delphic approach served several purposes:
• In the qualitative questions, it allowed Phase II participants to add comments that they thought were ‘missing’ from those already provided by many individuals working in isolation in Phase II.
• In the quantitative questions, it allowed participants to review the responses of others and to take those responses into consideration when re-scoring and commenting.
• It permitted the steering committee to develop and ask numerous specific clarifications about the Phase I results in order to stimulate debate during Phase II.
The Phase II survey contained:
• The questions asked in Phase I • Compiled qualitative and quantitative responses from Phase I, including an
interactive interface that allowed users to closely examine Phase I responses in whatever format they preferred
• A number of specific questions about the Phase I responses developed by the CPTC steering committee, and
• One additional question, in which respondents were asked to list the three Action Items they would most like to see included in the Action Plan resulting from the CPTC’s Biodiversity Strategy.
Phase II was distributed to all the experts who took part in Phase I, plus a number of additional experts. For those experts who had participated in Phase I, the results sections of the survey were personalized to highlight their own responses in relation to the compiled (and anonymous) body of other expert judgments. Phase I was sent out to 40 experts, and completed responses were received from 17. Phase II was sent out to 33 experts from Phase I and 3 new experts2. It was completed by 18 experts, ten of whom had also completed Phase I. Therefore, 25 individual experts participated in the study.
2 Seven of the experts approached for Phase I declined to participate.

Biodiversity Safety Net Gap Analysis. Compass Resource Management Ltd. May 24, 2007 8
4 Results We present the results in generally the same sequence as described above, though the qualitative responses to question 1.3 are presented as a lead up to the conclusions to this report.
4.1 A Note on the Presentation of Phase I and Phase II Responses As described in section 3, Phase II participants were asked mostly the same questions as their predecessors, but had the advantage of seeing Phase I results in a summarized form, and were asked some additional questions that specifically referred to those responses. Consequently, Phase II comments were often more focused on issues of perceived errors or omissions from that Phase, and consequently Phase II responses were initially compiled and analyzed entirely separately to Phase I. Having compared these two data sets and gained insights from doing so, we have nevertheless decided to aggregate the quantitative responses from each Phase for the purposes of this report. We highlight in the text some of the areas in which Phase I and Phase II responses had different emphases, though in general results from both Phases were remarkably consistent. In the Appendix, we show the progression from Phase I through debate to Combined Phase I and Phase II responses for each category of stressor. Note that where an individual participated in both Phases, we have included only the Phase II responses for that individual in the results presented below.
4.2 Part 1: Biodiversity Ends Part 1 asked questions pertaining to the six categories of biodiversity 'ends' we have identified. Is the current level of harm to biodiversity in each of the categories the same, or different? Which should we be most concerned about? Are there special areas of interest that decision makers should be sure to consider? This information may be useful in helping to focus measures towards those areas considered to be of greatest concern in a general sense, and was helpful in providing a basic structure to ask more qualitative questions about issues of importance to each. Also, as described below, the relative concern experts expressed for each biodiversity end was used to develop a ‘concern weighting’ used in calculations to highlight those impact mechanisms and stressors that may be most deserving of further mitigative attention.
Question 1.1 In question 1.1, our intent was to see if there would be any significant differences in the judged rating of biodiversity degradation of the six biodiversity ends on an ‘absolute’ scale (as opposed to a ‘relative’ rating approach used in question 1.2). Q1.1 asked: “For the whole of BC, score each aspect of biodiversity [i.e.biodiversity end] on the scale provided”
Biodiversity Safety Net Gap Analysis. Compass Resource Management Ltd. May 24, 2007 9
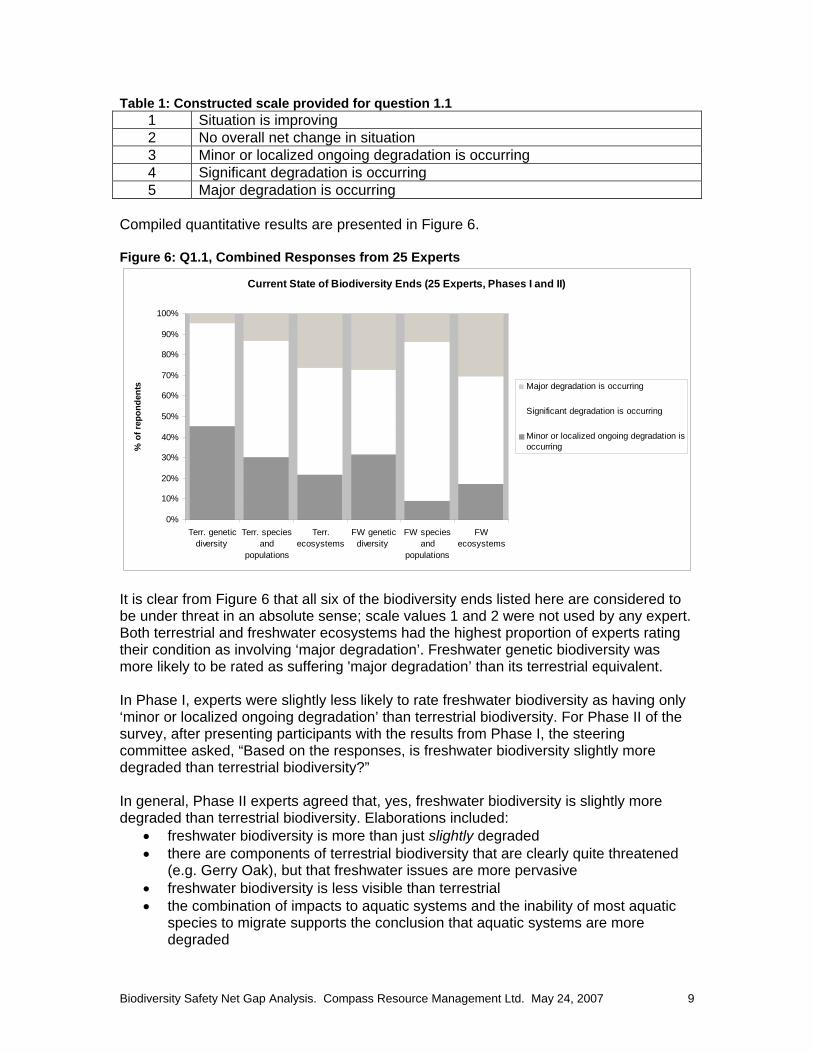
Table 1: Constructed scale provided for question 1.1 1 Situation is improving 2 No overall net change in situation 3 Minor or localized ongoing degradation is occurring 4 Significant degradation is occurring 5 Major degradation is occurring
Compiled quantitative results are presented in Figure 6. Figure 6: Q1.1, Combined Responses from 25 Experts
Current State of Biodiversity Ends (25 Experts, Phases I and II)
0%
10%
20%
30%
40%
50%
60%
70%
80%
90%
100%
Terr. geneticdiversity
Terr. speciesand
populations
Terr.ecosystems
FW geneticdiversity
FW speciesand
populations
FWecosystems
% o
f rep
onde
nts Major degradation is occurring
Significant degradation is occurring
Minor or localized ongoing degradation isoccurring
It is clear from Figure 6 that all six of the biodiversity ends listed here are considered to be under threat in an absolute sense; scale values 1 and 2 were not used by any expert. Both terrestrial and freshwater ecosystems had the highest proportion of experts rating their condition as involving ‘major degradation’. Freshwater genetic biodiversity was more likely to be rated as suffering 'major degradation’ than its terrestrial equivalent. In Phase I, experts were slightly less likely to rate freshwater biodiversity as having only ‘minor or localized ongoing degradation’ than terrestrial biodiversity. For Phase II of the survey, after presenting participants with the results from Phase I, the steering committee asked, “Based on the responses, is freshwater biodiversity slightly more degraded than terrestrial biodiversity?” In general, Phase II experts agreed that, yes, freshwater biodiversity is slightly more degraded than terrestrial biodiversity. Elaborations included:
• freshwater biodiversity is more than just slightly degraded • there are components of terrestrial biodiversity that are clearly quite threatened
(e.g. Gerry Oak), but that freshwater issues are more pervasive • freshwater biodiversity is less visible than terrestrial • the combination of impacts to aquatic systems and the inability of most aquatic
species to migrate supports the conclusion that aquatic systems are more degraded
Biodiversity Safety Net Gap Analysis. Compass Resource Management Ltd. May 24, 2007 10
Therefore we may conclude that in very general terms, experts believe that mitigative gaps currently appear to be more pronounced in the freshwater realm, and that for both freshwater and terrestrial experts are more concerned about gaps in measures aimed at protecting ecosystems rather than specific species and populations. We anticipated that the use of absolute scales to describe the degradation of biodiversity ends would be problematic, given the large variation across issues and the biophysical variation to be found across BC and the consequent difficultly of developing a constructed scale (or series of scales) that could capture these issues. For this reason, the rest of the survey employed questions that elicited ‘relative’ concerns across various issues, beginning with question 1.2.
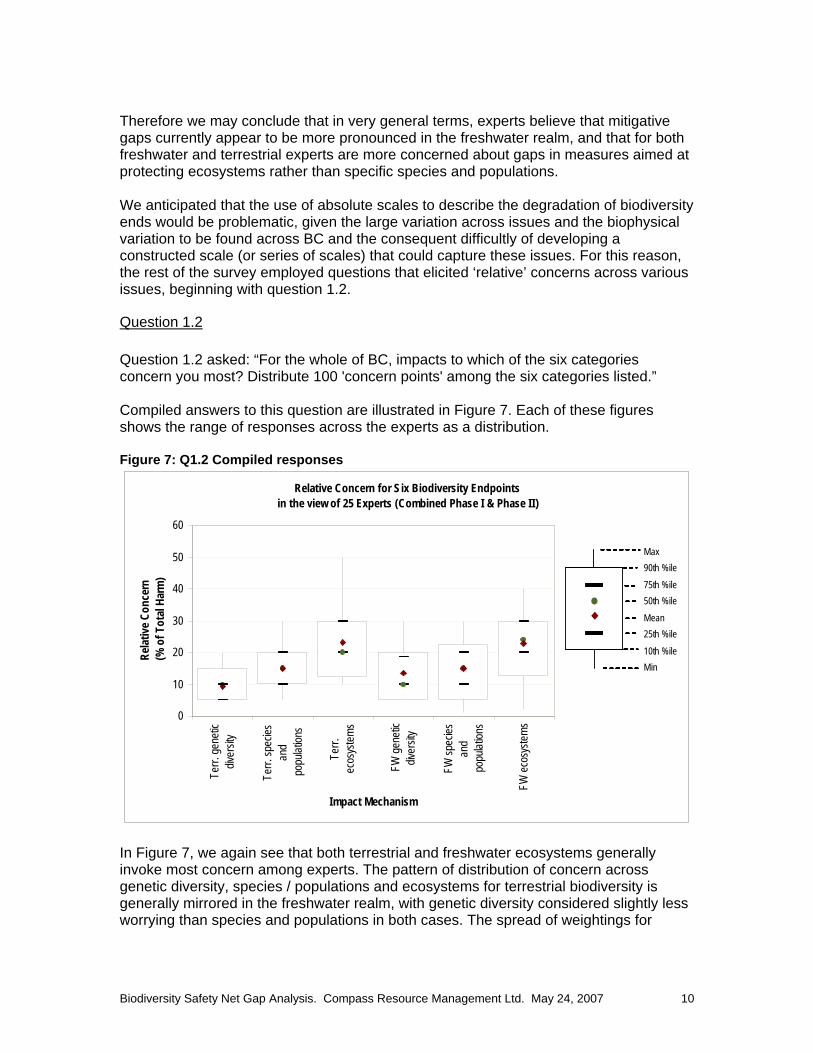
Question 1.2 Question 1.2 asked: “For the whole of BC, impacts to which of the six categories concern you most? Distribute 100 'concern points' among the six categories listed.” Compiled answers to this question are illustrated in Figure 7. Each of these figures shows the range of responses across the experts as a distribution. Figure 7: Q1.2 Compiled responses
Relative Concern for Six Biodiversity Endpoints in the view of 25 Experts (Combined Phase I & Phase II )
0
10
20
30
40
50
60
Terr.
gene
ticdiv
ersit
y
Terr.
spec
iesan
dpo
pulat
ions
Terr.
ecos
ystem
s
FW ge
netic
diver
sity
FW sp
ecies
and
popu
lation
s
FW ec
osys
tems
Impact Mechanism
Relat
ive C
once
rn(%
of T
otal
Harm
)
Max90th %ile75th %ile50th %ileMean25th %ile10th %ileMin
In Figure 7, we again see that both terrestrial and freshwater ecosystems generally invoke most concern among experts. The pattern of distribution of concern across genetic diversity, species / populations and ecosystems for terrestrial biodiversity is generally mirrored in the freshwater realm, with genetic diversity considered slightly less worrying than species and populations in both cases. The spread of weightings for

Biodiversity Safety Net Gap Analysis. Compass Resource Management Ltd. May 24, 2007 11
freshwater species / populations and genetic diversity is somewhat larger for freshwater biodiversity than terrestrial. Comparing questions 1.1 and 1.2 we can clearly see that asking for relative concern between biodiversity ends provides greater definition among the biodiversity ends than asking about absolute impacts, though both techniques point to terrestrial and freshwater ecosystems as the area of greatest perceived impact and concern. Concern for the current status of freshwater genetic biodiversity was more forcefully expressed in question 1.1 than in 1.2. Figure 8 shows a comparison of median relative concern for six biodiversity ends. These values are used to calculate a ‘concern weighting’ for each biodiversity end in the analysis that follows. Figure 8: Comparison of median relative concern for six biodiversity ends, Phase I and Phase II
Relative Concern for six Biodiversity Ends(Average of 25 Experts, Phases I & II)
9.4
15.0
23.2
13.4
15.4
23.7
0.0 5.0 10.0 15.0 20.0 25.0
Terr. genetic diversity
Terr. species and populations
Terr. ecosystems
FW genetic diversity
FW species and populations
FW ecosystems
Concern %
4.3 Part 2: Linking Biodiversity Ends to Impact Mechanisms In 4.2, we explored experts’ judgments on the degree of degradation (or concern for that degradation) for various biodiversity ends and learned that, while many of these aspects are inter-related and mutually reinforcing, there is nevertheless greater concern among experts that additional measures are needed to protect some biodiversity ends more than others. In this part of the analysis, we ask the question, “which impact mechanisms contribute most to harming each of the biodiversity ends”? Answers to these questions, when combined with knowledge about which ends are of greatest concern (from 4.2), help identify where the mitigative gaps (as they pertain to the impact mechanisms directly) exist.

Biodiversity Safety Net Gap Analysis. Compass Resource Management Ltd. May 24, 2007 12
Part 2 of the survey questions addressed this issue (see 3.2, and in particular Figure 3 for details of how Question 2 was asked). Figure 9 illustrates the distribution of all responses to question 2.1, which asked experts to use sliding scales to rate the relative contribution of various Impact Mechanisms to harm to the first of six of our biodiversity ends, terrestrial genetic biodiversity. Figure 9: Relative contribution of six impact mechanisms to harm to terrestrial genetic biodiversity in the view of 25 Experts (Phases I & II)
Relative Contribution of Six Impact Mechanisms to Harm to Terrestrial Genetic Biodiversity in the view of 25 Experts (Phases I & I I)
0%5%
10%15%20%25%30%35%40%45%50%
Alien
Spe
cies
Dire
ct Mo
rtality
Distu
rban
ce
Ecos
ystem
Alter
ation
Ecos
ystem
Loss
Envir
onme
ntal
Conta
mina
tion
Impact Mechanism
Relat
ive C
ontri
butio
n(%
of T
otal
Harm
)
Max90th %ile75th %ile50th %ileMean25th %ile10th %ileMin
It is clear from Figure 9 that the impact mechanisms of Ecosystem Alteration and Ecosystem Loss are the key means through which one of the six biodiversity ends, terrestrial genetic biodiversity are thought to be harmed, and are therefore the key areas of mitigative need. The range of distribution of responses for these two Impact Mechanisms barely overlaps those for the other four. Of these remaining four, alien species has a higher and tighter distribution than the other three, indicating the general belief that this mechanism contributes more to terrestrial genetic biodiversity than the other three. Disturbance has the widest range of distribution across expert responses, perhaps reflecting the wide range of forms that this mechanism can take. Direct mortality, in this case, is considered the least significant means of harm. The results for all six of the biodiversity ends are presented in an Appendix (8.2). A striking feature of these figures is the general similarity of the distribution across the six biodiversity ends to that shown in Figure 9. There are some shifts in emphasis; for example, whereas Ecosystem Loss has a marginally greater significance to terrestrial genetic biodiversity than Ecosystem Alteration, the reverse is true for terrestrial species and populations. Alien species mitigation gaps appear to be of greater relative concern in freshwater systems than terrestrial systems.
Biodiversity Safety Net Gap Analysis. Compass Resource Management Ltd. May 24, 2007 13
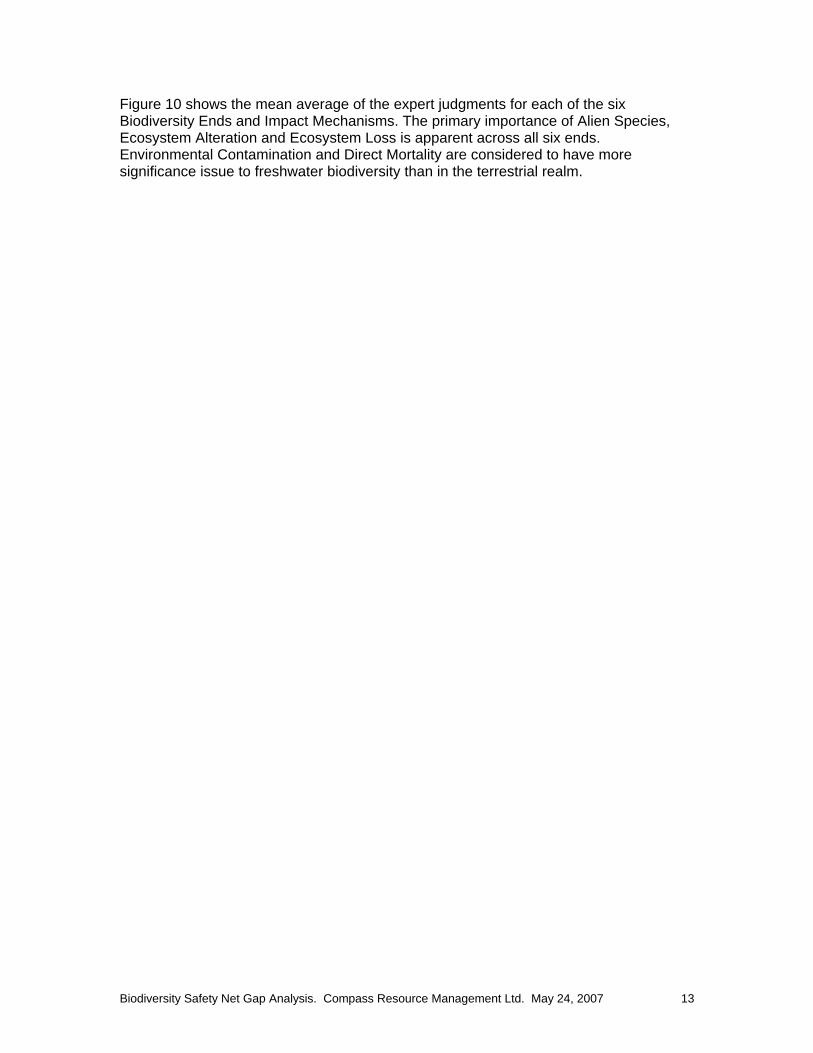
Figure 10 shows the mean average of the expert judgments for each of the six Biodiversity Ends and Impact Mechanisms. The primary importance of Alien Species, Ecosystem Alteration and Ecosystem Loss is apparent across all six ends. Environmental Contamination and Direct Mortality are considered to have more significance issue to freshwater biodiversity than in the terrestrial realm.
Biodiversity Safety Net Gap Analysis. Compass Resource Management Ltd. May 24, 2007 14
Figure 10: Unweighted Relative Impact Mechanism Contribution to Harm to Biodiversity Ends (Average of 25 Experts, Phases I & II)
Unweighted Relative Impact Mechanism Contribution to Harm to Biodiversity EndsAverage of 25 Experts (Phases 1 & II)
0% 10% 20% 30% 40% 50% 60% 70% 80% 90% 100%
Terr. genetic diversity
Terr. species and populations
Terr. ecosystems
FW genetic diversity
FW species and populations
FW ecosystems
Biod
ivers
ity E
nd
Unweighted % Contribution
Alien SpeciesDirect MortalityDisturbanceEcosystem AlterationEcosystem LossEnvironmental Contamination
Figure 11: ‘Concern-weighted’ Relative Impact Mechanism Contribution to Harm to Biodiversity Ends (Average of 25 Experts, Phases I & II)
Concern-weighted Impact Mechanism overall Impact On Biodiversity EndsAverage of 25 Experts (Phases 1 & II)
0 5 10 15 20 25
Terr. genetic diversity
Terr. species and populations
Terr. ecosystems
FW genetic diversity
FW species and populations
FW ecosystems
Biod
ivers
ity E
nd
Concern-weighted impact
Alien SpeciesDirect MortalityDisturbanceEcosystem AlterationEcosystem LossEnvironmental Contamination

Biodiversity Safety Net Gap Analysis. Compass Resource Management Ltd. May 24, 2007 15
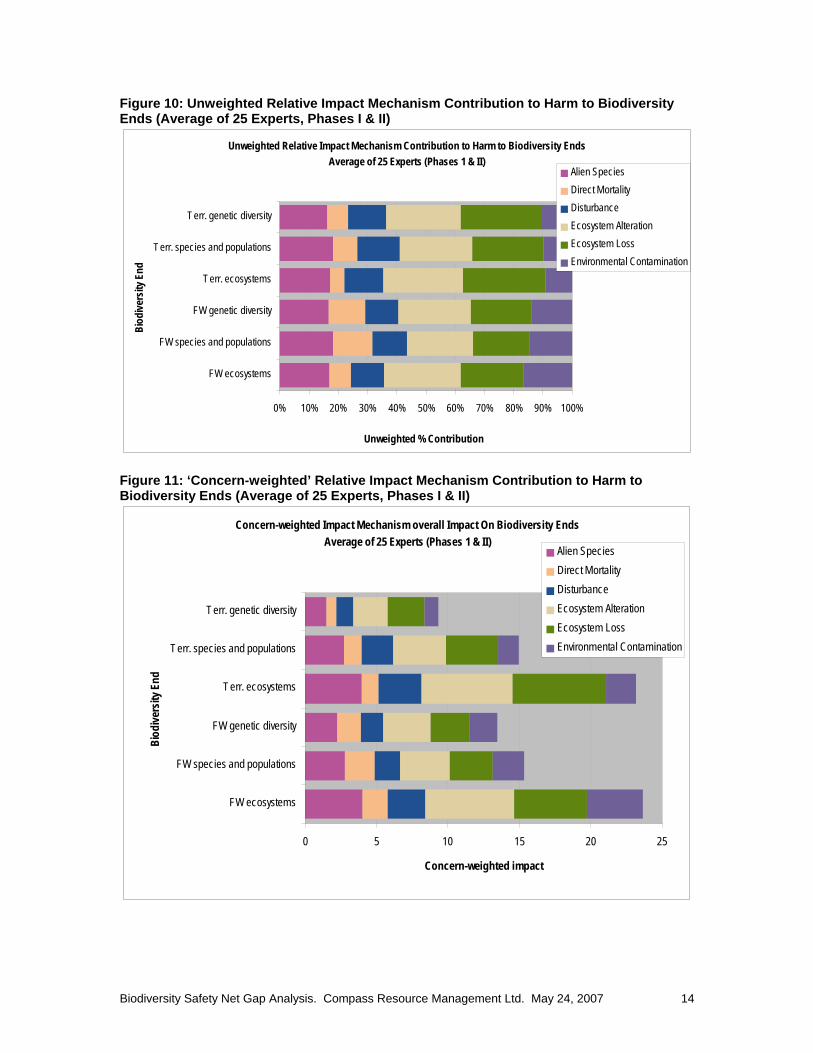
Figure 10 presents each biodiversity end on an equal footing; however, we know that there is greater concern among experts for some of those ends. In Figure 11 we have developed a ‘concern weighted’ distribution of impacts from various impact mechanisms, by multiplying the data by the factors shown in Figure 8 for Phase II. Using the technique of data pivoting, we now can represent the same information, organized this time by impact mechanism rather than biodiversity end (Figure 12). This is valid since we are assuming that the categories used are collectively exhaustive. Figure 12: ‘Concern-weighted’ Relative Impact Mechanism Contribution to Harm to Biodiversity Ends (Average of 25 Experts, Phases I & II), Axes Pivoted
Concern-weighted Impact Mechanism overall Impact On Biodiversity EndsAverage of 25 Experts (Phases 1 & II)
0 5 10 15 20 25 30
Alien Species
Direct Mortality
Disturbance
Ecosystem Alteration
Ecosystem Loss
EnvironmentalContamination
Impa
ct Me
chan
ism
Concern-weighted Impact
Terr. genetic diversityTerr. species and populationsTerr. ecosystemsFW genetic diversityFW species and populationsFW ecosystems
Figure 12 is significant because it represents a simple form of ‘ranking’ or prioritizing these six Impact Mechanisms from an action item development perspective, since it combines consideration of both the relative prevalence of the impact mechanism and the concern associated with each biodiversity end harmed.

Biodiversity Safety Net Gap Analysis. Compass Resource Management Ltd. May 24, 2007 16
Figure 13 provides another view of the data behind Figure 12. Each cell in the table is shown by an icon that represents the degree of concern expressed for that mitigative gap relative to the highest concern expressed for a single gap. For example, the concern expressed for the current degree of impacts from ‘Ecosystem Alteration’ on “Freshwater Ecosystems” is between 80% to 100% of the maximum concern expressed for any single concern. Figure 13: Relative Concern for Mitigative Gaps: Impact Mechanisms & Biodiversity Ends
Terr. genetic diversity
Terr. species and
populationsTerr.
ecosystemsFW genetic
diversity
FW species and
populationsFW
ecosystems
Alien Species
Direct Mortality
Disturbance
Ecosystem Alteration
Ecosystem LossEnvironmental Contamination
<=20% of highest concern value>=20% of highest concern value>=40% of highest concern value>=60% of highest concern value>=80% of highest concern value
From a “gap analysis” perspective, we may say that measures to address ecosystem alteration and loss, (in both terrestrial and freshwater realms) appear to constitute the largest ‘gap’ of the six impact mechanisms listed. Alien species and environmental contamination are the next most concerning. This is not to say that resources should necessarily focus on reducing impacts to address Ecosystem Alteration and Loss to the exclusion of others. It may be that there are few measures that apply effectively to these areas, and that more opportunities to protect biodiversity may exist elsewhere. However, it does suggest that the experts surveyed collectively find that mechanisms impacting biodiversity from Ecosystem Alteration and Loss are resulting in more concern (i.e. that there are more ‘mitigative gaps’) than with other impact mechanisms. However, impact mechanisms are simply the agents of harm created by stressors. A possibly more interesting avenue of exploration for decision makers may be therefore the inter-relationship between impact mechanisms and the stressors that create them.
4.4 Part 3: Linking Impact Mechanisms to Stressors Part 3 of the survey (See part 3.2, and in particular Figure 5) asked participants to rate the extent to which each of 12 Stressors give rise to the six Impact Mechanisms. As noted in 3.3, as part of the Phase II survey design participants were presented with an interactive spreadsheet tool that allowed each individual to compare their own Phase I responses to those of their peers. Since some of the aggregated Phase I responses were not always intuitive to the BBC Steering Committee, the committee posed questions to Phase II participants that were intended to help clarify and/or amend the

Biodiversity Safety Net Gap Analysis. Compass Resource Management Ltd. May 24, 2007 17
aggregated expert judgments. Later, the quantitative responses for Phases I and II were aggregated for presentational purposes.
4.4.1 An Example of the Two Phase Approach: Agriculture As an example of the way detailed results were obtained from this process, Figure 14 shows the Phase I only findings for the relative impact mechanisms of the first stressor, Agriculture. From Figure 14 we can see that Agriculture causes harm to biodiversity via all six of the impact mechanisms listed. Mitigation gaps exist primarily in the ways in which Agriculture gives rise to or promotes the action of Alien Species, Ecosystem Loss and Environmental Contamination. Figure 14: Example of a Phase I Result: Agriculture
Relative Impact Mechanisms of Agriculture, Phase I
0%
5%
10%
15%
20%
25%
30%
Alien
Spe
cies
Dire
ct Mo
rtality
Distu
rban
ce
Ecos
ystem
Alter
ation
Ecos
ystem
Loss
Envir
onme
ntal
Conta
mina
tion
Impact Mechanism
Relat
ive S
igni
fican
ce o
f Im
pact
Mec
hani
sm
Max90th %ile75th %ile50th %ileMean25th %ile10th %ileMin
The steering committee was surprised by this result, and wanted to seek clarification in Phase II. Along with the phase I result, the Steering Committee posed the comment, “We expected ecosystem loss to be highest, however, instead alien species and environmental contamination are highest. Note also that the differentiation between the impacts is less than expected.” The Phase II qualitative responses to the Steering Committee’s question were as follows. The combined quantitative findings for both Phases are shown in Figure 15. Interestingly, while some people agree with the steering committee, others do not, and the final combined quantitative Figure 15 is quite similar to the Phase I result in Figure 14. The debate provides very useful information on the spectrum of ideas held by different experts.

Biodiversity Safety Net Gap Analysis. Compass Resource Management Ltd. May 24, 2007 18
• The results make sense. Weeds and agronomic species (especially grasses) drive much ecosystem loss in S. Vi, S. Gulf Islands, Lower Mainland and Okanagan. I know less about Environmental Contamination, but for fresh and marine systems this is known to be an over-riding impact. Lack of differentiation simply means there is uncertainty about the most important factor, and that many factors are having deleterious impacts.
• Intensive agriculture has higher impacts on ecosystem alteration, and environmental contamination. Agriculture tends to alter rather than contribute to habitat loss. However, didn't expect alien species to be so high for intensive agriculture
• My response was largely in agreement with the Steering Committee • Agricultural change mostly happened early in the previous century - less
expansion is happening presently so the other threats seem more relevant presently - long term ecosystem loss has been very significant in biodiversity hotspots in the province.
• Looks to me that this is a case where there is no consensus among the experts • Alien species could be part of ecosystem loss • Agricultural land is still used by wildlife as habitat, especially around urban areas
where it can play a significant role in maintaining biodiversity - protecting land from becoming housing and roads
• I favoured alien species over other factors - maybe because it’s the hardest genie to put back in the bottle.
• For aquatics I would rate ecosystem alteration as the highest mechanism followed by contamination. Alien species is more of a terrestrial issue associated with agriculture.
• Increases in alien species and environmental contamination are certainly factors in ecosystem degradation.
• I agree with your expectations as you can see by previous response. It is ecosystem loss.
Biodiversity Safety Net Gap Analysis. Compass Resource Management Ltd. May 24, 2007 19
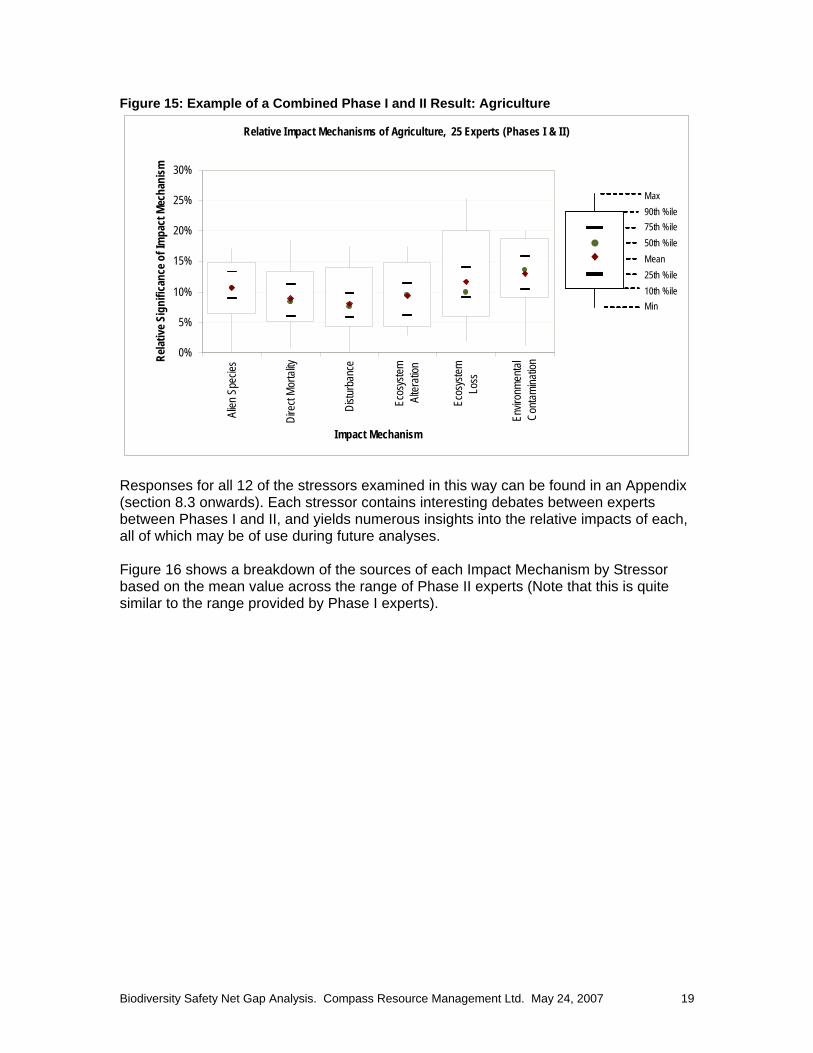
Figure 15: Example of a Combined Phase I and II Result: Agriculture
Relative Impact Mechanisms of Agriculture, 25 Experts (Phases I & I I )
0%
5%
10%
15%
20%
25%
30%
Alien
Spe
cies
Dire
ct Mo
rtality
Distu
rban
ce
Ecos
ystem
Alter
ation
Ecos
ystem
Loss
Envir
onme
ntal
Conta
mina
tion
Impact Mechanism
Relat
ive S
igni
fican
ce o
f Im
pact
Mec
hani
sm
Max90th %ile75th %ile50th %ileMean25th %ile10th %ileMin
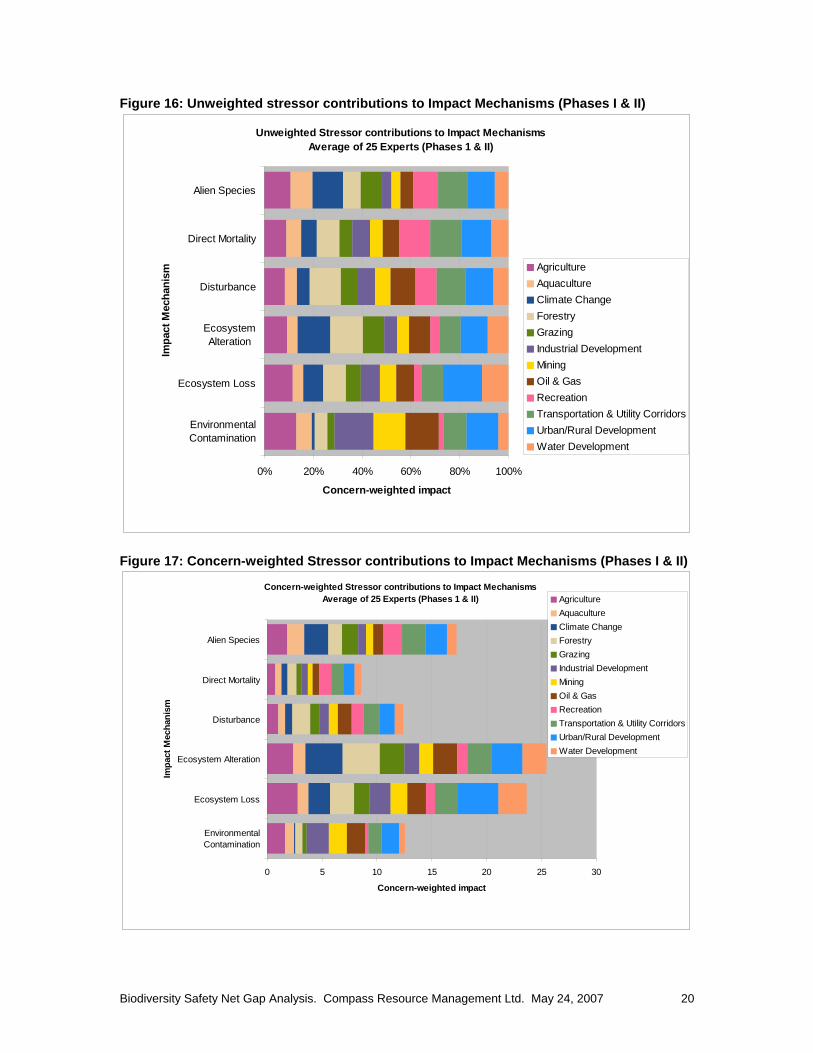
Responses for all 12 of the stressors examined in this way can be found in an Appendix (section 8.3 onwards). Each stressor contains interesting debates between experts between Phases I and II, and yields numerous insights into the relative impacts of each, all of which may be of use during future analyses. Figure 16 shows a breakdown of the sources of each Impact Mechanism by Stressor based on the mean value across the range of Phase II experts (Note that this is quite similar to the range provided by Phase I experts).
Biodiversity Safety Net Gap Analysis. Compass Resource Management Ltd. May 24, 2007 20
Figure 16: Unweighted stressor contributions to Impact Mechanisms (Phases I & II)
Unweighted Stressor contributions to Impact MechanismsAverage of 25 Experts (Phases 1 & II)
0% 20% 40% 60% 80% 100%
Alien Species
Direct Mortality
Disturbance
EcosystemAlteration
Ecosystem Loss
EnvironmentalContamination
Impa
ct M
echa
nism
Concern-weighted impact
AgricultureAquacultureClimate ChangeForestryGrazingIndustrial DevelopmentMiningOil & GasRecreationTransportation & Utility CorridorsUrban/Rural DevelopmentWater Development
Figure 17: Concern-weighted Stressor contributions to Impact Mechanisms (Phases I & II)
Concern-weighted Stressor contributions to Impact MechanismsAverage of 25 Experts (Phases 1 & II)
0 5 10 15 20 25 30
Alien Species
Direct Mortality
Disturbance
Ecosystem Alteration
Ecosystem Loss
EnvironmentalContamination
Impa
ct M
echa
nism
Concern-weighted impact
AgricultureAquacultureClimate ChangeForestryGrazingIndustrial DevelopmentMiningOil & GasRecreationTransportation & Utility CorridorsUrban/Rural DevelopmentWater Development

Biodiversity Safety Net Gap Analysis. Compass Resource Management Ltd. May 24, 2007 21
Spreading these data across the ‘concern-weighted’ values for Impact Mechanisms (as we did for Impact Mechanisms in Figure 12), gives Figure 17. Finally, switching the axes on Figure 17 gives Figure 18. Figure 18: Concern-weighted Stressor contributions to Impact Mechanisms (Phase II), Data Pivoted
Concern-weighted Stressor contributions to Impact MechanismsAverage of 25 Experts (Phases 1 & II)
0 2 4 6 8 10 12 14
Agriculture
Aquaculture
Climate Change
Forestry
Grazing
Industrial Development
Mining
Oil & Gas
Recreation
Transportation & Utility Corridors
Urban/Rural Development
Water Development
Stre
ssor
Concern-weighted ImpactAlien SpeciesDirect MortalityDisturbanceEcosystem AlterationEcosystem LossEnvironmental Contamination
Figure 18 is for Stressors what Figure 12 is for Impact Mechanisms – that is, an initial relative ranking or prioritization of stressors for which there appear to be ‘gaps’ in current mitigative policies leading to concerns for biodiversity values. Again, this is not to say that no effort should be put into developing improved policies for the lower ranking stressors such as aquaculture and recreation. Rather, it may suggest that, all else being equal, the higher ranking stressors of urban / rural development, agriculture etc are creating more concern among experts for biodiversity values than others. In parallel to Figure 13, Figure 19 shows the relative concern for the mitigative gaps existing between the stressors and impact mechanisms. We can see that the three most concerning mitigative gaps are the impact on Ecosystem Alteration resulting from Climate Change and Forestry, plus the impact on Ecosystem Loss resulting from Urban/Rural Development.

Biodiversity Safety Net Gap Analysis. Compass Resource Management Ltd. May 24, 2007 22
Figure 19: Relative Concern for Mitigative Gaps: Stressors & Impact Mechanisms Alien Species
Direct Mortality Disturbance
Ecosystem Alteration
Ecosystem Loss
Environmental Contamination
AgricultureAquacultureClimate ChangeForestryGrazingIndustrial DevelopmentMiningOil & GasRecreationTransportation & Utility CorridorsUrban/Rural DevelopmentWater Development
<=20% of highest concern value>=20% of highest concern value>=40% of highest concern value>=60% of highest concern value>=80% of highest concern value
It should also be emphasized that these data represent a snapshot in time – they are a representation of the current degree of concern for biodiversity ends and how those ends are currently being harmed via impact mechanisms by stressors. Some of the current harm is the result of largely historical factors (e.g. dams), whereas other aspects of current harm are becoming more significant as time passes (e.g. climate change). To probe some of these issues, and to supplement these quantitative findings, we also asked a number of open-ended, qualitative questions that gave experts the opportunity to comment on perceived policy gaps and probed for suggestions on ways to fill those gaps.
Biodiversity Safety Net Gap Analysis. Compass Resource Management Ltd. May 24, 2007 23
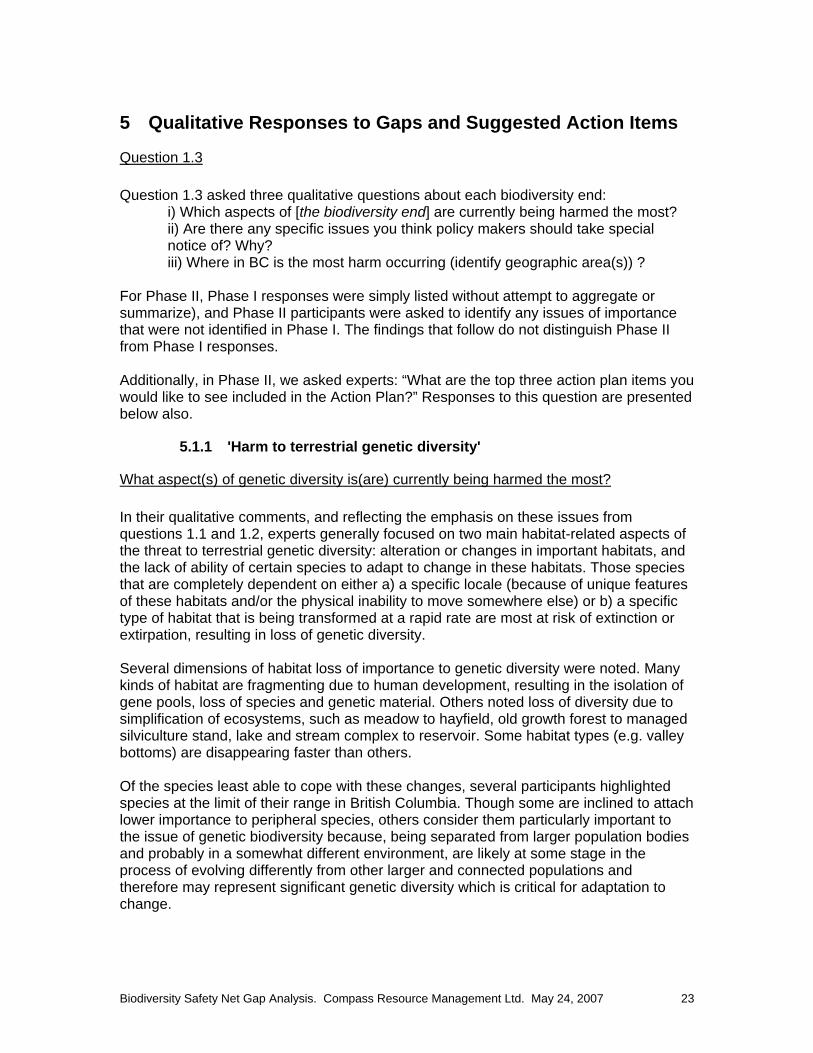
5 Qualitative Responses to Gaps and Suggested Action Items
Question 1.3 Question 1.3 asked three qualitative questions about each biodiversity end:
i) Which aspects of [the biodiversity end] are currently being harmed the most? ii) Are there any specific issues you think policy makers should take special notice of? Why? iii) Where in BC is the most harm occurring (identify geographic area(s)) ?
For Phase II, Phase I responses were simply listed without attempt to aggregate or summarize), and Phase II participants were asked to identify any issues of importance that were not identified in Phase I. The findings that follow do not distinguish Phase II from Phase I responses. Additionally, in Phase II, we asked experts: “What are the top three action plan items you would like to see included in the Action Plan?” Responses to this question are presented below also.
5.1.1 'Harm to terrestrial genetic diversity'
What aspect(s) of genetic diversity is(are) currently being harmed the most? In their qualitative comments, and reflecting the emphasis on these issues from questions 1.1 and 1.2, experts generally focused on two main habitat-related aspects of the threat to terrestrial genetic diversity: alteration or changes in important habitats, and the lack of ability of certain species to adapt to change in these habitats. Those species that are completely dependent on either a) a specific locale (because of unique features of these habitats and/or the physical inability to move somewhere else) or b) a specific type of habitat that is being transformed at a rapid rate are most at risk of extinction or extirpation, resulting in loss of genetic diversity. Several dimensions of habitat loss of importance to genetic diversity were noted. Many kinds of habitat are fragmenting due to human development, resulting in the isolation of gene pools, loss of species and genetic material. Others noted loss of diversity due to simplification of ecosystems, such as meadow to hayfield, old growth forest to managed silviculture stand, lake and stream complex to reservoir. Some habitat types (e.g. valley bottoms) are disappearing faster than others. Of the species least able to cope with these changes, several participants highlighted species at the limit of their range in British Columbia. Though some are inclined to attach lower importance to peripheral species, others consider them particularly important to the issue of genetic biodiversity because, being separated from larger population bodies and probably in a somewhat different environment, are likely at some stage in the process of evolving differently from other larger and connected populations and therefore may represent significant genetic diversity which is critical for adaptation to change.
Biodiversity Safety Net Gap Analysis. Compass Resource Management Ltd. May 24, 2007 24
-I may have altered the original intent above so check carefully (the wording was unclear though to begin with) Specific issues for policy makers to consider There were several key lines of comment on this issue. Preventing further genetic loss through the provision of connectivity: Firstly, participants in both phases identified the urgency of developing policies that, in the words of one, “do anything to provide or protect connectivity.” Many believe that there is an important need to address land use planning at various scales to ensure the protection of “additional large tracts of land and corridors between protected areas to preserve critical habitat for multiple species.” Preventing further genetic loss and enhancing future adaptability through the protection of peripheral populations The genetic makeup of the peripheral populations could be critical to the survival of many species as peripheral populations may be those most adaptable. Avoiding the creation of unwanted genetic selection pressure through management practices Game managers, for example, should consider the risks of selective pressure of hunting on certain alleles (e.g, losing traits for large dominant males). Current forest harvesting/replanting practices may result in genetic drift and inbreeding with resultant poor health. Importance of the inclusion of climate change adaptation policy factors in future planning Some commented that government should be working on climate change adaptation strategies to identify and conserve resilient ecosystems and refugia important to conserve species in a variety of habitats. Provide funding for basic research “Very little research is done on the genetics of most species” complained one participant; policy makers should do more to help understand the role of genetic diversity in ecosystem function, and ensure that genetic diversity is considered at the same time as species diversity.
Where in BC is the most harm occurring? Harm is occurring everywhere in BC, many believe, but particularly in ‘hot spot areas’ where high densities of endemic species conflict with land use pressure. For most people, this primarily means the southern third of the province, though other areas and considerations include:
• Areas of high urban development, such as the Fraser Valley and the Okanagan Valley.
• Areas of significant energy project development such as the Peace and northeast corner of the province;
• Specific locations around major resource extraction projects;
Biodiversity Safety Net Gap Analysis. Compass Resource Management Ltd. May 24, 2007 25
• Interior valleys - east coast of Vancouver Island, Lower Fraser valley, the Okanagan, Lower Mainland, and south-east Vancouver Island – generally areas of flat, low elevation land;
• Populated areas like eastern Vancouver Island, Lower Mainland, and Okanagan; • Areas heavily impacted by Mountain Pine Beetle • Areas where climate change likely has the greatest impact – the north, and
locations at elevation.
5.1.2 Concerning 'Harm to terrestrial species and populations':
Which species and populations are currently being harmed the most? Some general observations on this issue again focused on the lack of information on what terrestrial species and population-level biodiversity actually means – one person noted that there is a bias towards large mammals and certain birds that was misplaced. General characteristics of species and populations of greatest concern include those that:
• Primarily dwell in the ‘hot spot areas’ listed in 5.1.1 • Species and populations dependent on fast disappearing habitat types - e.g.,
Garry Oak ecosystems, antelope-brush, riparian areas, old-growth forests • Species and populations with large home ranges and distributions (the large
scale making them harder to protect and more prone to fragmentation) Some specifics species and populations mentioned include:
• Mountain caribou are a species of considerable concern especially those populations in SE BC (Purcell and Selkirk Pops).
• Drought tolerant species • Spotted owl, • Amphibians • Invertebrates, • Lichens – important in their own right, and have a link to Mountain Caribou. • Coastal bird breeding colonies
Specific issues for policy makers to consider Discussions on this area have been grouped into four areas: General planning issues Many comments touched on perceived problems with planning regimes: some feel that the basic unit of management needs revision, with a greater focus on managing distinct species and populations throughout their range (presumably in contrast to the current localized management approach to most species and populations in the province). A suggestion was to preserve a series of critical habitat corridors that would benefit multiple species and populations via landscape level management plans for certain species and species assemblages, with an eye to addressing the problems associated with fragmentation over large geographic areas. Note that most people commenting on general planning needs raised ecosystem based management as their preferred approach, which is discussed further below.
Biodiversity Safety Net Gap Analysis. Compass Resource Management Ltd. May 24, 2007 26
Species at Risk Regulation A number of respondents expressed frustration with the current status of species at risk regulations in BC: “the government should do a better job of conforming to federal SARA requirements; there has been poor progress on species recovery planning.” One person felt that too few species at risk are listed, and when they are listed under provincial legislation there will be no critical habitat protected for the species. It was suggested that the province introduce “made-in-BC” species at risk legislation. Other comments included that there is poor control of the introduction and management of alien species and there is slow development of some tools in the FRPA –spell out "tool box" (e.g. regionally important wildlife, sensitive watersheds designation). Suggestions on policy focus A number of people raised questions on areas of policy focus. One expert was troubled by what he/she considered an excessive emphasis on areas of high development - less impacted areas may offer better prospects for preserving biodiversity, and we should put a significant conservation effort into remaining wilderness, especially to ensure space for species requiring large ranges. Another suggestion was to shift the focus of attention away from species and populations primarily impacted by habitat impacts, since recovery of these species and populations is “exceedingly difficult” – better, then, to focus on prevention and recovery of species threatened by other impacts. While climate change impacts are currently in their initial stages, a number of people emphasized the need to integrate climate change adaptation considerations into future planning. On a related note, one person felt that there should be greater policy emphasis on long-term, well-designed monitoring initiatives to inform decision making. Education and communication Also raised by several people was the need to ‘make the case’ to elected officials and the general public about why widespread species loss is a problem. Two people suggested that this should be communicated in monetary terms. As one put it, it should be clear that the “costs of species loss will ultimately outweigh any economic and social benefits that might have resulted from the activities that caused the losses.”
Where in BC is the most harm occurring (identify geographic area(s)) ? Suggested areas in BC where most harm is occurring to species and populations largely mirrors those hotspot areas mentioned in 5.1.1. Considerations more specific to terrestrial species and population biodiversity include any highly sedentary species subject to severe habitat loss and fragmentation, especially invertebrates, and small mammals. Those areas in BC with greatest populations of species at risk are, by definition, areas where greatest harm is occurring.

Biodiversity Safety Net Gap Analysis. Compass Resource Management Ltd. May 24, 2007 27
5.1.3 Concerning 'Harm to terrestrial ecosystems':
What aspects of ecosystems are currently being harmed the most? Loss of general integrity Most experts made reference in some way to harm ongoing to the general integrity of ecosystems, the loss of connectivity and increased fragmentation. For some it is the integrity of ecosystem functions (clean water, stable soil, etc.) that are of most concern. There are fewer intact ecosystems, and they are becoming more fragmented, altering ecosystem processes, such as pollination, nutrient cycling, community interactions. As ecological function and processes are compromised, ecosystems have reduced viability and resiliency. Loss of complexity Closely related to the general loss of the ecosystem integrity is the loss of complexity. Complex ecosystem structures are being replaced by less complex ones: forests replaced by tree farms, diverse meadows / forests replaced by monocultures of agricultural crops. Specific ecosystem aspects Specific areas cited by experts include:
o Grasslands, coastal bluff meadows; wetlands; intact functioning riparian areas, estuaries
o Loss of natural range of variability in forest ecosystems o Intensification of agriculture (e.g. berries, nurseries, vineyards) o Riparian corridors, wetlands o Shrub-steppe ecosystems and grasslands
Specific issues for policy makers to consider General Planning As with species and populations above, most participants had something to say about aspects of planning approaches, and in particular, strong support for more ecosystems-focused planning. A commonly voiced sentiment was captured by the phrase, “We need to move conservation and management from species and populations to consideration of communities and ecosystems.” One participant said, “Without a major emphasis on conservation and maintenance of terrestrial ecosystems and ecosystems at risk, many species and populations of species will be lost through time. There is a stronger need for control of the land base, including legislation.” There appears to be little effort into conserving meaningful habitat / ecosystem units in areas of high development, thought one expert. A number of people advocated an increased reliance on landscape-level management plans. There was a theme in the comments that there is a lack of coherent landscape level plans to protect and manage habitats and ecosystems as well as poor progress on species recovery planning. One person felt that ecosystem-based planning could offer efficiencies in planning: “ecosystem recovery planning can take longer, but [it] helps to coordinate actions -
Biodiversity Safety Net Gap Analysis. Compass Resource Management Ltd. May 24, 2007 28
habitat-based action planning as opposed to separate plans for each species.” More effort should be put into finding efficiencies in recovery planning and implementation. It was suggested that a better planning framework would identify the “best and highest use of resources (i.e. ecosystems) [which should be] addressed for the long term, not short term gain, because of loss of ecological services and benefits resulting from ecosystem loss and alteration.” Plans and management frameworks should be flexible to climate change, which has the potential to radically change the distribution of ecosystems. By developing larger areas of protection that are connected, ecosystems may have a better opportunity to respond to changing climate. In general more attention should be put to incorporating adaptive management to account for uncertainty and variability in management. Regulation / legislation Specific regulatory suggestions included the need for legislation on ecosystems conservation and, more specifically, legislation to protect and conserve ecosystems at risk on private lands. One expert said, “policy makers need to find ways to promote diversity and innovation on the landscape and land base to hedge against climate change and other factors we have a poor ability to forecast around.” Another person noted that, despite pervasive uncertainty, it is “important is to resolve the issue of how better researchers, managers, politics can better integrate” in decision making processes. Education and communication As with species and populations, a common theme was the frustration that politicians and the public do not understand the importance of ecosystems. “Of particular interest is the importance of ecosystem processes to maintaining our quality of life,” said one. “Most people don't understand this until we lose it.” “Policy makers should be made aware that the costs of SARA are tiny compared to what they should expect in the absence of dramatic action to maintain a high fraction of 'naturally functioning' ecosystems.” Research themes A number of people mentioned the development and use of thresholds in planning and decision making. “It is … critical that we develop methods to monitor for ecological change and begin to understand the ’thresholds’ that will permanently alter ecosystem structure and function.” Researchers should also pay close attention to baselines that shift as degradation unfolds.
Where in BC is the most harm occurring (identify geographic area(s)) ? Suggested areas in BC where most harm is occurring to ecosystems largely mirrors those hotspot areas mentioned in 5.1.1. Specific ecosystems listed included:
o Old growth forests on the coast and in the wetter areas of the Interior Western Hemlock zone
o Dry grassland ecosystems of the South Okanagan, dry coastal ecosystems in the Coastal Douglas Fir and drier Coastal Western Hemlock – subzone variants

Biodiversity Safety Net Gap Analysis. Compass Resource Management Ltd. May 24, 2007 29
o Grasslands, coastal bluff meadows; wetlands; intact functioning riparian areas, estuaries
o Boreal and alpine ecosystems
5.1.4 Concerning 'Harm to freshwater genetic diversity ':
What aspect(s) of genetic diversity is(are) currently being harmed the most? Several experts began by acknowledging the deep sense of uncertainty (referred to by one person as “almost complete lack of knowledge”) associated with freshwater biodiversity. “Does any one know what species other than fish and bigger vertebrates actually live in our freshwater system,” asks one. “How many freshwater physiologists do we have, how many species of invertebrates [are there] and where are they? We know almost nothing about the non-charistmatic creatures wherein resides most of the biodiversity.” It was noted that most information was confined to commercial species. A recurring theme concerned within-species biodiversity, as captured eloquently by this comment: “Using fish as our best understood group of aquatic organisms we see that most of the biodiversity is within-species not the number of species. We are only starting to understand how this diversity is distributed and know even less of the significance. Therefore, the loss of discrete populations of a relatively common and widespread species, can represent the loss of an 'ESU' [evolutionarily significant unit]. This is likely the case for species such as coastal cutthtroat trout and Dolly Varden which rely on small stream habitats that may be lost at a higher frequency than other habitats. Headwater / above barrier populations are another component that are often genotypically distinct and very vulnerable.” From a global perspective, said one expert, “BC was almost entirely glaciated, therefore we actually do have a relatively simple and fragile fauna. From a global point of view, our most valuable assets are the recent genetic divergence and relatively simple ecosystems.” Specific issues cited include:
o The isolation of genetic stocks from human imposed barriers; o Loss of some salmon populations due to overfishing. The loss of genetic diversity
is most severe in Pacific salmon where fishing and loss of summer freshwater habitat has caused narrowing of run times, decreased body size and extirpation of many races.
o Species which are at the "centre" of water shortages (i.e. Interior and Georgia Strait coho and bull trout populations) that will continue to be a major concern for retaining their genetic diversity in light of population declines
o Wetland dependent invertebrates, e.g., freshwater molluscs; o For non-migratory salmonids the impact of stocking, enhancement and the
alteration of barriers has caused loss of diversity. o Riverine species requiring cooler waters in summer o Species not of economic concern

Biodiversity Safety Net Gap Analysis. Compass Resource Management Ltd. May 24, 2007 30
Are there any specific issues you think policy makers should take special notice of? Why? One person noted that the basic unit of terrestrial conservation is quite different to that for freshwater systems, and that when protected areas are created for terrestrial systems they often do little or nothing to protect freshwater biodiversity values. Moreover, this is one element of widespread historical bias against freshwater biodiversity that is also evident, for example, in the designation of species at risk (since freshwater species often have more “unlabelled” genetic variants than their terrestrial equivalents, the genetic importance of which is generally unrecognized). As with terrestrial systems, there was criticism of a current policy focus on specific populations: “the focus on species conservation is overlooking losses at the genetic level”, and similar calls for a greater focus on peripheral populations that may help the adaptability of species to changes: “the genetic diversity of fish species is the legacy to protect and will provide resilience to climate change and other stressors.” Particular emphasis was placed on fish transfers, both legal (stocking) and illegal. There was strong support for greater policy control on alien species introductions. “We must be careful not to introduce fish for the sake of fishing; we need significant fines, policing and public education on impact of moving fish and other aquatic organisms.” Other regulatory suggestions included:
o Policy on road building and access development requires review o Upland land use is a major factor and should be incorporated into freshwater
biodiversity planning frameworks o When setting harvest regulations, government should take into consideration the
status of each of the wild stocks as well as the overall population o Overfishing
Unsurprisingly given the stated lack of knowledge about the nature of freshwater genetic biodiversity, research needs were high on the wish-list of action items: there needs to be improved inventory of fish stocks, and more research into non-commercial fish, as well as invertebrates.
Where in BC is the most harm occurring (identify geographic area(s)) ? General areas identified include:
o Populated areas such as eastern Vancouver Island, Lower Mainland, and Okanagan. One person suggested that human density is the best predictor of problems for freshwater and marine systems.
o Lake-dominated landscapes, valley bottoms, low elevation waters as well as stocked lakes
o Smaller creeks where much of the unique genetic diversity is found. Loss of diversity is most severe in small river systems that support migratory salmon and in small lakes for resident salmonids, states one expert. Small stream and lake habitats are the most vulnerable wherever they occur and they often support distinct components of the aquatic ecosystem. Fish populations will be more sensitive to overfishing in these waters also.
o Elimination of weak stocks in mixed stock commercial fisheries affect large areas of BC (e.g. Fraser Basin, Skeena Basin)

Biodiversity Safety Net Gap Analysis. Compass Resource Management Ltd. May 24, 2007 31
Specific locations noted included: o Dolly Varden lakes in northern British Columbia; o Peace, Columbia, Okanagan, middle and lower Fraser drainages; o Lower Fraser, Mountain Pine Beetle impact area, Vancouver Island / Georgia
Strait;
5.1.5 Concerning 'Harm to freshwater species and populations':
Which species and populations are currently being harmed the most? General features of species and populations currently being harmed the most include:
o Those in fishless lakes; o All species that are dependent on riparian areas o All species that are sensitive to nitrogen loading o Migratory species o Species or populations at the edge of their ranges (peripheral species) o Isolated pockets of creatures with poor dispersal ability and sensitivity to
disturbance or harvest. o Cold adapted or preferring species (species dependent on small cold streams
are being heavily impacted). o Closed freshwater populations are in general smaller and more vulnerable than
marine o Fish populations subject to urban pollutants
Specific species and populations mentioned included:
o Native fish and bivalves o Stream dependent salmonids o Sensitive mesocarnivores (e.g., river otter) that consume contaminated food
items from lower in the food chain. o Distinct populations of fin fish (e.g. sockeye); o Interior and Georgia Strait coho, interior bull trout, Cultus Lake and Sakinaw Lake
sockeye o Species in the Columbia system that are at the northern edge of their geographic
ranges. o Cutthroat, bull trout, Dolly Varden and sturgeon o Anadromous fish species in the south half of the province are currently facing the
double threat of reduced ocean and freshwater habitat productivity (largely due to habitat loss in freshwater).
o Rare endemics in southern BC o Westslope cutthroat in particular are being harmed through both habitat loss and
hybridization with introduced rainbow trout
Are there any specific issues you think policy makers should take special notice of? Why? Comments on this issue are grouped into three themes: the focus of policy, specific policy and regulatory recommendations, and research needs Policy focus
Biodiversity Safety Net Gap Analysis. Compass Resource Management Ltd. May 24, 2007 32
Again, mirroring the terrestrial realm there were calls from several experts to shift policy focus towards a more ecosystem-focused approach; a typical quote being, “I would put ecosystem classification and protection ahead a taxonomy-based species protection strategy.” Habitat protection, noted one, is less expensive and has greater impact than mitigation and restoration. That said, there were also calls for more mitigation and restoration. Regulation (Specific) The lack of controls on exotic species is of primary concern to some experts, as captured in the quotes, “Invasive species like yellow perch are dramatically altering freshwater fish populations due to their ability to expand into available habitat and consume indigenous fish populations.” On this issue, one expert noted that the worst is yet to come: “it is the potential for future impacts of exotics that is the issue.” Other areas of specific regulatory concern include, again, climate change adaptation and in its integration into planning and decision making frameworks; pollution from non-closed production systems, over exploitation, barrier alterations and regulations around stocking and enhancement. Research One expert characterized our current state of knowledge of the life histories and habitat requirements of most of British Columbia’s native species as “dismal.” He/she was joined by several others in calling for basic research to begin recording what is actually out there. However, one expert noted that the complexity of freshwater species and populations is so profound that, “we will never know what freshwater diversity is, and this issue (as in almost all other ecosystems) cannot be dealt with by using brute force descriptive taxonomy. We don't have the time or the resources. This doesn't mean that we can't use ecosystem classification and focal species to conserve a lot of stuff that we don't even know is there. This is the mainstream approach that is common in virtually all ecosystems and jurisdictions.”
Where in BC is the most harm occurring (identify geographic area(s)) ? The areas cited as being most harmed for freshwater species and population biodiversity largely mirror those listed above in 5.1.4 for freshwater genetic biodiversity.
5.1.6 Concerning 'Harm to freshwater ecosystems':
What aspects of ecosystems are currently being harmed the most? Again, mirroring terrestrial ecosystems, several experts noted that it was the “general health and vigour” of ecosystems that is most concerning, which in turn affects their ability to respond and adapt to further change, creating a negative spiral. Characteristics of the most freshwater ecosystems that are of most concern include
o Those with excessive aquifer overuse; o Those with invasive aquatic species (“the toughest challenge after climate
change”), o Where water bodies, streams, etc are being drained or diverted
Biodiversity Safety Net Gap Analysis. Compass Resource Management Ltd. May 24, 2007 33
o The infilling of temporary wetlands o Watersheds with high pine components, first from the infestation, but more so
from salvage harvesting o In the central and southern interior, excessive water allocation is significantly
altering the hydrology of stream and lake habitats rendering them simpler and less able to support aquatic life.
o Water flows (damming), over allocation of water, changes in structure, and ecosystem composition.
Are there any specific issues you think policy makers should take special notice of? Why? Planning Several people argued that the role of protected areas in freshwater ecosystem conservation needs attention. The basic unit of conservation for freshwater species is different to that for terrestrial species, they suggest, and protected areas for terrestrial areas often provide little or no protection for aquatic biodiversity values. This issue is captured articulately in the following quote: “Most of our fish fauna lives in lowland areas. Scenic mountainous terrains have very low aquatic diversity. The vast majority of our parks (provincial and federal) are in areas of low fish diversity. Some attempt should be made to preserve our richest aquatic ecosystems. From an aesthetic standpoint these are often unattractive slough-like environments but they are where the fish are.” Regulation (specific) There appears to be a widespread sentiment that freshwater ecosystems, and in particular fishless aquatic systems, are inadequately protected and need more attention.
o Of particular concern are issues around aquaculture, alien species and lake-stocking. Education around non-native species as a key shortcoming in current regulations.
o Several people made reference to the importance of managing access and roads as a key to effective protection of freshwater ecosystems
o With respect to mountain pine beetle, there should be better retention planning to moderate impacts to hydrologic function
o Climate change adaptation planning is an important missing link say some. “Once the glaciers are gone, stuff is going to change”
o Unique ecosystems harbour unique stocks and species. Fish and aquatic ecosystem values must be given due consideration under the Water Act when making water licensing decisions.
o Small streams are crucial to protecting the integrity and functioning of watersheds.
o We have the technology to restore watershed functioning, we aren't being provided with the resources.
o Externalizing funds and hoping the stewardship community will affect restoration is a nice thought but it will only work if government provides the leadership and the extension expertise (consider the success of the Urban Salmon Habitat Program)
o Coastal environments and estuaries need protection.

Biodiversity Safety Net Gap Analysis. Compass Resource Management Ltd. May 24, 2007 34
Where in BC is the most harm occurring (identify geographic area(s)) ? Responses are similar to those mentioned in 5.1.4
5.2 Action Plan Actions of Interest The top action plan items requested by participants were as follows. Comments with similar themes have been grouped together: Approaches to Planning
o Landscape level planning to maintain connectivity and balance the needs of species [with the needs of development]
o An integrated ecosystem approach to conservation that includes the land, freshwater systems, and marine systems where appropriate
o Incorporation of adaptive management (preferable active adaptive management) that explicitly recognizes the uncertainty of our knowledge and the evaluation of potential policies through alternate models
o Need for a real ecosystem approach including development and strengthening of ecosystem legislation for conservation of all ecosystems and protection of ecosystems at risk
o An ecosystem classification approach to conservation for aquatic ecosystems. o Create a leadership role for government in watershed planning and restoration o A system wide conservation plan is essential, preservation of key zones of
biodiversity, especially those likely to increase with climate change o Conservation of critical areas o Protected areas with high value and likeliness to persist. o Increase representation of priority ecosystems
Regulation
o Establish ecosystem condition targets as well as the mechanisms to ensure that they guide relevant decision-making
o Develop a strategy around access development o No net loss of habitat o Need for critical habitat protection for species at risk o Ensure policy and legislation provides water for functioning aquatic ecosystems
Specific stressors / impact mechanisms
o Strategic approach to climate change adaptation; a comprehensive science based strategy to prepare for management of biodiversity during climate change; adapt to climate change by ensuring connectivity for species to shift their distributions;
o Develop a government led program to address invasive alien species and introduced species (prevention, management and control)
o Protection and restoration of important ecosystems in the Fraser Valley (e.g. Sumas Mountain), and other areas with high development/populated pressures
o Harvest management of mixed stock and open-access fisheries o A strategy around forest retention in mountain pine beetle impacted areas o Management strategy for roads and other access o Public-Private Partnerships to restore naturally functioning ecosystems in heavily
impacted regions
Biodiversity Safety Net Gap Analysis. Compass Resource Management Ltd. May 24, 2007 35
Specific biodiversity ends o More emphasis on species groups such as invertebrates and lichens, etc. o Enhanced habitat protection of streams and wetlands o Ecological restoration of habitat
Initiatives
o Tax incentives for conservation on private land in heavily populated areas Research
o More inventory of lesser known taxa. o More basic research o Increased focus of research and understanding on ecological processes rather
than enumerating biodiversity elements Communication / Education
o Develop a conservation ethic in all British Columbians through educational efforts and direct experience (with a particular emphasis on children)
6 Conclusions In this study, we have attempted to identify biodiversity mitigative policy gaps through an approach that combines a systematic, quantitative expert judgment approach to linking broad categories of stressors, impact mechanisms and biodiversity ends, with a qualitative, open-ended survey of experts. In our examination of biodiversity ends, we found that in both the terrestrial and freshwater realms, experts are more concerned about degradation to ecosystems than species / populations or genetic diversity. This concern is reflected in qualitative comments around policy gaps, where there is a strong interest among many for a more ecosystem-based approach to planning and conservation. We examined six, collectively exhaustive categories of impact mechanisms (Alien Species, Direct Mortality, Disturbance, Ecosystem Alteration, Ecosystem Loss and Environmental Contamination), and elicited from experts the relative contribution of each mechanism to harm to each of six collectively exhaustive biodiversity ends (genetic diversity, species / populations and ecosystems in each of the terrestrial and freshwater realms). Our results show the distribution of perceived relative extent of harm caused by each impact mechanism. Combining this with the relative degree of concern for each biodiversity end, we have been able to rank or prioritize the potential importance of the gaps in mitigative policy for these impact mechanisms. Ecosystem Alteration, Ecosystem Loss and Alien Species appear to be the primary vehicles of harm. Again, these findings tally with many of the qualitative comments that favour action on alien species and initiatives to protect the integrity of ecosystems. We further examined 12, collectively exhaustive stressors and elicited from experts the extent to which each gives rise to the six impact mechanisms. Results from a first phase were probed via a modified Delphi approach, resulting in valuable expert debates about

Biodiversity Safety Net Gap Analysis. Compass Resource Management Ltd. May 24, 2007 36
how each stressor is ultimately linked to harm to biodiversity. By combining the resulting quantitative data with those already mentioned, we were able to rank the concern associated with the 12 stressors, thereby highlighting areas of important potential policy gaps. Of the 12, urban / rural development, agriculture, transport and utility corridors, forestry, climate change and oil and gas are the six currently resulting in most concern for biodiversity values. Finally, we asked experts to list highlight policy areas that should be addressed by an Action Plan. Experts suggested a wide range of ideas, with common themes including:
• More focus on ecosystem / landscape level planning and conservation that would help reduce fragmentation of key habitats and protect species without the need to necessarily understand them
• A more active and hands-on role for government in land use planning, particularly in the conservation of connective corridors of use to multiple species
• A greater focus on freshwater and non-commercial species, perhaps suggesting a need for a more science-based approach to investing resources into understanding and protecting species at risk
• More focus on rapidly developing specific issues, such as climate change adaptation and alien species introductions
• The need to provide funds for basic research into the life histories of many native species for which very little is known.
• The need to educate and communicate to politicians and the public about the value provided by biodiversity and its importance relative to other, more short-term competing resource management objectives
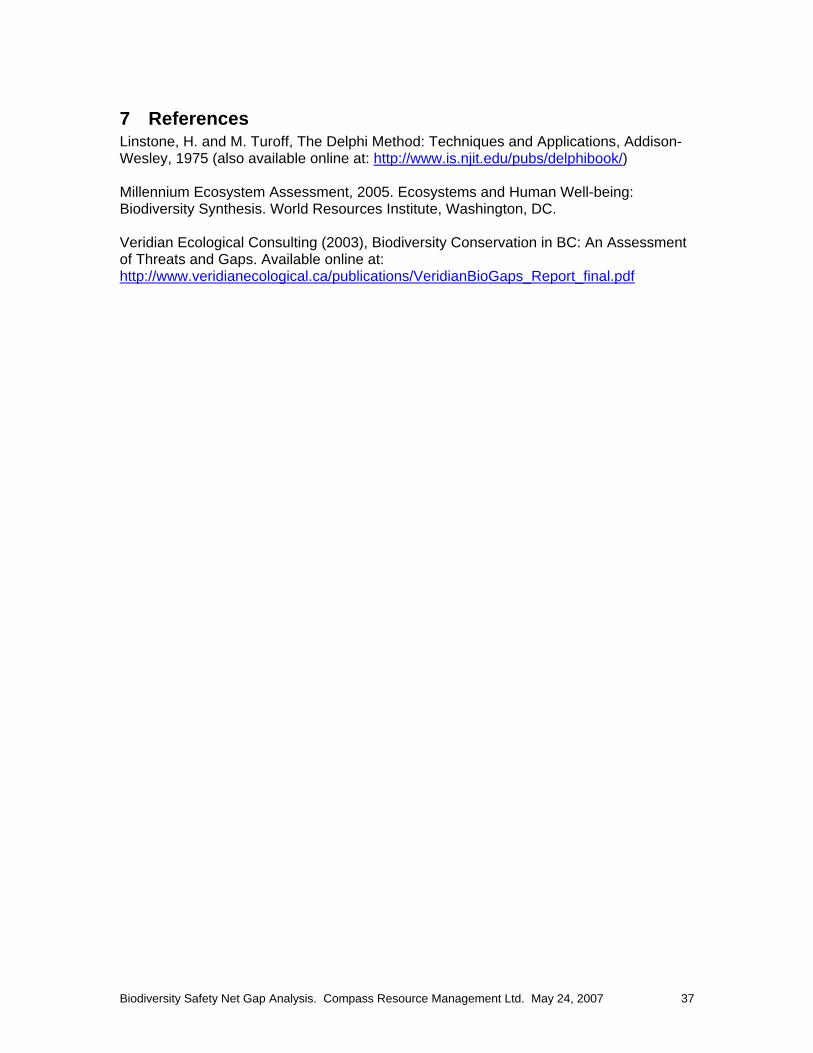
Biodiversity Safety Net Gap Analysis. Compass Resource Management Ltd. May 24, 2007 37
7 References Linstone, H. and M. Turoff, The Delphi Method: Techniques and Applications, Addison-Wesley, 1975 (also available online at: http://www.is.njit.edu/pubs/delphibook/) Millennium Ecosystem Assessment, 2005. Ecosystems and Human Well-being: Biodiversity Synthesis. World Resources Institute, Washington, DC. Veridian Ecological Consulting (2003), Biodiversity Conservation in BC: An Assessment of Threats and Gaps. Available online at: http://www.veridianecological.ca/publications/VeridianBioGaps_Report_final.pdf

Biodiversity Safety Net Gap Analysis. Compass Resource Management Ltd. May 24, 2007 38
8 Appendices
8.1 Notes on Categories
8.1.1 Impact Mechanisms (1) Alien species - individuals or populations of a species when outside the natural range of the species (e.g. purple loosestrife, grey squirrels)
(2) Direct mortality - the direct killing of individuals (e.g. harvest, by-catch, road kills, intentional poisoning)
(3) Disturbance - the alteration of the behaviour of species (e.g. aircraft flying close to mountain goats, dogs chasing waterfowl)
(4) Ecosystem alteration - direct change to the structure of natural systems (e.g. forest harvesting, water diversion)
(5) Ecosystem loss - the replacement of natural communities with human-dominated natural systems (e.g. intensive agriculture) or physical works (e.g. mines, urban areas)
(6) Environmental contamination - the release of chemicals, including nutrients, to natural systems (e.g. SOx, treated sewage, fertilizers, pesticides)
8.1.2 Stressors (a) Agriculture: Infrastructure and activities associated with intensive agriculture cropping e.g. vegetables, grass, nursery, silage etc.,
(b) Aquaculture: Infrastructure and activities associated with shellfish and finfish operations
(c) Climate Change: Impacts due to changes in temperature, precipitation, wind, or other aspects of the Earth's climate
(d) Forestry: Infrastructure and activities associated with harvest or management of trees
(e) Grazing: Infrastructure and activities associated with extensive agriculture (i.e. grazing animals)
(f) Industrial Development: Infrastructure and activities associated with secondary industry or other primary industries not included in forestry, mining, oil & gas or water development.
(g) Mining: Infrastructure and activities associated with the extraction of minerals or other geological materials
(h) Oil & Gas: Infrastructure and activities associated with the extraction of extraction of petroleum or natural gas.

Biodiversity Safety Net Gap Analysis. Compass Resource Management Ltd. May 24, 2007 39
(I) Recreation: Infrastructure or activities associated with motorized or non-motorized human uses for the purposes of recreation (i.e. non-living) e.g. hiking, swimming, hunting, fishing
(j) Transportation & Utility: Infrastructure and activities associated with the movement of people, commodities or information e.g. highways, ports, railways, power lines
(k) Urban & rural development: Infrastructure and activities associated with human use for the purposes of living (e.g. housing, buildings, sewage)
(l) Water Development: Infrastructure and activities associated with diversion, storage, or pumping of water
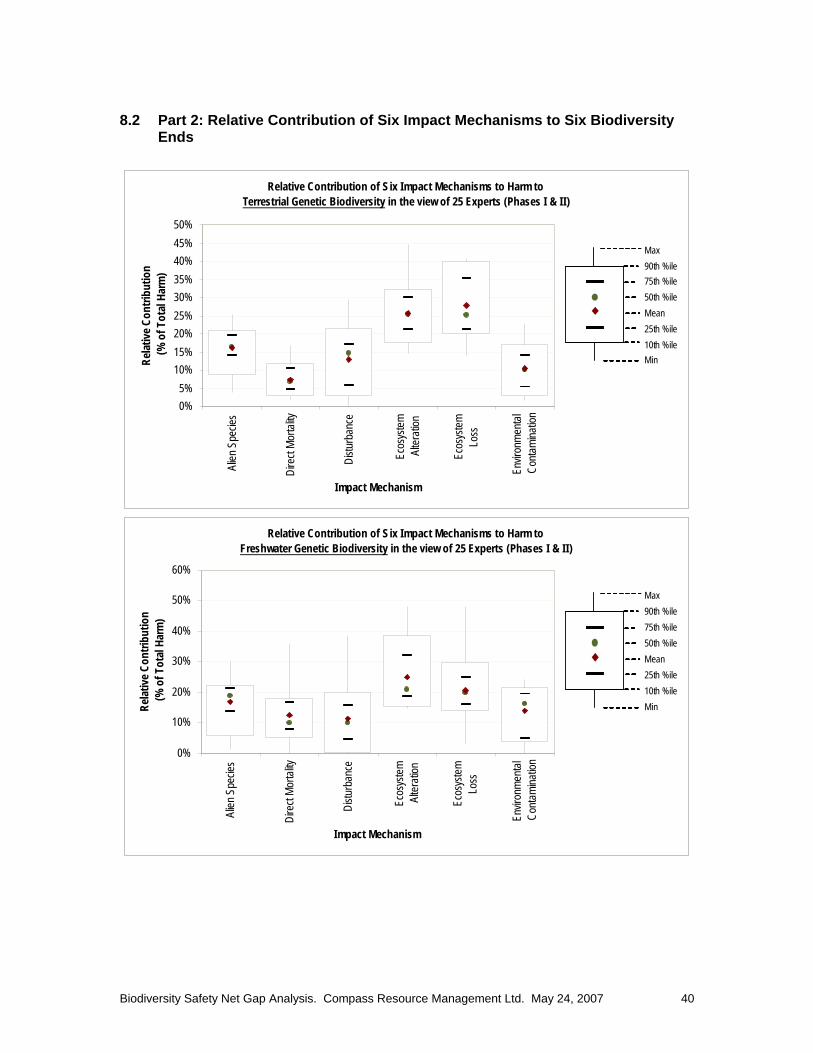
Biodiversity Safety Net Gap Analysis. Compass Resource Management Ltd. May 24, 2007 40
8.2 Part 2: Relative Contribution of Six Impact Mechanisms to Six Biodiversity Ends
Relative Contribution of Six Impact Mechanisms to Harm to Terrestrial Genetic Biodiversity in the view of 25 Experts (Phases I & I I)
0%5%
10%15%20%25%30%35%40%45%50%
Alien
Spe
cies
Dire
ct Mo
rtality
Distu
rban
ce
Ecos
ystem
Alter
ation
Ecos
ystem
Loss
Envir
onme
ntal
Conta
mina
tion
Impact Mechanism
Relat
ive C
ontri
butio
n(%
of T
otal
Harm
)
Max90th %ile75th %ile50th %ileMean25th %ile10th %ileMin
Relative Contribution of Six Impact Mechanisms to Harm to Freshwater Genetic Biodiversity in the view of 25 Experts (Phases I & I I)
0%
10%
20%
30%
40%
50%
60%
Alien
Spe
cies
Dire
ct Mo
rtality
Distu
rban
ce
Ecos
ystem
Alter
ation
Ecos
ystem
Loss
Envir
onme
ntal
Conta
mina
tion
Impact Mechanism
Relat
ive C
ontri
butio
n(%
of T
otal
Harm
)
Max90th %ile75th %ile50th %ileMean25th %ile10th %ileMin

Biodiversity Safety Net Gap Analysis. Compass Resource Management Ltd. May 24, 2007 41
Relative Contribution of Six Impact Mechanisms to Harm to Terrestrial Species and Populations in the view of 25 Experts (Phases I & I I)
0%
5%
10%
15%
20%
25%
30%
35%
40%
45%
Alien
Spe
cies
Dire
ct Mo
rtality
Distu
rban
ce
Ecos
ystem
Alter
ation
Ecos
ystem
Loss
Envir
onme
ntal
Conta
mina
tion
Impact Mechanism
Relat
ive C
ontri
butio
n(%
of T
otal
Harm
)Max90th %ile75th %ile50th %ileMean25th %ile10th %ileMin
Relative Contribution of Six Impact Mechanisms to Harm to Freshwater Species and Populations in the view of 25 Experts (Phases I & I I )
0%
5%
10%
15%
20%
25%
30%
35%
40%
Alien
Spe
cies
Dire
ct Mo
rtality
Distu
rban
ce
Ecos
ystem
Alter
ation
Ecos
ystem
Loss
Envir
onme
ntal
Conta
mina
tion
Impact Mechanism
Relat
ive C
ontri
butio
n(%
of T
otal
Harm
)
Max90th %ile75th %ile50th %ileMean25th %ile10th %ileMin
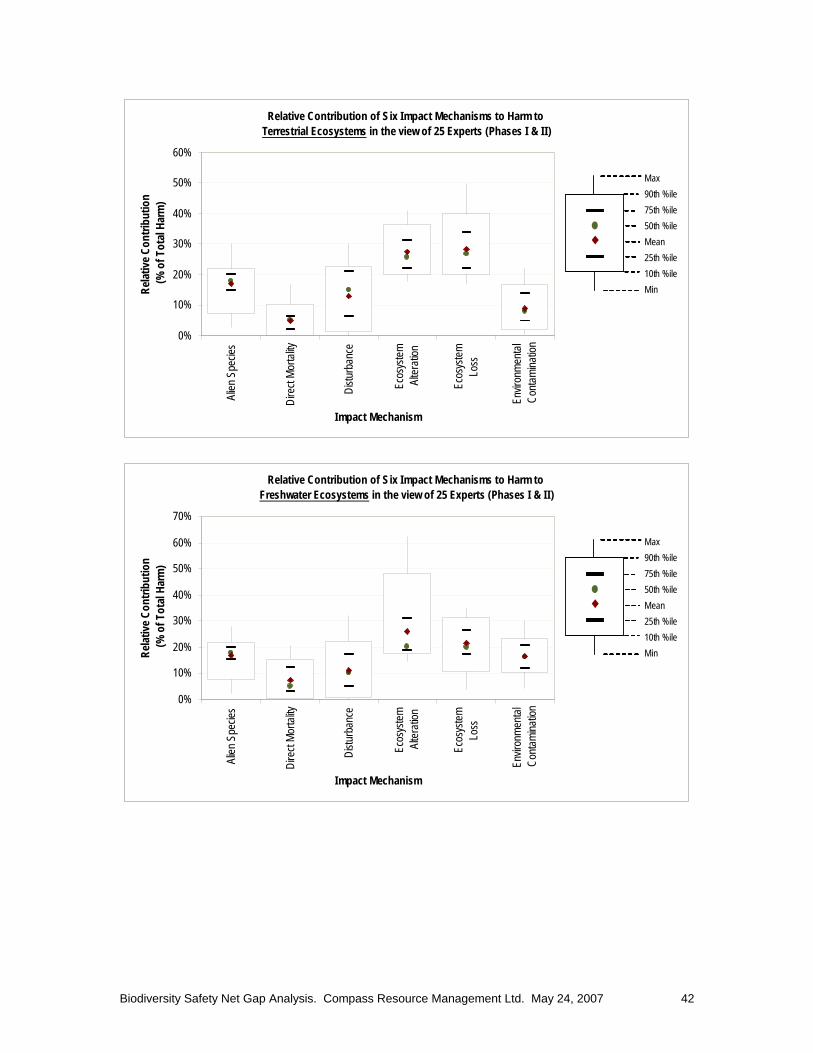
Biodiversity Safety Net Gap Analysis. Compass Resource Management Ltd. May 24, 2007 42
Relative Contribution of Six Impact Mechanisms to Harm to Terrestrial Ecosystems in the view of 25 Experts (Phases I & I I)
0%
10%
20%
30%
40%
50%
60%
Alien
Spe
cies
Dire
ct Mo
rtality
Distu
rban
ce
Ecos
ystem
Alter
ation
Ecos
ystem
Loss
Envir
onme
ntal
Conta
mina
tion
Impact Mechanism
Relat
ive C
ontri
butio
n(%
of T
otal
Harm
)Max90th %ile75th %ile50th %ileMean25th %ile10th %ileMin
Relative Contribution of Six Impact Mechanisms to Harm to Freshwater Ecosystems in the view of 25 Experts (Phases I & I I )
0%
10%
20%
30%
40%
50%
60%
70%
Alien
Spe
cies
Dire
ct Mo
rtality
Distu
rban
ce
Ecos
ystem
Alter
ation
Ecos
ystem
Loss
Envir
onme
ntal
Conta
mina
tion
Impact Mechanism
Relat
ive C
ontri
butio
n(%
of T
otal
Harm
)
Max90th %ile75th %ile50th %ileMean25th %ile10th %ileMin

Biodiversity Safety Net Gap Analysis. Compass Resource Management Ltd. May 24, 2007 43
8.3 Part 3: Relative Contribution of Six Stressors to Six Impact Mechanisms - Phase I and Phase II
8.4 Agriculture
8.4.1 Phase I Quantitative Results
Relative Impact Mechanisms of Agriculture, Phase I
0%
5%
10%
15%
20%
25%
30%
Alien
Spe
cies
Dire
ct Mo
rtality
Distu
rban
ce
Ecos
ystem
Alter
ation
Ecos
ystem
Loss
Envir
onme
ntal
Conta
mina
tion
Impact Mechanism
Relat
ive S
igni
fican
ce o
f Im
pact
Mec
hani
sm
Max90th %ile75th %ile50th %ileMean25th %ile10th %ileMin
Steering Committee Comments / Questions We expected ecosystem loss to be highest, however, instead alien species and environmental contamination are highest. Note also that the differentiation between the impacts is less than expected.
8.4.2 Experts’ Responses
• The results make sense. Weeds and agronomic spp (esp grasses) drive much ecosystem loss in S. Vi, S. Gulf Islands, Lower Mainland and Okanagan. I know less about Envi Contam, but for fresh and marine systems this is known to be an over-riding impact. Lack of differentiation simply means there is uncertaintly about the most important factor, and that many factors are having deleterious impacts.
• Intensive agriculture has higher impacts on ecosystem alteration, and enviorn contamination. Agriculture tends to alter rather than contribute to habitat loss. However, didn't expect alien species to be so high for intensive agriculture
• My response was largely in agreement with the SC • Agricultural change mostly happened early in the previous century - less
expansion is happening presently so the other threats seem more relevant
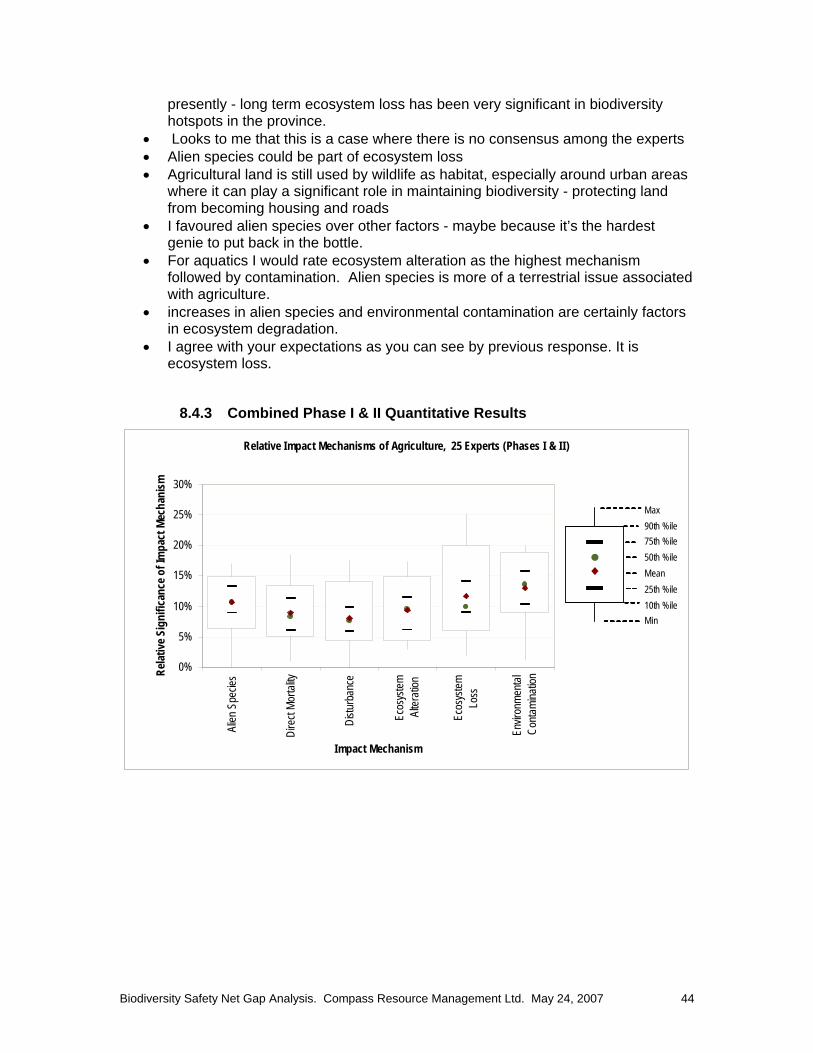
Biodiversity Safety Net Gap Analysis. Compass Resource Management Ltd. May 24, 2007 44
presently - long term ecosystem loss has been very significant in biodiversity hotspots in the province.
• Looks to me that this is a case where there is no consensus among the experts • Alien species could be part of ecosystem loss • Agricultural land is still used by wildlife as habitat, especially around urban areas
where it can play a significant role in maintaining biodiversity - protecting land from becoming housing and roads
• I favoured alien species over other factors - maybe because it’s the hardest genie to put back in the bottle.
• For aquatics I would rate ecosystem alteration as the highest mechanism followed by contamination. Alien species is more of a terrestrial issue associated with agriculture.
• increases in alien species and environmental contamination are certainly factors in ecosystem degradation.
• I agree with your expectations as you can see by previous response. It is ecosystem loss.
8.4.3 Combined Phase I & II Quantitative Results
Relative Impact Mechanisms of Agriculture, 25 Experts (Phases I & I I )
0%
5%
10%
15%
20%
25%
30%
Alien
Spe
cies
Dire
ct Mo
rtality
Distu
rban
ce
Ecos
ystem
Alter
ation
Ecos
ystem
Loss
Envir
onme
ntal
Conta
mina
tion
Impact Mechanism
Relat
ive S
igni
fican
ce o
f Im
pact
Mec
hani
sm
Max90th %ile75th %ile50th %ileMean25th %ile10th %ileMin

Biodiversity Safety Net Gap Analysis. Compass Resource Management Ltd. May 24, 2007 45
8.5 Aquaculture
8.5.1 Phase I Quantitative Results
Relative Impact Mechanisms of Aquaculture, Phase I
0%
5%
10%
15%
20%
25%Ali
en S
pecie
s
Dire
ct Mo
rtality
Distu
rban
ce
Ecos
ystem
Alter
ation
Ecos
ystem
Loss
Envir
onme
ntal
Conta
mina
tion
Impact Mechanism
Relat
ive S
igni
fican
ce o
f Im
pact
Mec
hani
sm
Max90th %ile75th %ile50th %ileMean25th %ile10th %ileMin
8.5.2 Steering Committee Comments / Questions Should disturbance, ecosystem alteration and environmental contamination rate this high? Please remember that the impacts under consideration are in terrestrial and freshwater realms (not the marine realm - although the impacts to terrestrial and freshwater biodiversity can originate or occur there).
8.5.3 Experts’ Responses • Yes • I'm uncertain about these responses too but mainly by the question and
comments about marine above. I am unaware of marked impacts of aquaculture in terrestrial and freshwater habitats. I'd regard main threat of marine aquaculture to be around ecosystem disturbance, contamination and alien spp, but all modest relative to agricultural/rural-urban impacts in terrestrial/freshwater systems.
• Assume aquaculture = Freshwater hatcheries, Trout farms. Expected lower env. Contamination. However alteration is high (alters existing natural sites), and modifies behaviour.
• In my experience aquaculture has a relatively small footprint suggesting that ecosystem alteration and environmental contamination are small effects. Often exotics are farmed, thus, alien species is a major concern with aquaculture;

Biodiversity Safety Net Gap Analysis. Compass Resource Management Ltd. May 24, 2007 46
however, if those introduced species become established there could be an large indirect effect for ecosystem alteration.
• Clearly not. Aquaculture is not that big an issue in FW. • Indeed, I tried to keep this in mind and still came up with terrestrial and FW
impacts ie birds and problems with escapees to FW both alien sp and genetic issues. Don't forget that FW hatcheries are fairly wide spread
• Don't see this as much of an issue in the freshwater realm. Minor risks associated with alien species and contamination.
• Potential of Atlantic salmon establishment as well as alien pathogens and species tied to the aquaculture industry are certainly factors of concern to any freshwater system that is accessible.
8.5.4 Combined Phase I & II Quantitative Results
Relative Impact Mechanisms of Aquaculture, 25 Experts (Phases I & I I )
0%
5%
10%
15%
20%
25%
Alien
Spe
cies
Dire
ct Mo
rtality
Distu
rban
ce
Ecos
ystem
Alter
ation
Ecos
ystem
Loss
Envir
onme
ntal
Conta
mina
tion
Impact Mechanism
Relat
ive S
igni
fican
ce o
f Im
pact
Mec
hani
sm
Max90th %ile75th %ile50th %ileMean25th %ile10th %ileMin

Biodiversity Safety Net Gap Analysis. Compass Resource Management Ltd. May 24, 2007 47
8.6 Climate Change
8.6.1 Phase I Quantitative Results
Relative Impact Mechanisms of Climate Change, Phase I
0%5%
10%15%20%25%30%35%40%45%50%
Alien
Spe
cies
Dire
ct Mo
rtality
Distu
rban
ce
Ecos
ystem
Alter
ation
Ecos
ystem
Loss
Envir
onme
ntal
Conta
mina
tion
Impact Mechanism
Relat
ive S
igni
fican
ce o
f Im
pact
Mec
hani
sm
Max90th %ile75th %ile50th %ileMean25th %ile10th %ileMin
8.6.2 Steering Committee Comments / Questions Based on the definition for ecosystem loss and disturbance these scores are higher than expected.
8.6.3 Experts’ Responses • Ecosystem loss and disturbance seem the most reasonable anticipated impacts,
but these also depend on time-frame. In this context its also unclear what 'alien spp' constitute to reviewers; climate change is already resulting in range expansion, but often of North American native spp. If not native to Canada, some might consider these 'alien'?
• Agree, these are higher as climate change would alter ecosystem. • Climate change will have very large scale and cross ecosystem effects on the
distribution and area of ecosystems currently found in BC • I agree. The main effect of climate change is to "change" things. • Agree • I puzzled between ecosystem alteration and ecosystem loss as the primary mode
of CC impact. In the end I rated them about equal. Many years ago I accepted that we are in for CC forced eco alteration. In the last few months I have become convinced that loss is about equal. Sure life will go on but the scale of change in many ecosystem amounts to loss. Some system will lose their utility as functioning services to support humans. pH sift has gone undiscussed in science circles but it is now undeniable that pH sift due to CO2 (which turns to carbonic acid in water as every grade niner paying attention knows) will cause the loss of ecosystems. We need to add a whole new section to CC studies.

Biodiversity Safety Net Gap Analysis. Compass Resource Management Ltd. May 24, 2007 48
• Big issues for freshwater will be alien species and ecosystem alteration • This will continue to increase in importance until it overshadows many other
factors (e. g MPB, Fire, ecosystem changes, water temp……)
8.6.4 Combined Phase I & II Quantitative Results
Relative Impact Mechanisms of Climate Change, 25 Experts (Phases I & I I )
0%5%
10%15%20%25%30%35%40%45%50%
Alien
Spe
cies
Dire
ct Mo
rtality
Distu
rban
ce
Ecos
ystem
Alter
ation
Ecos
ystem
Loss
Envir
onme
ntal
Conta
mina
tion
Impact Mechanism
Relat
ive S
igni
fican
ce o
f Im
pact
Mec
hani
sm
Max90th %ile75th %ile50th %ileMean25th %ile10th %ileMin
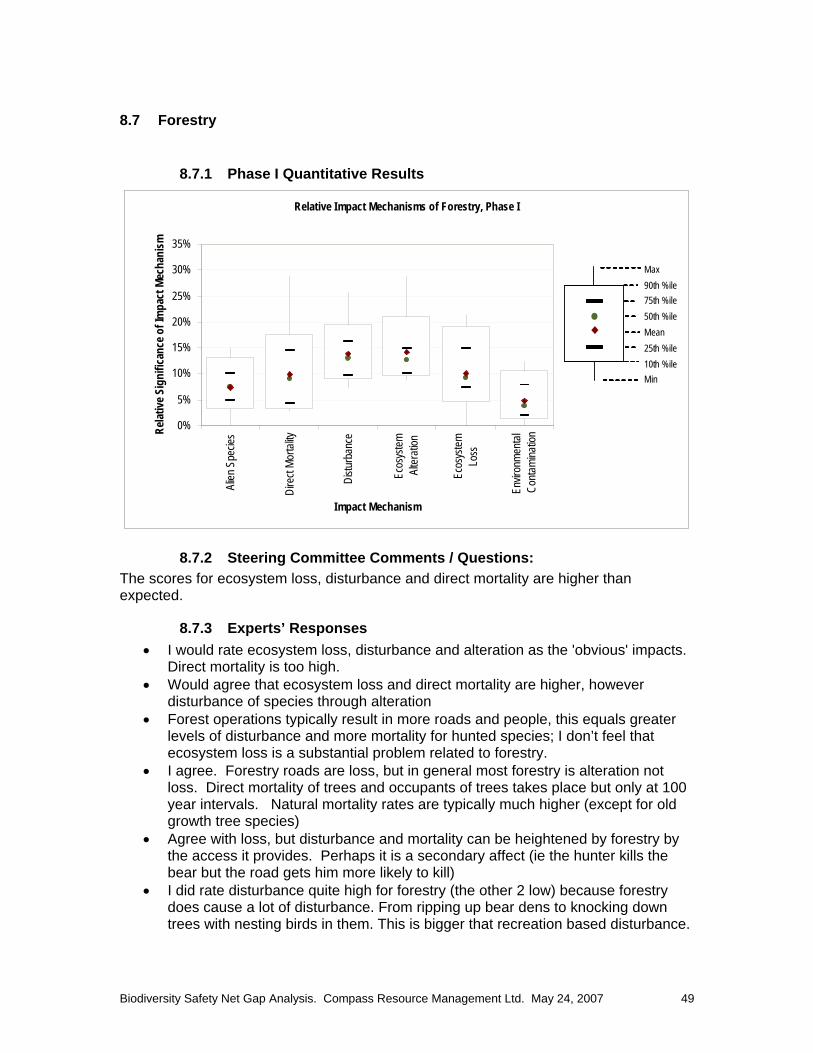
Biodiversity Safety Net Gap Analysis. Compass Resource Management Ltd. May 24, 2007 49
8.7 Forestry
8.7.1 Phase I Quantitative Results
Relative Impact Mechanisms of Forestry, Phase I
0%
5%
10%
15%
20%
25%
30%
35%Ali
en S
pecie
s
Dire
ct Mo
rtality
Distu
rban
ce
Ecos
ystem
Alter
ation
Ecos
ystem
Loss
Envir
onme
ntal
Conta
mina
tion
Impact Mechanism
Relat
ive S
igni
fican
ce o
f Im
pact
Mec
hani
sm
Max90th %ile75th %ile50th %ileMean25th %ile10th %ileMin
8.7.2 Steering Committee Comments / Questions: The scores for ecosystem loss, disturbance and direct mortality are higher than expected.
8.7.3 Experts’ Responses • I would rate ecosystem loss, disturbance and alteration as the 'obvious' impacts.
Direct mortality is too high. • Would agree that ecosystem loss and direct mortality are higher, however
disturbance of species through alteration • Forest operations typically result in more roads and people, this equals greater
levels of disturbance and more mortality for hunted species; I don’t feel that ecosystem loss is a substantial problem related to forestry.
• I agree. Forestry roads are loss, but in general most forestry is alteration not loss. Direct mortality of trees and occupants of trees takes place but only at 100 year intervals. Natural mortality rates are typically much higher (except for old growth tree species)
• Agree with loss, but disturbance and mortality can be heightened by forestry by the access it provides. Perhaps it is a secondary affect (ie the hunter kills the bear but the road gets him more likely to kill)
• I did rate disturbance quite high for forestry (the other 2 low) because forestry does cause a lot of disturbance. From ripping up bear dens to knocking down trees with nesting birds in them. This is bigger that recreation based disturbance.

Biodiversity Safety Net Gap Analysis. Compass Resource Management Ltd. May 24, 2007 50
• Ecosystem alteration would be highest but loss of certain ecosystem types would also be high in freshwater.
• Expected by who!!! Sustained removal of ecosystems over time certainly doesn't lead ecosystem increased unless you are looking at seral communities.
9.3.4 Combined Phase I & II Quantitative Results
Relative Impact Mechanisms of Forestry, 25 Experts (Phases I & I I )
0%
5%
10%
15%
20%
25%
30%
35%
Alien
Spe
cies
Dire
ct Mo
rtality
Distu
rban
ce
Ecos
ystem
Alter
ation
Ecos
ystem
Loss
Envir
onme
ntal
Conta
mina
tion
Impact Mechanism
Relat
ive S
igni
fican
ce o
f Im
pact
Mec
hani
sm
Max90th %ile75th %ile50th %ileMean25th %ile10th %ileMin
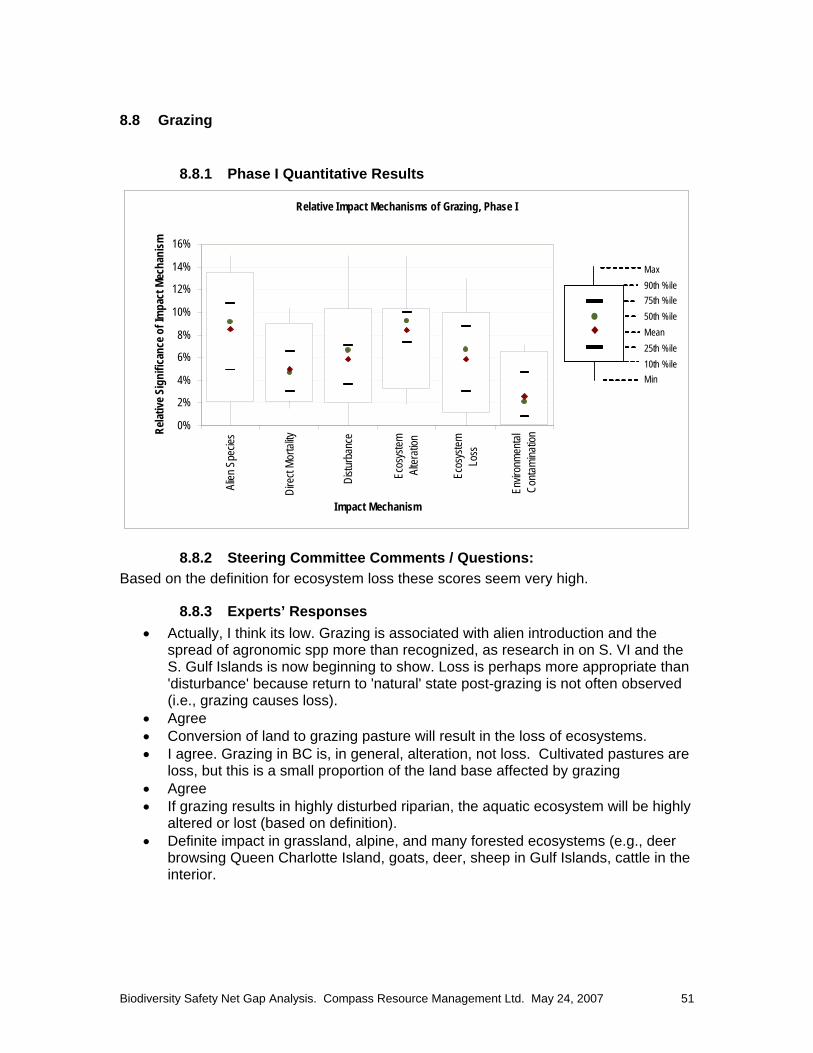
Biodiversity Safety Net Gap Analysis. Compass Resource Management Ltd. May 24, 2007 51
8.8 Grazing
8.8.1 Phase I Quantitative Results
Relative Impact Mechanisms of Grazing, Phase I
0%
2%
4%
6%
8%
10%
12%
14%
16%Ali
en S
pecie
s
Dire
ct Mo
rtality
Distu
rban
ce
Ecos
ystem
Alter
ation
Ecos
ystem
Loss
Envir
onme
ntal
Conta
mina
tion
Impact Mechanism
Relat
ive S
igni
fican
ce o
f Im
pact
Mec
hani
sm
Max90th %ile75th %ile50th %ileMean25th %ile10th %ileMin
8.8.2 Steering Committee Comments / Questions: Based on the definition for ecosystem loss these scores seem very high.
8.8.3 Experts’ Responses • Actually, I think its low. Grazing is associated with alien introduction and the
spread of agronomic spp more than recognized, as research in on S. VI and the S. Gulf Islands is now beginning to show. Loss is perhaps more appropriate than 'disturbance' because return to 'natural' state post-grazing is not often observed (i.e., grazing causes loss).
• Agree • Conversion of land to grazing pasture will result in the loss of ecosystems. • I agree. Grazing in BC is, in general, alteration, not loss. Cultivated pastures are
loss, but this is a small proportion of the land base affected by grazing • Agree • If grazing results in highly disturbed riparian, the aquatic ecosystem will be highly
altered or lost (based on definition). • Definite impact in grassland, alpine, and many forested ecosystems (e.g., deer
browsing Queen Charlotte Island, goats, deer, sheep in Gulf Islands, cattle in the interior.

Biodiversity Safety Net Gap Analysis. Compass Resource Management Ltd. May 24, 2007 52
8.8.4 Combined Phase I & II Quantitative Results
Relative Impact Mechanisms of Grazing, 25 Experts (Phases I & I I )
0%2%4%6%8%
10%12%14%16%18%20%
Alien
Spe
cies
Dire
ct Mo
rtality
Distu
rban
ce
Ecos
ystem
Alter
ation
Ecos
ystem
Loss
Envir
onme
ntal
Conta
mina
tion
Impact Mechanism
Relat
ive S
igni
fican
ce o
f Im
pact
Mec
hani
sm
Max90th %ile75th %ile50th %ileMean25th %ile10th %ileMin

Biodiversity Safety Net Gap Analysis. Compass Resource Management Ltd. May 24, 2007 53
8.9 Industrial Development
8.9.1 Phase I Quantitative Results
Relative Impact Mechanisms of Industrial Development, Phase I
0%
5%
10%
15%
20%
25%
30%Ali
en S
pecie
s
Dire
ct Mo
rtality
Distu
rban
ce
Ecos
ystem
Alter
ation
Ecos
ystem
Loss
Envir
onme
ntal
Conta
mina
tion
Impact Mechanism
Relat
ive S
igni
fican
ce o
f Im
pact
Mec
hani
sm
Max90th %ile75th %ile50th %ileMean25th %ile10th %ileMin
8.9.2 Steering Committee Comments / Questions: Based on the definitions for direct mortality and disturbance these scores seem high.
8.9.3 Experts’ Responses • These are 'guesses' based on relatively broad definitions and a very broad
category of potential impacts, so answers will be imprecise. But, they don't seem unreasonable to me.
• Agree, should be lower than ecosystem alteration • Good empirical data to suggest that industrial activities result in the death of
problem animals and high levels of disturbance for wildlife. • I agree I think on a local level direct mortality will be high, an intensive footprint • Perhaps there are too many different views of what industrial development
means • Odd that everything seems high - is this surprising. Who is defining high scores?

Biodiversity Safety Net Gap Analysis. Compass Resource Management Ltd. May 24, 2007 54
8.9.4 Combined Phase I & II Quantitative Results
Relative Impact Mechanisms of Industrial Development, 25 Experts (Phases I & I I )
0%
5%
10%
15%
20%
25%
30%
35%
40%
Alien
Spe
cies
Dire
ct Mo
rtality
Distu
rban
ce
Ecos
ystem
Alter
ation
Ecos
ystem
Loss
Envir
onme
ntal
Conta
mina
tion
Impact Mechanism
Relat
ive S
igni
fican
ce o
f Im
pact
Mec
hani
sm
Max90th %ile75th %ile50th %ileMean25th %ile10th %ileMin

Biodiversity Safety Net Gap Analysis. Compass Resource Management Ltd. May 24, 2007 55
8.10 Mining
8.10.1 Phase I Quantitative Results
Relative Impact Mechanisms of Mining, Phase I
0%
5%
10%
15%
20%
25%
30%Ali
en S
pecie
s
Dire
ct Mo
rtality
Distu
rban
ce
Ecos
ystem
Alter
ation
Ecos
ystem
Loss
Envir
onme
ntal
Conta
mina
tion
Impact Mechanism
Relat
ive S
igni
fican
ce o
f Im
pact
Mec
hani
sm
Max90th %ile75th %ile50th %ileMean25th %ile10th %ileMin
8.10.2 Steering Committee Comments / Questions: Shouldn't ecosystem loss be higher than disturbance?
8.10.3 Experts’ Responses • I don't think so as most mining impacts other than contamination are local.
However, I'd have put ecosystem alternation higher than loss. This is especially true in the case of reclaimed areas where, as in the case of many US regions, local spp are used in restoration, but 'natural function' is probably often not regained.
• Agree • No, most mining activities have a relatively small ecosystem footprint, but roads
and people have a large disturbance footprint (including mines and exploration activities).
• I agree however mining affects a pretty small portion of the land base, and is not generally concentrated in high value areas.
• Agree • Should it be? Sites will be disturbed and it depends on the size of the mine as to
whether there will be ecosystem loss. Not that many mining applications are approved but there are myriad exploration permits which disturb the landscape but not necessarily the whole ecosystem.
• Both loss and alteration should be high but for aquatics, almost everything will higher than disturbance for all stressors

Biodiversity Safety Net Gap Analysis. Compass Resource Management Ltd. May 24, 2007 56
8.10.4 Combined Phase I & II Quantitative Results
Relative Impact Mechanisms of Mining, 25 Experts (Phases I & I I)
0%
5%
10%
15%
20%
25%
30%
Alien
Spe
cies
Dire
ct Mo
rtality
Distu
rban
ce
Ecos
ystem
Alter
ation
Ecos
ystem
Loss
Envir
onme
ntal
Conta
mina
tion
Impact Mechanism
Relat
ive S
igni
fican
ce o
f Im
pact
Mec
hani
sm
Max90th %ile75th %ile50th %ileMean25th %ile10th %ileMin

Biodiversity Safety Net Gap Analysis. Compass Resource Management Ltd. May 24, 2007 57
8.11 Oil & Gas
8.11.1 Phase I Quantitative Results
Relative Impact Mechanisms of Oil & Gas, Phase I
0%
5%
10%
15%
20%
25%
30%Ali
en S
pecie
s
Dire
ct Mo
rtality
Distu
rban
ce
Ecos
ystem
Alter
ation
Ecos
ystem
Loss
Envir
onme
ntal
Conta
mina
tion
Impact Mechanism
Relat
ive S
igni
fican
ce o
f Im
pact
Mec
hani
sm
Max90th %ile75th %ile50th %ileMean25th %ile10th %ileMin
8.11.2 Steering Committee Comments / Questions: The scores for disturbance and direct mortality seem high.
8.11.3 Experts’ Responses • Again, guesses wherein much uncertainty will play a role. In Africa direct
mortality is huge because opportunistic hunting is widespread among workers. This is almost certainly less in CA, but no one can know this with authority. Since roads are hugely deleterious, I'd have though 'direct mortality' if it included the increase in human use via snow machine and ATV could be substantial. However, I'd put alien spp much higher, because roads, people and vehicles are the main source of introduction into otherwise remote areas.
• Agree, they should be lower • As with mining, people on the land exploring for oil and gas and developing
infrastructure will result in high levels of disturbance and higher direct mortality. • I agree. • Depends on the size of the development. Also there might be higher direct
mortality because of the increase in access caused by oil & gas activities. • Scores for contamination also too high. Clearly the issue is ecosystem alteration
given all the linear development associated with this industry. • Odd that everything seems high - is this surprising. Who is defining high scores?

Biodiversity Safety Net Gap Analysis. Compass Resource Management Ltd. May 24, 2007 58
8.11.4 Combined Phase I & II Quantitative Results
Relative Impact Mechanisms of Oil & Gas, 25 Experts (Phases I & I I)
0%
5%
10%
15%
20%
25%
30%
Alien
Spe
cies
Dire
ct Mo
rtality
Distu
rban
ce
Ecos
ystem
Alter
ation
Ecos
ystem
Loss
Envir
onme
ntal
Conta
mina
tion
Impact Mechanism
Relat
ive S
igni
fican
ce o
f Im
pact
Mec
hani
sm
Max90th %ile75th %ile50th %ileMean25th %ile10th %ileMin

Biodiversity Safety Net Gap Analysis. Compass Resource Management Ltd. May 24, 2007 59
8.12 Recreation
8.12.1 Phase I Quantitative Results
Relative Impact Mechanisms of Recreation, Phase I
0%
5%
10%
15%
20%
25%
30%
35%Ali
en S
pecie
s
Dire
ct Mo
rtality
Distu
rban
ce
Ecos
ystem
Alter
ation
Ecos
ystem
Loss
Envir
onme
ntal
Conta
mina
tion
Impact Mechanism
Relat
ive S
igni
fican
ce o
f Im
pact
Mec
hani
sm
Max90th %ile75th %ile50th %ileMean25th %ile10th %ileMin
8.12.2 Steering Committee Comments / Questions: (none)
8.12.3 Experts’ Responses • Some experts seem to think that recreation has little impact. I disagree. • There certainly are impacts due to recreation. These include traffic mortality of
species, ATV use and disturbance, boating and the transfer of invasives, noise.

Biodiversity Safety Net Gap Analysis. Compass Resource Management Ltd. May 24, 2007 60
8.12.4 Combined Phase I & II Quantitative Results
Relative Impact Mechanisms of Recreation, 25 Experts (Phases I & I I)
0%
5%
10%
15%
20%
25%
30%
35%
40%
Alien
Spe
cies
Dire
ct Mo
rtality
Distu
rban
ce
Ecos
ystem
Alter
ation
Ecos
ystem
Loss
Envir
onme
ntal
Conta
mina
tion
Impact Mechanism
Relat
ive S
igni
fican
ce o
f Im
pact
Mec
hani
sm
Max90th %ile75th %ile50th %ileMean25th %ile10th %ileMin

Biodiversity Safety Net Gap Analysis. Compass Resource Management Ltd. May 24, 2007 61
8.13 Transportation and Utility Corridors
8.13.1 Phase I Quantitative Results
Relative Impact Mechanisms of Transportation & Utility Corridors, Phase I
0%
5%
10%
15%
20%
25%
30%
35%Ali
en S
pecie
s
Dire
ct Mo
rtality
Distu
rban
ce
Ecos
ystem
Alter
ation
Ecos
ystem
Loss
Envir
onme
ntal
Conta
mina
tion
Impact Mechanism
Relat
ive S
igni
fican
ce o
f Im
pact
Mec
hani
sm
Max90th %ile75th %ile50th %ileMean25th %ile10th %ileMin
8.13.2 Steering Committee Comments / Questions: (none)
8.13.3 Experts’ Responses • Direct mortality seems high. • This is quite backwards for aquatic environments. The main issue associated
with roading is ecosystem alteration at a watershed scale, contamination form run-off and a form of alteration or loss associated with road crossings acting as barriers to movement.
• Road and rail kill. Increased derailments of late.
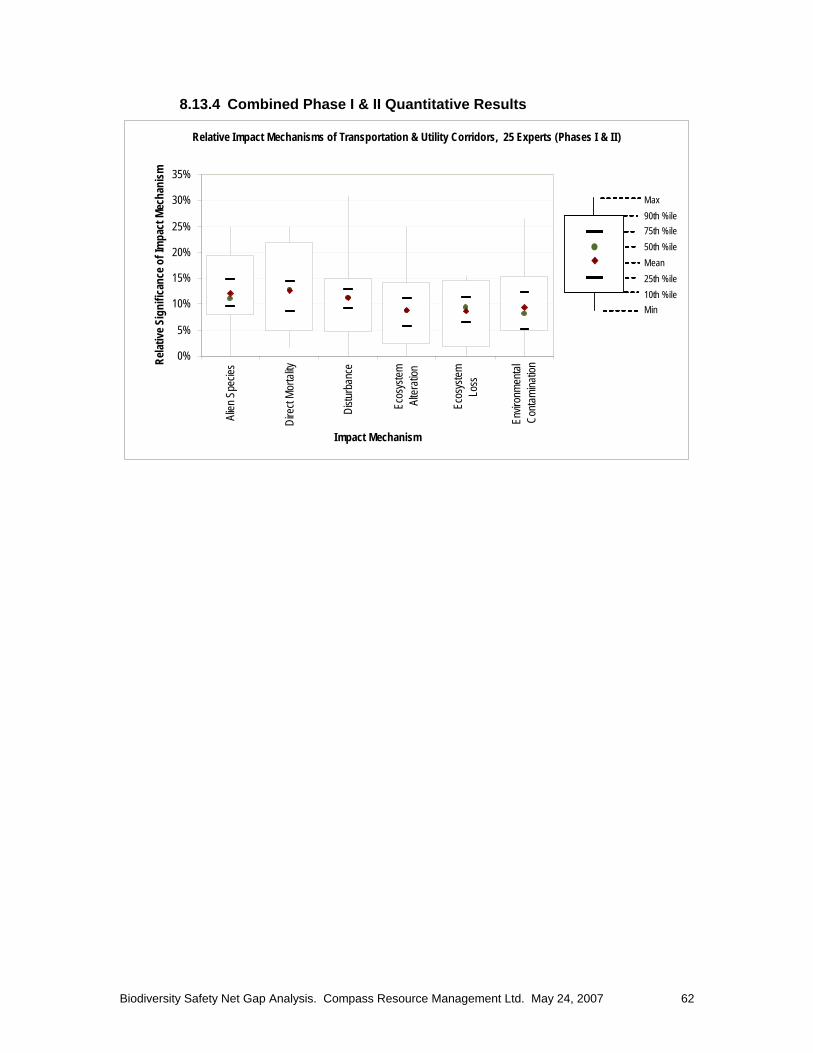
Biodiversity Safety Net Gap Analysis. Compass Resource Management Ltd. May 24, 2007 62
8.13.4 Combined Phase I & II Quantitative Results
Relative Impact Mechanisms of Transportation & Utility Corridors, 25 Experts (Phases I & I I)
0%
5%
10%
15%
20%
25%
30%
35%
Alien
Spe
cies
Dire
ct Mo
rtality
Distu
rban
ce
Ecos
ystem
Alter
ation
Ecos
ystem
Loss
Envir
onme
ntal
Conta
mina
tion
Impact Mechanism
Relat
ive S
igni
fican
ce o
f Im
pact
Mec
hani
sm
Max90th %ile75th %ile50th %ileMean25th %ile10th %ileMin

Biodiversity Safety Net Gap Analysis. Compass Resource Management Ltd. May 24, 2007 63
8.14 Urban / Rural Development
8.14.1 Phase I Quantitative Results
Relative Impact Mechanisms of Urban/Rural Development, Phase I
0%
5%
10%
15%
20%
25%
30%
35%
40%Ali
en S
pecie
s
Dire
ct Mo
rtality
Distu
rban
ce
Ecos
ystem
Alter
ation
Ecos
ystem
Loss
Envir
onme
ntal
Conta
mina
tion
Impact Mechanism
Relat
ive S
igni
fican
ce o
f Im
pact
Mec
hani
sm
Max90th %ile75th %ile50th %ileMean25th %ile10th %ileMin
8.14.2 Steering Committee Comments / Questions: The scores for direct mortality, disturbance and ecosystem alteration seem too high?
8.14.3 Experts’ Responses • All impacts of this development are underestimated generally and no one has yet
decoupled effects substantially to know which are highest. Human density is the best correlate of spp loss worldwide, which is related generally to R/U, Industrial and related development (e.g. transportation). Frankly, I don't see the value in attempting to prioritize this intimately coupled effects, and I wouldn't put a lot of stock even in 'expert opinion' related to them (including my own, despite much research related to these impacts).
• Direct mortality is high, but could accept disturbance and alteration due to the impacts on development on species behavior and associated changes to land use.
• I think this reflect the diffuse impacts of development. E.g. Urban areas are ecosystem loss but many rural areas are mostly alteration.
• Agree with direct mortality, but not the other • In comparison to what? It seems that urban / rural development would have high
impacts on all three areas. • Ecosystem loss in highly developed areas and alteration is less developed
seems right as the big two. • Odd that everything seems high - is this surprising. Who is defining high scores?

Biodiversity Safety Net Gap Analysis. Compass Resource Management Ltd. May 24, 2007 64
8.14.4 Combined Phase I & II Quantitative Results
Relative Impact Mechanisms of Urban/Rural Development, 25 Experts (Phases I & I I)
0%
5%
10%
15%
20%
25%
30%
35%
Alien
Spe
cies
Dire
ct Mo
rtality
Distu
rban
ce
Ecos
ystem
Alter
ation
Ecos
ystem
Loss
Envir
onme
ntal
Conta
mina
tion
Impact Mechanism
Relat
ive S
igni
fican
ce o
f Im
pact
Mec
hani
sm
Max90th %ile75th %ile50th %ileMean25th %ile10th %ileMin

Biodiversity Safety Net Gap Analysis. Compass Resource Management Ltd. May 24, 2007 65
8.15 Water Development
8.15.1 Phase I Quantitative Results
Relative Impact Mechanisms of Water Development, Phase I
0%
5%
10%
15%
20%
25%Ali
en S
pecie
s
Dire
ct Mo
rtality
Distu
rban
ce
Ecos
ystem
Alter
ation
Ecos
ystem
Loss
Envir
onme
ntal
Conta
mina
tion
Impact Mechanism
Relat
ive S
igni
fican
ce o
f Im
pact
Mec
hani
sm
Max90th %ile75th %ile50th %ileMean25th %ile10th %ileMin
8.15.2 Steering Committee Comments / Questions: The scores for direct mortality and disturbance seem too high?
8.15.3 Experts’ Responses • Hard to say with any confidence; however, I'd put alteration higher (est). • Could accept they may be a little high. • I agree; with the exception of large hydroelectric projects that interact with
migratory fish species direct mortality and disturbance is probably less than the reported mean.
• Perhaps but entrainment in irrigation ditches and hydro dams is significant. • Agree with disturbance, but spillways kill lots of fish. Kemano and reduced
release of cool water is hard on migrating salmon. • I looked at direct mortalities due to drying up creeks etc and direct mortalities
due to entrainment • In aquatic systems there is a lot of direct mortality associated with both
entrainment in dams and irrigation systems. • Odd that everything seems high - is this surprising. Who is defining high scores? • frankly I think that the steering committee is dissecting this stuff too much. The
wording here leads to several interpretations and you should not expect specific outcomes anyway!! I found this one a bit too difficult also I do not think that ranking one thing against another is an effective tool always, unnecessary reductionism.

Biodiversity Safety Net Gap Analysis. Compass Resource Management Ltd. May 24, 2007 66
8.15.4 Combined Phase I & II Quantitative Results
Relative Impact Mechanisms of Water Development, 25 Experts (Phases I & I I )
0%
5%
10%
15%
20%
25%
30%
Alien
Spe
cies
Dire
ct Mo
rtality
Distu
rban
ce
Ecos
ystem
Alter
ation
Ecos
ystem
Loss
Envir
onme
ntal
Conta
mina
tion
Impact Mechanism
Relat
ive S
igni
fican
ce o
f Im
pact
Mec
hani
sm
Max90th %ile75th %ile50th %ileMean25th %ile10th %ileMin