Embed Size (px)
Citation preview

Bp
HP
a
ARRAA
KGAFPB
1
bprpeawatflehfl
momam
h0
International Journal of Biological Macromolecules 70 (2014) 26–36
Contents lists available at ScienceDirect
International Journal of Biological Macromolecules
j ourna l ho me pa g e: www.elsev ier .com/ locate / i jb iomac
iodegradable flocculants based on polyacrylamide andoly(N,N-dimethylacrylamide) grafted amylopectin
aradhan Kolya, Tridib Tripathy ∗
ostgraduate Division of Chemistry, Midnapore College, Midnapore, Paschim Medinipur 721101, West Bengal, India
r t i c l e i n f o
rticle history:eceived 22 April 2014eceived in revised form 12 June 2014ccepted 13 June 2014vailable online 24 June 2014
eywords:
a b s t r a c t
Synthesis of amylopectin grafted polyacrylamide (AP-g-PAM) and poly(N,N-dimethylacrylamide) (AP-g-PDMA) was carried out by Ce4+ in water medium. The reaction conditions for maximum grafting wasoptimized by varying the reaction variables, including the concentration of monomers, ceric ammoniumnitrate (CAN), amylopectin, reaction time and temperature. The graft copolymers were characterized byFTIR spectroscopy, NMR (both 1H and 13C) spectroscopy, molecular weight determination and molecularweight distribution by using size exclusion chromatography (SEC), thermal analysis (TGA), SEM studies.
raft copolymerizationmylopectinlocculationoly(N,N-dimethylacrylamide)iodegradation
Biodegradation of the graft copolymers was carried out by enzyme hydrolysis. Flocculation performancesof the graft copolymers were evaluated in 1.0 wt% coal and 1.0 wt% silica suspensions. A comparativestudy of the flocculation performances of AP-g-PDMA and AP-g-PAM was also made. It shows that theflocculation performance of AP-g-PDMA was better than that of AP-g-PAM. AP-g-PDMA performed bestwhen compared with other commercial flocculants in the same suspensions.
© 2014 Elsevier B.V. All rights reserved.
. Introduction
Pure water is an essential commodity for the survival of humaneings as well as various industries like mineral, paper making,aper processing and others. Since fresh water is very valuable,ecycling of the wastewater is a common practice to reduce theroduction cost for all the processing industries. Again, the efflu-nts which are discharged by the industries are highly undesirablend unsafe for the environment. Therefore, treatment of waste-ater, particularly the sewage sludges and slimes from municipal
nd industrial effluents is necessary before their disposal. The par-icles present in water can be removed by the coagulation andocculation process [1,2]. Between the two, flocculation is gen-rally preferred for the removal of colloid particles because of itsigh efficiency, easy handling and availability of various kinds ofocculating agents.
Polymeric flocculating agents are used extensively for the treat-ent of industrial effluents and mineral processing [3–5] because
f their several advantages. They do not affect the pH of the
edium, used in small quantities and the flocs which are formedre bigger and stronger [3]. Synthetic as well as natural poly-ers of various ionicities were used widely. Polyacrylamide and
∗ Corresponding author. Tel.: +91 3222 275847; fax: +91 3222 275847.E-mail address: tridib [email protected] (T. Tripathy).
ttp://dx.doi.org/10.1016/j.ijbiomac.2014.06.028141-8130/© 2014 Elsevier B.V. All rights reserved.
its copolymers are good flocculants but shear degradability [6,7]is their biggest drawback. To minimize such drawback, a class ofgraft copolymers has been developed recently by grafting syn-thetic polymers onto the natural polysaccharide backbones [8–14].The flocculation performances of this type of graft copolymers areenhanced because of the better approachability [15] of the danglinggrafted chains onto the rigid polysaccharide backbones to the sus-pended solid particles in suspensions. Major graft copolymers so farused extensively, are natural polysaccharide and polyacrylamide(PAM) based [16].
Poly(N,N-dimethylacrylamide) (PDMA) is highly water soluble,biocompatible [17] and its copolymer is used in oil recovery [18].Between PAM and PDMA, the polarity of amide functionality ofPDMA is greater than that of PAM because of the presence oftwo methyl groups at the ‘N’ atom in PDMA repeat unit whichincreases the electron density at the nitrogen atom. Again inPAM, extensive intra molecular hydrogen bonding between –NH2groups and the adjacent carbonyl groups occurs, which reducethe water solubility of the PAM based graft copolymers to someextent. But no such intramolecular hydrogen bonding is possiblein PDMA which makes it easy water soluble [19]. Graft copolymersbased on N,N-dimethylacrylamide and polysaccharides have been
reported recently [20,21]. But no attempt was made to investigatethe flocculation performance of graft copolymers based on N,N-dimethylacrylamide and polysaccharides in detail. In the presentinvestigation an attempt has been made to investigate the effect of
l of Biological Macromolecules 70 (2014) 26–36 27
iiacmg
2
2
wdm(SCCoaT
2
uptatnCfatoqvbi
2
asibameanPcSawa
2
cm
Polysaccharide (AP) +Monomers (AM / DMA)
Catalyst (CAN), Temperature 350C
Unreacted AM / DMA +PAM / PDMA +
Graft copolymers(AP-g-PAM / AP-g-PDMA
Precipitated with acetone, washed withwater, reprecipitatted with acetone
Solution Precipitation
AM / DMA Graft copolymer +PAM / PDMA
Extracted with formamide +acetic acid ( 1: 1 by volume) forPAM and MeOH + H2O(3:1 by volume) for PDMA
PAM / PDMA(Solution)
Graft copolymer(Residue)
AP-g-PAM / AP-g-PDMA
H. Kolya, T. Tripathy / International Journa
ncreasing electron density hence polarity of the amide functional-ty on the flocculation performance of the graft copolymer based onmylopectin, acrylamide and N,N-dimethylacrylamide in 1.0 wt%oal and 1.0 wt% of silica suspensions. A comparison has also beenade between the flocculation performances of AP-g-PAM and AP-
-PDMA in the same suspensions.
. Experimental
.1. Materials
Amylopectin (AP) and N,N-dimethyacrylamide (DMA)ere procured from Aldrich Chemical Company, USA. N,N-imethylacrylamide was purified by vacuum distillation and theiddle fraction was used for the study. Ceric ammonium nitrate
CAN) and acetone were supplied by E Merck, Bombay, India.ilicon dioxide was procured from Loba Chemie, Bombay, India.oal sample was obtained from S-Seam Bokaro Colliery, Bokarooal field, Jharkhand, India. Magnafloc1011and Percol 181 wasbtained from BASF, Mumbai, India. Telfloc 2230 was obtained as
gift from Balaji Paper and Newsprint (Manikpara, W.B., India).he commercial flocculants are PAM based linear homopolymer.
.2. Synthesis of the graft copolymers
Ceric ion induced solution polymerization technique [22] wassed for the preparation of graft copolymers. A typical syntheticrocedure was as follows: 1.5 g AP was dissolved in 100 ml dis-illed water taken in a 250 cc conical flask with nitrogen gas inletnd outlet systems. 10 ml (0.097 mol/L) of purified DMA was addedo the solution. After that N2 gas was purged for 30 min to elimi-ate any dissolved oxygen into the solution. Then 25 ml of requiredAN solution was added to the solution. The N2 gas was purged
or another 20 min and the temperature was kept constant atbout 29 ± 1 ◦C. The reaction was allowed to continue for 6 h,hen the reaction was terminated by adding saturated solutionf hydroquinone. The polymer was precipitated by adding excessuantity of acetone. The homopolymer PDMA was removed by sol-ent extraction technique using methanol and water mixture (5:1y volume). Similarly AP-g-PAM was also synthesized using AM
nstead of DMA as the monomer.
.3. Purification of the graft copolymers
From the prepared graft copolymer the homopolymer PDMAnd PAM were removed by the solvent extraction technique. A thickolution of the graft copolymer (AP-g-PDMA) was made by dissolv-ng a known amount of graft copolymer with water in a 250 mleaker. Then excess methanol was added and was stirred for 24 hnd it was then centrifuged to separate the insoluble graft copoly-er from methanol soluble homopolymer (PDMA). Two more
xtractions with methanol were then carried out. The supernatantfter centrifuge was tested by adding acetone in excess. There waso precipitation which confirmed the absence of homopolymerDMA in the graft copolymer. A controlled experiment was alsoarried out with the mixture of AP and PDMA in the same way.imilarly the homopolymer PAM was removed by using formamidend acetic acid (1:1 by volume) as the solvent. The graft copolymersere then dried in a vacuum oven, after that they were pulverized
nd shieved. The synthetic procedure is shown in Scheme 1.
.4. Isolation of grafted PDMA and PAM chains by acid hydrolysis
The grafted PDMA chains were isolated by hydrolyzing the graftopolymer in 70% (V/V) H2SO4 [23] for 24 h under reflux. Theixture after reflux was poured into excess acetone and hexane
Scheme 1.
mixture (1:1) by volume. The PDMA thus obtained was precipi-tated again in acetone and hexane mixture. The isolated PDMA wasdried in vacuum. The grafted PAM chains were isolated from APbackbone by treatment with 0.5 N HCl for 24 h at 30 ◦C temperature.The mixture was poured into excess acetone and the precipitatedPAM was redissolved in water and reprecipitated in acetone. Thenit was dried in vacuum. The graft copolymer, the isolated PDMAand PAM were used for IR study.
2.5. Effect of reaction variables
Since polymerization variables determine the extent of graftingand homopolymer amount, certain factors affecting the graftingparameters were investigated to achieve the optimum conditionof polymerization. Therefore, the grafting reaction of acrylamideand dimethylacrylamide onto amylopectin in homogenous aque-ous media was optimized by changing substrate concentration,initiator (CAN) concentration, initial monomer concentration, reac-tion time and reaction temperature. Various grafting parameterswere calculated by using following equations [24]. The results aregiven in Table 1.
Conversion (%C) = wt. of graft copolymer − wt. of polysaccharideamount of DMA or AM
× 100 (1)
Grafting ratio (%G) = wt. of graft copolymerwt. of polysaccharide
× 100 (2)
2.5.1. Effect of the amount of substrate (AP)The graft copolymerization reaction was carried out for various
concentration of substrate. The concentration of the AP was var-ied from 0.5 to 3.5 g for both the graft copolymerization reaction
at constant monomer concentrations AM (0.107 mol/L) and DMA(0.107 mol/L), initiator (CAN) concentration (4.8 × 10⁻⁴ mol/L),reaction time (5 h) and reaction temperature (35 ◦C). The resultsare given in Fig. 1.
28 H. Kolya, T. Tripathy / International Journal of Biological Macromolecules 70 (2014) 26–36
Table 1Synthetic details of graft copolymers.
Polymer Optimized grafting conditions % Grafting ratioa (%G) % Conversionb MW (Da)
Substrate (g) Monomer (mol) CAN (mol) Time (h) Temp. (◦C)
AP-g-PAM 1.5 1.07 4.56 × 10⁻⁴ 5 35 567 92.1 4.3 × 10⁶
AP-g-PDMA 1.5 1.07 4.56 × 10⁻⁴ 5 35 707 86.0 6.4 × 10⁶
a %Grafting ratio (%G) is calculated from the relation %G = (wt. of graft polymer/wt. of polysaccharide) × 100.b Percentage conversion is calculated from the relation, %Conversion = [(wt. of graft copolymer − wt. of polysaccharide)/amount of AM or DMA] × 100.
0.5 1.0 1.5 2.0 2.5 3.0 3.5
200
300
400
500
600
700
% G
Substrate (AP) (mol/L)
AP-g-PAM AP-g-PDMA
Fig. 1. The %G against concentration of AP at monomer concentrationA1
2
cap
2
tp
Fit
0 1 2 3 4 5 6 7
500
550
600
650
700
% G
Initiator(C AN) Concent rat ion ( 10-4 mo l/L)
AP-g-PAM
AP-g-PDMA
Fig. 3. The %G against initiator concentration at substrate concentration = 1.5 g,monomer concentration AM = 0.107 mol/L, DMA = 0.107 mol/L, reaction time = 5 h
M = 0.107 mol/L, DMA = 0.107 mol/L, initiator (CAN) concentration = 4.8 ×0−4 mol/L, reaction time = 5 h and reaction temperature = 35 ◦C.
.5.2. Effect of the monomer concentrationThe grafting reaction was carried out by changing monomer
oncentrations AM and DMA separately. The concentration of AMnd DMA were changed from 0.068 to 0.097 mol/L keeping otherarameters constant. The results are shown in Fig. 2.
.5.3. Effect of the initiator (CAN) concentrationThe grafting reaction was carried out with different CAN concen-
rations from 0.91 × 10⁻⁴ mol/L to 6.38 × 10⁻⁴ mol/L keeping otherarameters constant. The results are shown in Fig. 3.
0.06 0.07 0.08 0.09 0.10 0.11 0.12 0.13
400
500
600
700
% G
Monomers (mol/L)
AP-g-PAM AP-g-PDMA
ig. 2. The %G against concentration of monomer at substrate concentration = 1.5 g,nitiator (CAN) concentration = 4.8 × 10⁻⁴ mol/L, reaction time = 5 h and reactionemperature = 35 ◦C.
and reaction temperature = 35 ◦C.
2.5.4. Effect of the reaction timeThe grafting reaction was carried out for various time intervals
1–7 h keeping other parameters constant. The results are shown inFig. 4.
2.5.5. Effect of the reaction temperatureThe graft copolymerization reaction was carried out in the tem-
perature ranges of 25–80 ◦C keeping other parameters constant.The results are shown in Fig. 5.
1 2 3 4 5 6 7
500
600
700
% G
Reaction time (h)
AP-g-PAM AP-g-PDMA
Fig. 4. The %G against reaction time at substrate concentration = 1.5 g, monomerconcentration AM = 0.107 mol/L, DMA = 0.107 mol/L, initiator (CAN) concentra-tion = 4.8 × 10⁻⁴ mol/L and reaction temperature = 35 ◦C.
H. Kolya, T. Tripathy / International Journal of Biological Macromolecules 70 (2014) 26–36 29
Table 2Average molecular weight and molecular weight distribution of AP, AP-g-PAM and AP-g-PDMA.
Polymer Mn (Da) MW (Da) Mp (Da) Mz (Da) Mz+1 (Da)
AP 1,066,726 1,396,392 1,592,513 1,638,276 1,819,934AP-g-PAM 3,794,253 4,298,655
AP-g-PDMA 5,429,413 6,366,423
20 30 40 50 60 70 80
500
550
600
650
700
% G
Reaction temperature (0C)
AP-g-PAM AP-g-PDMA
Fig. 5. The %G against reaction temperature at substrate concentration = 1.5 g,monomer concentration AM = 0.107 mol/L, DMA = 0.107 mol/L, initiator (CAN) con-c
3
3d
A20t
Scanning electron micrographs for AP and the synthesized graft
entration = 4.8 × 10⁻⁴ mol/L and reaction time = 5 h.
. Characterization
.1. Determination of molecular weight and molecular weightistribution using size exclusion chromatography (SEC)
The molecular weight and molecular weight distribution of AP,P-g-PAM and AP-g-PDMA were determined using SEC (Model:414, supplied by water (I) Pvt. Ltd., USA). The flow rate was fixed at
.6 ml min−1 and the column temperature was kept at 30 ◦C usinghe analysis. The SEC plots for AP, AP-g-PAM and AP-g-PDMA areFig. 6. The molecular weight and mole
4,081,681 4,976,956 5,950,5564,103,857 7,613,826 9,043,109
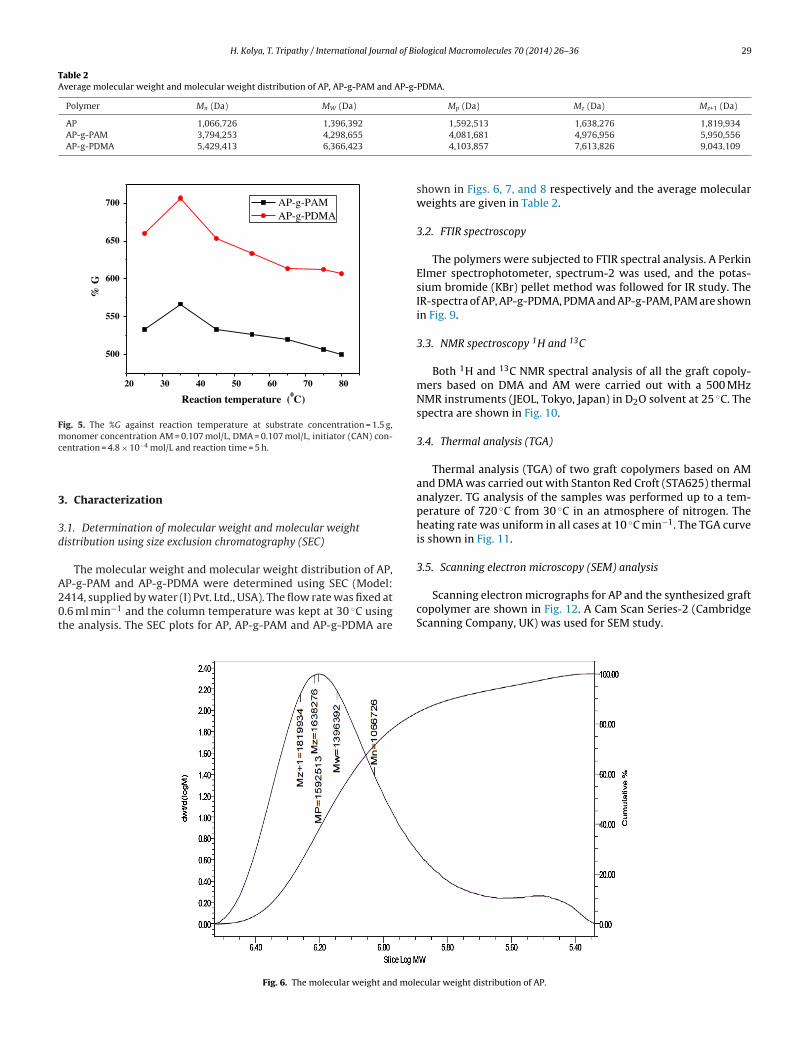
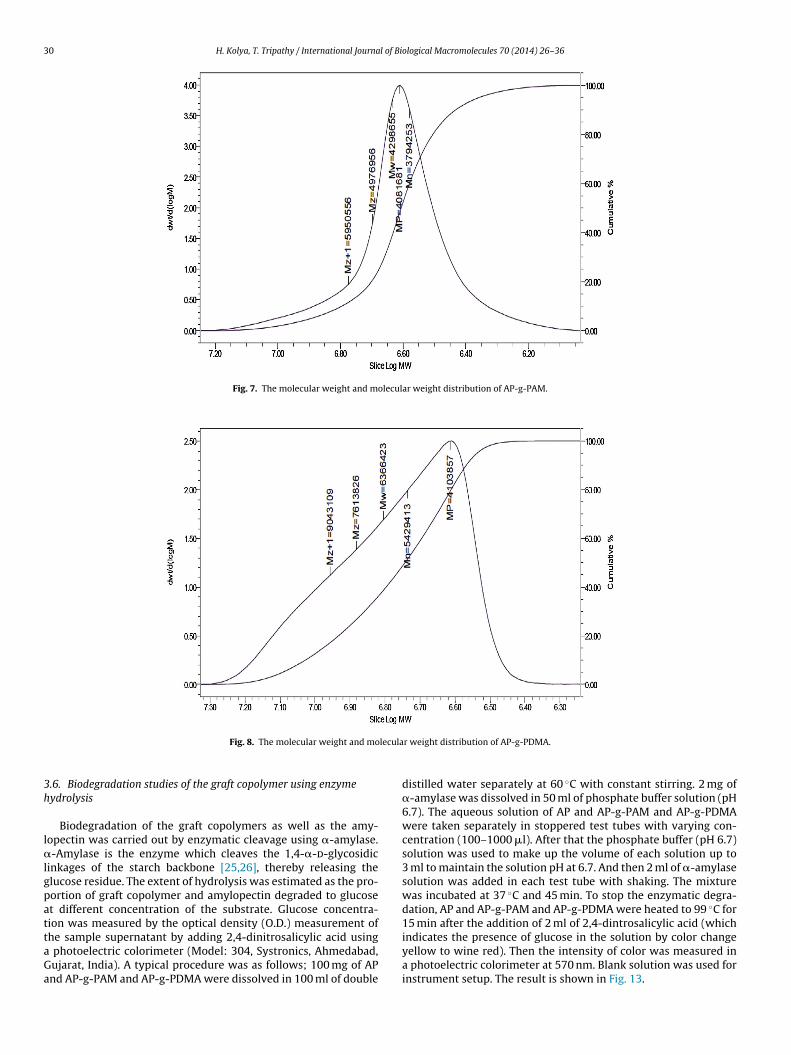
shown in Figs. 6, 7, and 8 respectively and the average molecularweights are given in Table 2.
3.2. FTIR spectroscopy
The polymers were subjected to FTIR spectral analysis. A PerkinElmer spectrophotometer, spectrum-2 was used, and the potas-sium bromide (KBr) pellet method was followed for IR study. TheIR-spectra of AP, AP-g-PDMA, PDMA and AP-g-PAM, PAM are shownin Fig. 9.
3.3. NMR spectroscopy 1H and 13C
Both 1H and 13C NMR spectral analysis of all the graft copoly-mers based on DMA and AM were carried out with a 500 MHzNMR instruments (JEOL, Tokyo, Japan) in D2O solvent at 25 ◦C. Thespectra are shown in Fig. 10.
3.4. Thermal analysis (TGA)
Thermal analysis (TGA) of two graft copolymers based on AMand DMA was carried out with Stanton Red Croft (STA625) thermalanalyzer. TG analysis of the samples was performed up to a tem-perature of 720 ◦C from 30 ◦C in an atmosphere of nitrogen. Theheating rate was uniform in all cases at 10 ◦C min−1. The TGA curveis shown in Fig. 11.
3.5. Scanning electron microscopy (SEM) analysis
copolymer are shown in Fig. 12. A Cam Scan Series-2 (CambridgeScanning Company, UK) was used for SEM study.
cular weight distribution of AP.
30 H. Kolya, T. Tripathy / International Journal of Biological Macromolecules 70 (2014) 26–36
Fig. 7. The molecular weight and molecular weight distribution of AP-g-PAM.
lecula
3h
l�lgpattaGa
Fig. 8. The molecular weight and mo
.6. Biodegradation studies of the graft copolymer using enzymeydrolysis
Biodegradation of the graft copolymers as well as the amy-opectin was carried out by enzymatic cleavage using �-amylase.-Amylase is the enzyme which cleaves the 1,4-�-d-glycosidic
inkages of the starch backbone [25,26], thereby releasing thelucose residue. The extent of hydrolysis was estimated as the pro-ortion of graft copolymer and amylopectin degraded to glucoset different concentration of the substrate. Glucose concentra-ion was measured by the optical density (O.D.) measurement of
he sample supernatant by adding 2,4-dinitrosalicylic acid usingphotoelectric colorimeter (Model: 304, Systronics, Ahmedabad,ujarat, India). A typical procedure was as follows; 100 mg of APnd AP-g-PAM and AP-g-PDMA were dissolved in 100 ml of double
r weight distribution of AP-g-PDMA.
distilled water separately at 60 ◦C with constant stirring. 2 mg of�-amylase was dissolved in 50 ml of phosphate buffer solution (pH6.7). The aqueous solution of AP and AP-g-PAM and AP-g-PDMAwere taken separately in stoppered test tubes with varying con-centration (100–1000 �l). After that the phosphate buffer (pH 6.7)solution was used to make up the volume of each solution up to3 ml to maintain the solution pH at 6.7. And then 2 ml of �-amylasesolution was added in each test tube with shaking. The mixturewas incubated at 37 ◦C and 45 min. To stop the enzymatic degra-dation, AP and AP-g-PAM and AP-g-PDMA were heated to 99 ◦C for15 min after the addition of 2 ml of 2,4-dintrosalicylic acid (which
indicates the presence of glucose in the solution by color changeyellow to wine red). Then the intensity of color was measured ina photoelectric colorimeter at 570 nm. Blank solution was used forinstrument setup. The result is shown in Fig. 13.
H. Kolya, T. Tripathy / International Journal of Biological Macromolecules 70 (2014) 26–36 31
3446
2922
28461622
14501017
793
9b
4000 3500 3000 2500 2000 1500 1000 500
Tra
nsm
itan
ce [
%]
Wavenumber [ cm-1 ]
enum -1
3428
2928
28531636 1024
1457800
9a
4000 3500 3000 2500 2000 1500 1000 500
Tra
nsm
itan
ce (
%)
Wavenumber (cm -1 )
33563182
2804
1670 16021427
1344
12761132
974
701
9d
3454
2930
1639 1602
14951405
1246
1140
981
9 c
4000 3500 3000 2500 2000 1500 1000 500
0.6
0.7
0.8
0.9
1.0
Tra
nsm
itan
ce [
%]
3436
29331655
1354
1024
9e
AP-g
3
lSmmd[u1
3
3
g
Wav
Fig. 9. FTIR of (a) AP-g-PDMA, (b)
.7. Flocculation study
The standard Jar test [4] technique was followed for the floccu-ation study. The standard flocculation jar apparatus supplied bycientific Engineering Corporations (New Delhi, India). Turbidityeasurements were carried out with a Digital Nephelo Turbidityeter (Model 331) supplied by EI products (Haryana, India). The
etailed flocculation procedure was given in our previous article27]. A 1.0 wt% coal sample and 1.0 wt% of silicon dioxide weresed for flocculation study. The flocculant dose was varied from
to 12 ppm.
.8. Characterization of coal samples
The coal sample was characterized by the following techniques.
.8.1. Proximate analysis of coal sampleProximate analysis of coal sample was done as per the method
iven by the Bureau of Indian Standards (IS: 1350, 1959). For
ber [ cm ]
-PAM, (c) PDMA, (d) PAM, (e) AP.
each analysis, 1.0 g of coal sample of −72 mesh was taken. Mois-ture was determined by heating the sample in an oven at 105 ◦Cfor 1 h. Volatile matter was determined by heating the sample at925 ± 10 ◦C for 7 min. Moisture content was substracted to set thevolatile matter content of the coal. Ash was determined by heatingthe sample at 850 ± 10 ◦C for 1 h. The results are shown in Table 3.
3.8.2. Measurement of zeta potentialZeta potential was measured by particle microelectrophoresis
(Apparatus mark 11) made in England. The results are shown inTable 3.
4. Results and discussion
4.1. Effect of reaction variables
4.1.1. Effect of the concentration of substrate (AP)Fig. 1 shows that the %G increases with increasing the concen-
tration of polysaccharide and it reaches maximum at 1.5 g. Beyond

32 H. Kolya, T. Tripathy / International Journal of Biological Macromolecules 70 (2014) 26–36
Fig. 10. (a) 1H NMR of AP-g-PDMA, (b) 13C NMR AP-g-PDMA, (c) 1H NMR AP-g-PAM, (d) 13C NMR AP-g-PAM.
Table 3Characteristics of coal sample.
Name Source Coal type NaturalpH
% Moisture % Ash % Volatilematter
% Fe Zetapotential
Khujucoal S-Seam Bokaro CollieryBokaro Coal fieldJharkhand, India
Prime cocking 6.5 0.5 34.6 18 99.2 −9.4
100 200 300 400 500 600 700
0
20
40
60
80
100
Mas
s [%
]
Temperature [0C]
Ap AP-g-PAM AP-g-PDMA
Fig. 11. TGA curve of AP-g-PAM and AP-g-PDMA.
1.5 g it decreases steadily for both the reactions with AM and DMA.This behavior is explained by the availability of more grafting sitesfor initiation of graft copolymerization at high concentration of thesubstrate (from 0.5 to 1.5 g AP). Further increase in the substrateconcentration increases viscosity of the aqueous solution whichrestricts the movements of macroradicals [28] leading to decreased%G.
4.1.2. Effect of the monomer concentrationEffect of the monomer concentration on the grafting process
is shown in Fig. 2, which shows that %G increases initially withincrease in monomer concentration up to 0.107 mol/L, beyond that%G decreases. The initial increment of %G is due to the greater avail-ability of monomer in the vicinity of polysaccharide macroradicals.
However the decrease in grafting at later stage is attributed in theformation of large amounts of homopolymer. When polymeriza-tion precedes the viscosity of the reaction medium increases bothby graft copolymerization and homopolymerization processes. In
H. Kolya, T. Tripathy / International Journal of Bi
Fig. 12. SEM pictures (a) AP, (b) AP-g-PAM, (c) AP-g-PDMA.
0 200 400 600 800 10000.0
0.2
0.4
0.6
O.D
APAP-g-PAMAP-g-PDMA
pior
4
aCiwbca
Concentration [ppm]
Fig. 13. Enzymatic hydrolysis of grafted copolymer and amylopectin.
resence of excess monomer the rate of homopolymerizationncreases and the homopolymer molecules then hinder the ratef diffusion of monomer molecules to the polysaccharide macro-adicals resulting in the lowering of %G.
.1.3. Effect of initiator (CAN) concentrationThe effect of variation in CAN concentration on %G of PDMA
nd PAM is shown in Fig. 3. It is obvious that with increasingAN concentration from 1.5 × 10⁻⁴ to 4.8 × 10⁻⁴ mol/L, the %G
ncreases steadily after that it decreases. The initial increment of %G
ith increasing CAN concentration is due to the increase in num-er of free radicals into the amylopectin backbone. But at higheroncentration of CAN (>4.8 × 10⁻⁴ mol/L) may be due to the nonvailability of the sites on the polysaccharide backbone to which
ological Macromolecules 70 (2014) 26–36 33
CAN can react to generate more free radicals and the increment ofthe homopolymerization process by unutilized CAN.
4.1.4. Effect of the reaction timeFig. 4 shows the effect of reaction time on the grafting. It is obvi-
ous from the figure that %G increases with increasing time up to5 h after that it levels off. The leveling off can be explained by thedepletion in monomer and initiator, as well as the shortage of avail-able grafting sites at the polysaccharide backbone as the reactionproceeds [29].
4.1.5. Effect of the reaction temperatureFrom Fig. 5 it can be accomplished that %G increases with
increasing temperature from 25 ◦C to 35 ◦C but decreases beyond35 ◦C. The increase in %G up to 35 ◦C is owing to the rate of diffu-sion of monomer molecules to the polysaccharide macroradicals.When the temperature is further raised, the %G decreases due to theincrease rate of homopolymerization. Higher temperature (>35 ◦C)enhances the oxidation of free radicals for which the growingpolysaccharide macroradicals was terminated which favors morehomopolymer formation.
5. Characterization
5.1. Determination of molecular weight and molecular weightdistribution using size exclusion chromatography (SEC)
From Figs. 6–8 it is obvious that the two graft copolymers havehigher molecular weight than AP. This is because of the presence ofPAM and PDMA chains onto the AP backbone. Again PDMA graftedAP have higher molecular weight than the PAM grafted AP. Thisis because of the presence of two extra methyl groups in amidefunctionality of PDMA. The average molecular weights of AP, AP-g-PAM and AP-g-PDMA are given in Table 2.
5.2. FTIR spectroscopy
The IR spectra of AP-g-PDMA, AP-g-PAM and AP are shown inFig. 9a, b and e respectively. The IR spectra of PDMA and PAM aregiven in Fig. 9c and d respectively. The graft copolymer AP-g-PDMA(Fig. 9a) shows characteristic absorptions on 1636 cm−1 for amide
C O , 1457 cm−1 for the ‘C–N’ group and 3436 cm−1 for the –OH
groups of AP which are present in PDMA at 1639 cm−1 (for amide
C O ) 1495 cm−1 (for ‘C–N’ groups). Since the PDMA was removed
completely, the presence of peaks at 3436 cm−1, 1636 cm−1 and1457 cm−1 in the graft copolymer is strong evidence for graftingof the PDMA chains onto the AP. For AP-g-PAM the characteristic
absorption (Fig. 9b) was found at 1653 cm−1 for amide C O group,
1457 cm−1 for ‘C–N’ group of the amide functionality, which is alsopresent in PAM at 1670 cm−1 and 1427 cm−1, indicating grafting ofPAM onto the AP backbone.
5.3. NMR spectroscopy 1H and 13C
Fig. 10a shows the 1H NMR spectrum for the AP-g-PDMA in D2Oat 25 ◦C. The bands at 2.0–2.8 ppm are attributed to the methylproton and those observed at 1.3–1.8 ppm are due to the –CH2–
and CH protons. Fig. 10b shows a 13C NMR spectrum for AP-g-
PDMA in D2O at 25 ◦C. The characteristic peak for PDMA moieties

3 l of Biological Macromolecules 70 (2014) 26–36
iaa
p
a
t
H
3
d
5
FotTdnizgatiPab
5
atdhPpa
5h
cdrpg
5
tafsPr
0 2 4 6 8 10 1210
15
20
25
30
35
40
45
50
Supe
rnat
ant
turb
idit
y [N
TU
]
Flocculant dose [ppm]
AP-g-PAM AP-g-PDMA
Blank NTU 150pH 7.5
Fig. 14. Comparison of flocculation characteristics of AP-g-PAM and AP-g-PDMA in1.0 wt% coal suspension.
0 2 4 6 8 10 120
10
20
30
40
50
Supe
rnat
ant
turb
idit
y [N
TU
]
Flocculant dose [ppm]
PAM PDMA
Blank NTU 150pH 7.5
Fig. 15. Comparison of flocculation characteristics of PAM and PDMA in 1.0 wt% coalsuspension.
0 2 4 6 8 10 1210
20
30
40
50
60
Supe
rnat
ant
turb
idit
y [N
TU
]
Flocculant dose [ppm]
AP-g-PDMA Magnafl oc 1 011 Perco l 181 Telf loc 2 230
Blank NTU 150pH 7.5
4 H. Kolya, T. Tripathy / International Journa
s observed at 35 ppm, which is due to the CH3– group. The peakst 60–75 ppm are due to the carbon for AP back bone and the peakppears at 180 ppm is due to the carbon of the amide functionality.
In Fig. 10c the 1H NMR spectrum of AP-g-PAM is shown. Theeaks observed at 2.3–3.0 ppm are due to the NH2 group. The peak
t 1.2 ppm is due to the–CH2– proton and at 1.7 ppm is due to CH
he proton. 13C NMR spectrum of AP-g-PAM is shown in Fig. 10d.
ere the peak at 176 ppm is due to the C O group of amide, at
0–40 ppm is due the –CH2– and CH carbon and 60–80 ppm is
ue to the carbon for the AP back bone.
.4. Thermal analysis (TGA)
The TGA curves of AP, AP-g-PAM and AP-g-PDMA are shown inig. 11. In the graft copolymer AP-g-PDMA, four distinct zones arebserved where the weight is being lost. The initial weight loss ofhe polymer may be due to the presence of moisture in the sample.he weight loss at ∼220 ◦C is due to the elimination of water by theegradation of polysaccharide backbones. Decarbonylation (elimi-ation of CO) occurs at ∼340–350 ◦C. The decomposition at ∼440 ◦C
s due to the loss of Me2NH group from the PDMA chains. In the lastone the weight loss might be due to the loss of abundant hydroxylroups in the polysaccharide in the form of water [8]. Similar resultsre also obtained from the TGA curves of AP-g-PAM. Four degrada-ion zones are observed in the graft copolymers. The weight lossn the third zone at ∼420–430 ◦C is due to the loss of NH3 fromAM chains. From the TG analysis it can be concluded that PDMAnd PAM chains are successfully grafted onto the polysaccharideackbones.
.5. Scanning electron microscopy (SEM) analysis
Fig. 12a, b and c shows the scanning electron micrographs of APnd the two graft copolymers AP-g-PAM and AP-g-PDMA respec-ively. A careful examination of the micrographs reveals a largeifference in the morphological appearance of the polymers. APas a granular structure which changed drastically when PAM andDMA chains were grafted into amylopectin. This observation sup-orts the grafting of acrylamide and N,N-dimethylacrylamide ontomylopectin.
.6. Biodegradation studies of the graft copolymer using enzymeydrolysis
From Fig. 13 it is observed that the rate of hydrolysis of the graftopolymer is less than that of the amylopectin which is due to theisrupted structure of the polysaccharide (AP) owing to the graftingeaction. It is also concluded that since �-amylase cleaves the virginolysaccharide and all the graft copolymers, AP, AP-g-PAM and AP--PDMA are biodegradable.
.7. Flocculation study
The flocculation efficiency of AP-g-PDMA and AP-g-PAM wasested in 1.0 wt% coal and 1.0 wt% silica suspension. The resultsre shown in Figs. 14–19. In Figs. 14 and 17, the flocculation per-
ormance of AP-g-PDMA is compared with AP-g-PAM in coal andilica suspensions separately. Flocculation performance of PAM andDMA is compared in coal and silica suspensions in Figs. 15 and 18espectively. In Figs. 16 and 19 the flocculation performance ofFig. 16. Comparison of flocculation characteristics of AP-g-PDMA, Percol 181, Mag-nafloc 1011and Telfloc 2230 in 1.0 wt% coal suspension.
AP-g-PDMA is compared with three commercial flocculants namely
Magnafloc 1011 Telfloc 2230 and Percol 181. In the two suspensionsit is observed that AP-g-PDMA shows better performance than AP-g-PAM. This observation also supported by the fact that when onlyPDMA is compared with PAM in both the two suspensions. The
H. Kolya, T. Tripathy / International Journal of Bi
0 2 4 6 8 10 12
50
100
150
200
250Su
pern
atan
t tu
rbid
ity
[NT
U]
Flocculant dose [ppm]
AP-g-PAM AP-g-PDMA
Blank NTU 300pH 8.6
Fig. 17. Comparison of flocculation characteristics of AP-g-PAM and AP-g-PDMA in1.0 wt% silica suspension.
0 2 4 6 8 10 1250
100
150
200
Supe
rnat
ant
turb
idit
y [N
TU
]
Flocculant dose [ppm]
PAM PDMA
Blank NTU 320pH 8.6
Fig. 18. Comparison of flocculation characteristics of PAM and PDMA in 1.0 wt%silica suspension.
0 2 4 6 8 10 12
50
100
150
200
250
300
Supe
rnat
ant
turb
idit
y [N
TU
]
Flocculant dose [ ppm]
AP-g-PDMA
Magnafloc 1011
Telfloc 2230
Percol 181
Blank NTU 32 0pH 8.6
Fn
rA
tch
[[
[[[
ig. 19. Comparison of flocculation characteristics of AP-g-PDMA, Percol 181, Mag-afloc 1011and Telfloc 2230 in 1.0 wt% silica suspension.
eason for the better flocculation performance of AP-g-PDMA overP-g-PAM is as follows.
For neutral flocculants, the major mechanism of flocculation ishe polymer bridging. In water medium the grafted polyacrylamidehains are stiffen and helical [30] due to the strong intramolecularydrogen bonding. Because of the coil and stiffen PAM chains the
[
[
ological Macromolecules 70 (2014) 26–36 35
approachability of the grafted PAM chains to the colloidal particlesto bind them becomes less. The intramolecular hydrogen bonding isnot possible in PDMA chains, for which the flexibility of the graftedPDMA chains also increases. Due to increase in flexibility of the dan-gling grafted PDMA chains approachability of the grafted chains tothe contaminant particles also increases, resulting easy and intensebridging. Hence, for PDMA grafted polysaccharides bridging will bebetter than that PAM grafted polysaccharides [31]. This is furthersupported by the better flocculation performance of PDMA overPAM when compared in the two suspensions.
The commercial flocculants are polyacrylamide based linearpolymer. The linear polymers get coiled in the suspension, so theirapproachability to form bridges with the colloid particles becomesless than the graft copolymers. The graft copolymer have comb likestructure in which the grafted chains are dangled from the rigidpolysaccharide backbone. As a result of which the grafted chainshave better approachability to the colloidal particles over the lin-ear polymers and can easily bind the colloidal particles throughbridging to form flocs. Hence, for graft copolymers bridging will bebetter and intense than that of linear polymers, which explains thebetter flocculation performance of AP-g-PDMA over commercialflocculants.
6. Conclusion
From the above investigations, following conclusions can bemade. Poly(N,N-dimethylacrylamide) and polyacrylamide chainsare successfully grafted onto the amylopectin backbone by cericion induced redox polymerization technique in aqueous solution.The study of IR spectra of the graft copolymers after extrac-tion of the homopolymer provided strong proof of grafting. Themaximum grafting occurs at, substrate 1.5 g, monomer concentra-tion (DMA and AM) 0.107 mol/L, initiator (CAN) 4.8 × 10⁻⁴ mol/L,reaction time 5 h and reaction temperature in both two casesis 35 ◦C. 1H and 13C NMR spectra also support the formationof the graft copolymers. TGA results showed different thermaldecomposition patterns for the virgin polysaccharide and the graftcopolymers. Scanning electron microscopy also proof the graft-ing of acrylamide and N,N-dimethylacrylamide onto amylopectin.The flocculation efficiency of AP-g-PDMA is better than AP-g-PAM.AP-g-PDMA showed better performance than some commercialflocculants.
References
[1] G.R. Rose, M.R. St. John, Flocculation in Encyclopedia of Polymer Science andEngineering, vol. 7, John Wiley & Sons, New York, 1987, pp. 211.
[2] H.E. Hudson, J. Am. Water Works Assoc. 49 (1957) 242–250.[3] F. Halverson, H.P. Panzer, Encyclopedia of Chemical Technology, vol. 10, 3rd
ed., Wiley-Interscience, New York, 1980.[4] J. Bratby, Flocculation and Coagulation, Uplands Press, Croydon, UK, 1980
(Chapter 8).[5] J. Gregory, in: Th.F. Tadros (Ed.), The Effect of Polymers on Dispersion Properties,
Academic Press, London, 1987 (Chapter 8).[6] R.P. Singh, B.R. Nayek, D.R. Biswal, T. Tripathy, K. Banik, Mater. Res. Innovat. 7
(2003) 331–340.[7] R.P. Singh, S. Pal, S. Krishnamurthy, P. Adhikary, S.K. Ali, Pure Appl. Chem. 81
(2009) 525–547.[8] T. Tripathy, R.P. Singh, J. Appl. Polym. Sci. 81 (2001) 3296–3308.[9] T. Tripathy, S.R. Pandey, N.C. Karmakar, R.P. Bhagat, R.P. Singh, Eur. Polym. J. 35
(1999) 2057–2072.10] S.K. Rath, R.P. Singh, J Appl. Polym. Sci. 66 (1997) 1721–1729.11] G.P. Karmakar, R.P. Singh, Colloid Surf. A: Physchem. Eng. Asp. 113 (1998)
119–124.12] T. Tripathy, N.C. Karmakar, R.P. Singh, Int. J. Polym. Mater. 46 (2000) 81–93.13] S. Pal, D. Mal, R.P. Singh, J. Appl. Polym. Sci. 105 (2007) 3240–3245.14] T. Wunderlich, M. Stelter, T. Tripathy, B.R. Nayak, G. Brenn, A.L. Yarin, R.P. Singh,
J. Appl. Polym. Sci. 77 (2000) 3200–3209.15] R.P. Singh, Advanced Turbulent Drag Reducing and Flocculating Materials Based
on Polysaccharides, vol. 227, Plenum Press, New York, 1995.16] R.P. Singh, G.P. Karmakar, S.K. Rath, N.C. Karmakar, T. Tripathy, S.R. Pandey, K.
Kannan, S.K. Jain, N.T. Lan, Polym. Eng. Sci. 40 (2000) 46–60.

3 l of Bi
[
[
[
[[[[
[
[[
[
6 H. Kolya, T. Tripathy / International Journa
17] K. Kataoka, H. Miyazaki, T. Okano, Y. Sakurai, Macromolecules 27 (1994)1061–1062.
18] C.L. McCormick, G.S. Chen, J. Polym. Sci. Part A: Polym. Chem. 22 (1984)3633–3647.
19] R.L. Shriner, C.K.F. Hermann, T.C. Morrill, D.Y. Curtin, R.C. Fuson, The SystematicIdentification of Organic Compounds, John Wiley & Sons, Inc., New York, 2004,
pp. 119.20] J. Tripathy, D.K. Mishra, M. Yadav, K. Behari, Carbohydr. Polym 79 (2010) 40–46.21] D.K. Mishra, J. Tripathy, K. Behari, Carbohydr. Polym. 71 (2008) 524–534.22] G. Mino, S. Kaizerman, J. Polym. Sci. 31 (1958) 242–243.23] L- F. Yan, W. Tao, J. Biomed. Sci. Eng. 1 (2008) 37–43.
[[
[[
ological Macromolecules 70 (2014) 26–36
24] G.F. Fanta, in: R.J. Cresa (Ed.), Block and Graft Copolymerization, Wiley-InterScience, New York, NY/London, 1973, pp. 1–27.
25] A. Bijttebier, H. Goesaert, J.A. Delcour, Biologia 63 (2008) 989–999.26] R. Gupta, P. Gigras, H. Mohapatra, V.K. Goswami, B. Chauhan, Process. Biochem.
38 (2003) 1599–1616.27] H. Kolya, T. Tripathy, Eur. Polym. J. 49 (2013) 4265–4275.
28] A. Berlin, V.N. Kislenco, Prog. Polym. Sci. 17 (1992) 765–825.29] P.D. Pandya, N.K. Patel, V.K.r Sinha, Int. J. Polym. Mater. 52 (2003)565–571.30] W.M. Kulicke, R. Kniewske, J. Klein, Prog. Polym. Sci. 8 (1982) 373.31] H. Kolya, T. Tripathy, J. Appl. Polym. Sci. 127 (2013) 2786–2795.