Embed Size (px)
Citation preview

INTRODUCTION
42
Biochemical analysis of Acraea terpiscore: (Linnaeus, 1758)
Synonymus: Acraea violae (Fabricius)
Common name: Tawny Coster.
Introduction:
The Acraea terpiscore (Tawny Coster) is a small leathery winged butterfly
which is common in grassland and scrub habitats. It belongs to the
Nymphalidae or Brush- footed butterfly family. It has a weak fluttery flight. It
is avoided by most insect predators. This species and the Yellow Coster
(Acraea issoria) are the only two species found in India. It is a butterfly of
both hilly as well as plains. It is plentiful in the monsoon and pre-monsoon
period and becomes scarce later on.
The butterfly exudes an oily and smelly yellow liquid when handled and is
unpalatable to birds and most insects. Thus they are well protected, have a
slow and weak flight, and are frequently visiting flowers. There are no mimics
of this species, in India.
The butterfly breeds on plants of family Loganiaceae and species of
Passiflora, many of which contain toxins that are sequestered by the
caterpillars. The female butterfly deposits clusters of white eggs on the
surface of Passiflora leaves. The tiny first instar caterpillars hatch about 4-5
days later, from the eggs and start feeding on the leaves of Passiflora.
INTRODUCTION
43
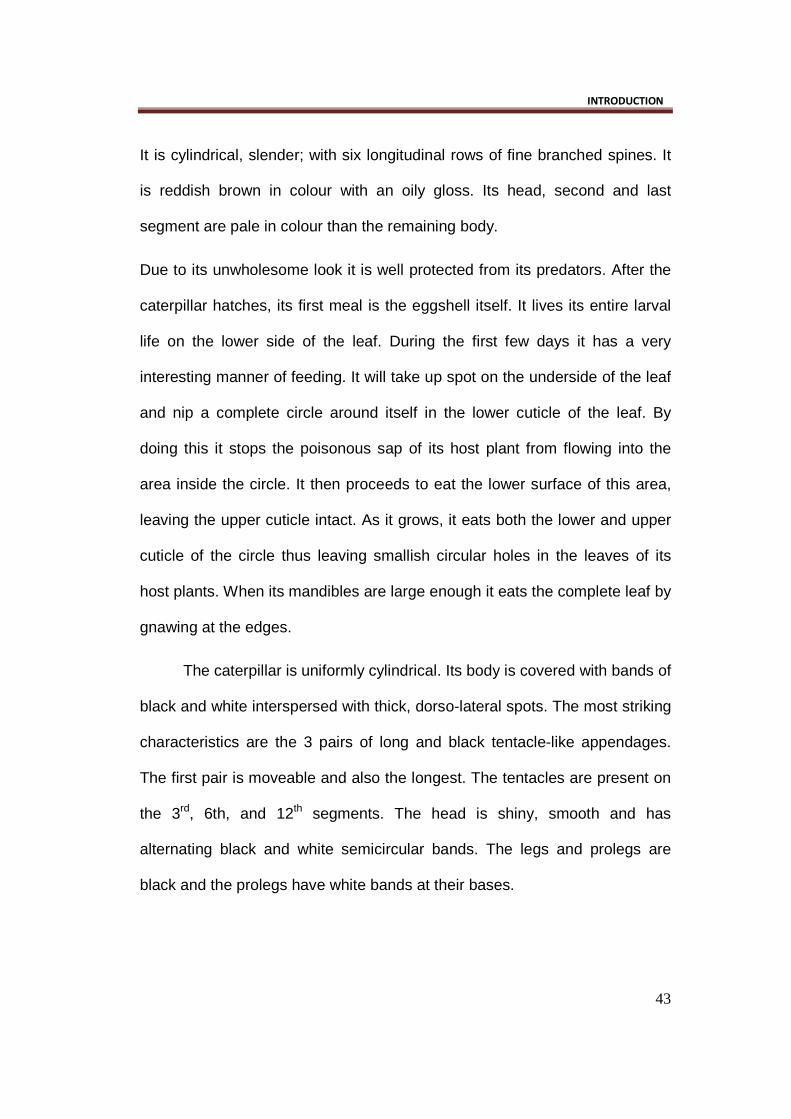
It is cylindrical, slender; with six longitudinal rows of fine branched spines. It
is reddish brown in colour with an oily gloss. Its head, second and last
segment are pale in colour than the remaining body.
Due to its unwholesome look it is well protected from its predators. After the
caterpillar hatches, its first meal is the eggshell itself. It lives its entire larval
life on the lower side of the leaf. During the first few days it has a very
interesting manner of feeding. It will take up spot on the underside of the leaf
and nip a complete circle around itself in the lower cuticle of the leaf. By
doing this it stops the poisonous sap of its host plant from flowing into the
area inside the circle. It then proceeds to eat the lower surface of this area,
leaving the upper cuticle intact. As it grows, it eats both the lower and upper
cuticle of the circle thus leaving smallish circular holes in the leaves of its
host plants. When its mandibles are large enough it eats the complete leaf by
gnawing at the edges.
The caterpillar is uniformly cylindrical. Its body is covered with bands of
black and white interspersed with thick, dorso-lateral spots. The most striking
characteristics are the 3 pairs of long and black tentacle-like appendages.
The first pair is moveable and also the longest. The tentacles are present on
the 3rd, 6th, and 12th segments. The head is shiny, smooth and has
alternating black and white semicircular bands. The legs and prolegs are
black and the prolegs have white bands at their bases.

INTRODUCTION
44
Pupa is white, long, slender, and smooth; with two lateral angles on
the thorax. It hangs perpendicularly, freely from the support. It is widest at the
7th abdominal segment where it has a double chain of extremely tiny golden
and black beads. There are tiny golden spots on the shoulders and wing-
cases.
Being a non pest on agricultural crop plants, no economical losses are
being caused by A. terpiscore, hence this species has been largely neglected
by researchers. Except the study of life cycle, no other basic information
related to biochemical, molecular or a genetical aspect is available. Hence in
the present study, biochemical analysis of different stages of A. terpiscore
during metamorphosis is done.
Materials and methods :
Rearing of butterflies:
To initiate the process of rearing, eggs and the larvae of Acraea terpiscore
were collected from Nehru Garden, Nasik. Larvae were reared under
laboratory conditions at 27°c ± 2°c temperature and 70% ± 5% relative
humidity, in the glass petri plates kept in a wooden box (20”x20” x20”) with
wire-netted sides and top.
The larvae were fed on fresh leaves of Passiflora. The completely
grown larvae, about to pupate, were sorted and placed in a separate glass
dish at room temperature. Some of these larvae were used for biochemical

INTRODUCTION
45
analysis, while others were use further reared for pupation and adult
emergence. The adults were reared out door, in natural conditions, further
allowed to mate and deposit eggs on the leaves of Passiflora. The leaves
containing the clusters of eggs were collected and kept under controlled
conditions of temperature and humidity as mentioned above. The eggs
hatched to produce first instar larvae, and the rearing was thus continued.
Haemolymph collection:
Haemolymph was drawn from the acclimatized last instar larvae, pupae and
newly emerged adults of the Acraea terpiscore.
Before the haemolymph sample was collected, the body weight (in mg), of
each stage was measured.
Haemolymph (2-4µl) was drawn by inserting the calibrated capillary in the
pseudo legs of the last instar larvae, and anterior end of the pupae. It was
exuded immediately in separate appendrof tubes, kept in an ice box, each
containing saturated 1-phenyl 2-thiourea and glutathione (G.R.Wyatt,
M.L.Pal; 1978), to prevent melanization. About 40-50 pre-pupal larvae and
20-25 pupae were sacrificed for each experiment. The haemolymph from the
0-24 hrs old adults was withdrawn by inserting the calibrated capillary in the
ocular lenses and in thoracic region. The haemolymph was stored in the
same manner as mentioned in case of larva and pupa.
INTRODUCTION
46
The collected haemolymph was then centrifuged for 15 min at 18,000 rpm to
separate haemocytes and plasma (Wyatt, and Pal, 1978; Nursel and Cevat,
2002). The cell-free haemolymph was then collected in 1ml aliquots and
stored at -40ºc till further use. Haemolymph thus obtained was used for total
protein, carbohydrate, lipid, Uric acid and trehalose estimation.
The last instar larvae were also dissected in insect saline solution to remove
the fat bodies. These fat bodies were dried, weighed, homogenized in saline
solution (1gm/1ml) and used for further biochemical estimation.
Biochemical assays:
Protein estimation by Lowry method:
The total protein content was estimated according to modified Lowry –
Protein Assay (Lowry et al, 1951), using Bovine Serum Albumin as
standard. Following reagents were prepared for this estimation.
• Alkaline copper reagent:
20gm of sodium carbonate was dissolved in 260 ml distilled water;
0.4gm cupric sulfate was dissolved in 20 ml distilled water, and 0.2
gm sodium potassium tartarate was dissolved in 20 ml distilled
water. All the three solutions were mixed to prepare the copper
reagent.

INTRODUCTION
47
• SDS Solution: 100ml of 1% solution of Sodium Dodecyl Sulfate
(SDS) was prepared by dissolving 1gm of SDS in 100 ml water.
• NaOH Solution: 1M solution of NaOH was prepared by dissolving
4gm of NaOH in100ml water.
• Lowry Reagent: 2x Lowry concentrate were prepared by mixing 3
parts of copper reagent with 1 part SDS and 1 part of 1M NaOH.
The three solutions were kept separately and mixed just before use.
• Folin Reagent: 0.2 N Folin reagents were prepared by mixing 10ml
2N Folin reagent with 90ml water.
• 30% trichloroacetic acid.
• 0.1 N NaOH.
Total protein contents were measured from the fat body of larvae, gonads of
adults and haemolymph of larvae, pupae, and adult stages of Acraea
terpiscore. The tissue protein was precipitated by adding 1 ml of 30%
trichloroacetic acid solution. The samples were then centrifuged at 3000rpm,
for 30 minutes (Roe, 1955). The precipitate was dissolved in 1ml of 0.1N
sodium hydroxide.
2µl each of, larval, pupal, and adult haemolymph protein precipitate
was taken in three separate appendrof tubes. Similarly, 2µl of larval fat body
extract was taken in two separate appendrof tubes. The volume in each tube
was raised up to 400 µl by adding distilled water. To this, 400 µl of 2x Lowry

INTRODUCTION
48
reagent was added. The tubes were incubated for 10 minutes at room
temperature. After incubation 200 µl of 0.2 N Folin reagent was added very
quickly and vortexed immediately. This mixture was incubated for 30 minutes
at room temperature. Absorbance was measured at 750nm on UV
spectrophotometer. Amount of protein was calculated from standard curve.
Each assay was done in three to five replicates. Data was further subjected
to statistical analysis.
Standard graph for determination of Total Proteins :
Protein standards were prepared from 0.25 mg/ml bovine serum albumin
(BSA). From this, aliquots of 40-400 micro liters were added to the test tubes.
Distilled water was added accordingly to make the total volume of 400 micro
liters per tube. A reference of 400 micro liters was prepared by using water.
400 micro liters of 2x Lowry reagent was added to each test tube, mixed
thoroughly and incubated at room temperature of 10 minutes. After
incubation 200 micro liters of 0.2N Folin reagent was added very quickly and
vortexed immediately. This mixture as incubated for 30 minutes at room
temperature. Absorbance was read at 750 nm. A standard curve of protein
concentration against optical density was plotted. (Fig. 1)

INTRODUCTION
49
Fig.1. Sta ndard graph for proteins
INTRODUCTION
50
Carbohydrate estimation by Modified Anthrone method :
The total haemolymph carbohydrates were measured by the modified
Anthrone method (Beck and Bibby, 1961). Following Reagents were
prepared for the estimation:
• Glucose (stock solution):10mg/100ml i.e. 0.1mg/ml
• 2% Anthrone Reagent: Prepared in ethyl acetate.
• Conc. Sulphuric acid.
• Distilled Water.
• Deprotenized reagent: 5% Trichloroacetic acid.
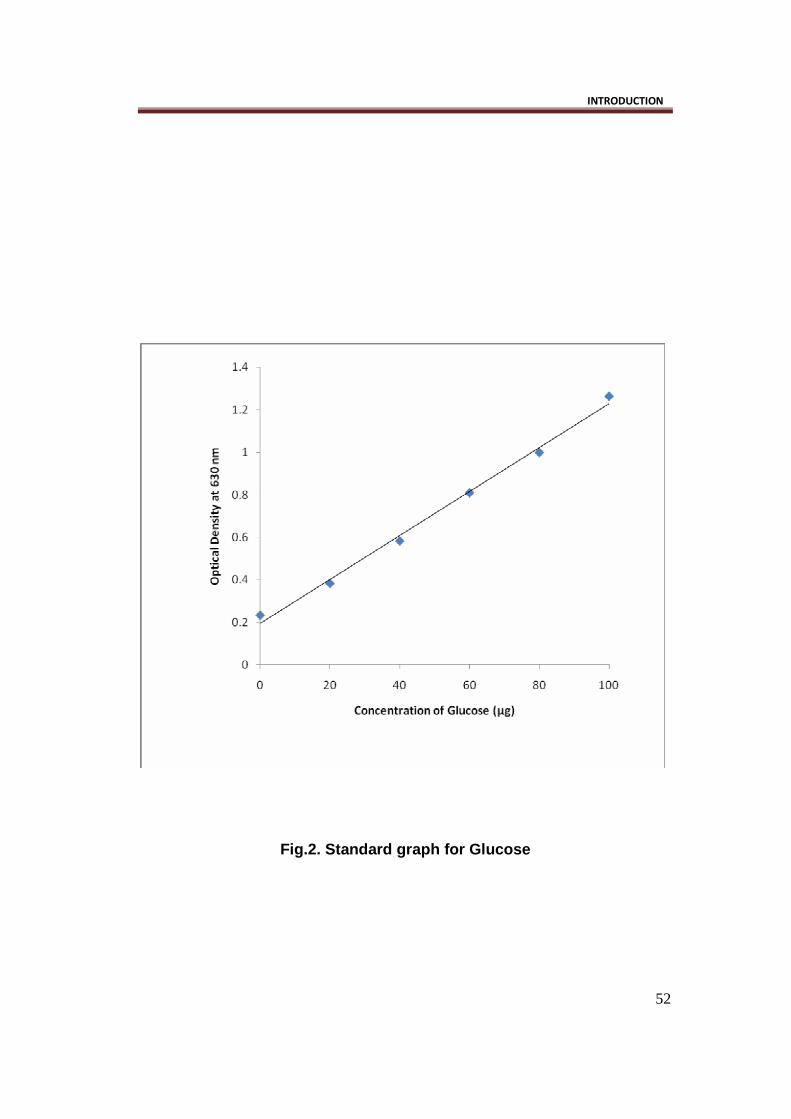
Standard graph for determination of Total Carbohydr ates:
Glucose standards were prepared from 0.1mg/ml stock solution of Glucose,
by adding 0ml (0 µg) to 2ml (200µg) to the test tubes. The volume was
raised by adding Distilled Water to make the total volume of 2ml per tube.
0.5ml Anthrone reagent was added to each tube. 5ml of conc. Sulphuric
acid was then added through the sides of the tube. The tubes were
incubated for 10 min. Further incubation was done at 100º C for10 minutes,
followed by 4º C for 5minutes, and to prevent condensation of moisture on
the optical tubes, the test tubes were kept in water at 20ºC for 5minutes.
Absorbance was read at 630nm against distilled water-reagent-sulphuric
acid blank.
INTRODUCTION
51
The haemolymph and fat body was deprotenized using 5% trichloroacetic
acid, in the proportion 1:10 (Bhattacharya and Kaliwal, 2005).The tissues
were then centrifuged at 3000rpm for 30 minutes. The protein free
supernatant was further used for total carbohydrate estimation. 2µl of
deprotenized haemolymph and fat body sample was diluted by adding
distilled water so as to make the volume in the tube 2ml. Further additions
were made as mentioned above. Absorbance was read at 630nm. Standard
curve of glucose concentration against optical density was plotted. Glucose
concentration of the sample was determined from the standard curve (Fig. 2).
The assay was done in replicates of three to five. Data obtained was
subjected to statistical analysis.
INTRODUCTION
52
Fig.2. Standard graph for Glucose

INTRODUCTION
53
Lipid estimation by Zoellner and Kirsch method:
Reagents required:
• Phospho-Vanillin reagent: (13mM vanillin and 11.8 M phosphoric acid)
0.6 gm of vanillin was dissolved in 10ml of absolute ethanol. It was
further diluted to 100ml with distilled water. This solution was mixed
with 400ml of concentrated phosphoric acid, with constant stirring. It
was stored in a dark bottle at room temperature.
• Concentrated sulphuric acid
• Cholesterol- 1gm dissolved in 100ml of absolute ethanol.
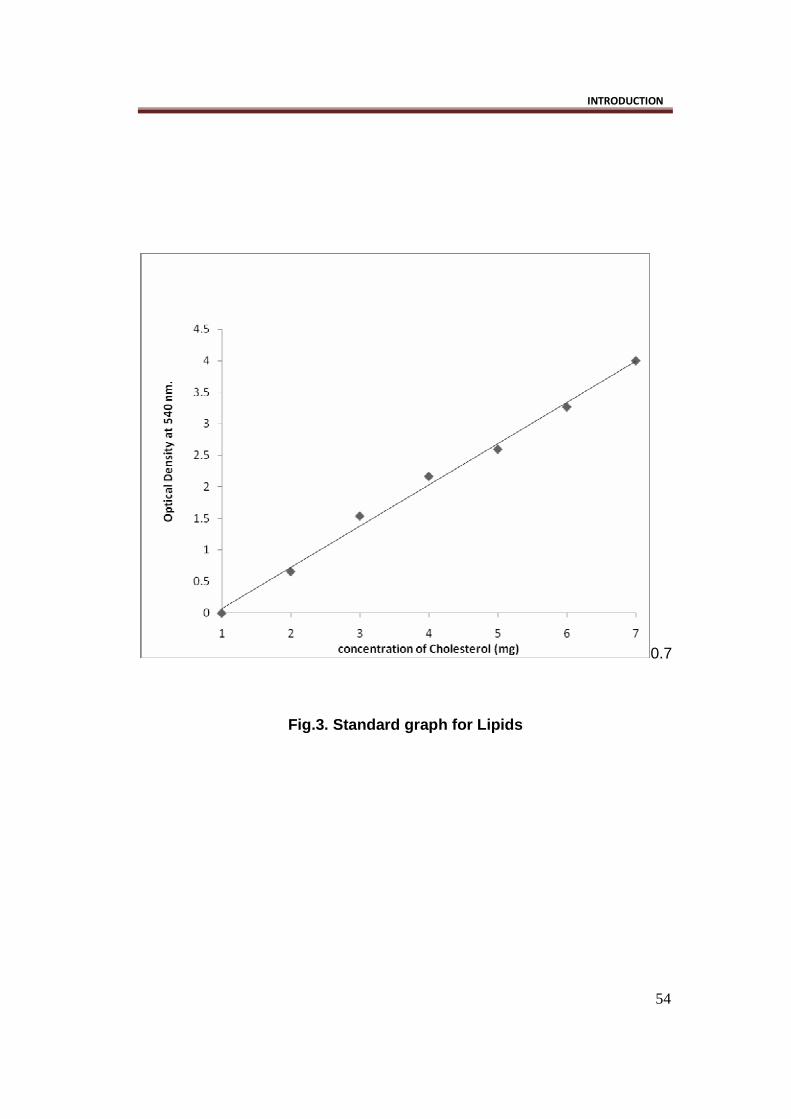
Standard graph for determination of total lipids:
Total lipid concentrations from haemolymph, were measured by using
Sulpho-Phospho-Vanillin reagent (Zoellner and Kirsch method, 1962). Lipid
standards were prepared from 1gm/100ml stock solution of cholesterol. 5ml
concentrated sulphuric acid was added to a test tube containing 0.1ml of
stock solution. The test tube was heated for 10minutes in a boiling water bath
and then cooled. Aliquots of 0.1 to ml were prepared from this solution. The
volume of each aliquot was raised up to 0.7ml with concentrated sulphuric
acid. 6ml of phospho-vanillin reagent was added to each tube. The tubes
were incubated in dark for 30 minutes. Absorbance was read at 540nm.
INTRODUCTION
54
0.7
Fig.3. Standard graph for Lipids
INTRODUCTION
55
A standard curve of cholesterol concentration against optical density was
plotted (Fig.3).
20µl of haemolymph was mixed with 200µl of concentrated sulfuric acid and
heated to 100ºc for 10 min. Samples were allowed to cool. Upon cooling,
50µl was removed and mixed with 1.25 ml of Sulpho-phospho-vanillin
reagent. After 30 minutes of incubation in dark, the optical density was
measured at 540 nm with a spectrophotometer.
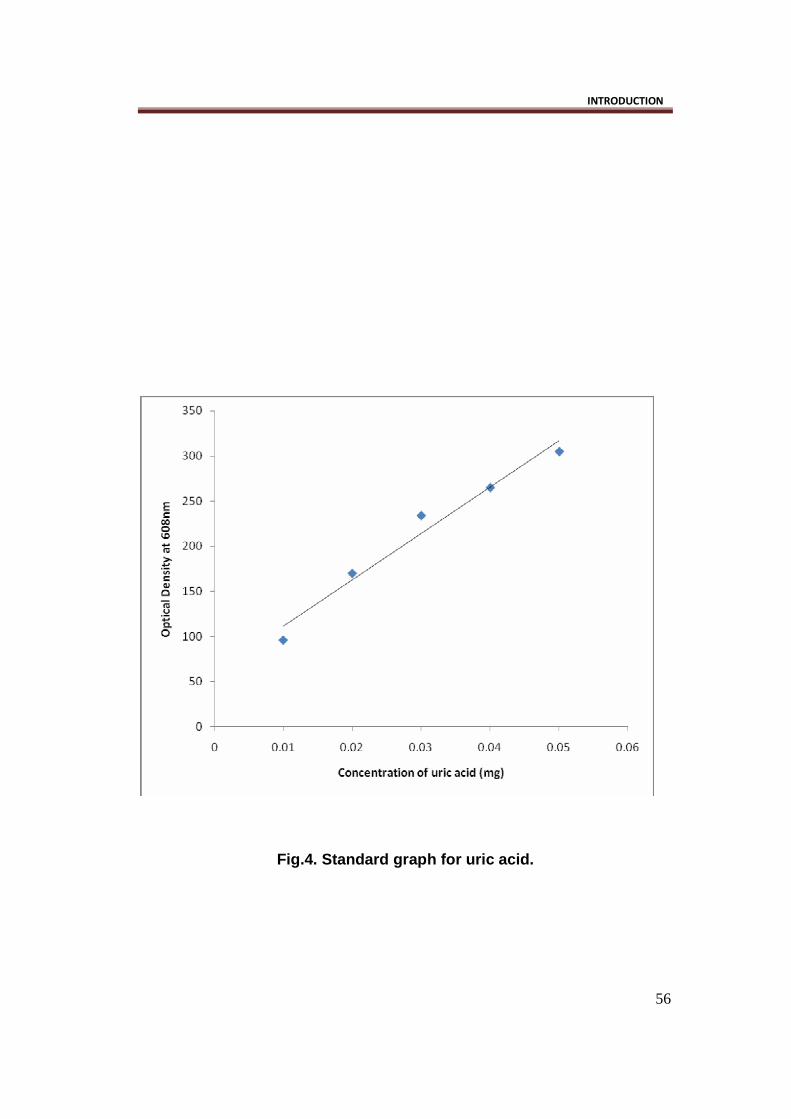
Estimation of Uric acid:
Uric acid estimation was done by enzymatic methods, using a commercial
kit, obtained from BIO ERA, a chemical Laboratory in Pune. (Fig.4)
INTRODUCTION
56
Fig.4. Standard graph for uric acid.

INTRODUCTION
57
Qualitative analysis of Proteins by SDS-PAGE:
The qualitative analysis of total soluble protein was done in haemolymph by
using the Sodium Dodecyl Sulphate-Poly Acrylamide Gel Electrophoresis
(SDS-PAGE) as described by Laemmii Nursel G.L, Cevat Ayvali; (2002)
using a 5% (w/v) acrylamide stacking gel and a 12% (w/v) acrylamide
separating gel.
Following solutions were prepared for the stacking and separating gels:
Solutions for 12% separating gel: 18x16 cm, 1.5 mm thick gel (40 ml)
• Distilled water- 15.9 ml
• 30% Acrylamide solution- 13.3ml
• 1.5M Tris (pH 8.8)- 10.0ml
• 10% SDS- 0.4ml
• 10% Ammonium per sulphate - 0.4ml (freshly prepared)
• TEMED - 0.016 ml
Solutions for 5% stacking gel -18x16 cm, 1.5 mm thick gel (8ml)
• Distilled water- 5.5ml
• 30% Acrylamide solution- 1.3ml
• 10M Tris (pH 6.8)- 1.0ml
• 10% SDS- 0.08ml
• 10% Ammonium per sulphate - 0.08 ml (freshly prepared)
INTRODUCTION
58
• TEMED- 0.008ml
Tris- glycine electrophoresis running buffer:
• 25mM Tris
• 250mM glycine (pH8.3)
• 10% SDS
A 5X stock solution of electrophoresis running buffer was prepared by
dissolving 15.1gm of Tris base and 94 gm of glycine in 900ml of distilled
water. To this, a 50 ml of 10% SDS solution was added and volume was
adjusted to 1000ml with distilled water.
1X SDS sample loading buffer: (40 ml)
• Distilled water-16ml
• 0.5M Tris (pH-6.8)- 5ml
• 50% Glycerol- 8ml
• 10% SDS- 8ml
• 2-β mercaptoethanol- 2ml (add immediately before use)
• 0.1% Bromophenol blue- 1ml
Gel Fixing Solution- 100ml
• 10% Acetic acid- 25ml

INTRODUCTION
59
• 12% trichloroacetic acid solution- 25ml
Gel staining solution:
• Coomassie Brilliant Blue R-250- 0.25 gm
• Methanol: Acetic acid stock solution- 1000ml
Mix 900ml methanol: H2O (500ml of Methanol and 400ml of H2O) and
100ml of glacial acetic acid. A staining solution was prepared was dissolving
0.25gm of Coomassie Brilliant Blue R-250 in 100ml of methanol: acetic acid
solution. The solution was filtered through Whatman No.1 filter paper to
remove the particulate matter, if any.
A vertical gel apparatus from Bangalore Genie was used. The glass plates,
spacers and the apparatus was cleaned and dried properly. Glass plates and
spacers were assembled together using bulldog clips. Then, 2% agar was
applied around the edges of the spacers to hold them in proper place and to
seal the chamber between the glass plates. 40ml of separating gel mixture
was prepared. After adding ammonium per sulphate and TEMED, the
solution was mixed gently and carefully. The solution was then poured in the
chamber between the glass plates. The gel was allowed to polymerize for 30-
45minutes. 5% stacking gel was prepared as per the above contents, and
poured above the separating gel. The comb was placed in the stacking gel
and the gel was allowed to polymerize for 30-45 minutes. The comb was

INTRODUCTION
60
then removed without distorting the shape of the wells. The gel was installed
carefully, after removing the clips and agar, in the gel electrophoresis
apparatus. The upper and lower chambers of the apparatus were filled with
1X electrophoresis running buffer.
The haemolymph proteins from larva pupa and adult were
dissolved in sample loading buffer and heated for 30 min at 60º c. This
ensured the complete interaction between proteins and SDS. The sample
solutions were cooled and a uniform quantity of protein (100µg) from
haemolymph of larvae, pupae and adult was loaded to slots of the gel. The
gel was calibrated with broad range molecular markers
A mixture of broad range Molecular weight markers such as myosin
(205,000DA), phosphorylase-b (120,000DA), β-galactosidase (116,000DA),
bovine serum albumin (84,000DA), albumin (66,000DA), ovalbumin
(45,000DA), carbonic anhydrase (29,000DA), trypsin inhibitor (20,000DA),
and lysozyme (18,000DA), were loaded in one slot to compare the molecular
weight of the proteins separated from that of the samples. Then 10-15mA
current was applied for initial 15-20 minutes i.e. until the samples travelled
through the stacking gel. The current was the raised at 30mA till the
Bromophenol blue reached the bottom of the gel (about 3hours).
INTRODUCTION
61
After electrophoresis, the gel was removed from between the glass
plates and fixed in 12% trichloroacetic acid for 30 minutes, and then in 10%
acetic acid for another 30 minutes. The gel was stained in 0.25% Coomassie
brilliant blue R-250, overnight, with uniform shaking. Proteins absorbed the
Coomassie brilliant blue dye. After appropriate staining, it was destained in a
mixture of distilled water, methanol and acetic acid (9:6:1 v/v). The dye that
was not bound to proteins was thus removed. The destainer was changed
frequently (30 minutes) particularly during initial periods, until the background
of the gel was colourless and bands could be distinctly seen. The gel was
then photographed.
Trehalose estimation by Anthrone Method :( Roe, 199 5)
Reagents required:
• 2% Sodium hydroxide – 100ml
• 0.05% Anthrone reagent prepared in 70% sulphuric acid
The estimation of trehalose from haemolymph and fat body was carried out
according to the method of Roe (1995). In each test tube, 0.1ml haemolymph
was collected and 0.5ml of 2% of sodium hydroxide was added to each test
tube. The test tubes were shaken thoroughly and then kept in boiling water
bath (100°C) for 10minutes. Later the tubes were cooled in an ice box (4°C).
Then 5ml of Anthrone reagent was added to the tubes, and they were again
kept in boiling water bath (40°C) for 15 minutes, for the development of

INTRODUCTION
62
colour. Then the tubes were cooled to room temperature. Then the colour
intensity was read on spectrophotometer at 620nm. For the reference
standard trehalose was used. Anthrone positive carbohydrate in the
haemolymph is considered as trehalose.
Total haemocyte count:
Solutions Required:
• Toisson’s solution: NaCl- 1.0gm
Na2SO4- 8.0gm
Neutral glycerine- 20ml
Methyl violet-0.025 gm
Distilled water-160ml.
For the total haemocyte count (THC), the haemolymph was directly
drawn into a Thoma white blood cell pipette up to the 0.5 mark, by pricking
the pseudolegs of larvae by sharp needle. It was diluted up to the 11 mark
with Toissons fluid (Mohmood and Yousaf, 1985). The pipette was shaken
for several minutes and the first three drops were discarded. A drop of diluted
haemolymph was then placed near the edge of the cover slip of the Neubaur
ruling hemocytometer and the chamber was automatically filled by capillary
action. The hemocytometer was left undisturbed for 5minutes, to let the
haemocytes settle down. The haemocytes were then counted in the four
corners and one control (1 mm2) ruled squares. The number of circulating

INTRODUCTION
63
hemocytes per cubic millimeter (mm3) was calculated using the following
formula of Jones (1962):
THC = Haemocytes in five 1 mm2 × Dilution × Depth factor of chamber
No. of squares counted
Where, Dilution = 20 times, No. of squares counted = 5.
Depth factor of the chamber = 10 (constant)
Differential haemocyte count:
The haemolymph was fixed by glacial acetic acid vapours for 5 - 10 min in a
small desiccator at 40oC. One of the thoracic legs of last instar larva was
pricked by needle and the exuding haemolymph was drawn in to Thoma
white blood cell diluting pipette. Similarly the haemolymph was drawn from
early pupa and adult too. A small drop of this blood from each stage was
placed on separate clean white grease free microscope slide and smear was
made by drawing second slide across the first one at 45oangle. The smear
was air dried and stained by Geimsa stain for four min. A freshly prepared
buffer solution (Na2HPO4 = 3.8 g, KH2PO4 = 5.47 g and distilled water 1 L) of
pH 6.6 was applied for 15 min to neutralize the haemocyte contents for
differential staining. Differential counting of haemocytes was under oil
immersion phase microscope (10 x 100 X). Each time 100 cells were
counted and the percentage of various classes was computed (Mahmood &
Yousaf, 1985).

INTRODUCTION
64
Results:
Results in Table 1.reveal that the levels of organic biomolecules in the
haemolymph and fat bodies of Acraea terpiscore were significantly different at
different stages of development.
Total Protein concentration in haemolymph and fat b odies:
The protein levels in haemolymph were found to be significantly lower
(1.56mg/ml) in adult stage, when compared to haemolymph protein levels of
pre pupal larvae (3.24mg/ml) and early pupae (2.20mg/ml). The protein
concentrations in fat bodies of larvae were low (1.14mg/ml) when compared
to the haemolymph protein levels of the same stage of development.
Total Carbohydrate concentration in haemolymph and fat bodies:
In Larval haemolymph, total carbohydrate levels were higher
(6.00µg/ml) than the pupal (5.20µg/ml) and adult (4.50µg/ml) haemolymph
carbohydrate levels. The total carbohydrate levels in fat bodies of larvae
(2.40µg/ml) were significantly low when compared to the haemolymph
carbohydrate levels of all the stages of development.
Trehalose concentration in haemolymph and fat bodie s:
Trehalose concentration in haemolymph of pre pupal larvae and early
pupal stage were found to be almost constant and higher (4.33µg/ml and

INTRODUCTION
65
4.00 µg/ml respectively), when compared to haemolymph trehalose levels in
0-24 hrs old adults (3.12µg/ml). On the contrary, trehalose levels in pre pupal
larval fat bodies were found to be significantly low (0.056µg/ml), when
compared to the trehalose levels of pre pupal larval haemolymph.
Total lipid concentration in haemolymph and fat bod ies:
Lipid concentration in haemolymph of all the stages of development
was found to be almost constant and lower than the lipid level in fat bodies
(0.09µg/ml), when compared with larval fat bodies.
Total lipid concentration in haemolymph and fat bodies was also found
to be least among all the organic biomolecules studied.
Uric acid concentration in haemolymph and fat bodie s:
Uric acid contents in pre pupal haemolymph (30.00µg/ml) of
A.terpiscore were more than uric acid contents of pupal haemolymph
(19.5µg/ml).While in adult haemolymph they were lowest (6.90µg/ml). In
larval fat body the uric acid contents (31.00µg/ml) were at par when
compared with the contents in pre pupal haemolymph.

INTRODUCTION
66
Table 1 : Biochemical changes in the haemolymph of larvae pupae and adult
of Acaria terpiscora
Haemolymph µg/ml Fat body µg/ml
Biomolecules Larva Pupa Adult Larva
Total Proteins
3.24 ± 0.045**
2.20 ± 0.085**
1.56 ± .071**
1.14 ± 0.5**
Total Carbohydrates
6.00 ± 0.40**
5.2 ± 0.24**
4.5 ± 0.37**
2.40 ± 0 .67**
Total Lipids
0.07 ± 0.003**
0.05 ±.0.013**
0.045± 0.12**
0.09 ± 0 .04**
Trehalose
4.33 ± 0.323**
4.0 ± 0.20**
3.12± 0.14**
0.056 ± 0.01**
Uric acid
30.00 ± 0.54*
19.5 ± 0.33**
6.90 ± 0.89**
31.00 ± 0.72*
∗∗- Significant at P< 0.05
∗N.S–Non-significant

INTRODUCTION
67
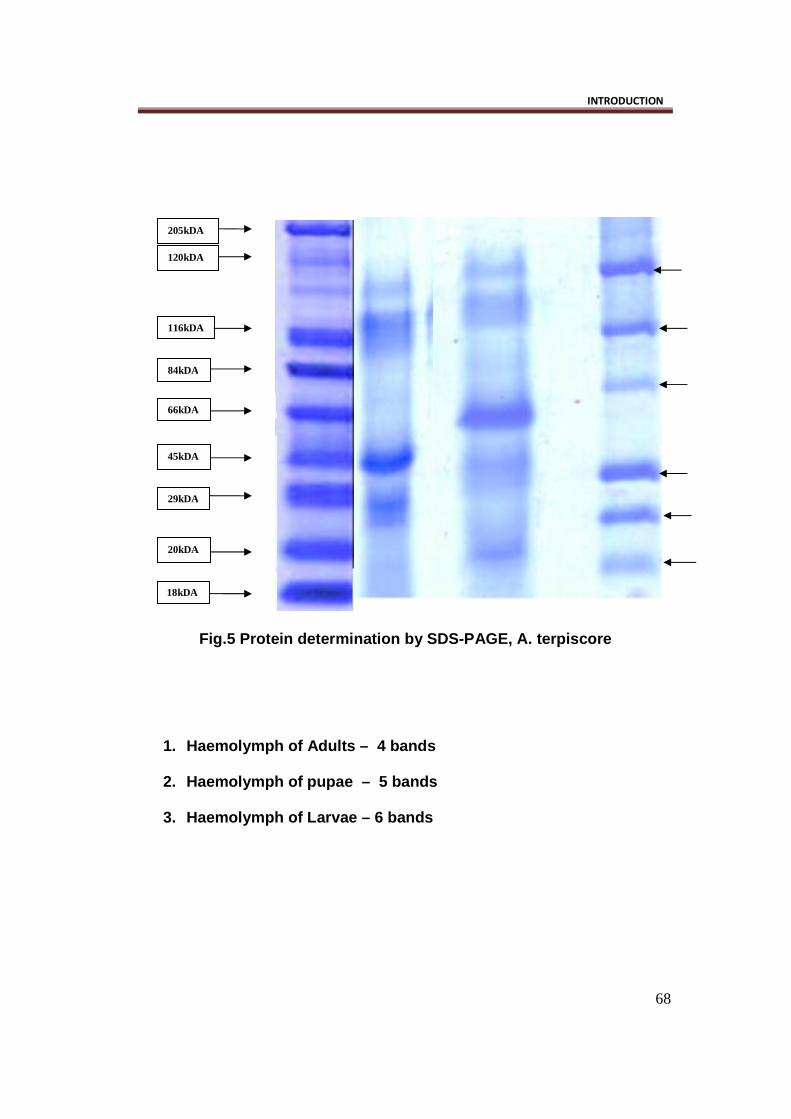
Protein estimation by SDS-PAGE : (Fig.5)
SDS PAGE result in Acraea terpiscore reflects six protein bands at larval
stage, whose molecular weight is in the range between 120kDa to 20kDa. At
pupal stage five protein bands are seen with molecular weight almost in the
same range as in larva. Where as at adult stage the number of protein bands
is reduced to four, whose molecular weight ranges from 118kDa to 29kDa.
INTRODUCTION
68
Fig.5 Protein determination by SDS-PAGE, A. terpiscore
1. Haemolymph of Adults – 4 bands
2. Haemolymph of pupae – 5 bands
3. Haemolymph of Larvae – 6 bands
120kDA
45kDA
20kDA
205kDA
66kDA
116kDA
84kDA
29kDA
18kDA

INTRODUCTION
69
Total Haemocyte count :( Table 2.)
The total haemocyte count in the fourth instar pre pupal stage was (8997.0).
It decreased in the next stage i.e. fifth instar, up to 8016.0. The decrease
continued in early pupal stage to 4567.0. It declined further in the late pupal
stage (660.0) and in adult stage (420.0).
Differential haemocyte count: (Table 3.)
Present results reveal that there are six types of haemocytes identified in
Acraea terpiscore, as are largely met in Lepidoptera (Ribeiro and Berhelin,
2006). They are the prohaemocytes (PRs), plasmatocytes (PLs),
granulocytes (GRs), spherulocytes (SPs), oenocytoids (OEs), and
adipohaemocytes (ADs).
The PRs appeared mostly small, and rounded in shape. Their percentage
was high in last instar larva (4.2%), decreased further in pupal stage (3.8%),
and adult stage (3.5%).
The PLs were pleomorphic cells, appear rounded, fusiform or spindle
shaped. They appeared large in shape with a relatively smaller nucleus.Their
population ranged from 13.1 percent (last instar) to 25.1 percent (Adult).
The GRs appeared usually rounded to ovoid in shape. They were smaller in
size than PLs but almost equal to PRs. The population of these cells was

INTRODUCTION
70
lowest in last instar stage (15.7%), increased further in pupal stage (18.7%),
and reached its peak in the adult stage (22.4%).
The SPs were also rounded to ovoid in shape. They were larger than GRs,
and had centrally located nucleus. Their population was least in last instar
stage (15.9%), steadly increased in early pupal stage (20.3%) and in adult
stage (26.6%).The surface appeared rough due to accumulation of spherules
in the cytoplasm.
The OEs were rounded, small to large cells, with a small eccentric nucleus.
The population of these cells was high in the larval stage (19.6%) but
lowered in the pupal stage (9.9%), and further in the adults (12.5%).
The Ads were rounded to ovoid in shape with centrally located nucleus. Their
population steadly decreased from 30.5% in larval stages to 25.5 % in pupal
stage and further steeply lowered in the adult stage (13.5%).

INTRODUCTION
71
Table 2. THC changes during the post embryonic deve lopment of A.
terpiscore
Instar stage
Insect no.
THC /mm3 ± SE
IV
V
Early Pupa
Late Pupa
Adult
05
05
05
05
05
8997.0 ± 80.72
8016.0 ± 65.80
4567.0 ± 322.0
660.0 ± 32.0
420.0 ± 29.8
INTRODUCTION
72
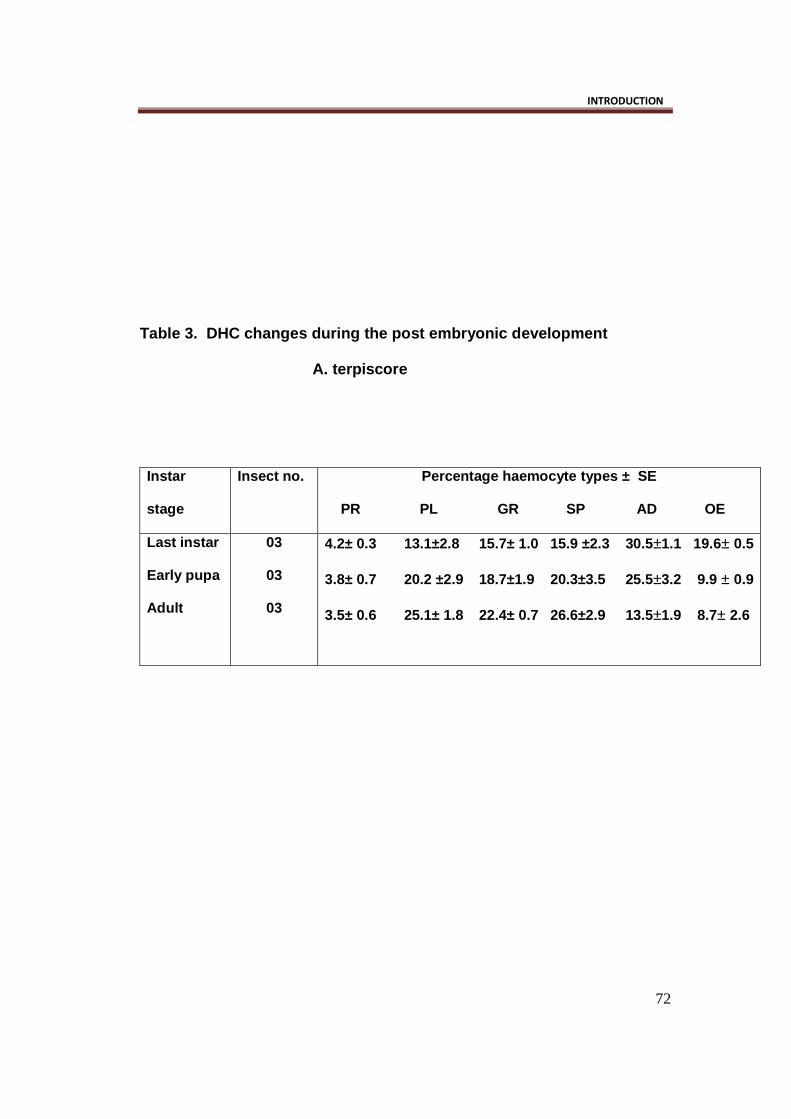
Table 3. DHC changes during the post embryonic dev elopment
A. terpiscore
Instar
stage
Insect no. Percentage haemocyte types ± SE
PR PL GR SP AD OE
Last instar
Early pupa
Adult
03
03
03
4.2± 0.3 13.1±2.8 15.7± 1.0 15.9 ±2.3 30.5±1.1 19.6± 0.5
3.8± 0.7 20.2 ±2.9 18.7±1.9 20.3±3.5 25.5±3.2 9.9 ± 0.9
3.5± 0.6 25.1± 1.8 22.4± 0.7 26.6±2.9 13.5±1.9 8.7± 2.6
INTRODUCTION
73
DISCUSSION:
The above results reveal that various changes occur in the total
protein, carbohydrate, trehalose and lipid contents in haemolymph of pre
pupal larvae, early pupae and 0-24 hrs old adults, as well as in the fat body
of the pre pupal larvae, during metamorphosis. These changes indicate that
various tissue specific changes occur at different developmental stages. In
the present investigation protein levels are higher (3.24 µg/ml) in the
haemolymph of pre pupal larvae when compared with that of haemolymph of
early pupae (2.20µg/ml) and freshly emerged adult (1.56µg/ml).
The increase in protein levels of haemolymph during larval
development was due to synthesis of new proteins by the tissues, particularly
fat bodies and their release into haemolymph. The present results agree with
the report of Martin, M.D (1990). He observed that during early stages of last
instar larvae in Calliphora stygia there was an increase in the soluble
proteins and this increase was correlated to high rate of protein synthesis by
the fat bodies.
Nagata and Kobayashi (1974) have also reported an increase in
protein synthesis during feeding stage in Bombyx mori. Hurlimann and Chen
(1969) have reported that the concentration of protein in haemolymph
increases progressively during larval development and reaches maximum in
the late fifth instar larvae but declines in the pupal stage. The results of the
present investigation also support the earlier stated report.
INTRODUCTION
74
In the present study, the SDS- PAGE results reveal that the number of
protein bands obtained at pre-pupal stage is more than those at the adult
stage. The variation in the number of protein bands and specificity of protein
bands during various stages of development could be due to the fact that the
proteins in the haemolymph vary quantitatively during development of A.
terpiscore. Fluctuations in haemolymph protein during development of
Bombyx mori have been reported earlier by Heller, 1924. Certain bands were
found to be common through in all the stages of development, while certain
bands disappeared or changed in adult stage. Disappearance of bands
indicates that either those proteins are not produced during the adult stage or
may be absorbed to maintain the amino acid concentration in the
haemolymph. This hypothesis is in agreement with the results of Beadle and
Shaw (1950) who reported the hydrolysis of proteins during the larval life of
Bombyx mori for the maintenance of amino acid concentration in the
haemolymph.
Haemolymph carbohydrate levels are also under hormonal control. It
is well known that extracts of corpora cardiaca contain hyperglycemic factors
which regulate the haemolymph carbohydrate levels. Daily fluctuations in
haemolymph sugar levels have been reported in Periplanata americana.
In the present investigation results of carbohydrate estimation of
haemolymph of A. terpiscore indicate that carbohydrate contents in

INTRODUCTION
75
haemolymph at pre pupal larvae are more (6.00µg/ml), than that in the
haemolymph of early pupae (5.20 µg/ml) and 0-24 hrs old adults (4.50µg/ml),
which is in agreement with the earlier data.
According to Wyatt G.R (1961) and Wyatt G.R, G.F. Kalf (1957),
Trehalose usually is the main sugar found in the haemolymph of many
insects. Although trehalose is absent in certain stages of several species, it
has been found in at least one stage of almost all insects studied so far
(G.N.Somero.1995). In the present investigation, trehalose was present in
the haemolymph of all studied stages.
The trehalose level in haemolymph of pre pupal larva and that of early
pupa was almost constant (4.33µg/ml and 4.00µg/ml respectively), when
compared with the trehalose level in haemolymph of adults (3.12 µg/ml). The
results indicate that more trehalose is utilized as a source of energy during
the pupal-adult transformation than larval-pupal transformation. The
trehalose level in the fat body of pre-pupal larva was drastically decreased
(0.056µg/ml) when compared with its level in haemolymph. A similar
reciprocal relationship between haemolymph trehalose and fat body
glycogen levels was reported by Ivanovic, J., M. et al. (1992), in the larvae of
Morimus funereus when exposed to high temperature i.e. 35°C.
According to Mullins, D. E., (1985), haemolymph lipid levels in insects
may fluctuate under a variety of conditions, such as muscular activity,
INTRODUCTION
76
development, starvation and disease. In the present investigation, the lipid
levels in haemolymph of prepupal larvae are more compared to the
haemolymph of early pupae and 0-24 hrs old adults. This indicates that the
lipid reserves that are stored during prepupal feeding stage are utilized
during the non-feeding pupal stage and highly active adult stage,
subsequently showing lesser lipid contents in these stages.
Insect Haemolymph contains high amount of end products of nitrogen
metabolism such uric acid, allantoin, allantoic acid, urea, and ammonia.
Being concentrated or saturated, very often, it is found in the form of crystals
in haemolymph. The uric acid was detected in the haemolymph of all the
stages of development of A.terpiscore. Its concentration was highest in the
haemolymph and fat bodies of pre-pupal stage and declined in the further
stages of development. This stage being the highly voracious stage, feeds on
the leaves of Passiflora. The high nitrogenous contents of the leaves may be
the cause of high uric acid contents in haemolymph and fat bodies of the pre-
pupal larvae.
The pattern of total haemocyte count (THC) changes during
development is very much similar to what has been reported in the earlier
literature on holometabolous insects. THC increases during the larval stages;
it attains its peak at the last instar stage, and further declines in the pupal
and adult stage. The probable reason behind this may be that the larval

INTRODUCTION
77
period is a period of active growth, during which the rate of mitosis is
elevated and also the number of haemocytes is increased as per our
observation.
Insect haemocytes are also known to have a role in intermediary
metabolism such as protein synthesis, transport of nutrients, phenol
metabolism, growth stimulation, etc. Larval period, being a period of active
growth, the rate of intermediary metabolism is higher. Therefore there is a
need of large number of haemocytes during this period of development. The
maximum THC at the prepupal may be due to the effect of ecdysone
hormone. The steep decline in the haemocyte count in the pupae of Acraea
terpiscore species, in the present investigation, agrees with the results of
earlier reports.
The results of differential haemocyte count; in Acraea terpiscore reveals that
the haemocytes can be classified into six major classes on the basis of
distinctive morphological and cytological features revealed by Light (LM) and
Phase contrast microscopy (PCM). They are the Prohaemocytes (PRs),
Plasmatocytes (PLs), Granulocytes (GRs), Spherulocytes (SPs),
Oenocytoids OEs and Adipohaemocytes (ADs). Similar results have been
reported for various lepidopteran insects (Sabri, M.A., 1995, and Jalal Jalali,
2008).
PRs are considered to be the stem cells (Arnold, 1952; Srivastava and
Richards, 1965; Lai-fook,1973 and Beeman et al., 1983) which give rise to
INTRODUCTION
78
other types of haemocytes, such as SPs and ADs (Yeager,1946;
Jones,1959), or the PLs,GRs, and SPs, ( Arnold,1970). In A.terpiscore, the
PRs remain low in number throughout the larval development except in the
first instar stage where their percentage is high (Jalal Jalali, 2008). As their
population declines during the later stages of development, the percentage of
PLs and GRs increases.This suggests that the PRs might be getting
converted into PLs and GRs.Similar reports have been reported by Arnold
and Sohi,1974; and Arnold and Hinks,1976). Present study reports are in
agreement with the above reports.
The PLs have been reported in all insect orders (Gupta, 1985a). In
A.terpiscore, PLs were pleomorphic either rounded or spindle- shaped
(without pseudopodia).
The GRs are considered to be plesiomorphic haemocytes, and are the only
haemocyte types that have been reported in all major arthropod groups and
Onychopohora (Gupta, 1985a). A phagocytic role has been assigined to
them by several authors (Crossley, 1964; Arnold, 1970; Akai and Sato, 1978,
1979). In A.terpiscore, the relative percentage of GRs increases and that of
ADs correspondingly decreases, as the developmental stage progresses
towards adults.
The SPs are easily identified by their conspicuous spherules present in the
cytoplasm.In the present study the Phase contrast microscopy gave the best
confirmatory results by revealing clearly their morphological structure.Some

INTRODUCTION
79
authors (Gupta and Sutherland, 1966; Arnold and Salkeld, 1967) consider
SPs to be derived from GRs.In A.terpiscore, as the population of both these
cell types tends to increase simultaneously, during last instar onwards, the
chances of interconversion of GRs into SPs are ruled out.
The ADs, and OEs, in A.terpiscore decrease in number in the non feeding
and adult stage, suggesting their magnificient role only during pre-pupal
stage.