Embed Size (px)
Citation preview

Biochar Field trial results in Norway - 2011
1Adam O’Toole, Daniel P. Rasse, 2Bjørn Lilleeng1Bioforsk Soil and Environment, Ås, Norway. 2 Norsk Landbruksrådgiving Gudbrandsdalen
Støttet av:

Field trials in Norway - 2011
Sel
Ås
Notodden

Introduction• Carbonizing biomass renders plant-C more resistant
to biological breakdown – a feature making it attractive for increasing soil C stocks.

Ås – Can biochar be used for carbon storage?

• Biochar is a novel solution for increasing Soil C and reducing atomospheric CO2
…provided that it:
• It is in fact stable, and leads to an overall increase in soil-C
• Does not pose a risk to food production and soil health

To estimate the stability of biochar-C and effects of biochar on native soil-C under field conditions
Purpose of study

Methods
• C Stability: Measuringthe δ13C signature and CO2 efflux of a C3 soil after additons of Miscanthus (C4 plant) derived biochar
C4 plants: ~ -15‰
C3 SOM: ~ -30‰
OatsMiscanthus
δ13C

Methods• Equipment: Closed static
chambers, Infrared gas analyzer (IRGA) for CO2
efflux and Piccaro G1101-i for δ13C measurements)
• Keeling plot method used to isolate soil respired CO2 in chamber measurements.

Biochar and Soil description
• Feedstock: Miscanthus giganteus (Elephant Grass)
• Produced by Pyreg Gmbh (Germany)Pyroysis temperature 650-750 °C
• Fixed C = 70% VM= 7% Ash= 23%• Total N: 2.5 g kg-1• Total P: 1.3 g kg-1• Total K:4.8 g kg-1• pH: 10• BET: 349 m2 g-1
• Soil: Inceptisol, Sandy Clay Loam, TOC: 2.5 %

Field Trial
• 2010-2013• Biochar inverse
ploughed in the fall of 2010
• 2011 crop: Oats• 2012 crop: Barley

Experimental Design
16 plots - 4 treatments x 4 reps
1. Miscanthus Biochar 8 t C ha-1
2. Miscanthus residue 8t C ha-1
3. Control – no amendments4. Miscanthus Biochar 25 t C
ha-1
• Randomized block design

Results
0,000
0,100
0,200
0,300
0,400
0,500
0,600
0,700
0,800
17.05.2011 06.06.2011 26.06.2011 16.07.2011 05.08.2011 25.08.2011 14.09.2011
g C
O2 m
-2h-
1
Soil respiration 2011
Miscanthus 8t C ha-1
Control
Biochar 8t C ha-1
Biochar 25t C ha-1
Average for season
0.33C0.32MC80.31BC80.29BC25

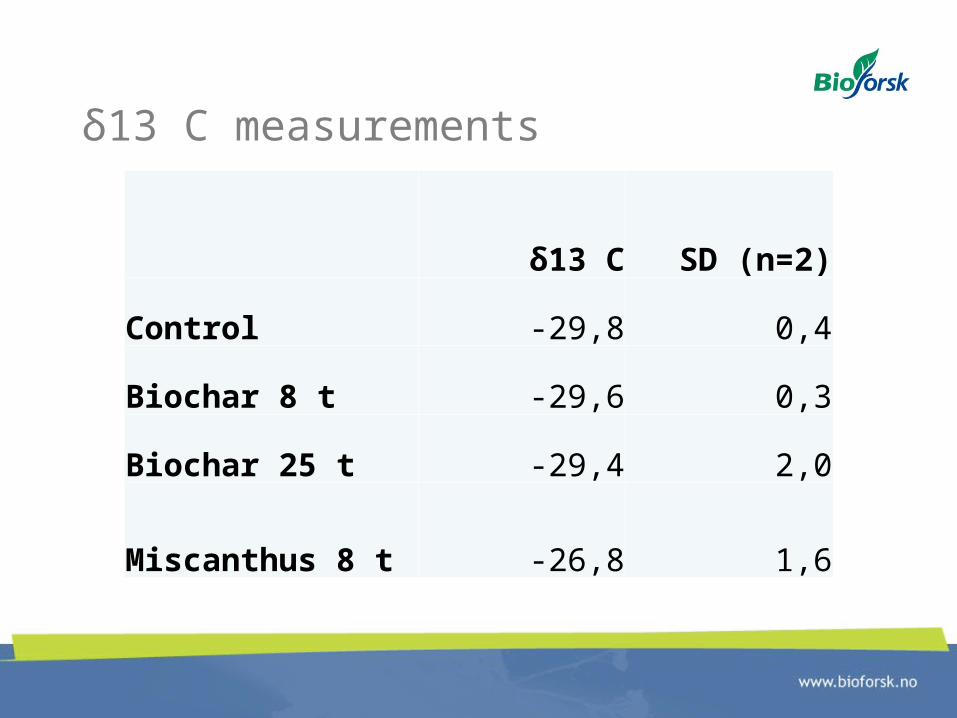
δ13 C measurements
δ13 C SD (n=2)
Control -29,8 0,4
Biochar 8 t -29,6 0,3
Biochar 25 t -29,4 2,0
Miscanthus 8 t -26,8 1,6

Contribution of C4 derived C to soil-C loss

No significant diff. Between treatments
Control MC8 BC8 BC25
Kg
daa
-1
0
100
200
300
400
500
600
700+6%
-5%
Oat grain yield (kg per dekar)

4,03,5
3,8 4,0
0,00,51,01,52,02,53,03,54,04,5
Control MC 8 t C ha-1 BC 8t C ha-1 BC 25 t C ha-1
Straw yield DM (kg plot-1)
No significant diff. Between treatments

What can we conclude so far on soil and plant effects?

Heavy metal content
Biochar was well under the legal limits set for soil amendments in Norway

Conclusion
Preliminary first year results•Appeared relatively stabil and did not prime native C•Did not lead to decreased plant and grain yields •More years are required to establish a trend

Interreg: Climate Saving Soils project
Field Trial: Simmenstad Farm, Sel. Norway 2011-12

Experimental Design16 plots - 4 treatments x 4 reps Fertilizer
1. Biochar 2t daa-1 10 kg N daa-1
2. Sludge 2t daa-1 6 kg N daa-
1
3. Biochar 2t + sludge 2t daa-1 6 kg N daa-
1
4. Control – no amendments 10 kg N daa-1
• Randomized block design


A poor year for grain in Norway
Photo: Karl Erik Berge (Nationen

Flood in Gudbrandsdalen, June 2011
110 mm in one week (normal 50 mm/mth)441mm from June 01 – Sept 29 (normal 228 mm)

Soil erosion from the flood


The field in July – flood effects

Soil water and temperature effects

Plant and grain yields

Barley grain yield Sel 2011

Yield as compared to 5 year average barley yield (kg daa-1)


Thanks for your attention
Our website: www.bioforsk.no/biochar
Acknowledgements-Svend Pung – SKP, UMB-Toril Trædal (UMB)-Bjørn Lilleeng (NLR) Gudbrandsdalen-Kåre Simmenstad (farmer)-Christophe Moni, Farshad Tami and Robert Barneveld
Funding: Matprogrammet, Norwegian Research Council. Interreg IV NSR program and SLF