Embed Size (px)
Citation preview
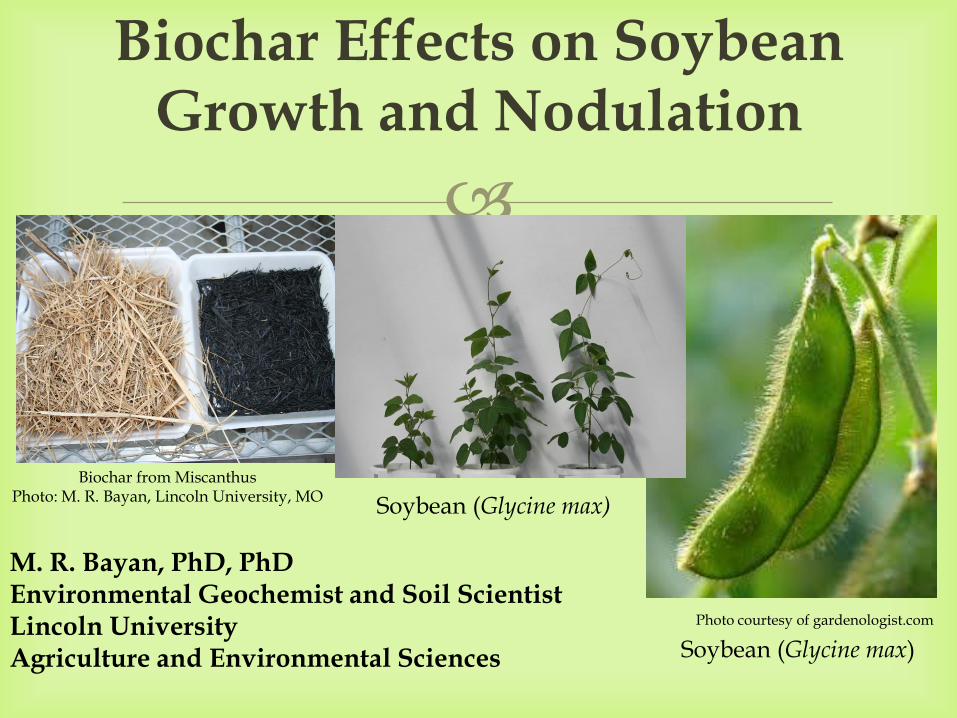
Biochar Effects on Soybean Growth and Nodulation
Photo courtesy of gardenologist.com
Soybean (Glycine max)
M. R. Bayan, PhD, PhD Environmental Geochemist and Soil Scientist Lincoln University Agriculture and Environmental Sciences
Biochar from Miscanthus Photo: M. R. Bayan, Lincoln University, MO Soybean (Glycine max)

Although biochar has roots that extend far into the past, it is still a poorly known product
The technology that is used to produce biochar
started in antiquity but pyrolysis is little known to researchers and the public
Forward

Knowledge about how and why biochar works is being generated at an accelerating rate. However, little is known about practical aspects of working with biochar on farms and in gardens.
As biochar becomes more widely known and used, it will become possible to formulate best management practices for different biochar use types.
Forward

“The application of biochar to agricultural soils has the potential to greatly improve soil physical, chemical and biological conditions.”
DeLuca and others (2009): Biochar Effects on Soil Nutrient Transformation in “Biochar for Environmental Management.” Editors: J. Lehmann and S. Joseph
“Other promoted benefits of biochar application to soil include increased plant productivity and reduced nutrient leaching. However, the effects of biochar are variable and it remains unclear if recent enthusiasm can be justified.”
Biederman and Harpole (2012): Biochar and its effects on plant productivity and nutrient cycling: a meta-analysis. Global Change Biology Bioenergy.
Effect of Biochar on Plant Growth

The biochar treatments were found to increase the final
biomass, root biomass, plant height and number of leaves in all the cropping cycles in comparison to no biochar treatments
Carter and others (2013): The Impact of Biochar Application on Soil Properties and Plant Growth of Pot Grown Lettuce (Lactuca sativa) and Cabbage (Brassica chinensis). Agronomy 2013, 3(2), 404-418; doi:10.3390/agronomy3020404
Many of the short-term effects of biochar on plant growth and soil behavior reported from laboratory studies were not observed in the field emphasizing the need for long term field trials to help inform agronomic management decisions involving biochar
Jones and others (2012): Biochar-mediated changes in soil quality and plant growth in a three year field trial. http://www.lunduniversity.lu.se/o.o.i.s?id=12683&postid=2409838
From the Literature: Effect of Biochar on
Plant Growth…

1. Soybean (Glycine max, Elgin 87) growth in the presence of
biochar 1. Leaves 2. Stems 3. Pods 4. Plant height 5. Root length 6. Root weight
2. Nodule development on soybean roots (rhizobia/plant symbiosis) 1. Number of nodules 2. Weight of nodules
Objectives: Effect of Biochar Types/Rates on Soybean Growth and Nodulation

Treatments were as follows:
No Biochar – No Soybean (Glycine max)
No Biochar – Soybean
2% Miscanthus Biochar (wt) – Soybean
5% Miscanthus Biochar (wt) – Soybean
2% Pine Biochar (wt) – Soybean
5% Pine Biochar (wt) - Soybean
All treatments were triplicated
Greenhouse Experiment: Treatments
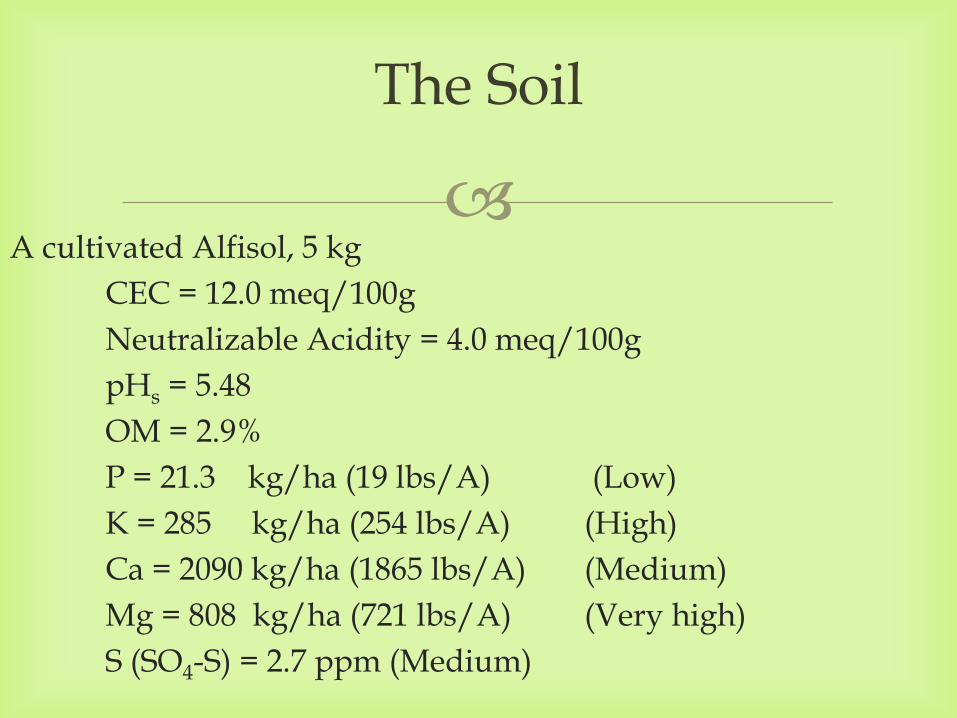
A cultivated Alfisol, 5 kg
CEC = 12.0 meq/100g
Neutralizable Acidity = 4.0 meq/100g
pHs = 5.48
OM = 2.9%
P = 21.3 kg/ha (19 lbs/A) (Low)
K = 285 kg/ha (254 lbs/A) (High)
Ca = 2090 kg/ha (1865 lbs/A) (Medium)
Mg = 808 kg/ha (721 lbs/A) (Very high)
S (SO4-S) = 2.7 ppm (Medium)
The Soil

Greenhouse Experiment
Soil samples were taken from each pot after 1-day, 3-day, 10-day, 30-day and 60- day intervals All pots were treated with 75 kg P per hectare. Additional data from a similar experiment with switchgrass will be used here for comparison.
Experiment duration: 60 days

1. Fast: Moderate Temp ~500˚ C. Short vapor residence time ~ 1
sec; Liquid (75%); Char (12%); Gas (13%)
2. Moderate: Moderate temperature ~500˚ C. Moderate vapor residence time ~10-20sec; Liquid (50%); Char (20%); Gas (30%)
3. Slow: Moderate temperature ~500˚ C. Very long vapor residence time ~5-30min; Liquid (30%); Char (35%); Gas (35%)
4. Gasification: High temperature >750˚ C. Moderate vapor residence time ~10-20sec; Liquid (10%); Char (20%); Gas (85%)
Ways to Produce Biochar: Types of Pyrolysis
Brown (2009): Biochar Production Technology. In Biochar for Environmental Management. Editors: J. Lehmann and S. Joseph. Earthscan ISBN 978-1-84407-658-1
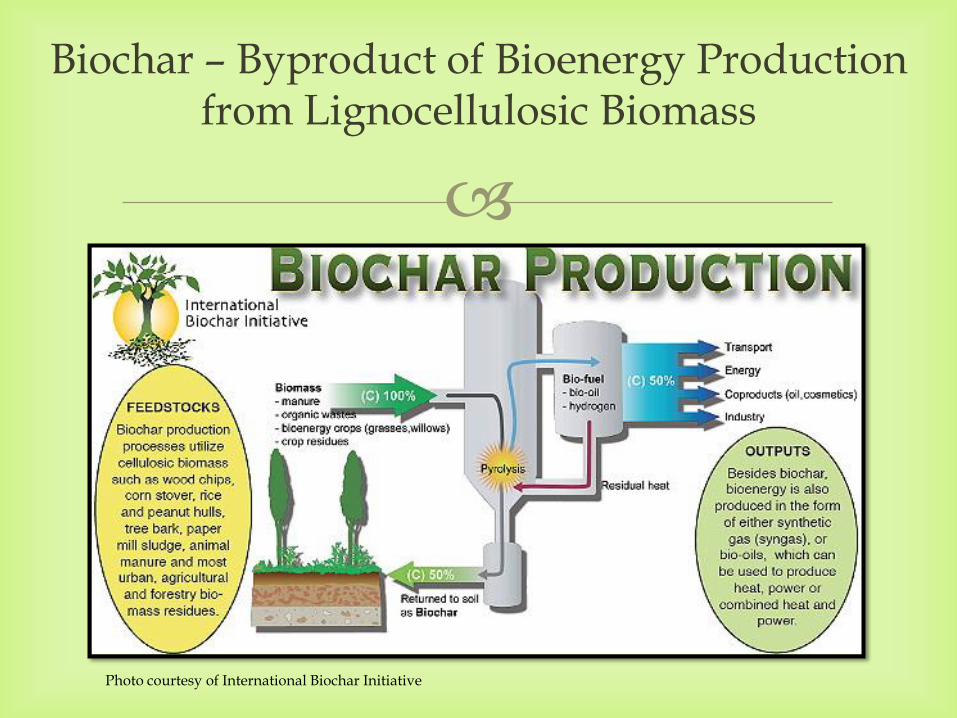
Biochar – Byproduct of Bioenergy Production from Lignocellulosic Biomass
Photo courtesy of International Biochar Initiative
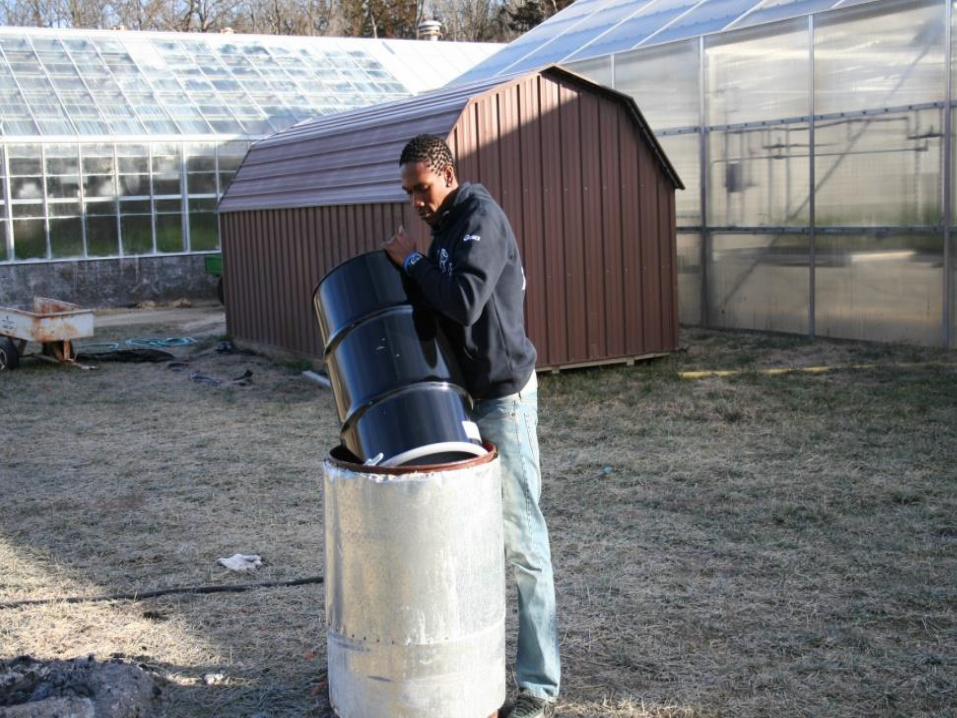
How Do We Produce Biochar?

Biochar was Generated from a Variety of Feedstocks through Slow Pyrolysis


… is recalcitrant in the soil environment
(Lehmann et al., 2009)
… has sorption properties
(McLaughlin and Shields, 2012; Yao et al., 2012)
Biochar…

Biochar is charcoal with properties somewhat similar to activated charcoal
It is produced through the pyrolysis process that involves heating of the herbaceous or ligneous biomass in an O2 deprived environment
In slow pyrolysis the biomass is heated to thermal values between 400 to 600 °C
Biochar?

Areas of Interest: Experimenting with Biochar in Our Research
Projects
- Effects of biochar on soil properties - Nutrient cycling in the soil environment - More efficient use of nutrients by plants in the presence of biochar (Little loss as nonpoint source polluters to drive eutrophication) -Growth of agricultural crops in the presence of biochar -Sorption properties of biochar in environmental remediation -Biomass research/production

Results and Discussion
http://www.maxgladwell.com/wp-content/uploads/2009/02/shark-global-warming.jpg

7.00
7.50
8.00
8.50
9.00
9.50
10.00
Cedar
Oak
Pine
Switchgrass
Miscanthus
Biochar pH (Saturated Paste)

0
0.1
0.2
0.3
0.4
0.5
0.6
0.7
0.8
PineCedar
OakMiscanthus
Switchgrass
0.261175 0.317025
0.421275 0.431475
0.7082
% Nitrogen-Kjeldahl Method

No Biochar
2% Pine Biochar
5% Pine Biochar
2% MiscanthusBiochar 5% Miscanthus
Biochar
1.24
1.12
1.04
1.13
0.92
Bulk Density

No Biochar2% PineBiochar 5% Pine
Biochar 2% MiscanthusBiochar 5% Miscanthus
Biochar 2% SwitchgrassBiochar 5% Switchgrass
Biochar
6.17 6.19 6.27 6.32
6.71
6.48 6.43
5.48 5.47
5.41 5.81
6.29
6.01 6.10
Soil pH
Water Salt


0
5
10
15
20
25
30
35
40
45
50
No Biochar
2% Pine Biochar
5% Pine Biochar
2% Miscanthus Biochar
5% Miscanthus Biochar
Root Length (cm)
B AB AB
AB A
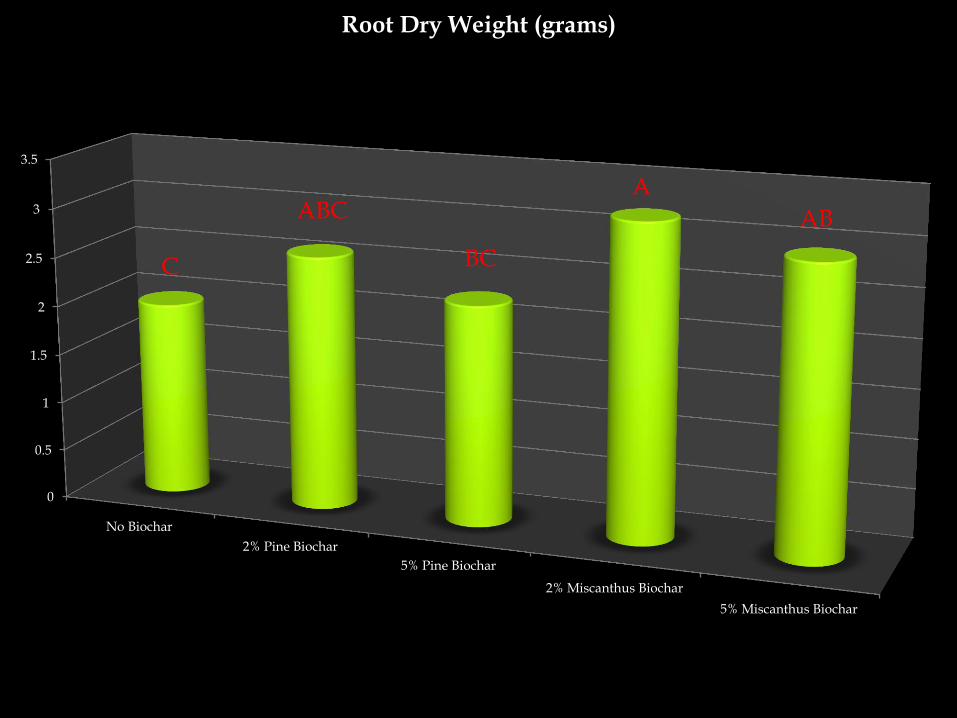
0
0.5
1
1.5
2
2.5
3
3.5
No Biochar
2% Pine Biochar
5% Pine Biochar
2% Miscanthus Biochar
5% Miscanthus Biochar
Root Dry Weight (grams)
A
AB
C
ABC
BC
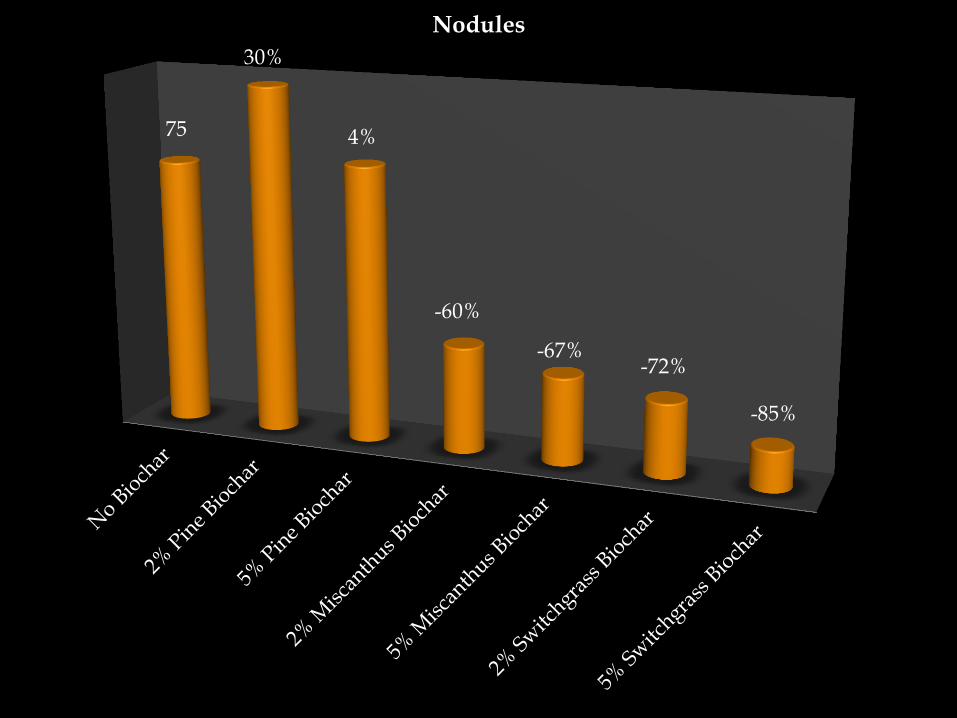
75
30%
4%
-60%
-67% -72%
-85%
Nodules

0
0.1
0.2
0.3
0.4
0.5
0.6
0.7
0.8
PineCedar
OakMiscanthus
Switchgrass
0.261175 0.317025
0.421275 0.431475
0.7082
% Nitrogen-Kjeldahl Method


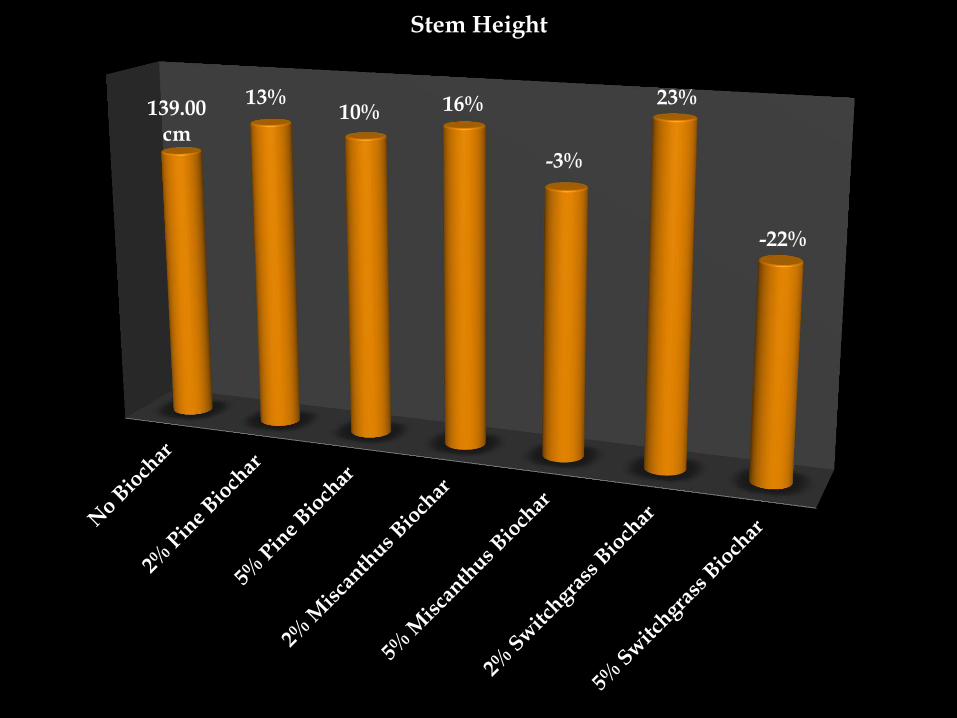
139.00 cm
13% 10% 16%
-3%
23%
-22%
Stem Height

1517.30 cm 2
43% 43%
94% 82%
102%
85%
Leaf Area
B AB
A A
AB


21 Number
50% 48%
34%
58% 62% 55%
Developed Pods (Complete Seed Fill)
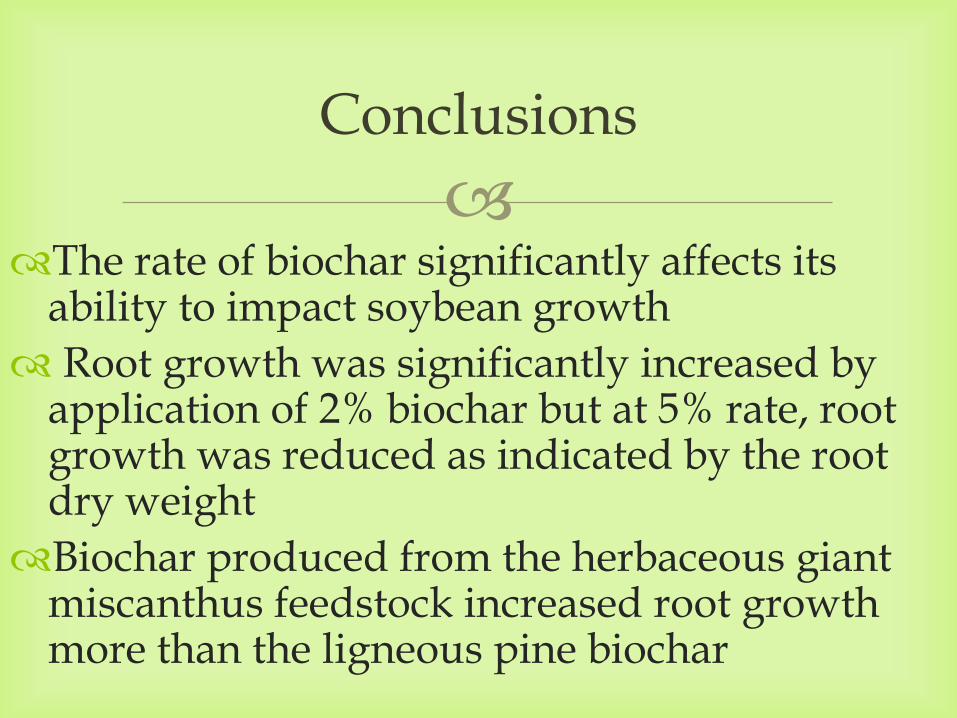
The rate of biochar significantly affects its ability to impact soybean growth
Root growth was significantly increased by application of 2% biochar but at 5% rate, root growth was reduced as indicated by the root dry weight
Biochar produced from the herbaceous giant miscanthus feedstock increased root growth more than the ligneous pine biochar
Conclusions

The herbaceous biochar significantly inhibit
nodulation in soybean Pine biochar significantly promoted nodulation at
2% application rate but at 5% rate, when compared to control, no significant difference was observed The effect of biochar on stem height was
influenced by the type of biochar Biochar significantly increased the leaf area in
soybean. The herbaceous biochar showed a more significant effect on leaf area in soybean
Conclusions (Continued)

Biochar significantly increased the number of pods
(complete seed fill at stage R6 of soybean growth)
The ability of biochar to enhance soybean growth is significantly affected by the biochar type (biomass precusor)
Biochar as a soil amendment may contribute to sustainable use of N and P reducing nutrient flux from agricultural sites including feedlots into inland waters
The soil amendment Biochar sequesters atmospheric CO2 and can help farmers (and the environment) by reducing the need for agrichemicals
Conclusions (Continued)

As for biochar:
“In the absence of eligibility for carbon credits, or simply to supplement a future income stream from carbon stabilization, it is likely that biochar addition to soil will proceed only where sufficient improvements in soil performance and productivity are perceived or assured.”
Sohi et al. (2010):A Review of Biochar and Its Use and Function in Soil. Advances in Agronomy, Volume 105. ISSN 0065-2113, DOI: 10.1016/S0065-2113(10)05002-9. http://www.soil-science.com/fileadmin/downloads/som/session5_4.pdf

Thank you!


![of fish oil, partially hydrogenated soybean oil, and ... · Effects of partially hydrogenated fish oil, partially hydrogenated soybean oil, and butter on serum lipoproteins and Lp[a]](https://img.dokumen.tips/doc/110x75/5cdad3f488c993a0658b8335/of-fish-oil-partially-hydrogenated-soybean-oil-and-effects-of-partially.jpg)