Embed Size (px)
Citation preview
Bioavailability and Bioequivalence Studies
Marc Marc SturgillSturgill, , Pharm.DPharm.D..
Assistant Director, Pediatric CRCAssistant Director, Pediatric CRC
UMDNJUMDNJ‐‐Robert Wood Johnson Medical SchoolRobert Wood Johnson Medical School

ObjectivesDiscuss the pharmacokinetic processes that determine absolute bioavailability
Discuss the basic FDA requirements for approval of ANDAs submitted by generic drug manufacturers
Discuss the basic study methods for bioequivalence
Study design
Statistical analysis
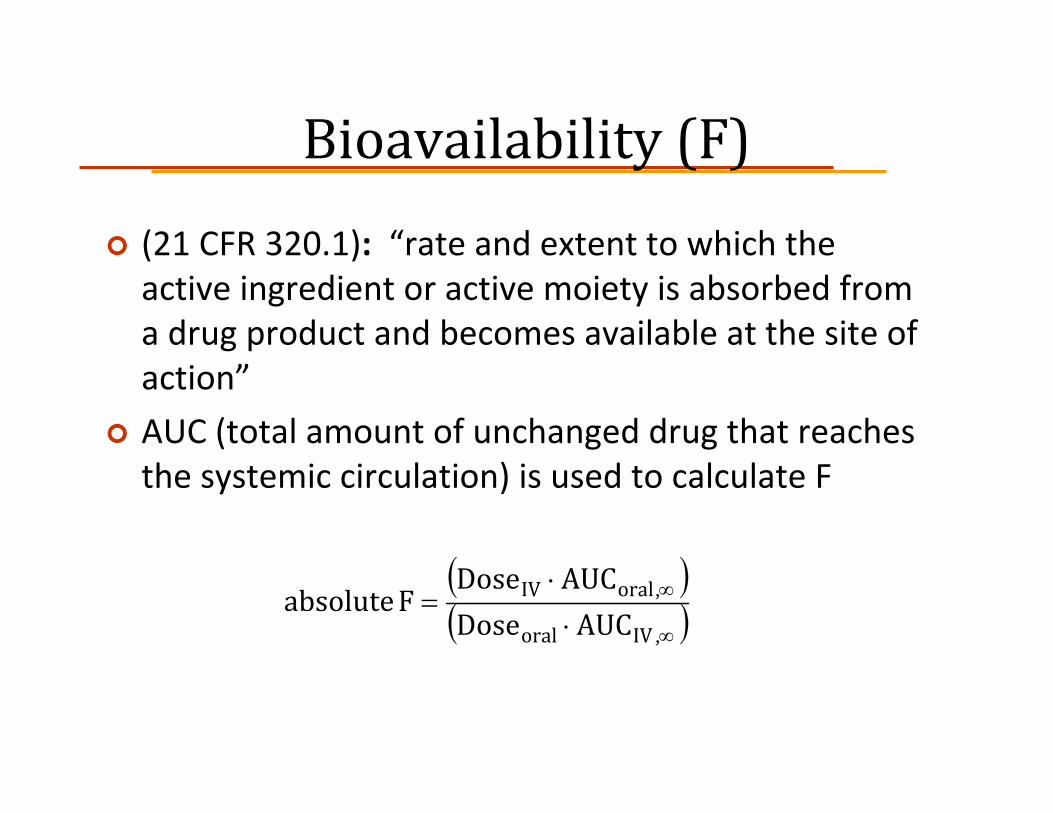
Bioavailability (F)(21 CFR 320.1): “rate and extent to which the active ingredient or active moiety is absorbed from a drug product and becomes available at the site of action”
AUC (total amount of unchanged drug that reaches the systemic circulation) is used to calculate F
( )( )∞
∞
⋅⋅
=,
,
IVoral
oralIV
AUCDoseAUCDose
Fabsolute
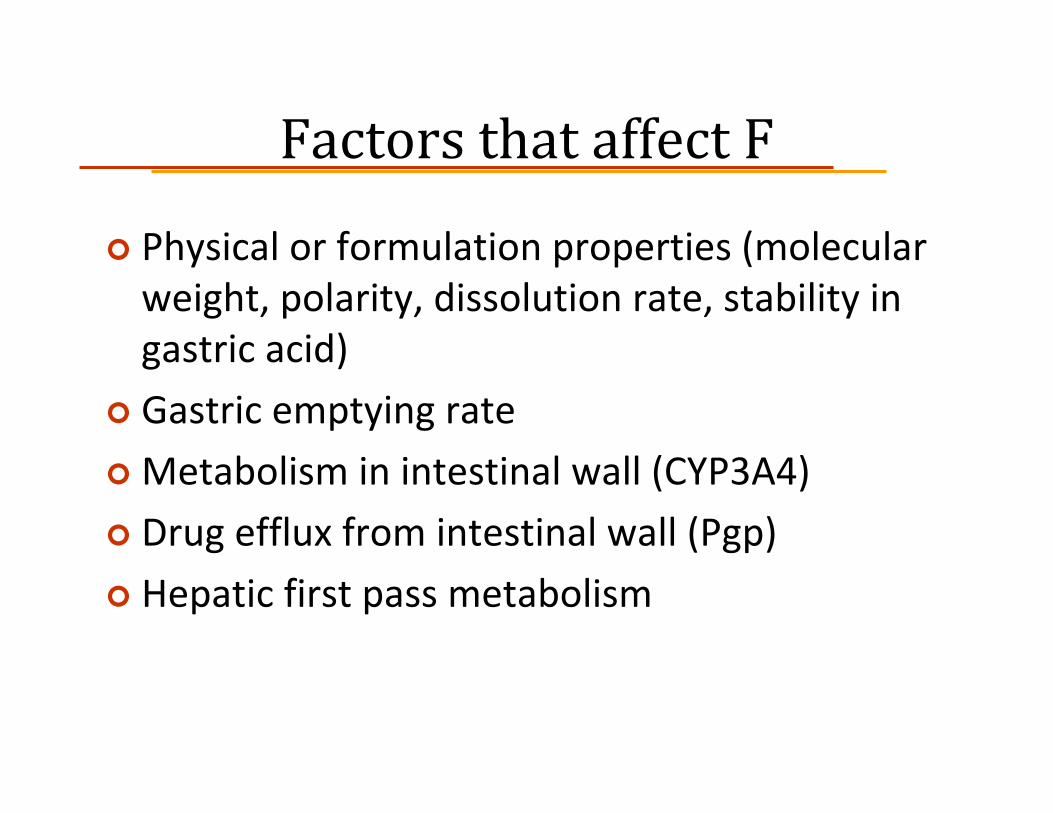
Factors that affect F
Physical or formulation properties (molecular weight, polarity, dissolution rate, stability in gastric acid)
Gastric emptying rate
Metabolism in intestinal wall (CYP3A4)
Drug efflux from intestinal wall (Pgp)
Hepatic first pass metabolism

Bioequivalence
(21 CFR 320.1): “absence of a significant difference in the rate and extent to which the active ingredient or active moiety in pharmaceutical equivalents or pharmaceutical alternatives becomes available at the site of drug action when administered at the same molar dose under similar conditions in an appropriately designed study”

DefinitionsPharmaceutical alternatives
Same active ingredientMay differ in salt, ester, dosage form or strengthExample: different dosage forms or strengths within a single manufacturers’ product line
Pharmaceutical equivalentsSame active ingredient, dosage form and strengthSame USP standards (strength, quality, purity, identity)May differ in shape, color, excipients, release mechanism, packaging, labeling and expiration date Example: brand name and generic version of a drug
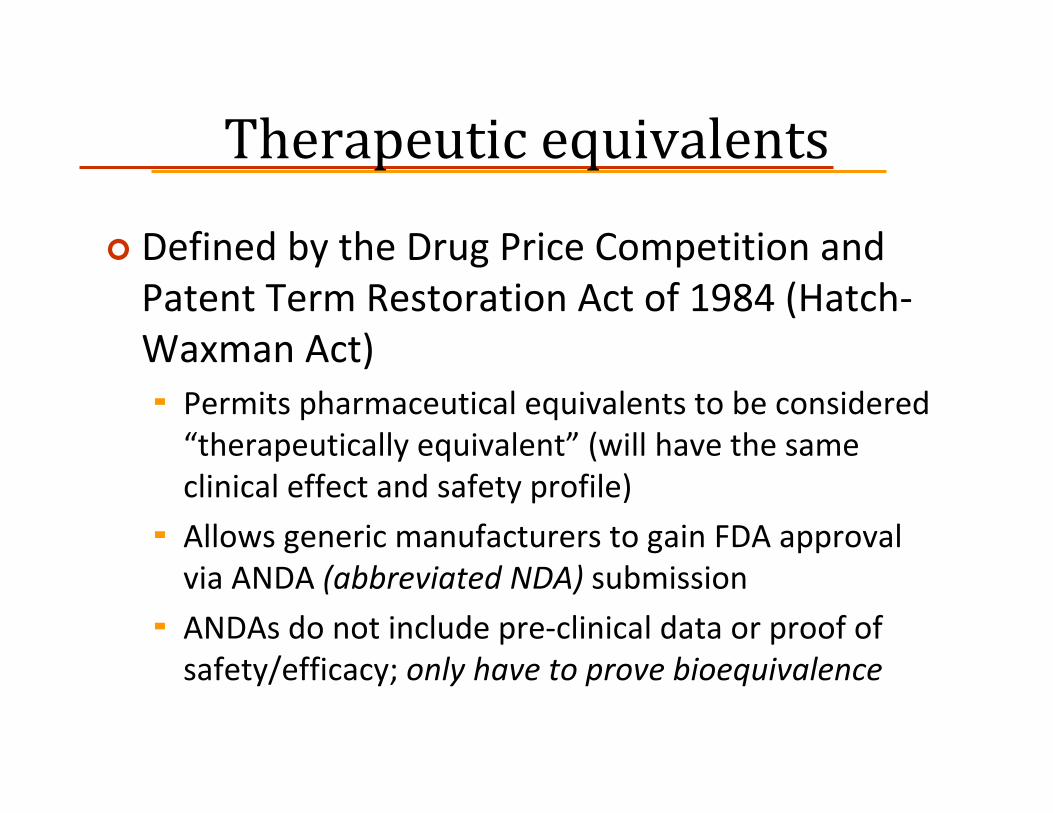
Therapeutic equivalents
Defined by the Drug Price Competition and Patent Term Restoration Act of 1984 (Hatch‐Waxman Act)
Permits pharmaceutical equivalents to be considered “therapeutically equivalent” (will have the same clinical effect and safety profile)
Allows generic manufacturers to gain FDA approval via ANDA (abbreviated NDA) submission
ANDAs do not include pre‐clinical data or proof of safety/efficacy; only have to prove bioequivalence

Normal drug approval processPre‐clinical testing Clinical trials FDA review
Synthesis & purification
Animal testing
IND
Short‐term toxicity
Phase I
Phase II
NDA
Long‐term toxicity
Phase III
FDA review
FDA review
Fina
l app
roval
Spon
sor ad
dresses
review
er com
men
ts
3‐4 years 1 year 1‐2 years 3 years
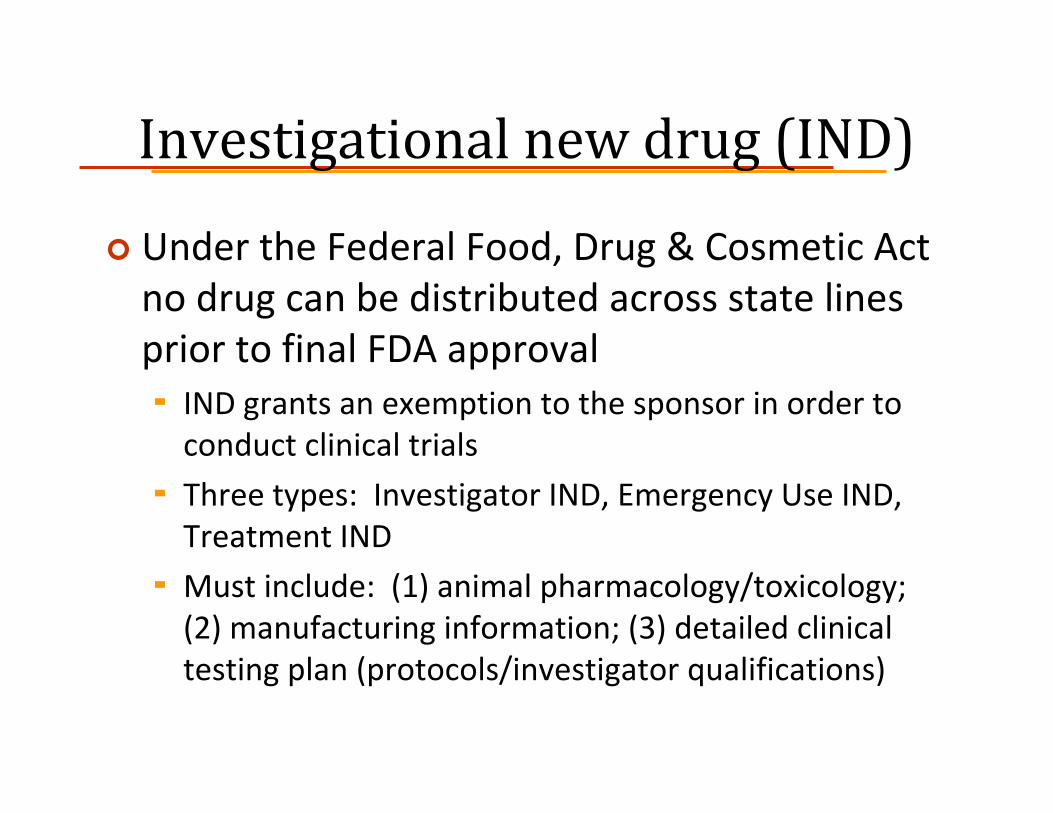
Investigational new drug (IND)
Under the Federal Food, Drug & Cosmetic Act no drug can be distributed across state lines prior to final FDA approval
IND grants an exemption to the sponsor in order to conduct clinical trials
Three types: Investigator IND, Emergency Use IND, Treatment IND
Must include: (1) animal pharmacology/toxicology; (2) manufacturing information; (3) detailed clinical testing plan (protocols/investigator qualifications)
NDA
Submitted after clinical testing; must include:“Substantial evidence” of safety and efficacy (results of both animal and human testing)
Proposed labeling, package insert
Proof of adequate “Good Manufacturing Practices” to maintain USP standards for drug identity, strength, quality, and purity
Duration of FDA reviewRegular review must be completed within 12 months
Fast‐track review is completed within 6 months

ANDA (generic drugs)
Active ingredient was already approved under the original sponsor NDA
Generic manufacturer only required to demonstrate bioequivalence (Phase I)
Typically 24‐36 healthy volunteers in a double‐blind, randomized, crossover trial (or trials)
Single‐dose fasting
Steady‐state fasting
Single‐dose fed/fasting
Study designRandomized, two‐sequence, two‐period crossover
Treatment sequence is randomizedEvery subjects gets both treatments
Half get generic drug first, half get brand drug first (minimizes the sequence effect)
Crossover designEach subject serves as his/her own control (minimizes intersubjectvariability)
Fewer subjects required to achieve adequate statistical power
Treatment periods separated by a washoutAt least 5 drug half‐lives
Minimizes the carryover (residual) effect
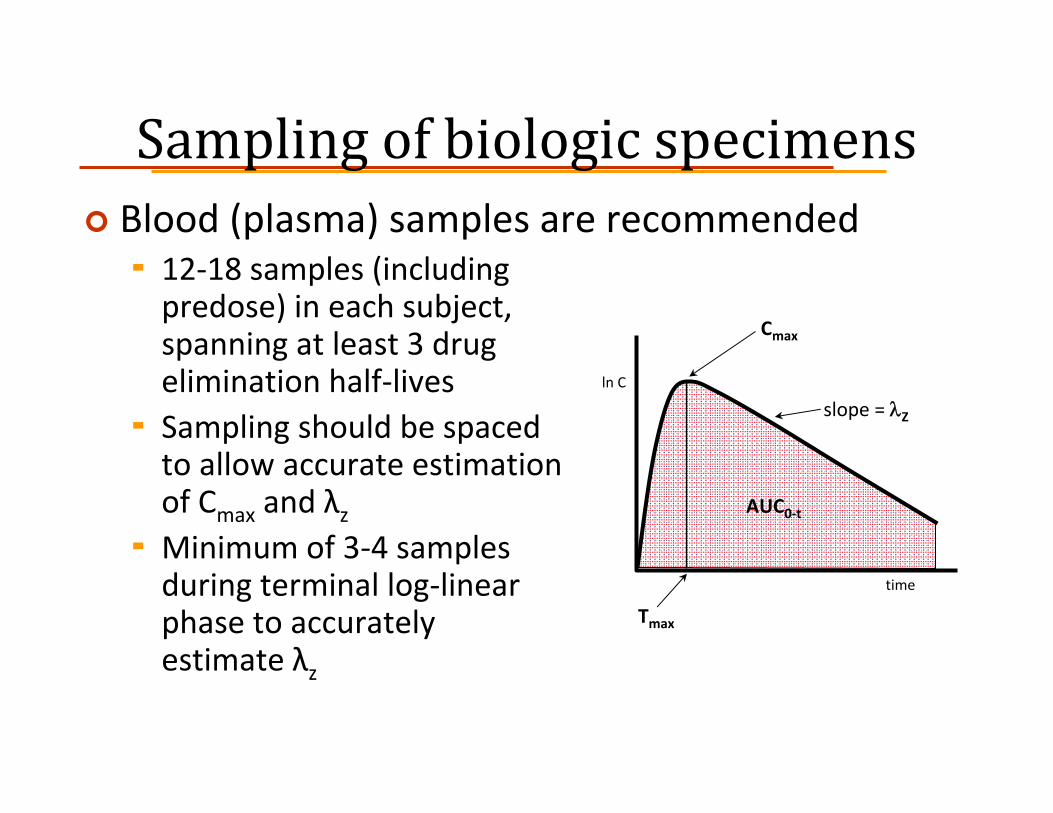
Sampling of biologic specimensBlood (plasma) samples are recommended
12‐18 samples (including predose) in each subject, spanning at least 3 drug elimination half‐livesSampling should be spaced to allow accurate estimation of Cmax and λzMinimum of 3‐4 samples during terminal log‐linear phase to accurately estimate λz
ln C
time
Cmax
slope = λZ
AUC0‐t
Tmax

Required studiesOral solutions, elixirs, syrups, tinctures
Bioequivalence studies are generally waived
Oral suspensions and immediate‐release solid oral dosage forms
Single‐dose fasting (highest strength)
Extended‐release solid oral dosage formsSingle‐dose fasting (all strengths)
Multiple‐dose steady‐state (highest strength)
Single‐dose fed/fasting (highest strength)
Single‐dose fastingPK parameters to be submitted
Subject, period, sequence, treatmentPlasma concentrations and time pointsMeasures of systemic exposure (reflect rate and extent of absorption):
Early exposure – partial AUC (truncated at population median Tmaxvalue)Peak exposure – Cmax
Total exposure – AUC0‐t , AUC∞Also report Tmax, λZ, t½
Statistical analysis of AUC0‐t , AUC∞, and Cmax

Multiple‐dose (steady‐state) PK parameters to be submitted:
Subject, period, sequence, treatmentPlasma concentrations and time pointsTotal systemic exposure – AUC0‐τ (τ = dosing interval)Also report
Cmax
Tmax
Cmin
Cavg,ss (AUC0‐τ/τ) DFss (degree of fluctuation, or [Cmax – Cmin]/Cavg,ss)Swing ([Cmax – Cmin]/Cmin)
Statistical analysis of AUC0‐τ and Cmax

Single‐dose fed/fastingPK parameters to be submitted
Subject, period, sequence, treatmentPlasma concentrations and time pointsMeasures of systemic exposure (reflect rate and extent of absorption):
Early exposure – partial AUC (truncated at population median Tmaxvalue)Peak exposure – Cmax
Total exposure – AUC0‐t , AUC∞Also report Tmax, λZ, t½
Statistical analysis of AUC0‐t , AUC∞, and Cmax
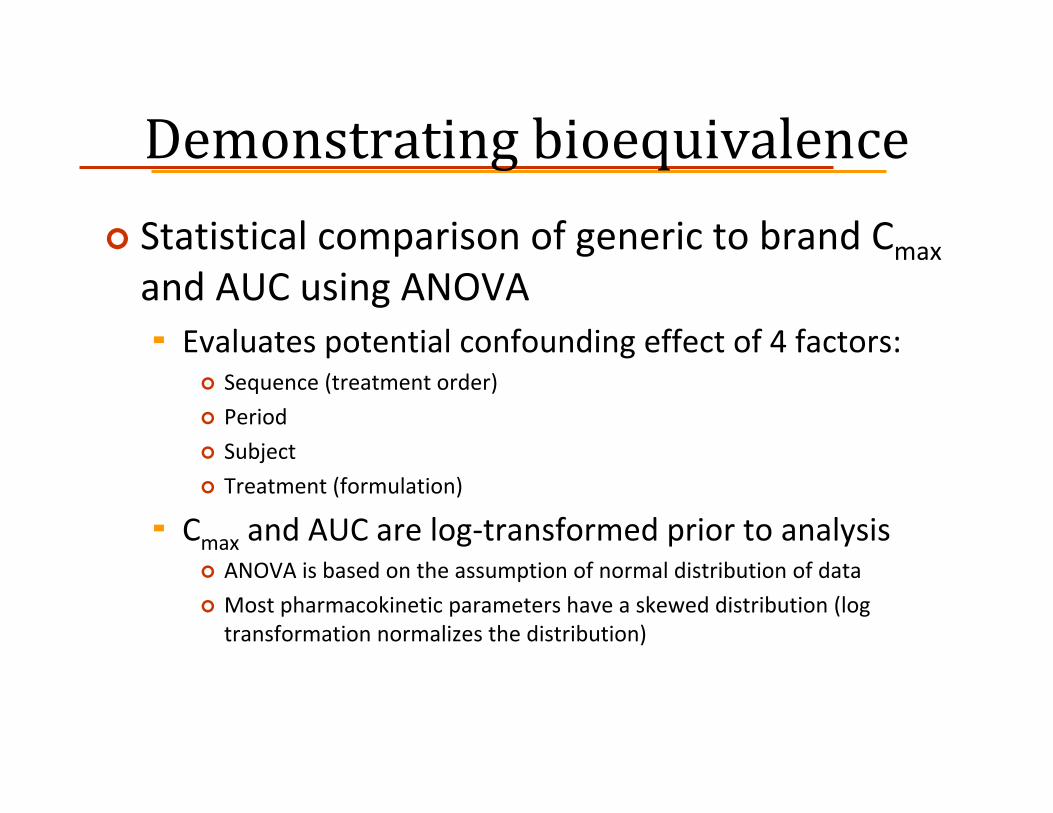
Demonstrating bioequivalenceStatistical comparison of generic to brand Cmax
and AUC using ANOVAEvaluates potential confounding effect of 4 factors:
Sequence (treatment order)
Period
Subject
Treatment (formulation)
Cmax and AUC are log‐transformed prior to analysisANOVA is based on the assumption of normal distribution of data
Most pharmacokinetic parameters have a skewed distribution (log transformation normalizes the distribution)
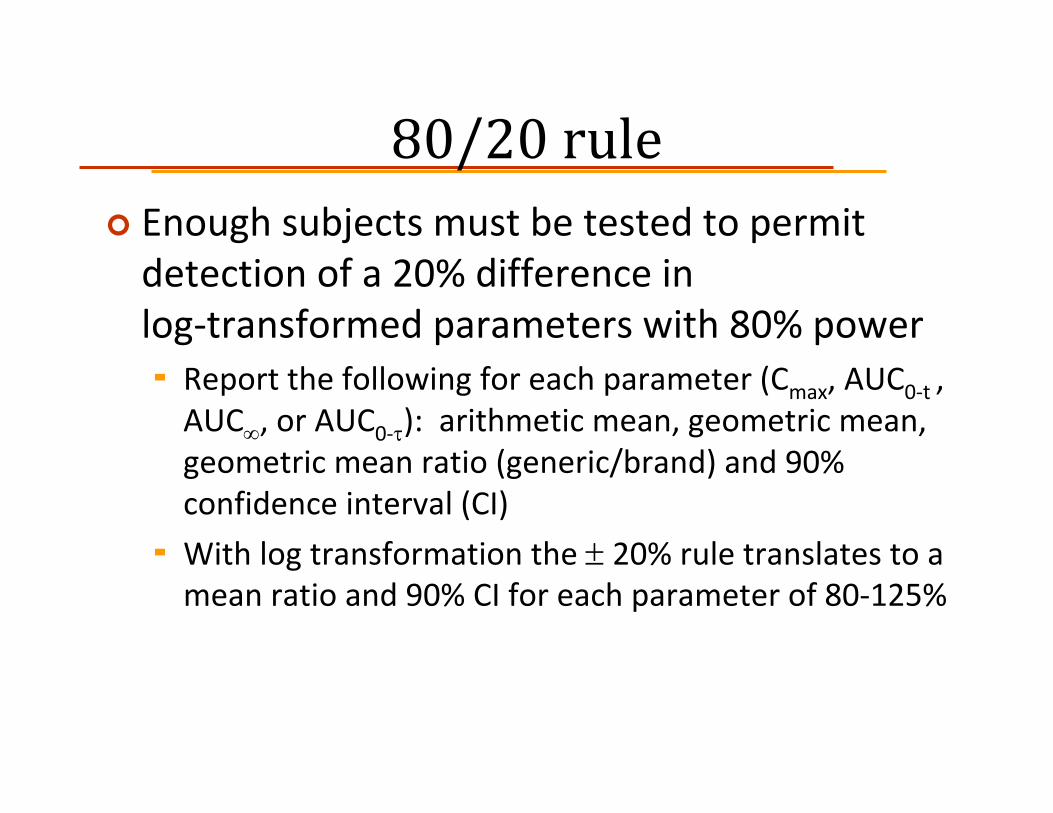
80/20 ruleEnough subjects must be tested to permit detection of a 20% difference in log‐transformed parameters with 80% power
Report the following for each parameter (Cmax, AUC0‐t , AUC∞, or AUC0‐τ): arithmetic mean, geometric mean, geometric mean ratio (generic/brand) and 90% confidence interval (CI)
With log transformation the ± 20% rule translates to a mean ratio and 90% CI for each parameter of 80‐125%
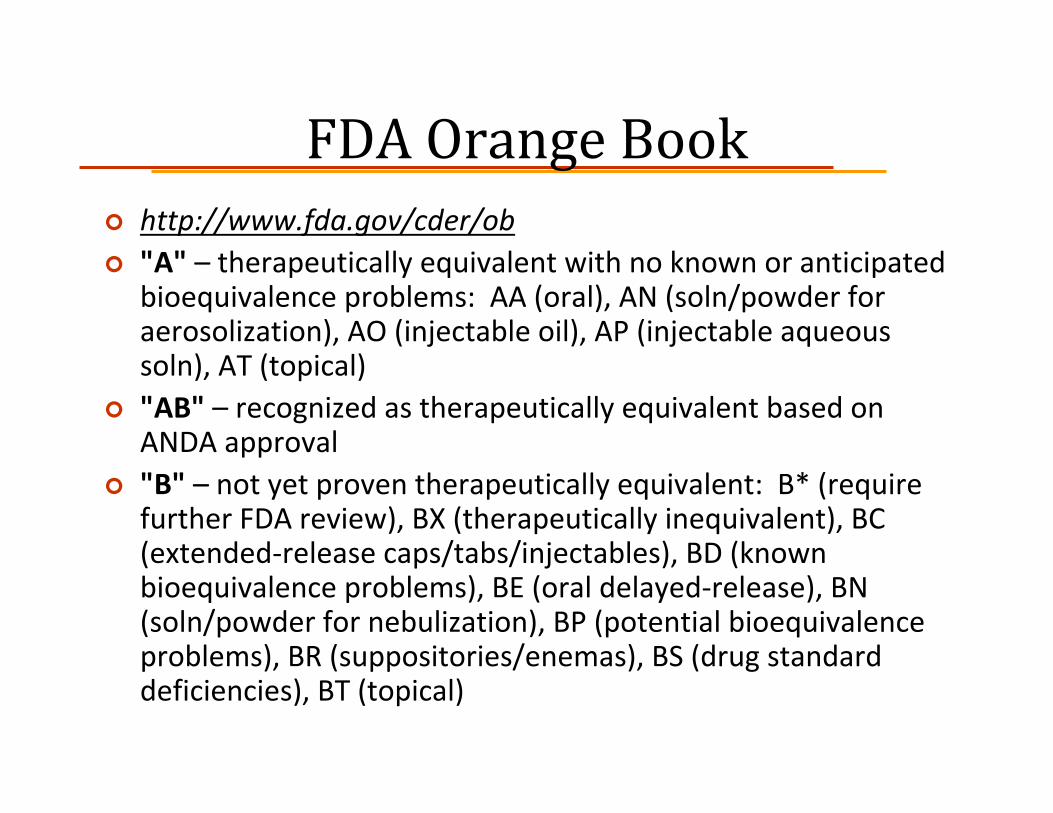
FDA Orange Bookhttp://www.fda.gov/cder/ob"A" – therapeutically equivalent with no known or anticipated bioequivalence problems: AA (oral), AN (soln/powder for aerosolization), AO (injectable oil), AP (injectable aqueous soln), AT (topical)"AB" – recognized as therapeutically equivalent based on ANDA approval"B" – not yet proven therapeutically equivalent: B* (require further FDA review), BX (therapeutically inequivalent), BC (extended‐release caps/tabs/injectables), BD (known bioequivalence problems), BE (oral delayed‐release), BN (soln/powder for nebulization), BP (potential bioequivalence problems), BR (suppositories/enemas), BS (drug standard deficiencies), BT (topical)
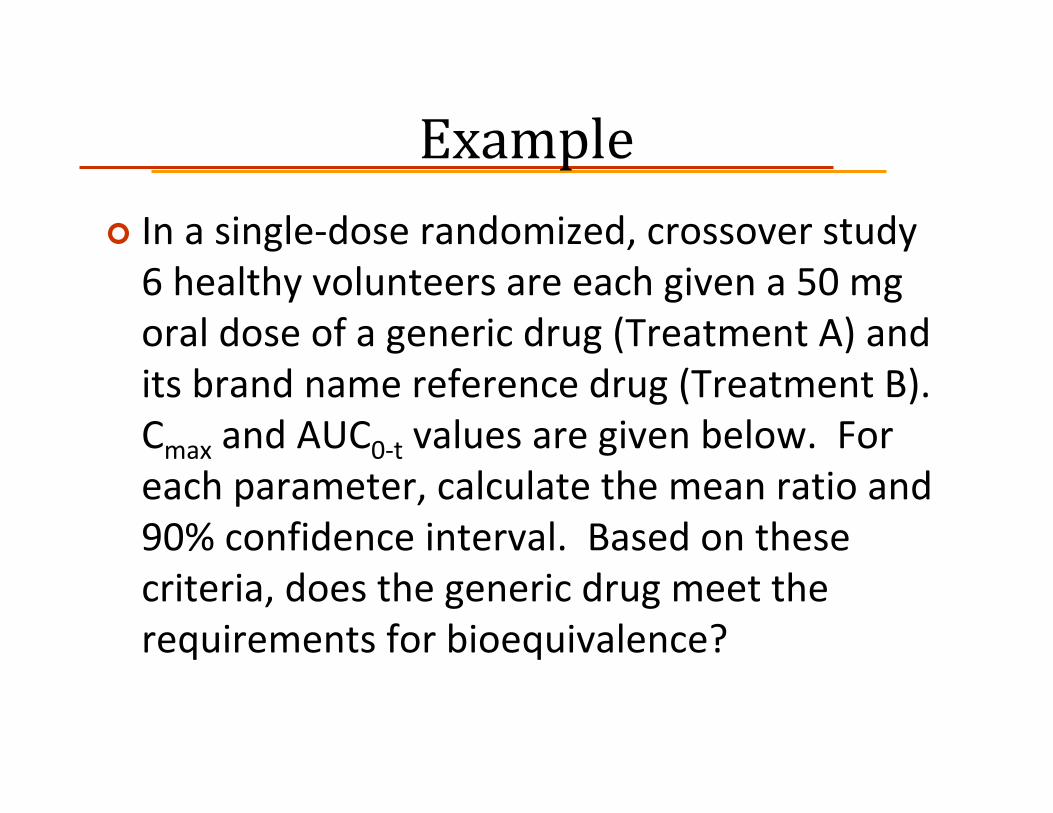
ExampleIn a single‐dose randomized, crossover study 6 healthy volunteers are each given a 50 mg oral dose of a generic drug (Treatment A) and its brand name reference drug (Treatment B). Cmax and AUC0‐t values are given below. For each parameter, calculate the mean ratio and 90% confidence interval. Based on these criteria, does the generic drug meet the requirements for bioequivalence?
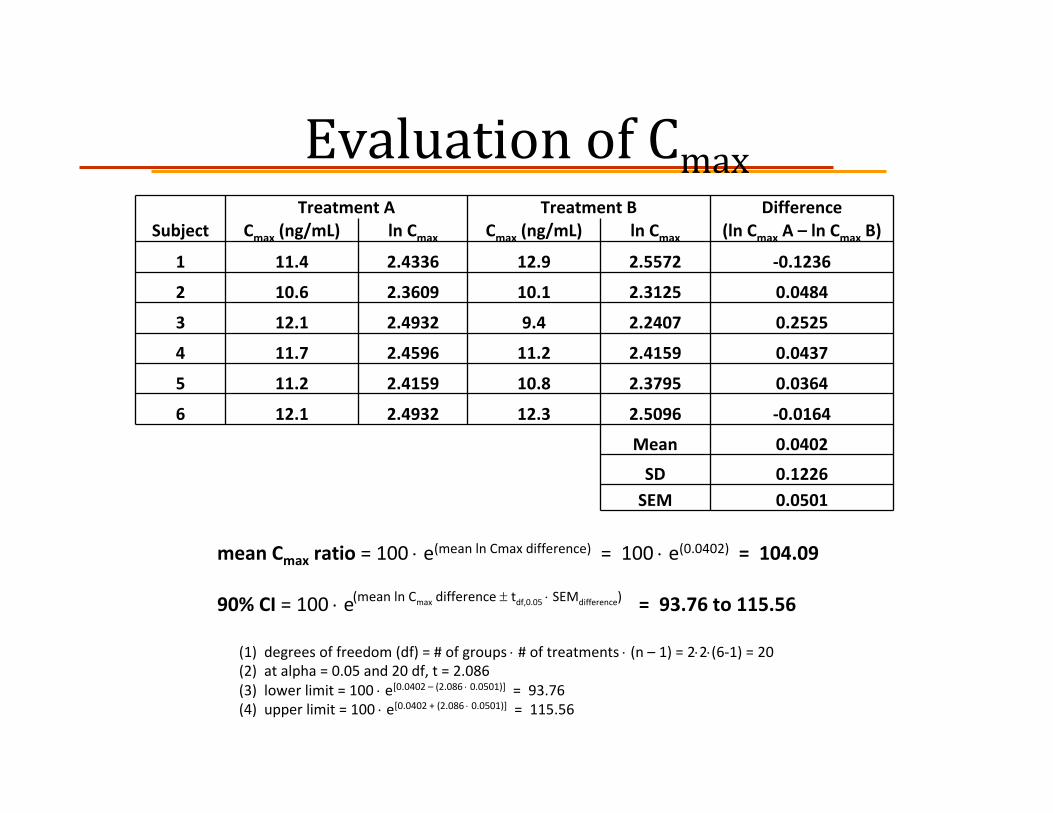
Evaluation of CmaxTreatment A Treatment B Difference
Subject Cmax (ng/mL) ln Cmax Cmax (ng/mL) ln Cmax (ln Cmax A – ln Cmax B)
1 11.4 2.4336 12.9 2.5572 ‐0.1236
2 10.6 2.3609 10.1 2.3125 0.0484
3 12.1 2.4932 9.4 2.2407 0.2525
4 11.7 2.4596 11.2 2.4159 0.0437
5 11.2 2.4159 10.8 2.3795 0.0364
6 12.1 2.4932 12.3 2.5096 ‐0.0164
Mean 0.0402
SD 0.1226SEM 0.0501
mean Cmax ratio = 100 ⋅ e(mean ln Cmax difference) = 100 ⋅ e(0.0402) = 104.09
90% CI = 100 ⋅ e = 93.76 to 115.56
(1) degrees of freedom (df) = # of groups ⋅ # of treatments ⋅ (n – 1) = 2⋅2⋅(6‐1) = 20(2) at alpha = 0.05 and 20 df, t = 2.086(3) lower limit = 100 ⋅ e[0.0402 – (2.086 ⋅ 0.0501)] = 93.76(4) upper limit = 100 ⋅ e[0.0402 + (2.086 ⋅ 0.0501)] = 115.56
(mean ln Cmax difference ± tdf,0.05 ⋅ SEMdifference)
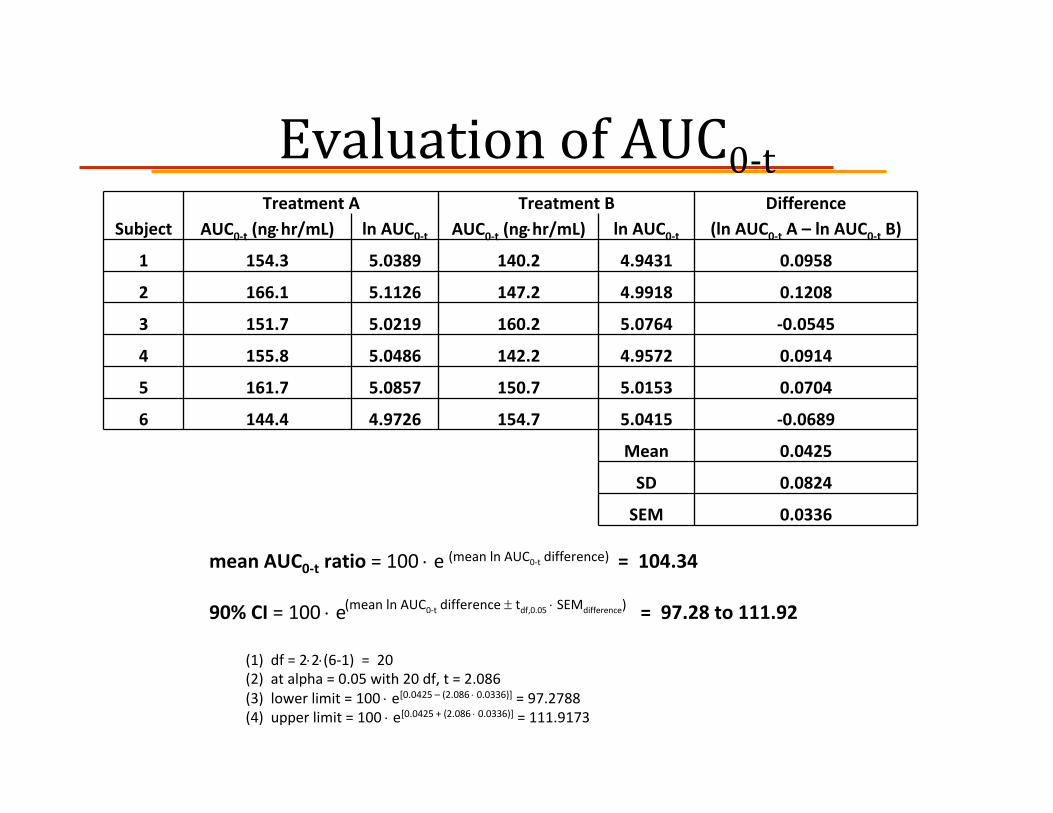
Evaluation of AUC0‐tTreatment A Treatment B Difference
Subject AUC0‐t (ng⋅hr/mL) ln AUC0‐t AUC0‐t (ng⋅hr/mL) ln AUC0‐t (ln AUC0‐t A – ln AUC0‐t B)
1 154.3 5.0389 140.2 4.9431 0.0958
2 166.1 5.1126 147.2 4.9918 0.1208
3 151.7 5.0219 160.2 5.0764 ‐0.0545
4 155.8 5.0486 142.2 4.9572 0.0914
5 161.7 5.0857 150.7 5.0153 0.0704
6 144.4 4.9726 154.7 5.0415 ‐0.0689
Mean 0.0425
SD 0.0824
SEM 0.0336
mean AUC0‐t ratio = 100 ⋅ e = 104.34
90% CI = 100 ⋅ e = 97.28 to 111.92
(1) df = 2⋅2⋅(6‐1) = 20(2) at alpha = 0.05 with 20 df, t = 2.086(3) lower limit = 100 ⋅ e[0.0425 – (2.086 ⋅ 0.0336)] = 97.2788 (4) upper limit = 100 ⋅ e[0.0425 + (2.086 ⋅ 0.0336)] = 111.9173
(mean ln AUC0‐t difference)
(mean ln AUC0‐t difference ± tdf,0.05 ⋅ SEMdifference)

ReferencesBioavailability and bioequivalence. In: Shargel L, Andrew Y, eds. Applied Biopharmaceutics and Pharmacokinetics, 4th ed. Stamford, CT:Appleton & Lange, 1999:247‐79.
Guidance for industry: bioavailability and bioequivalence studies for orally administered drug products – general considerations. Rockville, MD:U.S. DHHS, 2003: 1‐23.
Statistical tests for bioequivalence. In: De Muth JE, ed. Basic Statistics and Pharmaceutical Statistical Applications. New York: Marcel Dekker, Inc., 1999: 497‐528.
From idea to market: the drug approval process. J Am Board Family Med 2001;14(5)