Embed Size (px)
Citation preview

Zhao, Y., Yan, H., Zhou, J., Tucker, M. E., Han, M., Zhao, H., Mao,G., Zhao, Y., & Han, Z. (2019). Bio-precipitation of calcium andmagnesium ions through extracellular and intracellular processinduced by bacillus licheniformis SRB2. Minerals, 9(9), [526].https://doi.org/10.3390/min9090526
Publisher's PDF, also known as Version of recordLicense (if available):CC BYLink to published version (if available):10.3390/min9090526
Link to publication record in Explore Bristol ResearchPDF-document
This is the final published version of the article (version of record). It first appeared online via MDPI athttps://www.mdpi.com/2075-163X/9/9/526 . Please refer to any applicable terms of use of the publisher.
University of Bristol - Explore Bristol ResearchGeneral rights
This document is made available in accordance with publisher policies. Please cite only thepublished version using the reference above. Full terms of use are available:http://www.bristol.ac.uk/red/research-policy/pure/user-guides/ebr-terms/

minerals
Article
Bio-Precipitation of Calcium and Magnesium Ionsthrough Extracellular and Intracellular ProcessInduced by Bacillus Licheniformis SRB2
Yanyang Zhao 1,2, Huaxiao Yan 3,*, Jingxuan Zhou 3, Maurice E. Tucker 4,5, Mei Han 1,Hui Zhao 3,*, Guangzhou Mao 1, Yifan Zhao 3 and Zuozhen Han 1,2,*
1 Shandong Provincial Key Laboratory of Depositional Mineralization and Sedimentary Minerals, College ofEarth Science and Engineering, Shandong University of Science and Technology, Qingdao 266590, China
2 Laboratory for Marine Mineral Resources, Qingdao National Laboratory for Marine Science and Technology,Qingdao 266237, China
3 Department of Bioengineering, College of Chemical and Environmental Engineering, Shandong Universityof Science and Technology, Qingdao 266590, China
4 School of Earth Sciences, University of Bristol, Bristol, BS8 1RJ, UK5 Cabot Institute, University of Bristol, Cantock’s Close, Bristol, BS8 1UJ, UK* Correspondence: [email protected] (H.Y.); [email protected] (H.Z.); [email protected] (Z.H.);
Tel.: +86-532-86-057-625 (H.Y.); +86-532-86-057-813 (H.Z.); +86-532-86-057-286 (Z.H.)
Received: 14 July 2019; Accepted: 29 August 2019; Published: 30 August 2019�����������������
Abstract: Removal of calcium and magnesium ions through biomineralization induced by bacteriahas been proven to be an effective and environmentally friendly method to improve water quality,but the process and mechanism are far from fully understood. In this study, a newly isolatedprobiotic Bacillus licheniformis SRB2 (GenBank: KM884945.1) was used to induce the bio-precipitationof calcium and magnesium at various Mg/Ca molar ratios (0, 6, 8, 10, and 12) in medium with 30 gL−1 sodium chloride. Due to the increasing pH and HCO3
− and CO32− concentrations caused by
NH3 and carbonic anhydrase, about 98% Ca2+ and 50% Mg2+ were precipitated in 12 days. Thepathways of bio-precipitation include extracellular and intracellular processes. Biominerals with morenegative δ13C values (−16%� to −18%�) were formed including calcite, vaterite, monohydrocalcite,and nesquehonite with preferred orientation. The nucleation on extracellular polymeric substanceswas controlled by the negatively charged amino acids and organic functional groups. The intracellularamorphous inclusions containing calcium and magnesium also contributed to the bio-precipitation.This study reveals the process and mechanism of microbial desalination for the removal of calciumand magnesium, and provides some references to explain the formation of the nesquehonite andother carbonate minerals in a natural and ancient earth surface environment.
Keywords: bio-precipitation; biomineral; carbonic anhydrase; nucleation site; intracellularbiomineralization
1. Introduction
Three quarters of the Earth’s surface is covered by water, and more than 97% of the water isseawater and saline water. Seawater contains a large number of ions, among which Na (1.05 wt %),Mg (0.135 wt %), and Ca (0.04 wt %) are the three most abundant metal ions [1,2] that can causeserious problems such as the corrosion of machines, scale in cooling systems, human stone disease, andinefficient washing [2,3]. Thus, the removal of Mg2+ and Ca2+ is very important in the pretreatment ofseawater due to the great deal of harm above-mentioned. Recently, desalinated seawater has become animportant water source and is widely used in mining processes as well as in other industrial fields by
Minerals 2019, 9, 526; doi:10.3390/min9090526 www.mdpi.com/journal/minerals

Minerals 2019, 9, 526 2 of 23
many countries who face a lack of water such as China, Chile, and Israel [3–6]. Seawater desalinationis also an important way to produce potable water, and has provided 80% of the available water forhuman consumption in north Chile [3]. Desalinated seawater has already been widely used in the fieldof agriculture in Spain, a European country rich in semi-arid regions [7]. In the process of seawaterdesalination, mature membrane-based desalination technologies are most widely used [8], and includereverse osmosis (RO) and nanofiltration (NF),which can filtrate seawater using a polymer-materialmembrane at a pressure of 340–6800 kPa [9], and electrodialysis (ED) and reverse electrodialysis(RED), which can make ions flow through an ion-selective membrane to reach an opposite-chargedelectrode driven by direct current (DC) [10]. In addition, there are forward osmosis (FO) and membranedistillation (MD) technologies [11,12]. It can be seen that membrane technologies require driving forcessuch as pressure, electricity, and thermal energy to overcome the natural osmotic pressure to allowthe water/ions to pass through the membrane quickly. Due to these above limitations, agreement onexploring a new environmentally friendly and economical method has been reached [4].
Over the last several years, new methods regarding seawater desalination using microorganismshave received wide attention [13–16]. In comparison to traditional desalination technology, theremoval of Ca2+ and Mg2+ ions using a biological process has many advantages such as lowerenergy consumption, lower industrial cost, and less negative environmental impact [17–19]. Forexample, cyanobacteria Synechococcus sp. PCC 7002 has been used as an ion exchanger to removedifferent kinds of ions in seawater [20]. Another example is the use of microbial desalination cells(MDC) [21]. MDC can drive anions and cations in a salt solution to move to the anode and cathode,respectively, using electricity generated by exoelectrogenic bacteria, and then the ions can be removedfrom the water [22]. Thus, the method of MDC has provided a breakthrough in water treatment.Aside from the ion exchanger and MDC, another way to treat wastewater with microorganisms isthrough biomineralization.
The definition of biomineralization is that microorganisms can change the local environmentsurrounding cells by increasing the pH and elevating the supersaturation to induce the precipitationof minerals [23–25]. Biomineralization can be divided into two types: biologically controlledmineralization (BCM) and biologically induced mineralization (BIM) based on the degree of biologicalcontrol [26]. It has numerous applications including CO2 fixation [27,28], dolomite precipitation [29],pathological concretions [30], cement remediation [31], and the solid-phase capture of solublematerials [32,33]. At the same time, bio-precipitation of metals ions (Fe, U, Pb, Cd, Ca, Mg, and soon) induced by microorganisms play a vital role in decreasing the contamination of metal ions insoils and water [28,34–36]. Furthermore, the formation of minerals and rocks has also been closelylinked to biomineralization [37–41], for example, aerobic bacterial strains can induce the formation ofsome biominerals such as dolomite, huntite, high Mg-calcite, and hydromagnesite at Earth surfaceconditions at aqueous Mg/Ca ratios (2 to 11.5). Moreover, the microbes in the hypersaline coastallagoon, Lagoa Vermelha (Brazil) can induce the precipitation of Ca2+ and Mg2+ ions to form moderncarbonate stromatolites [42]. The formation of the above minerals and rocks provides a theoreticaland practical basis for decreasing the contamination of Ca2+ and Mg2+ ions in wastewater. Somemicroorganisms are able to precipitate and survive in a waste saline adverse environment with ahigher concentration of Mg2+ ions, thus resulting in a decrease in the concentration of Mg2+ ions.Biomineralization induced by bacteria is a new type of water treatment method by which dissolvedions in the wastewater/seawater can be mineralized into solid-state precipitates under the influence ofmicroorganisms that can reduce the metal ion concentration to control water pollution.
The mechanism of biomineralization has been explored over the past few decades, and severalbiological processes such as denitrification, iron reduction, sulfate reduction, and catalytic reactionof urease and carbonic anhydrase have been found to create the necessary conditions for biomineralprecipitation [43]. More recent studies have suggested that organic functional groups also play avery important role in the biomineralization process [43,44]. Among the many functional groupsfor biomineralization, carboxyl groups have been more reported. It has been found that carboxyl

Minerals 2019, 9, 526 3 of 23
groups originating from halophilic bacteria Haloferax volcanii DS52 contribute to the biomineralizationof disordered dolomite (CaMgCO3) [44]. However, it is not possible to find all the factors that affectbiomineralization, mainly because of the extreme heterogeneity of microorganisms and the widerange of the physicochemical properties of metal ions. Since metal ions transforming into minerals bybiomineralization is a relatively complicated process, the current understanding of biomineralizationseems to be very limited. Thus, the mechanism of biomineralization and the characteristics ofbiominerals still need to be further studied.
In this study, Bacillus licheniformis SRB2 bacteria were identified by a 16S rDNA sequencecomparison and used to induce the bio-precipitation of Ca2+ and Mg2+ ions in a saline solution. Theconcentrations of Ca2+ and Mg2+ ions were measured by an atomic absorption spectrophotometer(AAS) to calculate the precipitation ratios. To further explore the biomineralization mechanism,the growth curve, pH values, the activity of carbonic anhydrase, the concentration of ammonium,and carbonate and bicarbonate ions were analyzed, respectively. X-ray powder diffraction (XRD),scanning electron microscope (SEM)-energy disperse spectroscopy (EDS), Fourier transform infraredspectroscopy (FTIR), and stable carbon isotope analysis were used to characterize the precipitates tofurther prove their biogenesis. Furthermore, aside from the extracellular bio-precipitation, whetherthe Ca2+ and Mg2+ ions could enter the cell was also investigated by laser scanning microscopyand a fluorescence spectrophotometer. To further determine the nucleation sites, ultrathin slices ofB. licheniformis SRB2 cell were prepared and analyzed by transmission electron microscopy (TEM)and selected area electron diffraction (SAED), and at the same time, the amino acid composition ofthe extracellular polymeric substance (EPS) originating from the SRB2 bacteria was also analyzedby an amino acid analyzer. This study may provide further understanding on the mechanism ofbiomineralization, and supply an environmental-friendly and economic method for the removal ofCa2+ and Mg2+ ions in saline wastewater.
2. Materials and Methods
2.1. 16S rDNA-Based Identification of Bacteria
Bacterium SRB2 was screened, incubated, and stored in this geological microbial laboratory.Regarding the 16S rDNA-based identification of SRB2, the methods to extract the bacterial total DNAand the detailed steps to perform the polymerase chain reaction (PCR) are both referred to in theliterature [45]. The PCR products were subsequently sequenced by Shanghai Sangon Biotech Co.Ltd. (Shanghai, China). These sequences were assembled with DNAMAN 8.0 software, and then thecomplete 16S rDNA sequence was compared with those of the GenBank database. The neighbor-joiningmethod was used to build the phylogenetic tree of SRB2 by Mega 6 software.
2.2. Preparation of the Liquid Bacterial Seed of SRB2 Strain
A single colony of SRB2 bacteria was inoculated into 100 mL sterilized liquid medium (unit g·L−1:beef extract 5, tryptone 10, NaCl 10, pH 7.2), and then cultured in an oscillation incubator (HZQ-F160,Harbin electronic technology development Co. Ltd., Harbin, China) with a speed of 130 rpm at 37 ◦C.The cell concentration was measured with a spectrophotometer (722s, Shanghai Analysis InstrumentFactory, Shanghai, China) at a wavelength of 600 nm. When the OD600 value of the fermented liquidwas approximately 0.95, the preparation of the liquid bacterial seed of SRB2 strain was complete.
2.3. Physiological and Biochemical Characteristics of SRB2 Bacteria
2.3.1. Morphology, Gram Staining, and Ammonia Test
The single colony of SRB2 bacteria was observed by the naked eye, and the single bacteriumwas analyzed by SEM, Gram staining, and the ammonia test, according to the methods reported byHan et al. [45].

Minerals 2019, 9, 526 4 of 23
2.3.2. Growth Curve and pH Changes
To evaluate the tolerance of SRB2 bacteria on the salinity, 2 mL of the liquid bacterial seed of SRB2strain was inoculated into 200 mL of liquid culture medium (unit g·L−1: beef extract 5, tryptone 10, pH7.2) with 1%, 2%, 3%, and 4% of sodium chloride (NaCl, m:v), and the cell concentration was measuredusing a spectrophotometer at a wavelength of 600 nm.
The liquid bacterial seed of SRB2 strain was inoculated into the liquid culture medium with 3% ofNaCl at a volume ratio of 1% and this was set as the experimental group. The other group inoculatedwith the sterile distilled water at a volume ratio of 1% was set as the control group. The experimentwas performed in triplicate. All samples were cultured in a constant temperature oscillation incubatorat 130 rpm and 37 ◦C. The cell concentration was measured by a spectrophotometer at a wavelength of600 nm and the pH values were measured using a pH meter (PHS-3C, Shanghai Shengke InstrumentEquipment Co. Ltd., Shanghai, China).
2.3.3. Ammonium Concentration and pH Based on Ammonium
The concentration of ammonium (NH4+) in the fermented liquid was measured with a titration
reported method [45]. The pH values based on the NH4+ concentration were also calculated according
to the same reference.
2.3.4. Carbonic Anhydrase Activity
Carbonic anhydrase (CA) activity was measured based on the transformation reaction fromp-nitrophenylacetate to nitrophenol. The working solution was prepared by mixing 0.5 mL ofp-nitrophenylacetate alcoholic solution (3.6 g·L−1) and 10 mL of ethyl diethylmalonate Hank’s BalancedSalt Solution (HBSS, 1.56 g·L−1). One mL of the bacterial solution diluted five times was reacted with 1mL of the working solution at 35 ◦C for 30 min, and then quickly cooled in an ice bath, before finallybeing measured by a spectrophotometer at a wavenumber of 400 nm. Before reaction, the mixtureshould also be measured by a spectrophotometer at the same wavenumber. Here, one unit of CA (U)was defined as the amount of enzyme required to release 1 µmol of p-nitrophenol per min and 1 L.
2.3.5. Bicarbonate and Carbonate Ions, and pH Values
The concentrations of bicarbonate and carbonate ions were measured by the acid–base titrationmethod [45]. To determine how bicarbonate and carbonate ions could affect the pH, the solution ofsodium bicarbonate and sodium carbonate was prepared according to the concentration of bicarbonateand carbonate ions, and the pH was measured.
2.4. Medium Used to Induce Biominerals
The liquid culture medium containing 0.01 mol·L−1 of Ca2+ ions was prepared and the Mg/Camolar ratio was adjusted to 0, 6, 8, 10, and 12 by using magnesium chloride, respectively. A total of10.6 g Na2CO3 and 9.0 g NaHCO3 were dissolved in 100 mL of sterile distilled water and filtratedthrough a filter membrane with a pore diameter of 0.22 µm, respectively. Three mL of the Na2CO3
filtrate and 5 mL of the NaHCO3 filtrate was added into 200 mL of the liquid medium at each valueof Mg/Ca molar ratio, respectively; and the pH value of the medium was adjusted to 7.2. The liquidbacterial seed was inoculated into the above medium with an inoculation volume ratio of 1% and thiswas set as the experimental group; and the medium with various pH of 6.0, 8.0, and 9.2, besides 7.2,were inoculated with sterile distilled water at a volume ratio of 1% to be set as the control groups, withthe aim to compare the difference in minerals between the experimental group at different stages andthe control group. The experiments were performed in triplicate. All cultures were incubated in aconstant temperature oscillation incubator at 130 rpm and 37 ◦C.

Minerals 2019, 9, 526 5 of 23
2.5. Ca2+ and Mg2+ Concentration and the Electroconductivity
Ca2+ and Mg2+ concentrations were measured by an atomic absorption spectrophotometer (AAS,TAS-986, Zhengzhou Nanbei Instrument Equipment Co. Ltd., Zhengzhou, Henan Province, China).To analyze the characteristics of the precipitation process, the Boltzmann equation was used and thekinetic parameters were also analyzed based on the concentrations of Ca2+ and Mg2+ in the time rangeof 0 to 400 h. The Boltzmann equation is as follows (1):
y =A1 −A2
1 + ek(t−tmax)(1)
where y represents the deposition amount of Ca2+; A1 and A2 indicate the calculated maximum andminimum Ca2+ concentration, respectively; tmax is the time when the deposition rate reached itsmaximum value; and k represents the average deposition rate constant.
The electroconductivity of the medium was measured in the biomineralization process by anelectroconductivity meter (DDS-11A, Digital conductivity meter, Shanghai Instrument Electric ScienceInstrument Limited by Share Ltd., Shanghai, China).
2.6. Characterization of Minerals
The minerals were washed three times with distilled water, and dried at room temperature for 24 h,then analyzed by scanning electron microscope (SEM, Hitachi S-4800, Japan Hitachi Company, Tokyo,Japan) and energy dispersive spectrometer (EDS, EX-450, Japan Horiba, Japan). The mineral phaseand the crystal structure were analyzed by x-ray diffraction (XRD, D/Max-RC, Rigaku Corporation,Tokyo, Japan) instrument, with a 2θ angle range of 10–90◦, a step size of 0.02, and a count time of8◦ min−1. Rietveld refinement was performed to calculate the mass ratio of minerals in the mixture byusing Material Studio 8.0 software. Minerals were ground sufficiently with an agate mortar, and thepowder was analyzed by high resolution transmission electron microscopy (HRTEM, JEM-2100, JapanElectronics Company, JEOL, Japan) and selected area electron diffraction (SAED). The functional groupsin/on the minerals were also analyzed by Fourier transform infrared spectroscopy (FTIR, Nicolet 380,Thermo Fisher Scientific Inc., Massachusetts, USA) with a scanning range of 5000–400 cm−1 throughthe potassium bromide pressed-disk technique. The biotic and abiotic minerals were ground in anagate mortar. Prior to carbon isotope analysis, the minerals were first soaked in sodium hypochloritefor 24 h to fully remove the organic constituents adsorbed on the surfaces. The stable carbon isotopiccomposition was analyzed by a carbon isotope laser spectrometer (Picarro G2121-i, rPicarro Inc., SantaClara, CA, USA). Organic substances such as beef extract (National Medicine Chemical Reagent Co.Ltd.) and tryptone (Beijing Aoboxing Biotechnology Co. Ltd.) were vacuum dried at −60 ◦C in a freezedryer (FD-1A-50, Shanghai Bilang Instrument Manufacturing Co. Ltd., Shanghai, China), and thenground into powder for carbon isotope analysis.
2.7. EPS and Ultrathin Slices of SRB2
Cells in the stationary phase were collected by centrifugation at 2500 rpm for 15 min. Next,the precipitated cells were washed with HBSS solution more than three times to remove the organiccomponents originating from the culture medium. The cells were suspended in HBSS solution andcultured in a water bath at 60 ◦C for 40 min, then centrifuged at a speed of 10,000 rpm for 5 min. Thesupernatant was vacuum dried in a freeze dryer at −60 ◦C for 24 h. Finally, the dried EPS powder wasanalyzed by an amino acid analyzer (L-8900, Hitachi, Japan).
Ultrathin slices of SRB2 cells were prepared as follows: the cells were washed three times to removethe medium components with the phosphate buffer (Na2HPO412H2O 20.7472 g/L, NaH2PO42H2O3.1167 g/L, pH 7.2), fixed in 2.5% glutaraldehyde for 2 h, and washed three times with phosphatebuffer, then fixed in 1 mL 1% osmic acid for about 1 h, and finally put into a 4 ◦C refrigerator overnightafter being cleaned three times with phosphate buffer. The next morning, the cells were dehydrated by

Minerals 2019, 9, 526 6 of 23
acetone and the dehydration sequence was as follows: 30% (15 min)–50% (15 min)–70% (15 min)–90%(30 min)–100% (15 min)–100% (15 min). Next, 1 mL of 30% epoxy resin solution was added to embedthe cells. Finally, the samples were cut using a diamond slicing knife for analysis with TEM and SAED(H-7650, Hitachi, Japan).
3. Results and Discussion
3.1. 16S rDNA Identification
The full length of 16S rDNA (KM884945.1) was determined as 1483 bp. The nucleotide sequencehomology remained at 99% when comparing the 16S rDNA sequences of SRB2 with those of 95 strainsbelonging to the species of Bacillus licheniformis in GenBank. The phylogenetic tree shown in Figure 1proved that the SRB2 strain was most closely related to B. licheniformis. Therefore, strain SRB2 wasidentified as B. licheniformis.
Minerals 2019, 9, x FOR PEER REVIEW 6 of 23
The full length of 16S rDNA (KM884945.1) was determined as 1483 bp. The nucleotide sequence homology remained at 99% when comparing the 16S rDNA sequences of SRB2 with those of 95 strains belonging to the species of Bacillus licheniformis in GenBank. The phylogenetic tree shown in Figure 1 proved that the SRB2 strain was most closely related to B. licheniformis. Therefore, strain SRB2 was identified as B. licheniformis.
Figure 1. The phylogenetic tree constructed with a neighbor‐joining method based on the sequence alignment of bacterial 16S rDNA.
3.2. Physiological and Biochemical Characteristics of SRB2 Bacteria
3.2.1. Morphology, Gram Staining, and Ammonia Test
A single colony of B. licheniformis SRB2 was yellow, irregular, and had a diameter of 0.1–0.5 cm after three days of cultivation (Figure S1a). The short‐bar‐shaped bacterium (Figure S1b) was about 1.5 μm in length and 0.7 μm in width, and the EPS around bacterium could also be recognized. The purple color after Gram staining indicated that SRB2 was Gram‐positive bacteria (Figure S1c). After adding Nessler’s reagent, the brown color of the experimental group suggested that SRB2 was able to produce ammonia (Figure S1d).
3.2.2. Growth Curve, CA Activity, the Concentration of NH4+, HCO3− and CO32− Ions, and pH Changes
It was found that SRB2 lived well in a 3% salt concentration, which was similar to the seawater salt concentration (Figure S2). The growth curve of SRB2 could be divided into four phases: the lag phase, the logarithmic phase, the stationary phase, and the decline phase (Figure 2a). The lag growth period was over a time range of 0–6 h, where the cell concentration was almost unchanged, about 0.032–0.035 cfu mL−1 (Figure 2a), however, the pH decreased from 7.2 to 6.9 (Figure 2c). The logarithmic phase was from 6 to 60 h (Figure 2a), where the cell concentration increased sharply from 0.16 to 1.13 cfu mL−1, and the concentration of NH4+ and HCO3‐ ions and CA activity also reached their maximum value of 0.15 mol L−1 (Figure 2a), 0.08 mol L−1 (Figure 2b), and 35 U L−1 (Figure 2a), respectively (Figure 2). Furthermore, the pH gradually increased (Figure 2c). The stationary phase was in a time range of 60–100 h, where the cell concentration was stable at about 1.1 cfu mL−1 (Figure 2a), and the NH4+ concentration was almost unchanged (Figure 2a). From 100th hour, carbonate ions could be detected in the medium (Figure 2b) while the pH still increased rapidly (Figure 2c). During the decline phase, CA activity decreased slowly from 32 to 16 U L−1, HCO3− concentration also decreased, while CO32− concentration and the pH still increased quickly (Figure 2). Interestingly, the ammonium concentration was almost unchanged. The pH value based on NH4+ concentration was lower than that in the experimental group (8.2 ˂ 9.2, Figure 2c), which indicates that the quantity of ammonia released by SRB2 bacteria was not enough to increase the pH to 9.2 and is well consistent with the results of Han et al. [45,46]. While the pH value based on the concentration of HCO3− and CO32− ions was higher than that based on NH4+ concentration and higher than that in the experimental
SRB2 KM884945.1Bacillus licheniformis RK202 (JQ388689.1)
Bacillus subtilis YS52 (KU551251.1)Bacillus subtilis CSL2 (KX281166.1)Bacillus megaterium NBRC (NR 112636.1)
Bacillus anthracis ATCC 14578 (NR 041248.1)Bacillus cereus VD‐7 (MK202350.1)Bacillus cereus WUS16 (KY412779.1)
Halomonas qijiaojingensis YIM (NR 109316.1)Halomonas anticariensis FP35 (NR 029113.1)
75
10077
9999
100
0.0
Figure 1. The phylogenetic tree constructed with a neighbor-joining method based on the sequencealignment of bacterial 16S rDNA.
3.2. Physiological and Biochemical Characteristics of SRB2 Bacteria
3.2.1. Morphology, Gram Staining, and Ammonia Test
A single colony of B. licheniformis SRB2 was yellow, irregular, and had a diameter of 0.1–0.5 cmafter three days of cultivation (Figure S1a). The short-bar-shaped bacterium (Figure S1b) was about1.5 µm in length and 0.7 µm in width, and the EPS around bacterium could also be recognized. Thepurple color after Gram staining indicated that SRB2 was Gram-positive bacteria (Figure S1c). Afteradding Nessler’s reagent, the brown color of the experimental group suggested that SRB2 was able toproduce ammonia (Figure S1d).
3.2.2. Growth Curve, CA Activity, the Concentration of NH4+, HCO3
− and CO32− Ions, and pH
Changes
It was found that SRB2 lived well in a 3% salt concentration, which was similar to the seawatersalt concentration (Figure S2). The growth curve of SRB2 could be divided into four phases: thelag phase, the logarithmic phase, the stationary phase, and the decline phase (Figure 2a). The laggrowth period was over a time range of 0–6 h, where the cell concentration was almost unchanged,about 0.032–0.035 cfu mL−1 (Figure 2a), however, the pH decreased from 7.2 to 6.9 (Figure 2c). Thelogarithmic phase was from 6 to 60 h (Figure 2a), where the cell concentration increased sharply from0.16 to 1.13 cfu mL−1, and the concentration of NH4
+ and HCO3− ions and CA activity also reached
their maximum value of 0.15 mol L−1 (Figure 2a), 0.08 mol L−1 (Figure 2b), and 35 U L−1 (Figure 2a),respectively (Figure 2). Furthermore, the pH gradually increased (Figure 2c). The stationary phase wasin a time range of 60–100 h, where the cell concentration was stable at about 1.1 cfu mL−1 (Figure 2a),and the NH4
+ concentration was almost unchanged (Figure 2a). From 100th hour, carbonate ions couldbe detected in the medium (Figure 2b) while the pH still increased rapidly (Figure 2c). During the

Minerals 2019, 9, 526 7 of 23
decline phase, CA activity decreased slowly from 32 to 16 U L−1, HCO3− concentration also decreased,
while CO32− concentration and the pH still increased quickly (Figure 2). Interestingly, the ammonium
concentration was almost unchanged. The pH value based on NH4+ concentration was lower than
that in the experimental group (8.2 < 9.2, Figure 2c), which indicates that the quantity of ammoniareleased by SRB2 bacteria was not enough to increase the pH to 9.2 and is well consistent with theresults of Han et al. [45,46]. While the pH value based on the concentration of HCO3
− and CO32− ions
was higher than that based on NH4+ concentration and higher than that in the experimental group,
which indicated that pH increase was closely related to the concentration of the HCO3− and CO3
2−
ions, and not only the NH4+ concentration. CA can catalyze the hydration of carbon dioxide to release
a large number of HCO3− and CO3
2− ions, thus resulting in an increase in pH [45,46]. When compared,our results were well consistent with their results.
Minerals 2019, 9, x FOR PEER REVIEW 7 of 23
group, which indicated that pH increase was closely related to the concentration of the HCO3− and CO32− ions, and not only the NH4+ concentration. CA can catalyze the hydration of carbon dioxide to release a large number of HCO3‐ and CO32− ions, thus resulting in an increase in pH [45,46]. When compared, our results were well consistent with their results.
0 50 100 150 200 2 50 300 350
7.0
8.0
9.0
10.0
0.00
0.04
0.08
0.12
0.16
0.20
c
b
NH4+ c
once
ntra
tion
(mol
/L)
a0.00
0.30
0.60
0.90
1.20
(*10- 5)
Stage3Stage2
Cell concentration (cfu/m
L)
Stage1
(*8*108)
0.0
15.0
30.0
45.0
CA
activ
ity (U
/L)
0 .00
0.03
0.06
0.09 HCO3
-
CO32-
Concentration (m
ol/L)
Contro l group Experimental gr oup Carbonate Amm onia
pH v
alue
Time (hour)
Figure 2. Physiological and biochemical characteristics of SRB2. (a) Growth curve of SRB2 and the ammonium concentration; (b) CA activity, and the concentration of carbonate and bicarbonate ions; (c) pH in the control and experimental group, pH based on the NaHCO3 + Na2CO3 solution and NH4+ concentration.
3.3. Ca2+ and Mg2+ Concentration, and the Electroconductivity
From the precipitation curve, it was found that 8% of Ca2+ and 9% of Mg2+ were rapidly deposited just at beginning of growth (Figure 3). In 100 h, 13% of calcium ions and 16% of magnesium ions were precipitated (Figure 3). It could also be seen from the calcium ion sedimentation curve that with the appearance of carbonate ions, the deposition rate also increased significantly from 100 to 216 h. Ca2+ (~95%) and Mg2+ (~50%) in the experimental group were quickly precipitated during this time (Figure 3). The conductivity of the culture medium was also found to be reduced due to the rapid removal of metal cations from solution (Figure 3c).
As shown in Figure 4, the precipitation rates (μg L−1 s−1) of Ca2+ in the experimental groups were 0.93, 0.87, 0.85, 0.83, and 0.79 at Mg/Ca molar ratios of 0, 6, 8, 10, and 12. The deposition rate of Ca2+ gradually decreased with increasing Mg/Ca ratios (Figure 4b). Approximately 50% Mg2+ and 96% Ca2+ (Figure 4a) in the culture medium could be precipitated by B. licheniformis SRB2 through the bio‐precipitation process. The precipitation rates (μg L−1 s−1) of Mg2+ in the experimental groups were 0, 0.18, 0.16, 0.16, and 0.12 at Mg/Ca molar ratios of 0, 6, 8, 10, and 12 (Figure 4b)
Overall, after about 300 h (12.5 days), about 98% of the Ca2+ ions and 50% of the Mg2+ ions in the experimental group had precipitated. This shows that SRB2 has a high precipitation efficiency for calcium and magnesium ions.
Figure 2. Physiological and biochemical characteristics of SRB2. (a) Growth curve of SRB2 and theammonium concentration; (b) CA activity, and the concentration of carbonate and bicarbonate ions;(c) pH in the control and experimental group, pH based on the NaHCO3 + Na2CO3 solution andNH4
+ concentration.
3.3. Ca2+ and Mg2+ Concentration, and the Electroconductivity
From the precipitation curve, it was found that 8% of Ca2+ and 9% of Mg2+ were rapidly depositedjust at beginning of growth (Figure 3). In 100 h, 13% of calcium ions and 16% of magnesium ionswere precipitated (Figure 3). It could also be seen from the calcium ion sedimentation curve that withthe appearance of carbonate ions, the deposition rate also increased significantly from 100 to 216 h.Ca2+ (~95%) and Mg2+ (~50%) in the experimental group were quickly precipitated during this time(Figure 3). The conductivity of the culture medium was also found to be reduced due to the rapidremoval of metal cations from solution (Figure 3c).

Minerals 2019, 9, 526 8 of 23Minerals 2019, 9, x FOR PEER REVIEW 8 of 23
Figure 3. Ca2+ concentration (a); Mg2+ concentration (b); and electroconductivity (c) in the medium inoculated with SRB2 bacteria.
3.4. The Extra‐ and Intra‐ Cellular Precipitation of Ca2+ and Mg2+ Ions, and Biominerals Induced by SRB2
In an alkaline environment, the dissolved calcium and magnesium ions precipitated in the form of several kinds of biominerals with unique characteristics under the influence of SRB2 activity, while there were no minerals in the abiotic control groups at pH of 6.0 and 7.2. In the abiotic experiments at pH 8.0 and 9.2, it was found that, at a Mg/Ca ratio of 0, a large number of minerals with complex rhombohedrons were formed and a few minerals had an elongated and spherical shape, while at other Mg/Ca ratios, the precipitates were irregular and rough (Figure S3). Organic elements such as P, S, and N could not be detected (Figure S4).
0 6 8 10 120
20
40
60
80
100 Mg Ca
Pre
cipi
tatio
n ra
tio o
f ion
s (%
)
Mg/Ca molar ratio
a
0 6 8 10 12
0.0
0.2
0.4
0.6
0.8
1.0
Prec
ipita
tion
rate
(mg
L-1 s
-1)
Mg/Ca molar ratio
b
Figure 4. Precipitation ratio (a) and precipitation rate (b) of Ca2+ and Mg2+ ions.
3.4.1. Extracellular Biominerals
At the Mg/Ca ratio of 0, the minerals in the experimental group were calcite (95%) and vaterite (5%) (Figures 5 and S4), and had a spherical and dumbbell morphology (Figure 6a), which mainly
0
100
200
300
400
0
1000
2000
3000
0 50 100 150 200 250 300 350 400
6
9
12
15
18
Mg/Ca=0 Mg/Ca=6 Mg/Ca=8 Mg/Ca=10 Mg/Ca=12
Ca2+
con
cent
ratio
n (m
g/L)
a M
g2+ c
once
ntra
tion
(mg/
L) b
Con
duct
ivity
(m⋅S
⋅cm
-1)
Time (hour)
c
Figure 3. Ca2+ concentration (a); Mg2+ concentration (b); and electroconductivity (c) in the mediuminoculated with SRB2 bacteria.
As shown in Figure 4, the precipitation rates (µg L−1 s−1) of Ca2+ in the experimental groupswere 0.93, 0.87, 0.85, 0.83, and 0.79 at Mg/Ca molar ratios of 0, 6, 8, 10, and 12. The deposition rate ofCa2+ gradually decreased with increasing Mg/Ca ratios (Figure 4b). Approximately 50% Mg2+ and96% Ca2+ (Figure 4a) in the culture medium could be precipitated by B. licheniformis SRB2 throughthe bio-precipitation process. The precipitation rates (µg L−1 s−1) of Mg2+ in the experimental groupswere 0, 0.18, 0.16, 0.16, and 0.12 at Mg/Ca molar ratios of 0, 6, 8, 10, and 12 (Figure 4b)
Minerals 2019, 9, x FOR PEER REVIEW 8 of 23
Figure 3. Ca2+ concentration (a); Mg2+ concentration (b); and electroconductivity (c) in the medium inoculated with SRB2 bacteria.
3.4. The Extra‐ and Intra‐ Cellular Precipitation of Ca2+ and Mg2+ Ions, and Biominerals Induced by SRB2
In an alkaline environment, the dissolved calcium and magnesium ions precipitated in the form of several kinds of biominerals with unique characteristics under the influence of SRB2 activity, while there were no minerals in the abiotic control groups at pH of 6.0 and 7.2. In the abiotic experiments at pH 8.0 and 9.2, it was found that, at a Mg/Ca ratio of 0, a large number of minerals with complex rhombohedrons were formed and a few minerals had an elongated and spherical shape, while at other Mg/Ca ratios, the precipitates were irregular and rough (Figure S3). Organic elements such as P, S, and N could not be detected (Figure S4).
0 6 8 10 120
20
40
60
80
100 Mg Ca
Pre
cipi
tatio
n ra
tio o
f ion
s (%
)
Mg/Ca molar ratio
a
0 6 8 10 12
0.0
0.2
0.4
0.6
0.8
1.0
Prec
ipita
tion
rate
(mg
L-1 s
-1)
Mg/Ca molar ratio
b
Figure 4. Precipitation ratio (a) and precipitation rate (b) of Ca2+ and Mg2+ ions.
3.4.1. Extracellular Biominerals
At the Mg/Ca ratio of 0, the minerals in the experimental group were calcite (95%) and vaterite (5%) (Figures 5 and S4), and had a spherical and dumbbell morphology (Figure 6a), which mainly
0
100
200
300
400
0
1000
2000
3000
0 50 100 150 200 250 300 350 400
6
9
12
15
18
Mg/Ca=0 Mg/Ca=6 Mg/Ca=8 Mg/Ca=10 Mg/Ca=12
Ca2+
con
cent
ratio
n (m
g/L)
a
Mg2+
con
cent
ratio
n (m
g/L) b
C
ondu
ctiv
ity (m
⋅S⋅c
m-1)
Time (hour)
c
Figure 4. Precipitation ratio (a) and precipitation rate (b) of Ca2+ and Mg2+ ions.
Overall, after about 300 h (12.5 days), about 98% of the Ca2+ ions and 50% of the Mg2+ ions inthe experimental group had precipitated. This shows that SRB2 has a high precipitation efficiency forcalcium and magnesium ions.

Minerals 2019, 9, 526 9 of 23
3.4. The Extra- and Intra- Cellular Precipitation of Ca2+ and Mg2+ Ions, and Biominerals Induced by SRB2
In an alkaline environment, the dissolved calcium and magnesium ions precipitated in the formof several kinds of biominerals with unique characteristics under the influence of SRB2 activity, whilethere were no minerals in the abiotic control groups at pH of 6.0 and 7.2. In the abiotic experimentsat pH 8.0 and 9.2, it was found that, at a Mg/Ca ratio of 0, a large number of minerals with complexrhombohedrons were formed and a few minerals had an elongated and spherical shape, while at otherMg/Ca ratios, the precipitates were irregular and rough (Figure S3). Organic elements such as P, S, andN could not be detected (Figure S4).
3.4.1. Extracellular Biominerals
At the Mg/Ca ratio of 0, the minerals in the experimental group were calcite (95%) and vaterite(5%) (Figure 5 and Figure S4), and had a spherical and dumbbell morphology (Figure 6a), which mainlycontained C, O, Ca, and P elements (Figure 6e). In the biotic calcite crystal, (217) lattice fringes were incontact with (128) lattice fringes at an angle of about 62.26◦((217)∧(128)), indicating that there weremany dislocations due to the involvement of SRB2 (Figure 6c and Figure S5). This change in crystalstructure was one of the signs that proved the biogenesis of the minerals. Interestingly, the bacterialcell in the experimental group was surrounded by a mineralized shell with a chemical composition ofCaCO3 (Figure 6b). Vaterite is a type of unstable anhydrous calcium carbonate, and easily transformsinto the most stable calcite [46]. However, when organic factors take part in the formation process ofvaterite, this stability increases [47]. Figures 5 and 6d show the presence of vaterite. According to theabove references, we could infer that the organic factor SRB2 bacteria in the experimental group maybe one reason why vaterite became more stable. The exterior structure of the bacterium could influencethe mineralization process. It has been reported that the decrease of nucleation energy caused by thefunctional groups on the bacterial surface could induce the mineralization process more easily [48].Additionally, organic matters secreted by the bacteria played a key role in the regulation of the mineralmorphology and phases [45,49,50]. A number of studies have confirmed that some amino acids havean ability to promote the formation of vaterite crystals [51–54]. Therefore, in this study, amino acids onthe peptidoglycan of the SRB2 bacterial cell wall may have had a close relationship with the formationof vaterite at the Mg/Ca molar ratio of 0.
Minerals 2019, 9, x FOR PEER REVIEW 9 of 23
contained C, O, Ca, and P elements (Figure 6e). In the biotic calcite crystal, (217) lattice fringes were in contact with (128) lattice fringes at an angle of about 62.26°((217)∧(128)), indicating that there were many dislocations due to the involvement of SRB2 (Figures 6c and S5). This change in crystal structure was one of the signs that proved the biogenesis of the minerals. Interestingly, the bacterial cell in the experimental group was surrounded by a mineralized shell with a chemical composition of CaCO3 (Figure 6b). Vaterite is a type of unstable anhydrous calcium carbonate, and easily transforms into the most stable calcite [46]. However, when organic factors take part in the formation process of vaterite, this stability increases [47]. Figures 5 and 6d show the presence of vaterite. According to the above references, we could infer that the organic factor SRB2 bacteria in the experimental group may be one reason why vaterite became more stable. The exterior structure of the bacterium could influence the mineralization process. It has been reported that the decrease of nucleation energy caused by the functional groups on the bacterial surface could induce the mineralization process more easily [48]. Additionally, organic matters secreted by the bacteria played a key role in the regulation of the mineral morphology and phases [45,49,50]. A number of studies have confirmed that some amino acids have an ability to promote the formation of vaterite crystals [51–54]. Therefore, in this study, amino acids on the peptidoglycan of the SRB2 bacterial cell wall may have had a close relationship with the formation of vaterite at the Mg/Ca molar ratio of 0.
At Mg/Ca ratios of 6 and 8, the minerals were ellipsoid‐shaped monohydrocalcite (100%, Figures S5b,c) with a rough surface (Figures 5 and 6f,i), which mainly contained C, O, Ca and P elements (Figure 6j). EPS and the survived bacterial cell could be clearly recognized (Figures 6g,h).
At Mg/Ca ratios of 10 and 12, a mixture of columnar nesquehonite and ellipsoid‐shaped monohydrocalcite (Figures 5 and 6k–m) was formed. The mass ratio of nesquehonite increased from 85.5% to 90.5% when the Mg/Ca ratio changed from 10 to 12, and that of monohydrocalcite decreased from 14.5% to 9.5% (Figures S5d,e). (002) preferred orientated nesquehonite (Figure 5) was the other characteristics that proved the biogenesis of minerals, resulting in significant elongation morphology (Figure 6k). The elemental composition of nesquehonite included C, O, Mg, and P, and that of monohydrocalcite consisted of C, O, and Ca in addition to a little Mg and P (Figures 6n,o).
10 20 30 40 50 60
mn
m
n
n m
mm
n
nn
n
n
m
nn
m
mmmm mm
mm
ccv
Inte
nsity
(a.u
.)
2 Theta Degree
0
6810
12
c c c
n=nesquehonitem=monohydrocalcitec=calcitev=vateritePreferred
orientation
(002
)
Figure 5. X‐ray diffraction analyses of the biominerals cultured for 12 days at different Mg/Ca molar ratios.
The nucleation and growth of the nesquehonite crystal was promoted because of the existence of the SRB2 bacteria due to the fact that SRB2 bacteria increased the pH value of the culture medium from 7.2 to 9.2. Microorganisms often promote the formation of highly supersaturated microenvironments to facilitate the precipitation of carbonates. Furthermore, the EPS of bacterial cells could absorb Ca2+, Mg2+, or other metallic cations to act as the nucleation sites, even when supersaturation has not been reached in the surrounding environment [55]. Nucleation and growth of the nesquehonite crystals occurred in an organic environment rich in SRB2 bacteria and
Figure 5. X-ray diffraction analyses of the biominerals cultured for 12 days at different Mg/Camolar ratios.

Minerals 2019, 9, 526 10 of 23
Minerals 2019, 9, x FOR PEER REVIEW 10 of 23
metabolites, indicating that microbial mediation is an active process and can influence the morphology and crystal structure.
In fact, the mineral precipitation process mediated by organic components occupies an important position in both present and ancient environments [56–70]. The adsorption of Ca2+ and Mg2+ ions on the bacterial cell surface is the initial step of biomineralization. The ion adsorption ability of bacteria is mainly caused by the surface charge and zeta‐potential [71]. It has been reported that different functional groups on the surface of bacteria such as hydroxyl, carboxyl, phosphoryl, and amide groups can contribute to this nucleation process [48,49]. In a previous study, it was found that some bacteria can preferentially adsorb Mg2+ on their membranes to induce the formation of dolomite, and others adsorb Ca2+ to induce calcite [29]. However, in our study, the mineral formed by SRB2 bacteria was not dolomite, but nesquehonite. With the increasing Mg2+ ion concentration, SRB2 could break down the hydrated membrane around the Mg2+ ion [43] to promote the nucleation of Mg2+ on the cell surface, leading to the formation of nesquehonite. The extracellular nucleation process not only contributed to the precipitation of Mg2+ ions on the cell surface, but also to that of Ca2+ ions. With increasing Mg/Ca ratios, Mg2+ ions took up more nucleation sites than the Ca2+ ions, leading to the formation of the nesquehonite mineral.
Figure 6. Scanning electron microscope, energy spectrum, high resolution transmission electron microscope, and selected area electron diffraction images of the minerals cultured for 12 days in the experimental groups at Mg/Ca ratios of 0 (a–e), 6 (f), 8 (g–j), 10 (k), and 12 (l–o).
3.4.2. Intracellular Amorphous Inclusions
If green fluorescence can be emitted when using Fluo‐3AM as an indicator of the Ca2+ ion, the presence of Ca2+ inside the cells can be determined. However, one thing to note is that the cells themselves do not emit fluorescence. The results showed that the cells emitting green fluorescence at different Mg/Ca molar ratios (Figures 7a–e), indicating that there was a large number of Ca2+ ions inside the cells. The control group (Figure 7f) without Fluo‐3AM could not emit the green fluorescence, suggesting that the cells themselves did not emit spontaneous fluorescence. The fluorescence intensity of Ca2+ inside the cell decreased from 130 cps to 90 cps when the Mg/Ca ratio increased from 0 to 12 (Figure 7g), namely, the intracellular Ca2+ concentration decreased with increasing Mg/Ca ratios, indicating that Mg2+ ions could interfere with the transport of Ca2+ ions from the outside to inside the cell. The reason may be that, with increasing Mg2+ concentration (from 0 to 0.12 M), more Mg2+ ions could enter the cell by diffusion through ion channels due to the smaller size of Mg2+ than that of Ca2+ ions. Mg2+ ions can occupy the sites of Ca2+ ions in the Ca2+ channel, resulting
Figure 6. Scanning electron microscope, energy spectrum, high resolution transmission electronmicroscope, and selected area electron diffraction images of the minerals cultured for 12 days in theexperimental groups at Mg/Ca ratios of 0 (a–e), 6 (f), 8 (g–j), 10 (k), and 12 (l–o).
At Mg/Ca ratios of 6 and 8, the minerals were ellipsoid-shaped monohydrocalcite (100%, FigureS5b,c) with a rough surface (Figure 5f,i), which mainly contained C, O, Ca and P elements (Figure 6j).EPS and the survived bacterial cell could be clearly recognized (Figure 6g,h).
At Mg/Ca ratios of 10 and 12, a mixture of columnar nesquehonite and ellipsoid-shapedmonohydrocalcite (Figures 5 and 6k–m) was formed. The mass ratio of nesquehonite increasedfrom 85.5% to 90.5% when the Mg/Ca ratio changed from 10 to 12, and that of monohydrocalcitedecreased from 14.5% to 9.5% (Figure S5d,e). (002) preferred orientated nesquehonite (Figure 5) wasthe other characteristics that proved the biogenesis of minerals, resulting in significant elongationmorphology (Figure 6k). The elemental composition of nesquehonite included C, O, Mg, and P, andthat of monohydrocalcite consisted of C, O, and Ca in addition to a little Mg and P (Figure 6n,o).
The nucleation and growth of the nesquehonite crystal was promoted because of the existence ofthe SRB2 bacteria due to the fact that SRB2 bacteria increased the pH value of the culture medium from7.2 to 9.2. Microorganisms often promote the formation of highly supersaturated microenvironmentsto facilitate the precipitation of carbonates. Furthermore, the EPS of bacterial cells could absorb Ca2+,Mg2+, or other metallic cations to act as the nucleation sites, even when supersaturation has not beenreached in the surrounding environment [55]. Nucleation and growth of the nesquehonite crystalsoccurred in an organic environment rich in SRB2 bacteria and metabolites, indicating that microbialmediation is an active process and can influence the morphology and crystal structure.
In fact, the mineral precipitation process mediated by organic components occupies an importantposition in both present and ancient environments [56–70]. The adsorption of Ca2+ and Mg2+ ions onthe bacterial cell surface is the initial step of biomineralization. The ion adsorption ability of bacteriais mainly caused by the surface charge and zeta-potential [71]. It has been reported that differentfunctional groups on the surface of bacteria such as hydroxyl, carboxyl, phosphoryl, and amide groupscan contribute to this nucleation process [48,49]. In a previous study, it was found that some bacteriacan preferentially adsorb Mg2+ on their membranes to induce the formation of dolomite, and othersadsorb Ca2+ to induce calcite [29]. However, in our study, the mineral formed by SRB2 bacteria was notdolomite, but nesquehonite. With the increasing Mg2+ ion concentration, SRB2 could break down thehydrated membrane around the Mg2+ ion [43] to promote the nucleation of Mg2+ on the cell surface,

Minerals 2019, 9, 526 11 of 23
leading to the formation of nesquehonite. The extracellular nucleation process not only contributed tothe precipitation of Mg2+ ions on the cell surface, but also to that of Ca2+ ions. With increasing Mg/Caratios, Mg2+ ions took up more nucleation sites than the Ca2+ ions, leading to the formation of thenesquehonite mineral.
3.4.2. Intracellular Amorphous Inclusions
If green fluorescence can be emitted when using Fluo-3AM as an indicator of the Ca2+ ion, thepresence of Ca2+ inside the cells can be determined. However, one thing to note is that the cellsthemselves do not emit fluorescence. The results showed that the cells emitting green fluorescenceat different Mg/Ca molar ratios (Figure 7a–e), indicating that there was a large number of Ca2+ ionsinside the cells. The control group (Figure 7f) without Fluo-3AM could not emit the green fluorescence,suggesting that the cells themselves did not emit spontaneous fluorescence. The fluorescence intensityof Ca2+ inside the cell decreased from 130 cps to 90 cps when the Mg/Ca ratio increased from 0 to12 (Figure 7g), namely, the intracellular Ca2+ concentration decreased with increasing Mg/Ca ratios,indicating that Mg2+ ions could interfere with the transport of Ca2+ ions from the outside to insidethe cell. The reason may be that, with increasing Mg2+ concentration (from 0 to 0.12 M), more Mg2+
ions could enter the cell by diffusion through ion channels due to the smaller size of Mg2+ than that ofCa2+ ions. Mg2+ ions can occupy the sites of Ca2+ ions in the Ca2+ channel, resulting in a decreasein the fluorescence intensity of intracellular Ca2+ ions. Therefore, the decrease of intracellular Ca2+
fluorescence intensity was the result of increasing Mg/Ca molar ratios.
Minerals 2019, 9, x FOR PEER REVIEW 11 of 23
in a decrease in the fluorescence intensity of intracellular Ca2+ ions. Therefore, the decrease of intracellular Ca2+ fluorescence intensity was the result of increasing Mg/Ca molar ratios.
In fact, higher concentrations of calcium and magnesium ions are toxic to cells, so cells actively limit calcium and magnesium ions to certain areas (such as vacuoles in plant cells) when these ions enter the cell, resulting in calcium and magnesium concentrations several orders of magnitude higher than in other areas that leads to the formation of amorphous minerals [72]. There were many intracellular nanometer‐scaled inclusions (Figures 8b–e) without any crystalline structure (Figure 8e, inset) in the cells of SRB2, while there were no intracellular inclusions in cells cultured in the medium without any calcium and magnesium (Figure 8a). The EDS results revealed that the area mainly contained C, O, Ca, and Mg elements (U and Os came from the fixing agent) (Figure 8f).
Wavelength (nm)
Mg/Ca=6
g
Mg/Ca=8 Mg/Ca=10 Mg/Ca=12
Mg/Ca=0
510 520 530 540 550 5600
15
30
45
60
75
90
105
120
Flou
renc
e In
tens
ity
seed liqiud seed liqiud
without Fluo-3 AM
Figure 7. Analyses of intracellular Ca2+ fluorescence intensity. (a–e) SRB2 bacteria stained with Fluo‐3AM and analyzed by laser scanning microscopy at Mg/Ca molar ratios of 0, 6, 8, 10, and 12, respectively; (f) SRB2 bacteria without staining with Fluo‐3AM analyzed by laser scanning microscopy; (g) Intracellular Ca2+ fluorescence intensity of SRB2 bacteria analyzed by a fluorescence spectrophotometer.
Microbial intracellular mineralization is a very important process, and even very common in some types of microorganisms [72]. The results of this experiment demonstrated that the presence of intracellular inclusions containing Ca and Mg in SRB2 bacteria also contributed to the decrease in Ca2+ and Mg2+ ions concentrations. In fact, for many microorganisms, extracellular and intracellular biomineralization can occur at the same time [23,45,49,72]. It has been found that many organelles, even nucleic acid, can be involved in the intracellular biomineralization process [73]. Phosphorous groups in the cell also contribute to the absorption of Ca2+ and Mg2+, resulting in intracellular biomineralization [74]. It is well known that Magnetospirillum gryphiswaltz produces intracellular magnetite nanocrystals and that the biomineralization of magnetite nanocrystals requires several magnetosome‐associated proteins. Generally speaking, intracellular Ca2+ and Mg2+ ions cannot reach a very high concentration due to the need for information transmission and life activities. Additionally, the study revealed that intracellular precipitation may be caused by the relatively worse ability to adjust pH and ion concentration in some special area of cells [72]. Therefore, it could be concluded that the intracellular biomineralization of SRB2 also contributed to the decrease of Ca2+ and Mg2+ ion concentrations in the medium. In the environment where both the Ca2+ and Mg2+ ions were present, there would be competition in transport from the outside to inside the cell. In the process, more Mg2+ ions took up the sites of Ca2+ ions in SRB2 cells, and the fluorescence intensity of
Figure 7. Analyses of intracellular Ca2+ fluorescence intensity. (a–e) SRB2 bacteria stainedwith Fluo-3AM and analyzed by laser scanning microscopy at Mg/Ca molar ratios of 0, 6, 8,10, and 12, respectively; (f) SRB2 bacteria without staining with Fluo-3AM analyzed by laserscanning microscopy; (g) Intracellular Ca2+ fluorescence intensity of SRB2 bacteria analyzed bya fluorescence spectrophotometer.
In fact, higher concentrations of calcium and magnesium ions are toxic to cells, so cells activelylimit calcium and magnesium ions to certain areas (such as vacuoles in plant cells) when these ions enterthe cell, resulting in calcium and magnesium concentrations several orders of magnitude higher thanin other areas that leads to the formation of amorphous minerals [72]. There were many intracellularnanometer-scaled inclusions (Figure 8b–e) without any crystalline structure (Figure 8e, inset) in thecells of SRB2, while there were no intracellular inclusions in cells cultured in the medium without any

Minerals 2019, 9, 526 12 of 23
calcium and magnesium (Figure 8a). The EDS results revealed that the area mainly contained C, O, Ca,and Mg elements (U and Os came from the fixing agent) (Figure 8f).Minerals 2019, 9, x FOR PEER REVIEW 13 of 23
Figure 8. High resolution transmission electron microscope, selected area electron diffraction, and energy spectrum analyses of ultrathin slices of B. licheniformis SRB2. (a), SRB2 seed; (b–e), Mg/Ca molar ratios of 6, 8, 10, and 12, respectively; inset in (e), SAED image; (f), EDS analysis of intracellular inclusion.
3.5. The Mechanism of Ca2+, Mg2+ Bio‐Precipitation Induced by SRB2
In order to further understand the process of microbially induced bio‐precipitation of carbonate minerals and the role of microbial organic matter in the process of biomineral formation, the stable carbon isotope composition of biotic minerals, abiotic minerals, organic and inorganic components in the medium was analyzed. Furthermore, FTIR analysis of the biominerals was performed, and at the same time, the bacterial EPS were extracted to analyze the amino acid composition.
3.5.1. Carbon Source for Bio‐Precipitation
It can be seen from Table 1 that the carbon isotope values (δ13C, PDB) of the biominerals ranged from −16.12‰ to −18.01‰. The carbon isotope values of abiotic minerals at a Mg/Ca ratio of 0 (pH = 8.0, 9.2) were basically the same as those of the inorganic components NaHCO3 and Na2CO3 (especially Na2CO3), indicating that the carbon sources of abiotic minerals were all derived from Na2CO3 (~13‰). At the same time, it can be seen that the isotope values of the biotic minerals were more negative than those of the abiotic minerals and the inorganic components, which indicates that the carbon sources of the microbially induced biominerals are complex.
Table 1. δ13CPDB (‰) values for minerals and organic compounds in the experimental groups.
Mg/Ca Biominer
al Abiotic mineral
Beef extract Tryptone NaHCO3 Na2CO3 Air[78]
0 −16.54 ±
0.12 −13.25 ± 0.22
−18.14 ± 0.11
−21.52 ± 0.13
−14.25 ± 0.09
−13.36 ± 0.12 −8 6
−17.55 ± 0.05 ‐
8 −17.38 ±
0.08 ‐
Figure 8. High resolution transmission electron microscope, selected area electron diffraction, andenergy spectrum analyses of ultrathin slices of B. licheniformis SRB2. (a), SRB2 seed; (b–e), Mg/Ca molarratios of 6, 8, 10, and 12, respectively; inset in (e), SAED image; (f), EDS analysis of intracellular inclusion.
Microbial intracellular mineralization is a very important process, and even very common insome types of microorganisms [72]. The results of this experiment demonstrated that the presenceof intracellular inclusions containing Ca and Mg in SRB2 bacteria also contributed to the decrease inCa2+ and Mg2+ ions concentrations. In fact, for many microorganisms, extracellular and intracellularbiomineralization can occur at the same time [23,45,49,72]. It has been found that many organelles,even nucleic acid, can be involved in the intracellular biomineralization process [73]. Phosphorousgroups in the cell also contribute to the absorption of Ca2+ and Mg2+, resulting in intracellularbiomineralization [74]. It is well known that Magnetospirillum gryphiswaltz produces intracellularmagnetite nanocrystals and that the biomineralization of magnetite nanocrystals requires severalmagnetosome-associated proteins. Generally speaking, intracellular Ca2+ and Mg2+ ions cannot reacha very high concentration due to the need for information transmission and life activities. Additionally,the study revealed that intracellular precipitation may be caused by the relatively worse ability toadjust pH and ion concentration in some special area of cells [72]. Therefore, it could be concludedthat the intracellular biomineralization of SRB2 also contributed to the decrease of Ca2+ and Mg2+ ionconcentrations in the medium. In the environment where both the Ca2+ and Mg2+ ions were present,there would be competition in transport from the outside to inside the cell. In the process, more Mg2+
ions took up the sites of Ca2+ ions in SRB2 cells, and the fluorescence intensity of intracellular Ca2+ ionsalso declined. The decreased Ca2+ and Mg2+ ions caused by a single SRB2 cell may be tiny, however,the number of SRB2 cells was very large, thus, the intracellular biomineralization induced by SRB2also played a great role in the precipitation of Ca2+ and Mg2+ ions.
We assumed that the average volume of a single cell was Vs, the average radius of the inclusionswas r1, the total number of cells in the medium was N, the average number of inclusions in a cell wasn, the density of the inclusion was ρ, and the molar mass of inclusions was M. It was approximatelyconsidered that 1 mol of the inclusions contained 1 mol of calcium and magnesium ions, respectively.

Minerals 2019, 9, 526 13 of 23
Thus, the total volume of inclusions was ((2)–(7)):
V = vs·N·n (2)
vs =43πr1
3 (3)
N = ODmax·8·108 (4)
V =43πr3·ODmax·8·108
·n = 1.06·109·πr3·ODmax·n (5)
The total moles of inclusions are:
ω =V·ρM
(6)
ω1 =1.06·109
·πr3·ODmax·n·ρ
M= 1.29·10−9mol (7)
where r1 = 20 nm; r2 = 1 µm; γmax = 90 nM, ODmax = 1.1; n = 1; ρ= 2.93 g/cm3 (typical ACC density [75]);and M = 100.1 g/mol (typical ACC molar mass [75]). The results of the EDS showed that the inclusionscontained basically the same calcium and magnesium ions. In addition to the calcium and magnesiumions that were immobilized in the inclusions, the free ions inside the cells also needed to be calculated.According to the published data on Bacillus subtilis [76], we set the maximum value of intracellularcalcium ions concentration as 90 nM, while the maximum concentration of magnesium ions was 10mM [77].
The total volume of the cells is:Vcell =
43πr2
3·N (8)
The number of moles of intracellular free calcium ions is:
ω2 = γmax·Vcell = γmax·43πr2
3·N = 3.31·10−13 mol (9)
The number of moles of intracellular free magnesium ions is:
ω3 = γmax·Vcell = γmax·43πr2
3·N = 3.68·10−11 mol (10)
where r2 = 1 µm; γmax of Ca2+ = 90 nM; γmax of Mg2+ = 10 mM; and ODmax = 1.1. Based on theintracellular calcium ion fluorescence intensity, we can see that the concentration of intracellularcalcium and magnesium ions varies under different culture conditions (Figure 7). The calculationslimit the maximum amount of calcium and magnesium ions that can be precipitated by the cells.For calcium ions, the maximum amount of precipitation occurs when the Mg/Ca ratio was zero. Formagnesium ions, the maximum precipitation amount occurred when the Mg/Ca ratio was 12. Thecalculated results show that the intracellular process also contributes to the precipitation of calciumand magnesium ions as shown in Equations (8)–(10).
3.5. The Mechanism of Ca2+, Mg2+ Bio-Precipitation Induced by SRB2
In order to further understand the process of microbially induced bio-precipitation of carbonateminerals and the role of microbial organic matter in the process of biomineral formation, the stablecarbon isotope composition of biotic minerals, abiotic minerals, organic and inorganic components inthe medium was analyzed. Furthermore, FTIR analysis of the biominerals was performed, and at thesame time, the bacterial EPS were extracted to analyze the amino acid composition.

Minerals 2019, 9, 526 14 of 23
3.5.1. Carbon Source for Bio-Precipitation
It can be seen from Table 1 that the carbon isotope values (δ13C, PDB) of the biominerals rangedfrom −16.12%� to −18.01%�. The carbon isotope values of abiotic minerals at a Mg/Ca ratio of 0 (pH =
8.0, 9.2) were basically the same as those of the inorganic components NaHCO3 and Na2CO3 (especiallyNa2CO3), indicating that the carbon sources of abiotic minerals were all derived from Na2CO3 (~13%�).At the same time, it can be seen that the isotope values of the biotic minerals were more negative thanthose of the abiotic minerals and the inorganic components, which indicates that the carbon sources ofthe microbially induced biominerals are complex.
Table 1. δ13CPDB (%�) values for minerals and organic compounds in the experimental groups.
Mg/Ca Biomineral Abiotic Mineral Beef Extract Tryptone NaHCO3 Na2CO3 Air [78]
0 −16.54 ± 0.12 −13.25 ± 0.22
−18.14 ± 0.11 −21.52 ± 0.13 −14.25 ± 0.09 −13.36 ± 0.12 −86 −17.55 ± 0.05 -
8 −17.38 ± 0.08 -
10 −18.01 ± 0.13 -
12 −16.12 ± 0.62 -
The isotope value of atmospheric carbon dioxide was approximately −8%� and the organiccompounds in the culture medium had a δ13C value of −18%�–−21%�. The isotope values forthe biominerals ranged between the value of atmospheric carbon dioxide and those of the organiccomponents, indicating that the biominerals had complex carbon sources and the decompositionof organic matter caused by SRB2 bacteria may play an important role in the stable carbon isotopecomposition. Due to the more negative carbon isotope values of the biominerals, the carbon was morelikely to derive from the degradation and utilization of organic matter in the medium by SRB2 bacteria.The process of carbon in the organic matter transported to the biominerals involved both intracellularand extracellular processes. The microorganism degraded the organic matters containing polypeptidein the medium to smaller molecules that could be transported into the cell to supply the carbon andnitrogen resources for bacterial metabolism. Under the action of bacterial respiration, these smallermolecules of organic substances could be transformed into the metabolites, the most common productof which was carbon dioxide. This is because this carbon dioxide came not from the air, but from themetabolism of organic matter by microorganisms. The high concentration of carbon dioxide releasedby SRB2 was rapidly converted into CO3
2− and HCO3− under the action of extracellular carbonic
anhydrase. CO32− and HCO3
− ions combined with calcium ions under alkaline conditions could formminerals rapidly by relying on EPS as the nucleation sites. This result further explains the reason forthe more negative carbon isotope values of the biominerals than those of the inorganic minerals.
3.5.2. Nucleation Sites of Extracellular Biominerals
Interestingly, the mineralized shell with a chemical composition of CaCO3 was found to surroundthe bacterial cell (Figure 9). SRB2 bacteria play an important role in the formation of these mineralizedshells. The components and structures of the cell surface strongly influenced the final result of themineralization process. It has been reported that the decrease of nucleation energy caused by thefunctional groups on the bacterial surface could induce the mineralization process more easily [42].Perhaps, this was the main reason for the formation of the mineralized shells. In fact, the occurrenceof the mineralized shell surrounding the cell also suggests that the EPS of SRB2 bacteria could act asnucleation sites. From the ultrathin slices of SRB2, it was also found that the mineral particles on theEPS, with an elemental composition of Ca, Mg, O, and C (Os and U came from the fixation process,Figure 10), had a weak crystalline structure due to the presence of the diffraction spots (Figure 10b,inset). This point also confirmed the fact that EPS acted as the nucleation sites.

Minerals 2019, 9, 526 15 of 23Minerals 2019, 9, x FOR PEER REVIEW 15 of 23
Figure 9. Scanning electron microscope images of the mineralized shells and SRB2 bacteria in the culture medium at different Mg/Ca molar ratios. (a–c) Mg/Ca = 0; (d) EDS analysis; (e–h) Mg/Ca = 6, 8, 10, and 12, respectively.
It has already been verified that the EPS secreted by microorganisms can serve as the nucleation sites for biominerals [79]. These organic matters can promote the transportation of electrons and protons between the bacteria and the ambient environment [80,81]. Therefore, there would be a large number of microcrystalline minerals precipitated on the EPS after adsorbing the Ca2+, Mg2+, HCO3−, and CO32− ions [37,82]. The microcrystalline CaCO3 particles gradually grew and were piled together to form the carbonate mineral shell, and then the SRB2 bacterium was wrapped; however, the bacterium was still alive due to a hole present in the terminal of the shell that enabled the bacterium to communicate with the environment (Figure 9a). The mineralization process driven by the mineral nucleation on the EPS can make the microorganism itself be encased by a carbonate layer [83,84]. In this study, SRB2 bacteria were surrounded by rod‐shaped shells composed of a large number of nanometer microcrystalline minerals (Figure 9b). The inner diameter of the fractured mineral shell was approximately 0.5 μm, consistent with the width of a SRB2 bacterium. Figure 9d clearly shows that these mineral shells were composed of numerous nanometer‐sized mineral grains. The reason for the shrinkage of the SRB2 cell might be related to the high concentration of salt, which can make the cells lose water to shrink.
Figure 9. Scanning electron microscope images of the mineralized shells and SRB2 bacteria in theculture medium at different Mg/Ca molar ratios. (a–c) Mg/Ca = 0; (d) EDS analysis; (e–h) Mg/Ca = 6, 8,10, and 12, respectively.
Minerals 2019, 9, x FOR PEER REVIEW 15 of 23
Figure 9. Scanning electron microscope images of the mineralized shells and SRB2 bacteria in the culture medium at different Mg/Ca molar ratios. (a–c) Mg/Ca = 0; (d) EDS analysis; (e–h) Mg/Ca = 6, 8, 10, and 12, respectively.
It has already been verified that the EPS secreted by microorganisms can serve as the nucleation sites for biominerals [79]. These organic matters can promote the transportation of electrons and protons between the bacteria and the ambient environment [80,81]. Therefore, there would be a large number of microcrystalline minerals precipitated on the EPS after adsorbing the Ca2+, Mg2+, HCO3−, and CO32− ions [37,82]. The microcrystalline CaCO3 particles gradually grew and were piled together to form the carbonate mineral shell, and then the SRB2 bacterium was wrapped; however, the bacterium was still alive due to a hole present in the terminal of the shell that enabled the bacterium to communicate with the environment (Figure 9a). The mineralization process driven by the mineral nucleation on the EPS can make the microorganism itself be encased by a carbonate layer [83,84]. In this study, SRB2 bacteria were surrounded by rod‐shaped shells composed of a large number of nanometer microcrystalline minerals (Figure 9b). The inner diameter of the fractured mineral shell was approximately 0.5 μm, consistent with the width of a SRB2 bacterium. Figure 9d clearly shows that these mineral shells were composed of numerous nanometer‐sized mineral grains. The reason for the shrinkage of the SRB2 cell might be related to the high concentration of salt, which can make the cells lose water to shrink.
Figure 10. Weak crystalline minerals on the extracellular polymeric substances of SRB2. (a–c) Mineralson EPS of bacteria at Mg/Ca = 6, 10, and 12, respectively; the inset in (b) is the SAED image, showingthe weak crystalline structure of the minerals on EPS; (d) EDS analysis of the selected area.
It has already been verified that the EPS secreted by microorganisms can serve as the nucleationsites for biominerals [79]. These organic matters can promote the transportation of electrons andprotons between the bacteria and the ambient environment [80,81]. Therefore, there would be alarge number of microcrystalline minerals precipitated on the EPS after adsorbing the Ca2+, Mg2+,HCO3
−, and CO32− ions [37,82]. The microcrystalline CaCO3 particles gradually grew and were piled
together to form the carbonate mineral shell, and then the SRB2 bacterium was wrapped; however, thebacterium was still alive due to a hole present in the terminal of the shell that enabled the bacterium tocommunicate with the environment (Figure 9a). The mineralization process driven by the mineralnucleation on the EPS can make the microorganism itself be encased by a carbonate layer [83,84].In this study, SRB2 bacteria were surrounded by rod-shaped shells composed of a large number ofnanometer microcrystalline minerals (Figure 9b). The inner diameter of the fractured mineral shellwas approximately 0.5 µm, consistent with the width of a SRB2 bacterium. Figure 9d clearly shows

Minerals 2019, 9, 526 16 of 23
that these mineral shells were composed of numerous nanometer-sized mineral grains. The reason forthe shrinkage of the SRB2 cell might be related to the high concentration of salt, which can make thecells lose water to shrink.
3.5.3. Precipitation Controlled by Amino Acids and Organic Functional Groups
Figure 11 shows the FTIR spectra of the biominerals induced by SRB2 after 300 h of cultivation atdifferent Mg/Ca molar ratios. Aside from the characteristic peaks of the biominerals (Figure S7), manyorganic functional groups could also be found, as seen in Figure 11, including C=O (1710 cm−1), C–O–C(1091 cm−1), and P–O (1030, 736 cm−1), which may have originated from the EPS, metabolites, and thebacterium itself. These organic molecules were incorporated into the mineral during the process ofcrystal nucleation and growth. In fact, in previous studies, it was found that the functional groups oforganic matters had an obvious influence on the formation of minerals [85], and also influenced themorphology. Some organic functional groups (hydroxyl, carboxyl, phosphoryl, and amide groups)contributed to the combination of metal ions and EPS.
Minerals 2019, 9, x FOR PEER REVIEW 16 of 23
Figure 10. Weak crystalline minerals on the extracellular polymeric substances of SRB2. (a–c) Minerals on EPS of bacteria at Mg/Ca = 6, 10, and 12, respectively; the inset in (b) is the SAED image, showing the weak crystalline structure of the minerals on EPS; (d) EDS analysis of the selected area.
3.5.3. Precipitation Controlled by Amino Acids and Organic Functional Groups
Figure 11 shows the FTIR spectra of the biominerals induced by SRB2 after 300 h of cultivation at different Mg/Ca molar ratios. Aside from the characteristic peaks of the biominerals (Figure S7), many organic functional groups could also be found, as seen in Figure 11, including C=O (1710 cm−1), C–O–C (1091 cm−1), and P–O (1030, 736 cm−1), which may have originated from the EPS, metabolites, and the bacterium itself. These organic molecules were incorporated into the mineral during the process of crystal nucleation and growth. In fact, in previous studies, it was found that the functional groups of organic matters had an obvious influence on the formation of minerals [85], and also influenced the morphology. Some organic functional groups (hydroxyl, carboxyl, phosphoryl, and amide groups) contributed to the combination of metal ions and EPS.
2000 1800 1600 1400 1200 1000 800 600
P-OP-OC-O-CNH2
12108
6
Tran
smitt
ance
(a.u
.)
W avenum ber (cm -1)
0 C=O
1710 1638 1094 1030 736
Figure 11. Fourier transform infrared analyses of the organic functional groups from biominerals at different Mg/Ca ratios.
In fact, Ca2+ and Mg2+ ions are usually wrapped by water molecules, and once the combination energy barrier of the water molecules was overcome, the Ca2+ and Mg2+ ions could be precipitated. There is also competition for nucleation sites between Mg2+ and Ca2+. According to the higher combination energy between Mg2+ and water molecules of 351.5 kcal mol−1 [85], Mg2+ is more difficult to be precipitated when compared with Ca2+ (264.3 kcal mol−1) [43]. At the same time, Mg2+ ions are also hard to bind with CO32− ions due to the limitations of the lattice structure, thus the formation of magnesium carbonate crystals is difficult. Fortunately, many functional groups such as C=O and C–N also make great contributions to this biomineralization process [50,85,86]. Carboxyl and phosphate groups usually have negative charges. The water molecules can be replaced by these functional groups to free the wrapped Ca2+ and Mg2+ ions. Additionally, the life activity of SRB2 creates an alkaline microenvironment around the cell, where under these circumstances, the deprotonation of the carboxyl groups is easier. Consequently, metal ions (Ca2+ and Mg2+) are more easily adsorbed on these groups.
EPS are an important source of organic functional groups, as shown in Figure 12, where 17 types of amino acids were detected in every experimental group including Glu, Asp, Gly, Ala, Val, Lys, Thr, Leu, Ser, Ile, Phe, Pro, Tyr, Arg, His, Cys, and Met. It can be seen in Figure 2c that the pH values increased to 9.0 at 200 h, but the isoelectric points of all kinds of amino acids (His 7.59, Pro 6.3, Thr 6.16, Ile 6.02, Ala 6, Leu5.98, Gly 5.97, Val 5.96, Met 5.74, Ser 5.68, Tyr 5.68, Phe 5.48, Cys 5.05, Glu 3.22, Asp 2.77), except for arginine (10.76) and lysine (9.74) were less than the final pH value. That is to say, most amino acids are negatively charged in such alkaline conditions [49,79]. These negatively charged amino acids could absorb a large number of calcium and magnesium ions into the bacteria’s EPS through electrostatic attraction, while the positively charged amino acids (Arg and Lys) could
Figure 11. Fourier transform infrared analyses of the organic functional groups from biominerals atdifferent Mg/Ca ratios.
In fact, Ca2+ and Mg2+ ions are usually wrapped by water molecules, and once the combinationenergy barrier of the water molecules was overcome, the Ca2+ and Mg2+ ions could be precipitated.There is also competition for nucleation sites between Mg2+ and Ca2+. According to the highercombination energy between Mg2+ and water molecules of 351.5 kcal mol−1 [85], Mg2+ is more difficultto be precipitated when compared with Ca2+ (264.3 kcal mol−1) [43]. At the same time, Mg2+ ions arealso hard to bind with CO3
2− ions due to the limitations of the lattice structure, thus the formation ofmagnesium carbonate crystals is difficult. Fortunately, many functional groups such as C=O and C–Nalso make great contributions to this biomineralization process [50,85,86]. Carboxyl and phosphategroups usually have negative charges. The water molecules can be replaced by these functional groupsto free the wrapped Ca2+ and Mg2+ ions. Additionally, the life activity of SRB2 creates an alkalinemicroenvironment around the cell, where under these circumstances, the deprotonation of the carboxylgroups is easier. Consequently, metal ions (Ca2+ and Mg2+) are more easily adsorbed on these groups.
EPS are an important source of organic functional groups, as shown in Figure 12, where 17 typesof amino acids were detected in every experimental group including Glu, Asp, Gly, Ala, Val, Lys, Thr,Leu, Ser, Ile, Phe, Pro, Tyr, Arg, His, Cys, and Met. It can be seen in Figure 2c that the pH valuesincreased to 9.0 at 200 h, but the isoelectric points of all kinds of amino acids (His 7.59, Pro 6.3, Thr6.16, Ile 6.02, Ala 6, Leu5.98, Gly 5.97, Val 5.96, Met 5.74, Ser 5.68, Tyr 5.68, Phe 5.48, Cys 5.05, Glu 3.22,Asp 2.77), except for arginine (10.76) and lysine (9.74) were less than the final pH value. That is tosay, most amino acids are negatively charged in such alkaline conditions [49,79]. These negativelycharged amino acids could absorb a large number of calcium and magnesium ions into the bacteria’sEPS through electrostatic attraction, while the positively charged amino acids (Arg and Lys) could

Minerals 2019, 9, 526 17 of 23
adsorb carbonate and bicarbonate ions in solution, thus the carbonate minerals could be nucleatedon the EPS. These amino acids promoted the adsorption and aggregation of Ca2+, Mg2+, CO3
2−, andHCO3
− ions on the cell surface, resulting in the formation of the bacterial mineralized shells and theprecipitation of metal ions.
Minerals 2019, 9, x FOR PEER REVIEW 17 of 23
adsorb carbonate and bicarbonate ions in solution, thus the carbonate minerals could be nucleated on the EPS. These amino acids promoted the adsorption and aggregation of Ca2+, Mg2+, CO32−, and HCO3− ions on the cell surface, resulting in the formation of the bacterial mineralized shells and the precipitation of metal ions.
Glu AspGly Ala ValLys Thr LeuSerIlePhe ProTyr Arg His CysMet
024
6
810121416
Mg/Ca=
0Mg/Ca=
6Mg/Ca=
8Mg/C
a=10
Mg/Ca=
12
Amino
acid
in EPS
Mol
ar ra
tio (%
)
Figure 12. Amino acids in the EPS of SRB2 cells in different culture media with various Mg/Ca ratios.
Therefore, the SRB2 bacteria provided suitable sites for the adsorption of metal ions (Ca2+ and Mg2+) and the nucleation of minerals. These functional groups from the EPS not only accelerated the precipitation of Ca2+ and Mg2+, but also served as the molecular template to change the morphology of minerals (preferred orientation of nesquehonite). In this way, functional groups such as P=O and C=O play an important role in the extracellular biomineralization of carbonate minerals.
4. Implications for Microbial Desalination and Biomineralization
In a pure inorganic environment without the participation of microorganisms, magnesium carbonate crystals are difficult to form. The most typical example is that neither dolomite nor magnesite can be precipitated directly in the aseptic natural system at the Earth’s surface. No minerals observed by the naked eye in our control groups also proved this viewpoint. However, more nesquehonite deposits can also be found in the modern natural environment. In the past, some research has suggested that the formation of nesquehonite was related to organic components, but a few studies have linked that with microbial activity. The current mainstream views about the question of what makes Mg2+ ions difficult to be precipitated as magnesium‐rich carbonate minerals are as follows. (1) The high binding energy between magnesium ions and water molecules is a huge obstacle to their entry into the mineral lattice [43]. In competition with calcium ions or other metal cations for nucleation sites, magnesium ions are often at a disadvantage due to their close association with water molecules. (2) Limitations of the mineral’s own lattice structure in the formation of magnesium‐rich carbonate minerals. The special structure of the Mg–O octahedron makes it difficult to maintain stable and sustained growth. (3) Demanding requirements for the deposition environment [82]. These magnesium‐rich carbonate minerals require higher saturation and higher ionic strength for sustained and stable growth.
Our study revealed that microorganisms could cause the rapid precipitation of Ca2+ and Mg2+ in aqueous solutions, leading to the formation of calcite, vaterite, monohydrocalcite, and nesquehonite. The EPS secreted by microorganisms reduced the binding energy of Mg2+ with water molecules, thus making it easier to enter the mineral lattice. Not only that, but in this process, organic components
Figure 12. Amino acids in the EPS of SRB2 cells in different culture media with various Mg/Ca ratios.
Therefore, the SRB2 bacteria provided suitable sites for the adsorption of metal ions (Ca2+ andMg2+) and the nucleation of minerals. These functional groups from the EPS not only accelerated theprecipitation of Ca2+ and Mg2+, but also served as the molecular template to change the morphologyof minerals (preferred orientation of nesquehonite). In this way, functional groups such as P=O andC=O play an important role in the extracellular biomineralization of carbonate minerals.
4. Implications for Microbial Desalination and Biomineralization
In a pure inorganic environment without the participation of microorganisms, magnesiumcarbonate crystals are difficult to form. The most typical example is that neither dolomite nor magnesitecan be precipitated directly in the aseptic natural system at the Earth’s surface. No minerals observed bythe naked eye in our control groups also proved this viewpoint. However, more nesquehonite depositscan also be found in the modern natural environment. In the past, some research has suggested thatthe formation of nesquehonite was related to organic components, but a few studies have linked thatwith microbial activity. The current mainstream views about the question of what makes Mg2+ ionsdifficult to be precipitated as magnesium-rich carbonate minerals are as follows. (1) The high bindingenergy between magnesium ions and water molecules is a huge obstacle to their entry into the minerallattice [43]. In competition with calcium ions or other metal cations for nucleation sites, magnesiumions are often at a disadvantage due to their close association with water molecules. (2) Limitationsof the mineral’s own lattice structure in the formation of magnesium-rich carbonate minerals. Thespecial structure of the Mg–O octahedron makes it difficult to maintain stable and sustained growth.(3) Demanding requirements for the deposition environment [82]. These magnesium-rich carbonateminerals require higher saturation and higher ionic strength for sustained and stable growth.
Our study revealed that microorganisms could cause the rapid precipitation of Ca2+ and Mg2+ inaqueous solutions, leading to the formation of calcite, vaterite, monohydrocalcite, and nesquehonite.The EPS secreted by microorganisms reduced the binding energy of Mg2+ with water molecules, thusmaking it easier to enter the mineral lattice. Not only that, but in this process, organic components that

Minerals 2019, 9, 526 18 of 23
participates in the process of mineral growth may change the crystal structure of the restricted mineralto a certain extent, making it more suitable for sustained and stable growth. The most importantthing is that the life activities of microorganisms could change the micro-environment, facilitating theprecipitation of minerals.
5. Conclusions
In the present experiment, we demonstrated that a newly isolated bacterial strain B. licheniformisSRB2 could induce intracellular and extracellular biomineralization. The final concentration of Ca2+
and Mg2+ in the experimental group was much lower than that in the control group at differentMg/Ca molar ratios due to the existence of SRB2 bacteria. SRB2 bacteria released ammonia and CAto increase the pH values and elevate the concentrations of HCO3
− and CO32− ions, thus promoting
the bio-precipitation of Ca2+ and Mg2+ ions. With increasing Mg/Ca ratios, the composition of aminoacids in the EPS also changed, mainly reflected in the marked increase in the proportion of negativelycharged amino acids. The mineral phases (calcite, vaterite, monohydrocalcite, and nesquehonite) andcrystallographic features (especially the preferred orientation) were controlled by the biomoleculesand the functional groups. The extra and intracellular biomineralization contributed greatly to thebio-precipitation of Ca2+ (96%) and Mg2+ (50%) in ambient solution. Therefore, the present experimentprovides references for understanding the mechanism of microbial desalination for the removal of Ca2+
and Mg2+ ions. Furthermore, it has an important guiding significance in explaining the formation ofnesquehonite and other carbonate minerals in the natural and ancient earth surface environment.
Supplementary Materials: The following are available online at http://www.mdpi.com/2075-163X/9/9/526/s1,Figure S1: Physiological and biochemical characteristics of SRB2. (a) Colony morphology on plates; (b) Bacteriaand extracellular polymers substances in SEM view; c Gram staining (purple, positive); d Ammonia test (positive).;Figure S2: Growth curves of SRB2 in culture medium with various NaCl concentrations (1%, 2%, 3% and 4%).;Figure S3: SEM results showing dramatic difference in morphologies of precipitates between the abiotic and bioticgroup.; Figure S4: EDX-mapping of C, Ca, O and Mg in precipitates formed in abiotic control experiments withdifferent Mg/Ca ratios and pH values; Figure S5: Rietveld refinement of XRD data in the experimental groups. (a)Mg/Ca = 0; (b) Mg/Ca = 6; (c) Mg/Ca = 8; (d) Mg/Ca = 10; (e) Mg/Ca = 12.; Figure S6: Images of HRTEM andSAED for minerals in the experimental groups for 12 days of cultivation. ((a) and (b): calcite and vaterite at Mg/Camolar ratio 0; (c) and (d): monohydrocalcite at Mg/Ca molar ratios 6 and 8, respectively; (e) and (f): nesquehoniteand monohydrocalcite at Mg/Ca molar ratio 10, respectively; (g) and (h): nesquehonite and monohydrocalcite atMg/Ca molar ratio 12, respectively. (a)–(e), and (g), HRTEM; (b), (f), and (h), SAED).; Figure S7. FTIR analyses ofthe characteristic organic functional groups in the minerals induced by B. licheniformis SRB2 strain at differentMg/Ca molar ratios.
Author Contributions: Y.Z. (Yanyang Zhao), H.Z., and Y.Z. (Yifan Zhao) did the isolation and culture of SRB2.Z.H. and H.Y. organized the laboratory experiments. Z.H., M.H., and J.Z. carried out the XRD analysis. Y.Z.(Yanyang Zhao), M.H., and G.M. carried out the AAS and FTIR analysis. M.E.T. helped draft the manuscript. Allauthors read and approved the final manuscript.
Funding: This work was supported by the National Natural Science Foundation of China(41972108, U1663201,41772095, 41702131), the Laboratory for Marine Mineral Resources, Qingdao National Laboratory for MarineScience and Technology (MMRZZ201804), the Taishan Scholar Talent Team Support Plan for Advanced & UniqueDiscipline Areas, Major Scientific and Technological Innovation Projects of Shandong Province (2017CXGC1602,2017CXGC1603), the Natural Science Foundation of Shandong Province (ZR2019MD027, ZR2017BD001), theSDUST Research Fund (2015TDJH101), the Scientific and Technological Innovation Project Financially Supportedby Qingdao National Laboratory for Marine Science and Technology (No. 2016ASKJ13).
Conflicts of Interest: The authors declare that they have no conflicts of interest.
References
1. Harvie, C.E.; Eugster, H.P.; Weare, J.H. Mineral equilibria in the six-component seawater system,Na-K-Mg-Ca-SO4-Cl-H2O at 25◦C. II: Compositions of the saturated solutions. Geochim. Cosmochim.Acta 1982, 46, 1603–1618. [CrossRef]
2. Valladares Linares, R.; Li, Z.; Yangali-Quintanilla, V.; Ghaffour, N.; Amy, G.; Leiknes, T.; Vrouwenvelder, J.S.Life cycle cost of a hybrid forward osmosis—Low pressure reverse osmosis system for seawater desalinationand wastewater recovery. Water Res. 2016, 88, 225–234. [CrossRef] [PubMed]
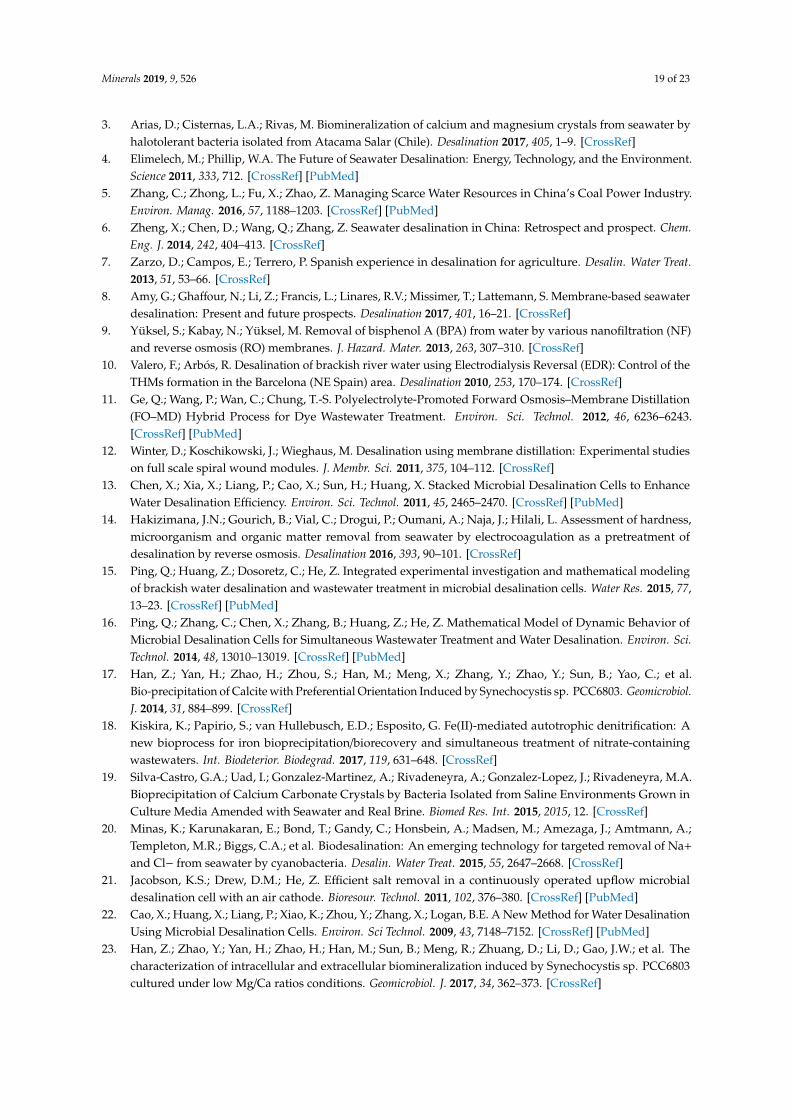
Minerals 2019, 9, 526 19 of 23
3. Arias, D.; Cisternas, L.A.; Rivas, M. Biomineralization of calcium and magnesium crystals from seawater byhalotolerant bacteria isolated from Atacama Salar (Chile). Desalination 2017, 405, 1–9. [CrossRef]
4. Elimelech, M.; Phillip, W.A. The Future of Seawater Desalination: Energy, Technology, and the Environment.Science 2011, 333, 712. [CrossRef] [PubMed]
5. Zhang, C.; Zhong, L.; Fu, X.; Zhao, Z. Managing Scarce Water Resources in China’s Coal Power Industry.Environ. Manag. 2016, 57, 1188–1203. [CrossRef] [PubMed]
6. Zheng, X.; Chen, D.; Wang, Q.; Zhang, Z. Seawater desalination in China: Retrospect and prospect. Chem.Eng. J. 2014, 242, 404–413. [CrossRef]
7. Zarzo, D.; Campos, E.; Terrero, P. Spanish experience in desalination for agriculture. Desalin. Water Treat.2013, 51, 53–66. [CrossRef]
8. Amy, G.; Ghaffour, N.; Li, Z.; Francis, L.; Linares, R.V.; Missimer, T.; Lattemann, S. Membrane-based seawaterdesalination: Present and future prospects. Desalination 2017, 401, 16–21. [CrossRef]
9. Yüksel, S.; Kabay, N.; Yüksel, M. Removal of bisphenol A (BPA) from water by various nanofiltration (NF)and reverse osmosis (RO) membranes. J. Hazard. Mater. 2013, 263, 307–310. [CrossRef]
10. Valero, F.; Arbós, R. Desalination of brackish river water using Electrodialysis Reversal (EDR): Control of theTHMs formation in the Barcelona (NE Spain) area. Desalination 2010, 253, 170–174. [CrossRef]
11. Ge, Q.; Wang, P.; Wan, C.; Chung, T.-S. Polyelectrolyte-Promoted Forward Osmosis–Membrane Distillation(FO–MD) Hybrid Process for Dye Wastewater Treatment. Environ. Sci. Technol. 2012, 46, 6236–6243.[CrossRef] [PubMed]
12. Winter, D.; Koschikowski, J.; Wieghaus, M. Desalination using membrane distillation: Experimental studieson full scale spiral wound modules. J. Membr. Sci. 2011, 375, 104–112. [CrossRef]
13. Chen, X.; Xia, X.; Liang, P.; Cao, X.; Sun, H.; Huang, X. Stacked Microbial Desalination Cells to EnhanceWater Desalination Efficiency. Environ. Sci. Technol. 2011, 45, 2465–2470. [CrossRef] [PubMed]
14. Hakizimana, J.N.; Gourich, B.; Vial, C.; Drogui, P.; Oumani, A.; Naja, J.; Hilali, L. Assessment of hardness,microorganism and organic matter removal from seawater by electrocoagulation as a pretreatment ofdesalination by reverse osmosis. Desalination 2016, 393, 90–101. [CrossRef]
15. Ping, Q.; Huang, Z.; Dosoretz, C.; He, Z. Integrated experimental investigation and mathematical modelingof brackish water desalination and wastewater treatment in microbial desalination cells. Water Res. 2015, 77,13–23. [CrossRef] [PubMed]
16. Ping, Q.; Zhang, C.; Chen, X.; Zhang, B.; Huang, Z.; He, Z. Mathematical Model of Dynamic Behavior ofMicrobial Desalination Cells for Simultaneous Wastewater Treatment and Water Desalination. Environ. Sci.Technol. 2014, 48, 13010–13019. [CrossRef] [PubMed]
17. Han, Z.; Yan, H.; Zhao, H.; Zhou, S.; Han, M.; Meng, X.; Zhang, Y.; Zhao, Y.; Sun, B.; Yao, C.; et al.Bio-precipitation of Calcite with Preferential Orientation Induced by Synechocystis sp. PCC6803. Geomicrobiol.J. 2014, 31, 884–899. [CrossRef]
18. Kiskira, K.; Papirio, S.; van Hullebusch, E.D.; Esposito, G. Fe(II)-mediated autotrophic denitrification: Anew bioprocess for iron bioprecipitation/biorecovery and simultaneous treatment of nitrate-containingwastewaters. Int. Biodeterior. Biodegrad. 2017, 119, 631–648. [CrossRef]
19. Silva-Castro, G.A.; Uad, I.; Gonzalez-Martinez, A.; Rivadeneyra, A.; Gonzalez-Lopez, J.; Rivadeneyra, M.A.Bioprecipitation of Calcium Carbonate Crystals by Bacteria Isolated from Saline Environments Grown inCulture Media Amended with Seawater and Real Brine. Biomed Res. Int. 2015, 2015, 12. [CrossRef]
20. Minas, K.; Karunakaran, E.; Bond, T.; Gandy, C.; Honsbein, A.; Madsen, M.; Amezaga, J.; Amtmann, A.;Templeton, M.R.; Biggs, C.A.; et al. Biodesalination: An emerging technology for targeted removal of Na+
and Cl− from seawater by cyanobacteria. Desalin. Water Treat. 2015, 55, 2647–2668. [CrossRef]21. Jacobson, K.S.; Drew, D.M.; He, Z. Efficient salt removal in a continuously operated upflow microbial
desalination cell with an air cathode. Bioresour. Technol. 2011, 102, 376–380. [CrossRef] [PubMed]22. Cao, X.; Huang, X.; Liang, P.; Xiao, K.; Zhou, Y.; Zhang, X.; Logan, B.E. A New Method for Water Desalination
Using Microbial Desalination Cells. Environ. Sci Technol. 2009, 43, 7148–7152. [CrossRef] [PubMed]23. Han, Z.; Zhao, Y.; Yan, H.; Zhao, H.; Han, M.; Sun, B.; Meng, R.; Zhuang, D.; Li, D.; Gao, J.W.; et al. The
characterization of intracellular and extracellular biomineralization induced by Synechocystis sp. PCC6803cultured under low Mg/Ca ratios conditions. Geomicrobiol. J. 2017, 34, 362–373. [CrossRef]

Minerals 2019, 9, 526 20 of 23
24. Han, Z.; Zhao, Y.; Yan, H.; Zhao, H.; Han, M.; Sun, B.; Sun, X.; Hou, F.; Sun, H.; Han, L.J.; et al. Struviteprecipitation induced by a novel sulfate-reducing bacterium Acinetobacter calcoaceticus SRB4 isolated fromriver sediment. Geomicrobiol. J. 2015, 32, 868–877. [CrossRef]
25. Falagán, C.; Yusta, I.; Sánchez-España, J.; Johnson, D.B. Biologically-induced precipitation of aluminium insynthetic acid mine water. Miner. Eng. 2017, 106, 79–85. [CrossRef]
26. Weiner, S.; Dove, P.M. An overview of biomineralization processes and the problem of the vital effect. Rev.Miner. Geochem. 2003, 54, 1–29. [CrossRef]
27. Pentecost, A. Significance of the biomineralizing microniche in a lyngbya (cyanobacterium) travertine.Geomicrobiol. J. 1995, 13, 213–222. [CrossRef]
28. Chough, S.K.; Lee, H.S.; Woo, J.; Chen, J.; Choi, D.K.; Lee, S.-B.; Kang, I.; Park, T.-Y.; Han, Z. Cambrianstratigraphy of the North China Platform: Revisiting principal sections in Shandong Province, China. Geosci.J. 2010, 14, 235–268. [CrossRef]
29. Van Lith, Y.; Warthmann, R.; Vasconcelos, C.; McKenzie, J.A. Sulphate-reducing bacteria inducelow-temperature Ca-dolomite and high Mg-calcite formation. Geobiology 2003, 1, 71–79. [CrossRef]
30. Kajander, E.O.; Çiftçioglu, N. Nanobacteria: An alternative mechanism for pathogenic intra- and extracellularcalcification and stone formation. Proc. Natl. Acad. Sci. USA 1998, 95, 8274. [CrossRef]
31. Dhami, N.K.; Reddy, M.S.; Mukherjee, A. Biomineralization of calcium carbonates and their engineeredapplications: A review. Front. Microbiol. 2013, 4. [CrossRef] [PubMed]
32. Warren, L.A.; Maurice, P.A.; Parmar, N.; Ferris, F.G. Microbially Mediated Calcium Carbonate Precipitation:Implications for Interpreting Calcite Precipitation and for Solid-Phase Capture of Inorganic Contaminants.Geomicrobiol. J. 2001, 18, 93–115. [CrossRef]
33. Zhao, Y.; Lu, Z.; Liu, J.; Hu, S. Flora characteristics of Chenier Wetland in Bohai Bay and biogeographicrelations with adjacent wetlands. Front. Earth Sci. 2017, 11, 620–628. [CrossRef]
34. Chen, Y.; Steele-MacInnis, M.; Ge, Y.; Zhou, Z.; Zhou, Y. Synthetic saline-aqueous and hydrocarbon fluidinclusions trapped in calcite at temperatures and pressures relevant to hydrocarbon basins: A reconnaissancestudy. Mar. Pet. Geol 2016, 76, 88–97. [CrossRef]
35. Cheng, B.; Wang, T.G.; Chen, Z.; Chang, X.; Yang, F. Biodegradation and possible source of Silurian andCarboniferous reservoir bitumens from the Halahatang sub-depression, Tarim Basin, NW China. Mar. Pet.Geol. 2016, 78, 236–246. [CrossRef]
36. Guo, J.; Zhai, P.; Wu, L.; Cribb, M.; Li, Z.; Ma, Z.; Wang, F.; Chu, D.; Wang, P.; Zhang, J. Diurnal variation andthe influential factors of precipitation from surface and satellite measurements in Tibet. Int. J. Clim. 2014, 34,2940–2956. [CrossRef]
37. Deng, S.; Dong, H.; Lv, G.; Jiang, H.; Yu, B.; Bishop, M.E. Microbial dolomite precipitation using sulfatereducing and halophilic bacteria: Results from Qinghai Lake, Tibetan Plateau, NW China. Chem. Geol. 2010,278, 151–159. [CrossRef]
38. Lee, J.-H.; Chen, J.; Chough, S.K. Paleoenvironmental implications of an extensive maceriate microbialite bedin the Furongian Chaomidian Formation, Shandong Province, China. Palaeogeogr. Palaeoclimatol. Palaeoecol.2010, 297, 621–632. [CrossRef]
39. Yang, R.; Fan, A.; Han, Z.; Chi, N.; Han, Y. Characteristics and genesis of microbial lumps in the MaozhuangStage (Cambrian Series 2), Shandong Province, China. Sci. China Earth Sci. 2013, 56, 494–503. [CrossRef]
40. Li, F.; Jing, X.; Zou, C.; Zhang, H.; Xiang, F. Facies analysis of the Callovian–Oxfordian carbonates in thenortheastern Amu Darya Basin, southeastern Turkmenistan. Mar. Pet. Geol. 2017, 88, 359–380. [CrossRef]
41. Yang, W.; Liu, Y.; Feng, Q.; Lin, J.; Zhou, D.; Wang, D. Sedimentary evidence of Early–Late Permianmid-latitude continental climate variability, southern Bogda Mountains, NW China. Palaeogeogr. Palaeoclim.Palaeoecol. 2007, 252, 239–258. [CrossRef]
42. Spadafora, A.; Perri, E.; Mckenzie, J.A.; Vasconcelos, C. Microbial biomineralization processes formingmodern Ca:Mg carbonate stromatolites. Sedimentology 2010, 57, 27–40. [CrossRef]
43. Qiu, X.; Wang, H.; Yao, Y.; Duan, Y. High salinity facilitates dolomite precipitation mediated by Haloferaxvolcanii DS52. Earth Planet. Sci. Lett 2017, 472, 197–205. [CrossRef]
44. Qiu, X.; Yao, Y.; Wang, H.; Shen, A.; Zhang, J. Halophilic Archaea Mediate the Formation of Proto-Dolomite inSolutions With Various Sulfate Concentrations and Salinities. Front. Microbiol. 2019, 10. [CrossRef] [PubMed]

Minerals 2019, 9, 526 21 of 23
45. Han, Z.; Yu, W.; Zhao, H.; Zhao, Y.; Tucker, E.M.; Yan, H. The Significant Roles of Mg/Ca Ratio, Cl− andSO42− in Carbonate Mineral Precipitation by the Halophile Staphylococcus epidermis Y2. Minerals 2018, 8,594. [CrossRef]
46. Suzuki, M.; Nagasawa, H.; Kogure, T. Synthesis and Structure of Hollow Calcite Particles. Cryst. Growth Des.2006, 6, 2004–2006. [CrossRef]
47. Daskalakis, M.I.; Magoulas, A.; Kotoulas, G.; Katsikis, I.; Bakolas, A.; Karageorgis, A.P.; Mavridou, A.;Doulia, D.; Rigas, F. Cupriavidus metallidurans biomineralization ability and its application as abioconsolidation enhancer for ornamental marble stone. Appl. Microbiol. Biotechnol. 2014, 98, 6871–6883.[CrossRef] [PubMed]
48. Tourney, J.; Ngwenya, B.T. The role of bacterial extracellular polymeric substances in geomicrobiology. Chem.Geol. 2014, 386, 115–132. [CrossRef]
49. Han, Z.; Gao, X.; Zhao, H.; Tucker, E.M.; Zhao, Y.; Bi, Z.; Pan, J.; Wu, G.; Yan, H. Extracellular and IntracellularBiomineralization Induced by Bacillus licheniformis DB1-9 at Different Mg/Ca Molar Ratios. Minerals 2018,8, 585. [CrossRef]
50. Han, Z.; Li, D.; Zhao, H.; Yan, H.; Li, P. Precipitation of Carbonate Minerals Induced by the HalophilicChromohalobacter Israelensis under High Salt Concentrations: Implications for Natural Environments.Minerals 2017, 7, 95. [CrossRef]
51. Manoli, F.; Dalas, E. Calcium carbonate crystallization in the presence of glutamic acid. J. Cryst. Growth 2001,222, 293–297. [CrossRef]
52. Malkaj, P.; Dalas, E. Calcium Carbonate Crystallization in the Presence of Aspartic Acid. Cryst. Growth Des.2004, 4, 721–723. [CrossRef]
53. Xie, A.-J.; Shen, Y.-H.; Zhang, C.-Y.; Yuan, Z.-W.; Zhu, X.-M.; Yang, Y.-M. Crystal growth of calcium carbonatewith various morphologies in different amino acid systems. J. Cryst Growth 2005, 285, 436–443. [CrossRef]
54. Wolf, S.E.; Loges, N.; Mathiasch, B.; Panthöfer, M.; Mey, I.; Janshoff, A.; Tremel, W. Phase Selection of CalciumCarbonate through the Chirality of Adsorbed Amino Acids. Angew. Chem. Int. Ed. 2007, 46, 5618–5623.[CrossRef] [PubMed]
55. Rodriguez-Blanco, J.D.; Shaw, S.; Bots, P.; Roncal-Herrero, T.; Benning, L.G. The role of Mg in the crystallizationof monohydrocalcite. Geochim. Cosmochim. Acta 2014, 127, 204–220. [CrossRef]
56. Ma, P.; Wang, C.; Lv, D.; Li, Y.; Yi, L. Controls on deposition of aquatic and terrestrial organic matter in thelacustrine Namling–Oiyug basin (Oligocene–Miocene, southern Tibet). Int. J. Coal Geol. 2015, 149, 108–117.[CrossRef]
57. Yang, R.; van Loon, A.J.; Jin, X.; Jin, Z.; Han, Z.; Fan, A.; Liu, Q. From divergent to convergent plates: Resultingfacies shifts along the southern and western margins of the Sino-Korean Plate during the Ordovician. J.Geodyn. 2018. [CrossRef]
58. Perri, E.; Tucker, M.; Slowakiewicz, M.; Whitaker, F.; Bowen, L.; Perrotta, I. Carbonate and silicatebiomineralization in a hypersaline microbial mat (Mesaieed sabkha, Qatar): Roles of bacteria, extracellularpolymeric substances and viruses. Sedimentology 2017, 65. [CrossRef]
59. Chen, J.; Chough, S.K.; Lee, J.H.; Han, Z. Sequence-stratigraphic comparison of the upper Cambrian Series 3to Furongian succession between the Shandong region, China and the Taebaek area, Korea: high variabilityof bounding surfaces in an epeiric platform. Geosci. J. 2012, 16, 357–379. [CrossRef]
60. Zhang, X.L.; Feng, Q.; Sun, P.; LI, W. Characteristics of High-Gamma-Ray Sandstone Reservoirs for YanchangFormation in Ordos Basin. Chin. J. Geophys. 2010, 53, 154–163. [CrossRef]
61. Qiu, X.; Liu, C.; Mao, G.; Deng, Y.; Wang, F.; Wang, J. Late Triassic tuff intervals in the Ordos basin, CentralChina: Their depositional, petrographic, geochemical characteristics and regional implications. J. Asian EarthSci 2014, 80, 148–160. [CrossRef]
62. Lv, D.; Chen, J. Depositional environments and sequence stratigraphy of the Late Carboniferous−EarlyPermian coal-bearing successions (Shandong Province, China): Sequence development in an epicontinentalbasin. J. Asian Earth Sci. 2014, 79, 16–30. [CrossRef]
63. Fan, A.; Yang, R.; Van Loon, A.J.; Yin, W.; Han, Z.; Zavala, C. Classification of gravity-flow deposits andtheir significance for unconventional petroleum exploration, with a case study from the Triassic YanchangFormation (southern Ordos Basin, China). J. Asian Earth Sci. 2018, 161, 57–73. [CrossRef]
64. Yin, S.; Lv, D.; Jin, L.; Ding, W. Experimental analysis and application of the effect of stress on continentalshale reservoir brittleness. J. Geophys. Eng. 2018, 15, 478–494. [CrossRef]

Minerals 2019, 9, 526 22 of 23
65. Wang, Y.; Yang, R.; Song, M.; Lenhardt, N.; Wang, X.; Zhang, X.; Yang, S.; Wang, J.; Cao, H. Characteristics,controls and geological models of hydrocarbon accumulation in the Carboniferous volcanic reservoirs of theChunfeng Oilfield, Junggar Basin, northwestern China. Mar. Pet. Geol. 2018, 94, 65–79. [CrossRef]
66. Bian, X.; Wang, Z.-F.; Ding, G.-Q.; Cao, Y.-P. Compressibility of cemented dredged clay at high water contentwith super-absorbent polymer. Eng. Geol. 2016, 208, 198–205. [CrossRef]
67. Chang, X.; Wang, T.G.; Li, Q.; Cheng, B.; Tao, X. Geochemistry and possible origin of petroleum in Palaeozoicreservoirs from Halahatang Depression. J. Asian Earth Sci. 2013, 74, 129–141. [CrossRef]
68. Xu, Y.; Shen, X.; Chen, N.; Yang, C.; Wang, Q. Evaluation of reservoir connectivity using whole-oil gaschromatographic fingerprint technology: A case study from the Es33 reservoir in the Nanpu Sag, China. Pet.Sci. 2012, 9, 290–294. [CrossRef]
69. Xu, Y.; Lu, M. Microbially enhanced oil recovery at simulated reservoir conditions by use of engineeredbacteria. J. Pet. Sci. Eng. 2011, 78, 233–238. [CrossRef]
70. Lv, D.; Li, Z.; Chen, J.; Liu, H.; Guo, J.; Shang, L. Characteristics of the Permian coal-formed gas sandstonereservoirs in Bohai Bay Basin and the adjacent areas, North China. J. Pet. Sci. Eng. 2011, 78, 516–528.[CrossRef]
71. Ding, H.-P.; Xin, G.-Q.; Chen, K.-C.; Zhang, M.; Liu, Q.; Hao, J.; Liu, H.-G. Silver dendritic nanostructuresformed at the solid/liquid interface via electroless deposition. Colloid. Surf. A Physicochem. Eng. Asp. 2010,353, 166–171. [CrossRef]
72. Benzerara, K.; Skouri-Panet, F.; Li, J.; Férard, C.; Gugger, M.; Laurent, T.; Couradeau, E.; Ragon, M.;Cosmidis, J.; Menguy, N. Intracellular Ca-carbonate biomineralization is widespread in cyanobacteria. Proc.Natl. Acad. Sci. USA 2014, 111, 10933–10938. [CrossRef] [PubMed]
73. Barabesi, C.; Galizzi, A.; Mastromei, G.; Rossi, M.; Tamburini, E.; Perito, B.J.J.o.b. Bacillus subtilis gene clusterinvolved in calcium carbonate biomineralization. J. Bacteriol. 2007, 189, 228–235. [CrossRef] [PubMed]
74. Boonrungsiman, S.; Gentleman, E.; Carzaniga, R.; Evans, N.D.; McComb, D.W.; Porter, A.E.; Stevens, M.M.The role of intracellular calcium phosphate in osteoblast-mediated bone apatite formation. Proc. Natl. Acad.Sci. USA 2012, 109, 14170. [CrossRef] [PubMed]
75. Mass, T.; Giuffre, A.J.; Sun, C.-Y.; Stifler, C.A.; Frazier, M.J.; Neder, M.; Tamura, N.; Stan, C.V.; Marcus, M.A.;Gilbert, P.U.P.A. Amorphous calcium carbonate particles form coral skeletons. Proc. Natl. Acad. Sci. USA2017, 114, 7670–7678. [CrossRef] [PubMed]
76. Herbaud, M.-L.; Guiseppi, A.; Denizot, F.; Haiech, J.; Kilhoffer, M.-C. Calcium signalling in Bacillus subtilis.Biochim. Biophys. Acta (BBA)-Mol. Cell Res. 1998, 1448, 212–226. [CrossRef]
77. Van Dijk-Salkinoja, M.S.; Stoof, T.J.; Planta, R.J. The Distribution of Polysomes, Ribosomes and RibosomalSubunits in Exponential-Phase Cells of Bacillus licheniformis. Eur. J. Biochem. 1970, 12, 474–482. [CrossRef][PubMed]
78. Sánchez-Román, M.; Romanek, C.S.; Fernández-Remolar, D.C.; Sánchez-Navas, A.; McKenzie, J.A.;Pibernat, R.A.; Vasconcelos, C. Aerobic biomineralization of Mg-rich carbonates: Implications for naturalenvironments. Chem. Geol. 2011, 281, 143–150. [CrossRef]
79. Zhuang, D.; Yan, H.; Tucker, M.E.; Zhao, H.; Han, Z.; Zhao, Y.; Sun, B.; Li, D.; Pan, J.; Zhao, Y.; et al. Calciteprecipitation induced by Bacillus cereus MRR2 cultured at different Ca2+ concentrations: Further insightsinto biotic and abiotic calcite. Chem. Geol. 2018, 500, 64–87. [CrossRef]
80. Bontognali, T.R.; McKenzie, J.A.; Warthmann, R.J.; Vasconcelos, C.J.T.N. Microbially influenced formation ofMg-calcite and Ca-dolomite in the presence of exopolymeric substances produced by sulphate-reducingbacteria. Terra. Nova. 2014, 26, 72–77. [CrossRef]
81. Sancho-Tomás, M.; Fermani, S.; Reggi, M.; García-Ruiz, J.M.; Gómez-Morales, J.; Falini, G. Polypeptide effecton Mg2+ hydration inferred from CaCO3 formation: A biomineralization study by counter-diffusion. Cryst.Eng. Comm. 2016, 18, 3265–3272. [CrossRef]
82. Han, Z.; Meng, R.; Yan, H.; Zhao, H.; Han, M.; Zhao, Y.; Sun, B.; Sun, Y.; Wang, J.; Zhuang, D.J.C.; et al.Calcium carbonate precipitation by Synechocystis sp. PCC6803 at different Mg/Ca molar ratios under thelaboratory condition. Carbonate. Evaporite. 2017, 32, 561–575. [CrossRef]
83. Stocks-Fischer, S.; Galinat, J.K.; Bang, S.S. Microbiological precipitation of CaCO3. Soil Biol. Biochem. 1999,31, 1563–1571. [CrossRef]
84. Riding, R. Microbial carbonates: The geological record of calcified bacterial–algal mats and biofilms.Sedimentology 2000, 47, 179–214. [CrossRef]

Minerals 2019, 9, 526 23 of 23
85. Zhang, Y.; Dawe, R.A. Influence of Mg2+ on the kinetics of calcite precipitation and calcite crystal morphology.Chem. Geol. 2000, 163, 129–138. [CrossRef]
86. Han, Z.; Wang, J.; Zhao, H.; Tucker, M.E.; Zhao, Y.; Wu, G.; Zhou, J.; Yin, J.; Zhang, H.; Zhang, X.; et al.Mechanism of Biomineralization Induced by Bacillus subtilis J2 and Characteristics of the Biominerals.Minerals 2019, 9, 218. [CrossRef]
© 2019 by the authors. Licensee MDPI, Basel, Switzerland. This article is an open accessarticle distributed under the terms and conditions of the Creative Commons Attribution(CC BY) license (http://creativecommons.org/licenses/by/4.0/).