Embed Size (px)
Citation preview

Bio-Impedance Spectroscopy (BIS) Measurement System for
Wearable DevicesBassem Ibrahim*, Drew A. Hall† , Roozbeh Jafari*
* Embedded Signal Processing (ESP) Lab, Texas A&M University, TX, USA†BioSensors and BioElectronics Group, University of California, San Diego, CA, USA

Outline
• Motivation
• Objective
• Background
• Specific Aims and Novelty
• System Description
• Performance Evaluation
• Experimental Results
• Conclusions
2

Motivation• Examples on Bio-Impedance
Applications
– Cardiovascular diseases diagnosis
• Using Impedance Cardiogram (ICG)
3
(ICG)
• Advantages– Low power
– Low cost
– Small size
– Suitable for wearable devices
– Body Cell Mass (BCM) Composition• Dehydration detection
• Calories consumption

Objective
4
Whole body - Bulky Devices Body Segment - Wearable Device
Bio-Impedance Analysis (BIA)
Single fixed frequency
Bio-Impedance Spectroscopy (BIS)
Multiple frequencies More Accurate
Single Time Measurement Continuous Monitoring
Conventional Method Proposed Method

Background
• Bio-impedance = resistance of tissue to an applied external current
• Measure fluids inside the body• Measured by
– Injecting AC current from the current electrodes– Voltage sensed between voltage electrodes is proportional to
bio-impedance
5

Bio-Impedance
6
Cell Membrane
Cm
Intra-Cellular
Fluid (ICF)
RI
Extra-Cellular
Fluid (ECF)
RE
High Frequency
CurrentLow Frequency
Current
RI
CmRE
• Bio-Impedance is modeled as RI, RE and Cm
• Low frequency ECF current (RE)
• High frequency ECF and ICF current (RI RE )

Bio-Impedance Spectroscopy (BIS)
• Bio-Impedance Spectroscopy (BIS) = Bio-Impedance response with frequency
Accurate estimation of (RI, RE and Cm)
7
Resistance |R(Z)|
Rea
ctan
ce |I(
Z)|
𝒇𝒄 =𝟏
𝟐𝝅𝑪𝒎 𝑹𝑬 + 𝑹𝑰
𝑹∞ =𝑹𝑬.𝑹𝑰
𝑹𝑬 + 𝑹𝑰 𝑹𝟎 = 𝑹𝑬
Frequency (f)
RI
CmRE

Specific Aims
8
Bio-Impedance
Frequency
Time
4-120 kHz (32 points, 4.7ms each)
150 ms
Fast time update to track cardiac activity
Wide frequency coverage with small frequency steps to extract the equivalent circuit.
Small body segment with bio-impedance
of few ohms compared to 600 Ω for the whole body.
1-120Ω
Continuous Monitorig
Spectroscopy
Wearable
• Develop Bio-Impedance Spectroscopy (BIS) device with
– continuous-time update (every 125 ms)
– wide frequency (4-120 kHz) to enable extraction of bio-impedance equivalent circuit
– from small body segment wearable applications

Novelty
• A BIS system for measurements from small body segments is presented for the first time, which can be integrated into a wearable device. – The detailed design and implementation of the
circuits and signal processing are discussed – Measuring very small variations of bio-impedance
across wide frequency range in a short time.
• Experimental measurements of upper arm BIS with 4 cm distance between electrodes to accurately capture physiological signals such as:– Heart rate, respiration rate, and muscle contractions.
9

System Description
• Frequency sweeping from 4 to 120 kHz controlled by MCU• Based on discrete components• Sensed voltage and DAC output sampled simultaneously using
16-bit ADC @ 2MSPS .• AC current amplitude = 375μARMS
– Compliant with safety limits
10
MCU AFE4300
Zbio
AC
Current
DAC Output
IA
+5V
-5V
RG
SPI
Digital
Signal
Processing
ADC
Simultaneous
Sampling ADC
16-bit 2MSPS
ADC
DAC+ V-IR(Z)
I(Z)

Digital Signal Processing
• Band pass filters to remove DC, 60 Hz interference and high frequency noise.
• Digital quadrature demodulation to get the real and imaginary parts of impedance
• Phase and gain correction were done to compensate for errors.• Low pass filtering with fc=500Hz to allow for fast output every 4.7
ms
11
fc
90o
Phase & Gain
Correction
Phase & Gain
Correction
IA
Output
DAC
Output
fc
BPF
3nd Order
fc LPF
2nd Order
fc=500 Hz
fc
I
Q

Phase and Gain Correction
• Impedance measurement sensitive to phase and gain error
• Error is measured by a reference resistor (Rref) for all frequency points
• Phase error:
• Gain error:
• Phase was corrected before demodulation by fractional time delay using an all-pass digital filter with a variable phase shift.
12
∅err 𝑓 = 𝑡𝑎𝑛−1 𝐼 𝑍
𝑅 𝑍
𝐺err 𝑓 =1
𝑅ref𝑅 𝑍 2 + 𝐼 𝑍 2

System Evaluation
• Linearity was tested using reference resistors from 1 to 120 Ω
• Resistance RMSE = 0.07 Ω
13

System Evaluation
• Impedance was measured for reference resistors and capacitors similar to bio-impedance (R=30.8 Ω, 100.2 nF & 82.1 Ω, 34.2 nF) from 4-120 kHz
14

Performance SummaryThis work [1] [2] AFE4300
Frequency 4 – 120 kHz 1 – 125 kHz <150kHz
Current 375μARMSE 1μ – 100μApp 375μARMSE
Impedance Range
1Ω – 120Ω 1Ω – 10kΩ 0 – 2.8kΩ
Resolution 70mΩ 100mΩ 100mΩ
Experimental Results
Yes No NA
15
[1] J. Xu, P. Harpe, J. Pettine, C. Van Hoof and R. F. Yazicioglu, "A low power configurable bio-impedance spectroscopy (BIS) ASIC with simultaneous ECG and respiration recording functionality," ESSCIRC Conference 2015 - 41st European Solid-State Circuits Conference (ESSCIRC), Graz, 2015.
[2] AFE4300, Integrated Analog Front-End for Weight-Scale and Body Composition Measurement , Texas Instruments

Experimental Results
• Actual Bio-Impedance measurements on the upper arm with variable distance between sensing electrodes (1,2 and 3 cm)
16

Experimental Results
• Respiration Rate
– Real part of Bio-Impedance (R(Z))across frequency for 30 seconds
– Verified by accelerometer placed on the chest
17
Respiration CycleΩ
Ω
Ω
Ω
(a) Real Bio-impedance |R(Z)|
(b) Acceleration

Experimental Results
18
(a) Real Bio-impedance |R(Z)|
(c) ECG Signal
(b) Bio-impedance highpass filtered
• Heart Rate
– Real part of Bio-Impedance (R(Z)) shows the heart rate and the respiration rate at fixed frequency (8 kHz)
– Heart rate extracted by a high pass filter
– Verified by ECG

Experimental Results
• Muscles Contraction
– The real and imaginary bio-impedance for 30 seconds
19
Ω
Ω
Ω
Ω
Ω
Ω
Ω
Ω
Ω
Ω
Ω
Ω
Intervals of muscles contraction
(a) Real Bio-impedance |R(Z)|
(b) Imaginary Bio-impedance |I(Z)|
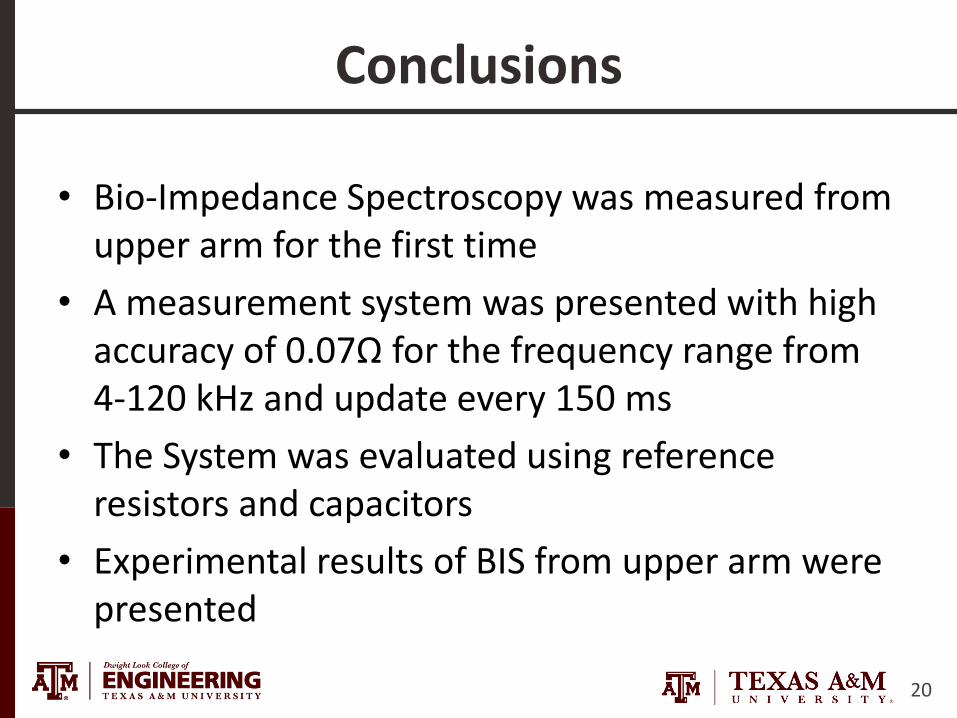
Conclusions
• Bio-Impedance Spectroscopy was measured from upper arm for the first time
• A measurement system was presented with high accuracy of 0.07Ω for the frequency range from 4-120 kHz and update every 150 ms
• The System was evaluated using reference resistors and capacitors
• Experimental results of BIS from upper arm were presented
20