Embed Size (px)
Citation preview

FULL PAPER
DOI: 10.1002/ejic.200600314
Binding Constant of VIVO to Transferrin
Tamás Kiss,*[a,b] Tamás Jakusch,[b] Saâd Bouhsina,[c] Hiromu Sakurai,[d] andÉva Anna Enyedy[a]
Keywords: VIVO–Transferrin complexes / EPR spectroscopy / UV spectroscopy / Stability constants
The interactions of bis-VIVO-1,2-dimethyl-3-hydroxy-4(1H)-pyridinone (DHP) with apotransferrin (apoTF) were followedby means of electron paramagnetic resonance spectroscopy(EPR) at room temperature and at liquid nitrogen tempera-ture. Partial ligand displacement between DHP and apoTFwas observed, and the reaction was used to determine thebinding constant of VIVO to apoTF. A value of logK =14.3±0.6 was obtained for the binding of the first VIVO toapoTF. In order to confirm the validity of the binding con-stant, UV spectroscopy was used to monitor the displacement
Introduction
There is considerable interest in the binding strength ofmetal ions to human serum transferrin (TF) because of itsnatural, therapeutic, diagnostic and toxicological impor-tance.[1] The serum transport protein TF has two very sim-ilar metal binding sites (C-lobe and N-lobe), and their affin-ities for metal ions differ only slightly. Each lobe containsa distorted octahedral site consisting of two Tyr-O– anions,one His-N group, one Asp-COO– anion and one usuallybidentate hydrogen carbonate anion (the synergisticanion).[2,3] Normally, the two stepwise binding constants(logK values) differ by approximately one unit, which is be-yond the purely statistical factor of four (0.6 log unit), be-cause of a slight difference in the intrinsic binding affinitiesof the two lobes. The mode of binding of metal ions at thetwo sites depends upon the nature of the metal ion, thesynergistic anion and the pH, but binding is generally alittle more preferred at the C-terminal site than at the N-terminal site.[2]
[a] Department of Inorganic and Analytical Chemistry, Universityof Szeged,P. O. Box 440, 6701 Szeged, HungaryFax: +36-62-420505E-mail: [email protected]
[b] Biocoordination Chemistry Research Group of the HungarianAcademy of Sciences,P. O. Box 440, 6701 Szeged, Hungary
[c] Laboratoire Interdisciplinaire en Sciences de l’Environment,Université du Littoral Côte d’Opale, ELICO ESA 8013,32 Avenue Foch, 62930 Wimereux, France
[d] Department of Analytical and Bioinorganic Chemistry, KyotoPharmaceutical University,5 Nakauchi-cho, Misasagi, Yamashina-ku, Kyoto 607-8414,Japan
Eur. J. Inorg. Chem. 2006, 3607–3613 © 2006 Wiley-VCH Verlag GmbH & Co. KGaA, Weinheim 3607
reaction between VIVO–apoTF and nitrilotriacetic acid(NTA). The difference between the binding constants ob-tained by the two different methods (ca. one log unit) wasexplained in terms of the possible ternary complex formationbetween VIVO–apoTF and the displacing ligand. The bind-ing constants obtained exhibit a reasonably good agreementwith the linear free energy relationship (LFER) estimation.
(© Wiley-VCH Verlag GmbH & Co. KGaA, 69451 Weinheim,Germany, 2006)
A number of experimental techniques have been used todetermine the stability constants of metal–TF complexes.Difference UV spectroscopy, based on the production ofnew absorption bands at ca. 240 nm and ca. 295 nm[2] onthe complexation of metal ions to the phenolic groups ofthe Tyr residues, has been applied most frequently.[4–9]
Other methods include equilibrium dialysis, EPR[5] andmultinuclear NMR spectroscopy,[10] the latter two also be-ing used to distinguish the modes of metal ion binding be-tween the two sites.[11–14]
Interest in the biochemistry of vanadium has increasedenormously in the past twenty years partly because of itsinsulin-mimetic or more precisely insulin-enhancing proper-ties.[15] It has been proposed that the transport of vanadiumin higher organisms is mediated by TF,[16] and it was re-cently proved that most of the vanadium in the serum isbound to TF.[17,18] The complexation of vanadium to TF inoxidation states of +3,[19–22] +4[13,14,20–27] or +5[21–24,28–30]
has been extensively studied by various research groups.The results uniformly indicate that two vanadium ions arebound to the metal-ion-free apoTF, at the usual specificFeIII binding sites. Using X-band and Q-band EPR spectro-scopic methods, Chasteen et al.[13,14] distinguished threeVIVO binding environments at a physiological pH (ca. 7.4),all having similar O-donor-rich environments, but withslightly different conformations. One possibly has the nor-mally preferred square-pyramidal or square-bipyramidalVIVO geometry, in which the VIVO oxygen atom occupiesan apical position (A environment), while for the other two(B1 and B2) [although in-plane anisotropy (rhombic spec-tra) is not observed] the noncoincidence of the magneticaxes suggests significant distortion around the VIVO ar-
T. Kiss, T. Jakusch, S. Bouhsina, H. Sakurai, É. A. EnyedyFULL PAPERrangement. The relative intensities of the A and B reso-nances are strongly pH dependent. The two interconvertibleA and B conformational states are believed to belong tothe C-terminal and N-terminal binding sites of the protein,respectively.[31]
The binding of VIVO to TF is strong, and thus only stoi-chiometric formation of the complexes can be ob-served.[13,14,21] We are not aware of any attempt to charac-terise the complexation of VIVO with TF in a quantitativeway; only the competition between VIVO and FeII bindingto ferritin[26] and the equilibrium distribution of VIVO be-tween albumin and TF have been studied.[24] Sun et al.[2]
suggested that the LFER between the binding constants(logK1) of metal ions to the first lobe of TF and the sta-bility constants, logKOH– for the binding of hydroxide, canbe used for the prediction of unknown stability constantsof metal-ion–TF complexes. Other possible correlations be-tween the metal ion binding to TF and small N,O-donorligands such as nitrilotriacetic acid (NTA), oxalate, acetate,glycine, malonate and lactate were also examined but noneof them were as good as that with OH–. This suggests thatthe two Tyr moieties at the metal-binding site of TF playpredominant roles in determining the strength of the metalbinding.[2] We used the above approach in our previouswork in order to describe the speciation of various insulin-mimetic VIVO complexes in blood serum,[32] and obtaineda value of logK1(TF) = 13.2±1.6 for VIVO binding to TF.During the study EPR spectroscopy revealed a partial dis-placement of apoTF by one of the low-molecular-mass car-rier ligands, 1,2-dimethyl-3-hydroxy-4(1H)-pyridinone(DHP). It was decided to make use of this reaction to assessthe binding of VIVO to apoTF.
Accordingly, in this paper we report, to the best of ourknowledge, the first binding constants of VIVO to humanserum TF obtained by means of EPR and UV spectralmonitoring of the ligand displacement reactions betweenthe VIVO complexes formed with apoTF and DHP or NTA.
Results and Discussion
The EPR spectra of the VIVO–apoTF system at a metal-ion-to-ligand ratio of 1:1 at pH 7.5 at room temperatureand at 77 K (LNT: liquid nitrogen temperature) are de-picted in Figure 1. In agreement with the earlier result,[33]
the room temperature spectrum of [VIVO(apoTF)] (Fig-ure 1, II) is axial because of the slow tumbling motion ofthe protein. However, on the parallel part only two types ofvanadium species are clearly observable (A and B), whilethe not completely perfect simulation of the spectrum mightindicate the presence of a third species (B2). The measuredratio of environments A and B is almost identical, but thedifference between the two –7/2 peaks is only 1.5 mT (in-stead of 2.5 mT as reported earlier in ref.[33]).
The –3/2 peak of the perpendicular part of the LNT X-band spectra clearly shows three species in contrast withChasteen’s earlier findings, where only the Q-band spectracould differentiate between the B1 and B2 environments. In
www.eurjic.org © 2006 Wiley-VCH Verlag GmbH & Co. KGaA, Weinheim Eur. J. Inorg. Chem. 2006, 3607–36133608
Figure 1. EPR spectra of VIVO–apoTF, 1:1 at pH 7.5 (I) at liquidnitrogen temperature and (II) at room temperature.
the parallel part of the spectra, the peaks strongly overlapand accordingly g� and A� parameters were not determined.
The mechanism of the insulin-enhancing effect of VIVOcompounds is still unknown, and the speciation of the VIVOinsulin-mimetic compounds in the blood is therefore inter-esting.[34–37] The estimated [VIVO(apoTF)] stability con-stants obtained from the LFER prediction clearly demon-strated that in most cases of the insulin-mimetic VIVO com-plexes (with maltol, picolinic acid, 6-Me-picolinic acid, 2-OH-pyridine N-oxide and 2-SH-pyridine N-oxide)[32,36]
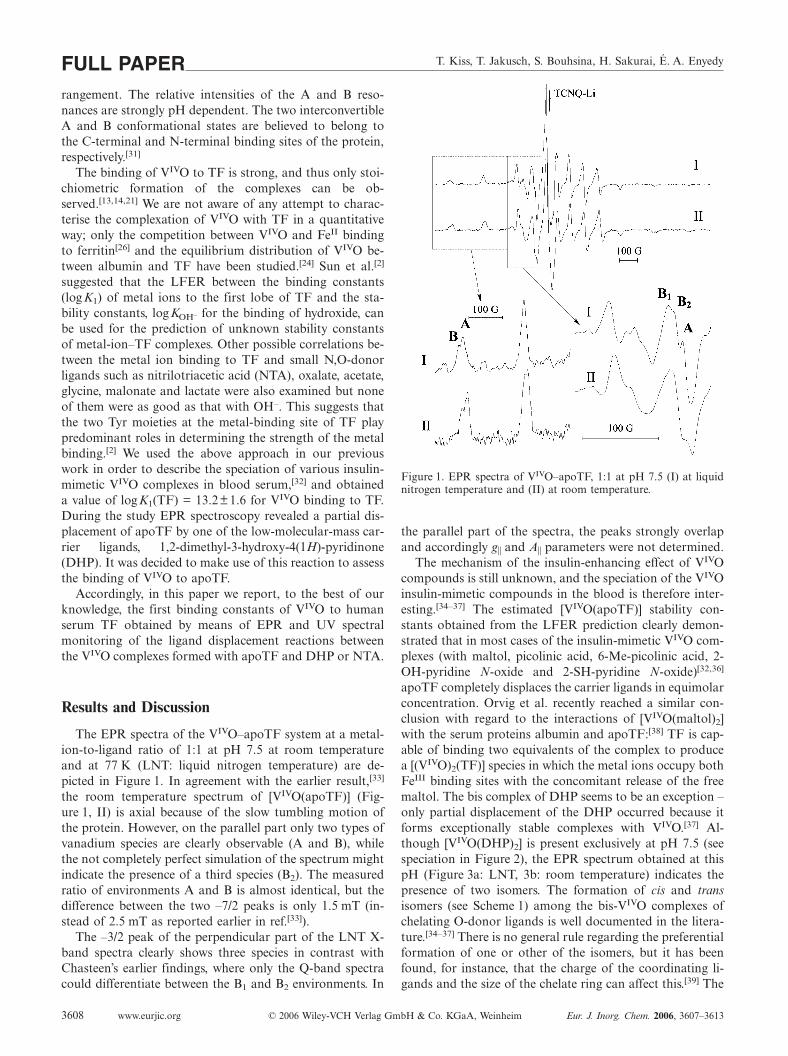
apoTF completely displaces the carrier ligands in equimolarconcentration. Orvig et al. recently reached a similar con-clusion with regard to the interactions of [VIVO(maltol)2]with the serum proteins albumin and apoTF:[38] TF is cap-able of binding two equivalents of the complex to producea [(VIVO)2(TF)] species in which the metal ions occupy bothFeIII binding sites with the concomitant release of the freemaltol. The bis complex of DHP seems to be an exception –only partial displacement of the DHP occurred because itforms exceptionally stable complexes with VIVO.[37] Al-though [VIVO(DHP)2] is present exclusively at pH 7.5 (seespeciation in Figure 2), the EPR spectrum obtained at thispH (Figure 3a: LNT, 3b: room temperature) indicates thepresence of two isomers. The formation of cis and transisomers (see Scheme 1) among the bis-VIVO complexes ofchelating O-donor ligands is well documented in the litera-ture.[34–37] There is no general rule regarding the preferentialformation of one or other of the isomers, but it has beenfound, for instance, that the charge of the coordinating li-gands and the size of the chelate ring can affect this.[39] The
Binding Constant of VIVO to Transferrin FULL PAPER
Scheme 1. Binding modes of the cis and trans isomers of [VIVO(DHP)2].
EPR parameters of the bis complexes of VIVO and DHP,together with the ratios of the two isomers, are given inTable 1. The data reveal that trans isomer formation is fav-oured with DHP, when a water molecule is trans to the oxogroup of VIVO.
Figure 2. Speciation curves for complexes formed in theVIVO–DHP system at a 1:2 metal-ion-to-ligand ratio, [VIVO] =0.001 . Calculated with stability constants, logβ(HL) = 9.76,logβ(H2L) = 13.46, logβ([VIVOL]+) = 12.18, logβ([VIVOL2]) =22.83, logβ([VIVOL2H–1]–) = 12.24, logβ([VIVOL3H2]+) = 38.5,logβ([VIVO2L2H–2]2–) = 16.43, taken from ref.[40]
After the detailed equilibrium and EPR spectral descrip-tion of the binary systems, measurements were made on theternary system VIVO–apoTF–DHP at different metal-ion-to-ligand ratios at both room temperature and 77 K. Foreasier comparison, the room temperature spectra of theVIVO–apoTF (1:1), VIVO–DHP (1:2) and VIVO–apoTF–DHP (1:1:2) systems are depicted together in Figure 4. It isclearly seen that the ternary spectrum is a composite of theisotropic spectrum of the [VIVO(DHP)2] and the axial oneof the [(VIVO)(apoTF)]. This observation indicates partialdisplacement of the carrier ligand by apoTF or vice versa,i.e. [VIVO(DHP)2] + apoTF h [(VIVO)(apoTF)] + 2 DHP.(As a first approximation, ternary complex formation withthe protein and the carrier ligand was neglected in order tomake further calculations possible.) The +7/2 and +5/2parts of the LNT spectra of these three systems are depictedtogether in Figure 5.
As a first step in the quantitative evaluation of the spec-tral changes, the extent of ligand displacement was deter-mined by calculating the ratio of the concentrations ofVIVO bound to the two ligands through double integration
Eur. J. Inorg. Chem. 2006, 3607–3613 © 2006 Wiley-VCH Verlag GmbH & Co. KGaA, Weinheim www.eurjic.org 3609
Figure 3. EPR spectra (sim. = simulated, exp. = experimental) ofVIVO–DHP, 1:2 at pH 7.5 (a) at liquid nitrogen temperature and(b) at room temperature, t = trans isomer, c = cis isomer.
of the enlarged sections of the simulated EPR spectrashown in Figure 5. From these data, the concentrations([VIVO(apoTF)], [DHP], [VIVO(DHP)2] and [apoTF]) andthe displacement constant K = [[VIVO(apoTF)]]·[[DHP]]2/[[VIVO(DHP)2]]·[[apoTF]] can be calculated. We used thisdisplacement constant (logK = –3.6±0.3) to obtain thebinding constant for the VIVO–apoTF interaction. The con-ditional stability constant for the competitive complex[VIVO(DHP)2] at pH 7.5 was first calculated by taking intoaccount the protonation equilibria of the ligand DHP,Equation (1):
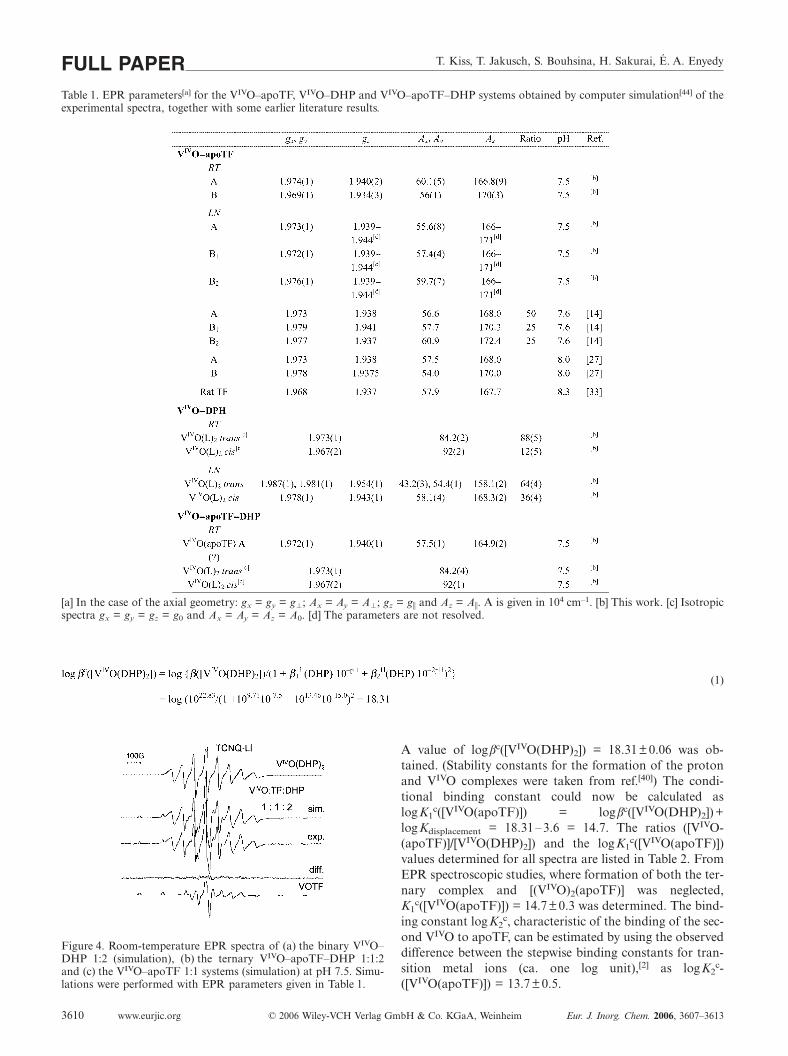
T. Kiss, T. Jakusch, S. Bouhsina, H. Sakurai, É. A. EnyedyFULL PAPERTable 1. EPR parameters[a] for the VIVO–apoTF, VIVO–DHP and VIVO–apoTF–DHP systems obtained by computer simulation[44] of theexperimental spectra, together with some earlier literature results.
[a] In the case of the axial geometry: gx = gy = g�; Ax = Ay = A�; gz = g� and Az = A�. A is given in 104 cm–1. [b] This work. [c] Isotropicspectra gx = gy = gz = g0 and Ax = Ay = Az = A0. [d] The parameters are not resolved.
(1)
Figure 4. Room-temperature EPR spectra of (a) the binary VIVO–DHP 1:2 (simulation), (b) the ternary VIVO–apoTF–DHP 1:1:2and (c) the VIVO–apoTF 1:1 systems (simulation) at pH 7.5. Simu-lations were performed with EPR parameters given in Table 1.
www.eurjic.org © 2006 Wiley-VCH Verlag GmbH & Co. KGaA, Weinheim Eur. J. Inorg. Chem. 2006, 3607–36133610
A value of logβc([VIVO(DHP)2]) = 18.31±0.06 was ob-tained. (Stability constants for the formation of the protonand VIVO complexes were taken from ref.[40]) The condi-tional binding constant could now be calculated aslogK1
c([VIVO(apoTF)]) = logβc([VIVO(DHP)2])+logKdisplacement = 18.31–3.6 = 14.7. The ratios ([VIVO-(apoTF)]/[VIVO(DHP)2]) and the logK1
c([VIVO(apoTF)])values determined for all spectra are listed in Table 2. FromEPR spectroscopic studies, where formation of both the ter-nary complex and [(VIVO)2(apoTF)] was neglected,K1
c([VIVO(apoTF)]) = 14.7±0.3 was determined. The bind-ing constant logK2
c, characteristic of the binding of the sec-ond VIVO to apoTF, can be estimated by using the observeddifference between the stepwise binding constants for tran-sition metal ions (ca. one log unit),[2] as logK2
c-([VIVO(apoTF)]) = 13.7±0.5.
Binding Constant of VIVO to Transferrin FULL PAPER
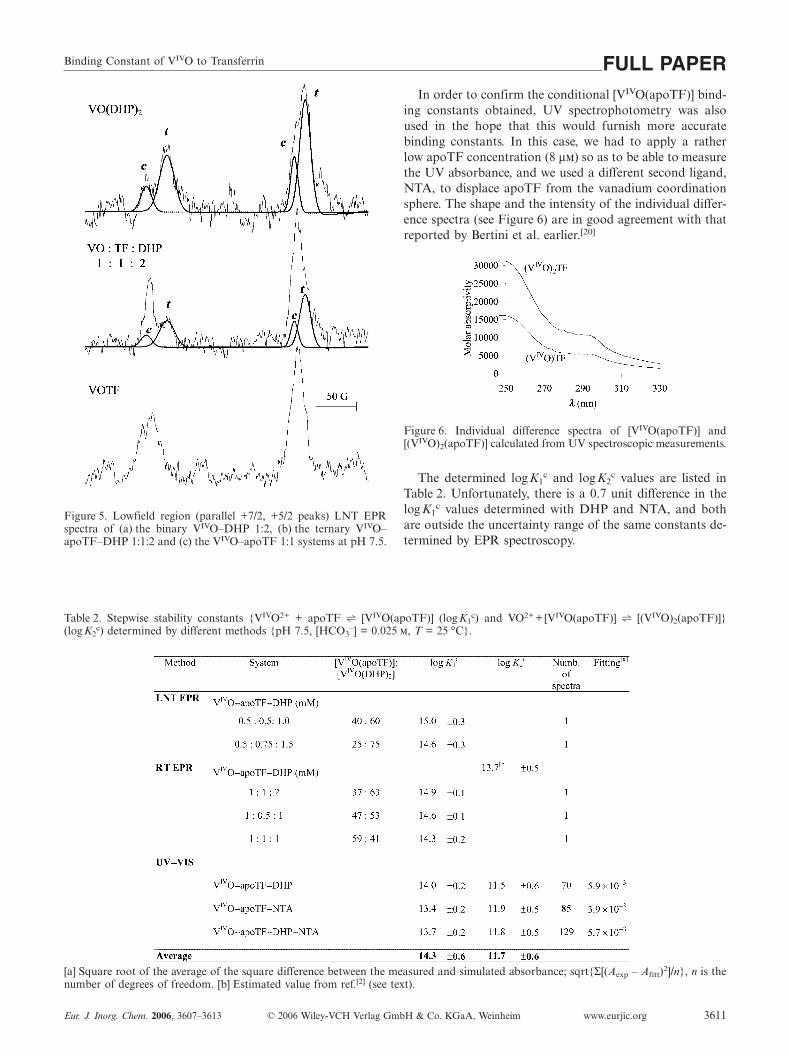
Figure 5. Lowfield region (parallel +7/2, +5/2 peaks) LNT EPRspectra of (a) the binary VIVO–DHP 1:2, (b) the ternary VIVO–apoTF–DHP 1:1:2 and (c) the VIVO–apoTF 1:1 systems at pH 7.5.
Table 2. Stepwise stability constants {VIVO2+ + apoTF h [VIVO(apoTF)] (log K1c) and VO2+ +[VIVO(apoTF)] h [(VIVO)2(apoTF)]}
(logK2c) determined by different methods {pH 7.5, [HCO3
–] = 0.025 , T = 25 °C}.
[a] Square root of the average of the square difference between the measured and simulated absorbance; sqrt{Σ[(Aexp – Afitt)2]/n}, n is thenumber of degrees of freedom. [b] Estimated value from ref.[2] (see text).
Eur. J. Inorg. Chem. 2006, 3607–3613 © 2006 Wiley-VCH Verlag GmbH & Co. KGaA, Weinheim www.eurjic.org 3611
In order to confirm the conditional [VIVO(apoTF)] bind-ing constants obtained, UV spectrophotometry was alsoused in the hope that this would furnish more accuratebinding constants. In this case, we had to apply a ratherlow apoTF concentration (8 µ) so as to be able to measurethe UV absorbance, and we used a different second ligand,NTA, to displace apoTF from the vanadium coordinationsphere. The shape and the intensity of the individual differ-ence spectra (see Figure 6) are in good agreement with thatreported by Bertini et al. earlier.[20]
Figure 6. Individual difference spectra of [VIVO(apoTF)] and[(VIVO)2(apoTF)] calculated from UV spectroscopic measurements.
The determined logK1c and logK2
c values are listed inTable 2. Unfortunately, there is a 0.7 unit difference in thelogK1
c values determined with DHP and NTA, and bothare outside the uncertainty range of the same constants de-termined by EPR spectroscopy.
T. Kiss, T. Jakusch, S. Bouhsina, H. Sakurai, É. A. EnyedyFULL PAPERThe difference between the binding constants determined
from the EPR and UV spectra may be explained in part bythe slightly different experimental conditions: different totalconcentrations of apoTF, ca. 1 m for EPR and ca.0.01 m for UV spectroscopic measurements; different sol-vents, 10% (v/v) DMSO for the LNT EPR spectroscopyand water for the other measurements; and different tem-peratures, ca. –5 °C for the LNT measurements and 25 °Cfor the others.
The rather low value obtained for logK2c by UV spec-
troscopy is more worrying. However, this value is probablyvery uncertain because of the very low concentration of theligand used in the UV spectroscopic measurements, andthus the rather high error from any disturbing circum-stances affecting the concentration of the interacting spe-cies, or from the light absorption of the sample, such asslight oxidation of the metal ion. Accordingly, logK2
c deter-mined by means of UV spectroscopic measurements can beconsidered only a tentative value. The constants K1
c andK2
c are conditional constants for pH 7.5 and 25 m hydro-gen carbonate concentration.
The differences between the binding constants logK1c
obtained by the three experimental methods (room-tem-perature EPR spectroscopy, LNT EPR and UV spec-troscopy) are about 0.5–1.5 orders of magnitude higherthan that obtained from the LFER prediction (13.2±1.6)(see Figure 6 in ref.[32]), although they are within the uncer-tainty range of the latter.
As mentioned above, the absence of ternary complex for-mation between [VIVO(apoTF)] and the competitor ligandhad to be assumed as a precondition for the calculationof the binding constant. This has not been proven,[38] andNMRD measurements[41] have suggested that displacedDHP ligand(s) do not move far away from the metal ions,which to some extent continues to feel their presence. Moredetailed studies are currently being carried out in ourlaboratories in order to explore the possibility of ternarycomplex formation between VIVO–apoTF and low molecu-lar mass carrier ligands. This process may be the reason forthe differing LFER estimated value.
Although the measurements reported here were carriedout with metal-ion-free apoTF, the binding constants deter-mined can be applied with a good approximation to theinteraction of VIVO with TF, as only ca. 30% of the metal-binding sites of the protein are saturated with FeIII undernormal conditions, and thus there are enough free sites tobind other, mostly hard metal ions (e.g. AlIII or VIVO) andto transport them in the blood stream.
Materials and MethodsChemicals
DHP, NTA and human apotransferrin (apoTF) were obtainedfrom Sigma Co. The purities of the small organic ligands werechecked, and the exact concentrations of their solutions were deter-mined by the Gran method.[42] The concentrations of protein solu-tions were estimated from their UV absorption (ε280(TF) =92.300 m–1 cm–1[24]). The VIVO stock solution was prepared as de-
www.eurjic.org © 2006 Wiley-VCH Verlag GmbH & Co. KGaA, Weinheim Eur. J. Inorg. Chem. 2006, 3607–36133612
scribed in ref.[43] and standardised for metal ion concentration bya permanganate titration.
EPR Spectroscopic Measurements
As a consequence of the ready oxidation of VIVO to VV underneutral or basic conditions, extreme care was taken to exclude oxy-gen during the preparation of the samples and during the measure-ments. It has been reported that VIVO ions bound to human serumTF are very unstable towards aerobic oxidation,[24] and the half-lifefor the oxidation is estimated to be between 5 and 13 min. Aqueoussolutions (0.5 mL) of samples containing DHP and apoTF in ratiosof 0.001 :0.0005 , 0.0015 :0.0005 and 0.001 :0.0008 wereprepared in 0.1 HEPES buffer and 0.025 sodium hydrogen car-bonate adjusted to pH 7.5. The solutions were carefully purgedwith argon and then sealed under an argon atmosphere. A VIVOstock solution (5 µL) was then added to each sample through arubber septum with a Hamilton syringe. Samples for the EPR spec-troscopic measurements were taken out by syringe and were imme-diately transferred into the EPR tube (LNT) or into the capillary(room temperature). X-band EPR spectra (9.59 or 9.40 GHz) wererecorded in aqueous solution at LNT (77 K) and at room tempera-ture with a Bruker EMX or JEOL JES-RE-1X spectrometer. Thesamples for low-temperature measurements contained 10% (v/v) ofDMSO to ensure good glass formation (dilution of the sampleswas taken into account). The EPR spectra were evaluated and sim-ulated with the EPR computer programme of Rockenbauer andKorecz.[44]
UV Spectroscopic Measurements
At physiological pH, vanadium(IV) undergoes extensive hydrolysis.Hence, the stability constants of apoTF were determined by a dis-placement reaction with NTA and with DHP. Both ligands formappropriately stable complexes with VIVO, and the stability con-stants are available at 25 °C and I = 0.2 (KCl).[40,45] However,while NTA does not exhibit significant UV absorption at pH 7.5,which simplifies the determination, at pH 7.5 the complex[VIVOL]– of NTA is partly hydrolysed and a ternary complex,[VIVOL(OH)]2–, is formed, which makes the system somewhat morecomplicated. On the other hand, DHP forms a single [VIVOL2]complex at pH 7.5, but both the complex and the ligand exhibitsignificant UV absorption, which imposes a limit to the use of ahigh excess of the ligand.
In contrast with the difference UV spectroscopic method (fre-quently applied by Harris and coworkers to determine the stabilityconstants of TF complexes with different metal ions[4–9]), we simplymeasured the absorbance and fitted the data (wavelength range250–330 nm) and individual spectra by using the computer pro-gramme PSEQUAD.[46]
The apoTF concentration was 8 µ, the molar ratio betweenapoTF and NTA was 1:0, 0:1, 1:1, 1:5, 1:25 or 1:120 and that be-tween apoTF and DHP was 0:1, 1:1, 1:2.5 or 1:5 at 25 °C in 0.025
HCO3–, and I = 0.2 (KCl) in 0.1 HEPES buffer adjusted to
pH 7.5. The starting volume was 2.0 mL and at each titration point25 µL of 0.16 m VIVOCl2 was added until an apoTF to VIVO ratioof 1:4 was reached. (When the calculation suggested hydrolysis ofVIVO at a titration point, the data of the spectrum were omittedfrom the calculation.) An HP 8452 diode array spectrophotometerwas used with a silica cell with a pathlength of 1.00 cm. Duringmeasurements, the cell was closed, and during the addition ofVIVO, argon was bubbled through the sample to exclude air.
Binding Constant of VIVO to Transferrin FULL PAPER
Acknowledgments
This work was performed in the frame of a COST D21 collabora-tion and supported by the Hungarian Research Fund (OTKAgrants NI61786 and T049417). The authors thank Dr E. A. Aad(Universite du Littoral) for his help with the EPR spectroscopicmeasurements.
[1] G. Berthon (Ed.), Handbook of Metal-Ligand Interactions inBiological Fluids: Bioinorganic Medicine, Dekker, New York,1995, vol. 1, part I.
[2] H. Sun, M. C. Cox, H. Li, P. J. Sadler, Struct. Bond. 1997, 88,71–102.
[3] W. R. Harris, L. Messori, Coord. Chem. Rev. 2002, 228, 237–262.
[4] W. R. Harris, B. Yang, S. Abdollahi, Y. Hamada, J. Inorg. Bi-ochem. 1999, 76, 231–242.
[5] W. R. Harris, Y. Chen, J. Inorg. Biochem. 1994, 54, 1–19.[6] W. R. Harris, Y. Chen, Inorg. Chem. 1992, 31, 5001–5006.[7] W. R. Harris, J. Inorg. Biochem. 1986, 27, 41–49.[8] W. R. Harris, J. Sheldo, Inorg. Chem. 1990, 29, 119–124.[9] W. R. Harris, Y. Chen, K. Wein, Inorg. Chem. 1994, 33, 4991–
4998.[10] D. C. Harris, P.Aisen in Iron Carriers and Iron Proteins (Ed.:
T. M. Loehr), VCH, Weinheim, Germany, 1989, pp. 239–299.[11] G. Kubal, A. B. Mason, S. U. Patel, P. J. Sadler, A. Tucker,
R. C. Woodworth, Biochemistry 1993, 32, 3387–3393.[12] G. Kubal, A. B. Mason, P. J. Sadler, A. Tucker, R. C. Wood-
worth, J. Biochem. 1995, 285, 711–718.[13] J. Cannon, N. D. Chasteen, Biochemistry 1975, 14, 4573–4577.[14] L. K. White, N. D. Chasteen, J. Phys. Chem. 1979, 83, 279–
284.[15] K. H. Thompson, J. H. McNeill, C. Orvig, Chem. Rev. 1999,
99, 2561–2571.[16] L. C. Cantley, M. Resh, G. Guidotti, Nature 1978, 272, 552.[17] K. De Cremer, M. Van Hulle, C. Chery, R. Cornelis, K. Strijck-
mans, R. Dams, N. Lameire, R. Vanholder, J. Biol. Inorg.Chem. 2002, 7, 884–890.
[18] C. C. Chery, K. De Cremer, E. Dumont, R. Cornelis, L. Mo-ens, Electrophoresis 2002, 23, 3284–3288.
[19] I. Bertini, G. Canti, C. Luchinat, Inorg. Chim. Acta 1982, 67,21–22.
[20] I. Bertini, C. Luchinat, I. Messori, J. Inorg. Biochem. 1985, 25,57–60.
[21] C. A. Smith, E. W. Ainscough, A. M. Brodie, J. Chem. Soc.,Dalton Trans. 1995, 1121–1126.
[22] M. H. Nagaoka, T. Yamazaki, T. Maitani, Biochem. Bioph.Res. Commun. 2002, 296, 1207–1214.
Eur. J. Inorg. Chem. 2006, 3607–3613 © 2006 Wiley-VCH Verlag GmbH & Co. KGaA, Weinheim www.eurjic.org 3613
[23] W. R. Harris, C. J. Carrano, J. Inorg. Biochem. 1984, 22, 201–218.
[24] N. D. Chasteen, J. K. Grady, C. E. Holloway, Inorg. Chem.1986, 25, 2754–2760.
[25] S. S. Eaton, J. Dubach, K. M. More, G. R. Eaton, G. Thur-man, D. R. Ambruso, J. Biol. Chem. 1989, 264, 4776–4781.
[26] P. M. Hanna, N. D. Chasteen, A. Rottman, A. Aisen, Biochem-istry 1991, 30, 9210–9216.
[27] D. Mustafi, E. V. Galtseva, J. Krzystek, L. C. Brunuel, M. W.Makinen, J. Phys. Chem. A 1999, 103, 11279–11286.
[28] A. Butler, M. J. Danzitz, H. Eckert, J. Am. Chem. Soc. 1987,109, 1864–1871.
[29] A. Butler, H. Eckert, J. Am. Chem. Soc. 1989, 111, 2802–2809.[30] J. A. Saponja, H. J. Vogel, J. Inorg. Biochem. 1996, 62, 253–270.[31] N. D. Chasteen in Biological Magnetic Resonance (Eds.: J. Law-
rence, L. J. Berliner, J. Reuben), Plenum, New York, 1981, vol3, pp. 53–119.
[32] T. Kiss, E. Kiss, E. Garribba, H. Sakurai, J. Inorg. Biochem.2000, 80, 65–73.
[33] N. D. Chasteen, E. M. Lord, H. J. Thompson, J. K. Grady, Bi-ochim. Biophys. Acta 1986, 884, 84–92.
[34] P. Caravan, L. Gelmini, N. Glover, F. G. Herring, H. Li, J. H.McNeill, S. J. Rettig, I. A. Setyawati, E. Shuter, Y. Sun, A. S.Tracey, V. G. Yuen, C. Orvig, J. Am. Chem. Soc. 1995, 117,12759–12766.
[35] G. R. Hanson, Y. Sun, C. Orvig, Inorg. Chem. 1996, 35, 6507–6512.
[36] E. Kiss, E. Garribba, G. Micera, T. Kiss, H. Sakurai, J. Inorg.Biochem. 2000, 78, 97–108.
[37] S. S. Amin, K. Cryer, B. Y. Zhang, S. K. Dutta, S. S. Eaton,O. P. Anderson, S. M. Miller, B. A. Reul, S. M. Brichard, D. C.Crans, Inorg. Chem. 2000, 39, 406–416.
[38] B. D. Liboiron, K. H. Thompson, G. R. Hanson, E. Lam, N.Aebischer, C. Orvig, J. Am. Chem. Soc. 2005, 127, 5104–5114.
[39] P. Buglyó, E. Kiss, I. Fábián, T. Kiss, D. Sanna, E. Garribba,G. Micera, Inorg. Chim. Acta 2000, 306, 174–183.
[40] P. Buglyó, T. Kiss, E. Kiss, D. Sanna, E. Garribba, G. Micera,J. Chem. Soc., Dalton Trans. 2002, 2275–2282.
[41] D. Hollender, K. Nerinovski C. Luchinat, T. Kiss, I. Bertini,unpublished results.
[42] G. Gran, Acta Chem. Scand. 1950, 4, 559–573.[43] I. Nagypál, I. Fábián, Inorg. Chim. Acta 1982, 61, 109–116.[44] A. Rockenbauer, L. Korecz, Appl. Magn. Reson. 1996, 10, 29–
43.[45] D. Sanna, I. Bódi, S. Bouhsina, G. Micera, T. Kiss, J. Chem.
Soc., Dalton Trans. 1999, 3275–3282.[46] L. Zékány, I. Nagypál in Computational Methods for the Deter-
mination of Stability Constants (Ed.: D. Leggett), Plenum, NewYork, 1985, pp. 291–353.
Received: April 6, 2006Published Online: August 15, 2006