Embed Size (px)
Citation preview

KINDLY REFER TO THE LAST PAGE OF THIS PUBLICATION FOR IMPORTANT DISCLOSURES
30 September 2013 | Initiate coverage
BIMB Holdings Berhad NEUTRAL All the positives have been priced in Target Price (TP):RM 4.40
INVESTMENT HIGHLIGHTS
• We initiate coverage on BIMB Holdings (BHB) with a
NEUTRAL call at a TP of RM4.40 based on 1.8x PBV.
• We believe that the positives on the stock, including the
news flow of it acquiring 49.0% equity stake in BIMB from
DFG and LTH, have been priced in.
• Based on BHB’s 1HFY13 profit before zakat and taxation
(PBZT) growth, it is on track to achieve its ROE target (based
on PBZT) of 20.0% for FY13.
• Strong personal financing growth in the last three quarters
led to a brisk expansion in loan base.
Strong 1HFY13 PBZT growth of 18.0%yoy. Annualising BHB’s
PBZT for 1HFY13, it is on track to achieve its FY13 ROE target of
20.0%. For 1HFY13, BHB’s net profit improved compared to 1HFY12.
This was contributed by higher net income and lower impairment for
loan losses. The Group’s higher net income for 1HFY13 was driven by
higher income from investment of depositors’ funds and income from
investment of shareholders’ funds. The rise in income from investment
of depositors’ funds was driven by net financing growth of 9.6%yoy.
Meanwhile, income growth from investment of shareholder’s funds
was supported by higher net gains from fx transactions and higher
fees and commission. Also, driving the increase was a 14.7%yoy
growth in income from Takaful business.
Customer deposits grew at CAGR of 13.0% over the past five
years. In FY12, customer deposits grew 86.2%yoy to RM32.4b. For
1HFY13, current and savings deposits (CASA) grew 6.2%yoy. The
Group’s CASA ratio of 36.5% as at end 1HFY13 was higher than the
industry’s CASA ratio of 26.6% (as at end May’13).
Bank Islam (BIMB) the main revenue and profit driver for BHB.
For the past three financial years (FY10-FY12), BIMB has consistently
contributed at least 80.0% of BHB’s PBZT (Refer Figure 1). For
1HFY13, BIMB contributed 79.1% of BHB’s revenue and 80.2% of
BHB’s PBZT.
Meanwhile, Takaful Malaysia, BHB’s 60.96% owned subsidiary
contributed around mid-teen percentages to BHB’s PBZT for the past
three financials (FY10-FY12). In 1HFY13, Takaful Malaysia’s
contribution to BHB’s PBZT was higher at 20.5%.
RETURN STATS
Price (27 Sept ‘13) RM4.68
Target Price RM4.40
Expected Share Price Return -6.0%
Expected Dividend Yield +3.1%
Expected Total Return -2.9%
STOCK INFO
KLCI 1,776.16
Bursa / Bloomberg 5073 /
BIMB MK
Board / Sector Main/ Finance
Syariah Compliant Yes
Issued shares (mil) 1,066.8m
Par Value (RM) 1.00
Market cap (RM’m) 4,992.6
Price over NA 2.4x
52-wk price Range RM2.80-RM5.03
Beta (against KLCI) 1.14
3-mth Avg Daily Vol 0.88m
3-mth Avg Daily Value RM3.87m
Major Shareholders
Lembaga Tambung Haji 51.17%
EPF 9.72%
Yayasan Pelaburan PP 5.42%
MIDF EQUITY BEAT Monday, 30 September 2013
2
Table 1: Investment Statistics
*Financial year end has been changed from June to Dec in 2010.There were 18 months in FY10 compared to 12 months in FY11 Source: Company, MIDFR
In terms of business segment, Takaful Malaysia has been the 2nd largest contributor to BHB’s revenue and profit.
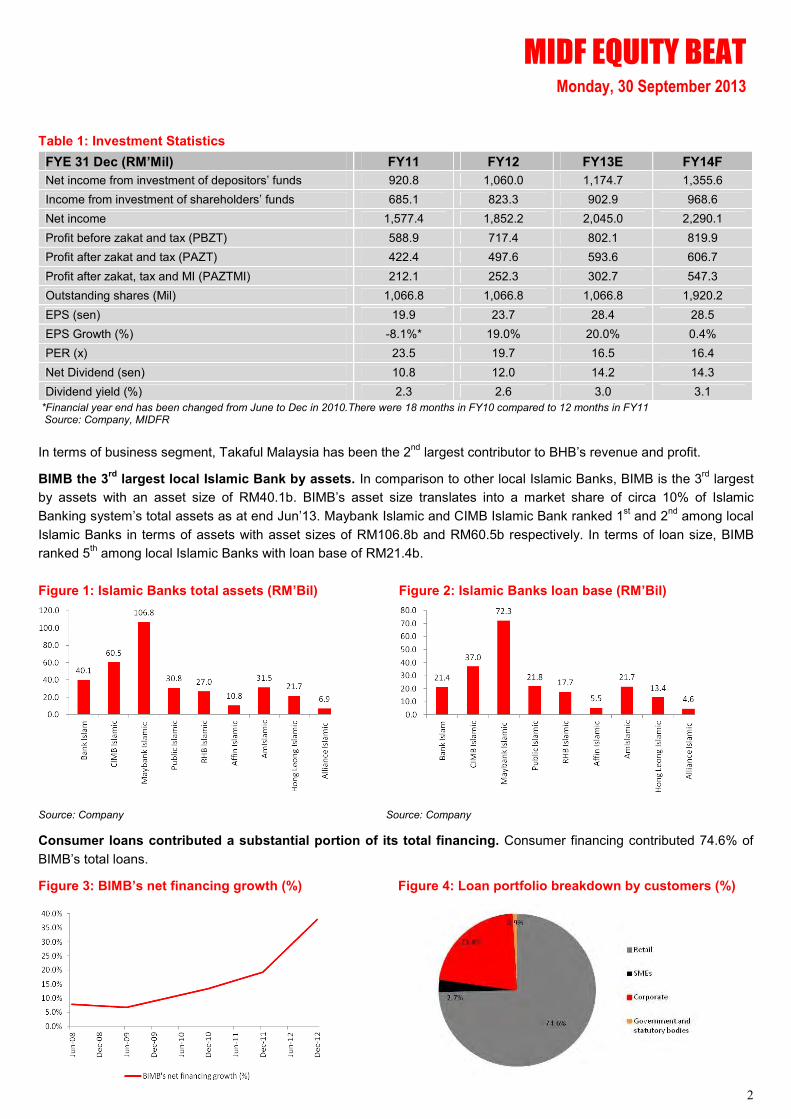
BIMB the 3rd
largest local Islamic Bank by assets. In comparison to other local Islamic Banks, BIMB is the 3rd largest
by assets with an asset size of RM40.1b. BIMB’s asset size translates into a market share of circa 10% of Islamic
Banking system’s total assets as at end Jun’13. Maybank Islamic and CIMB Islamic Bank ranked 1st and 2
nd among local
Islamic Banks in terms of assets with asset sizes of RM106.8b and RM60.5b respectively. In terms of loan size, BIMB
ranked 5th among local Islamic Banks with loan base of RM21.4b.
Figure 1: Islamic Banks total assets (RM’Bil) Figure 2: Islamic Banks loan base (RM’Bil)
Source: Company Source: Company
Consumer loans contributed a substantial portion of its total financing. Consumer financing contributed 74.6% of
BIMB’s total loans.
Figure 3: BIMB’s net financing growth (%) Figure 4: Loan portfolio breakdown by customers (%)
FYE 31 Dec (RM’Mil) FY11 FY12 FY13E FY14F
Net income from investment of depositors’ funds 920.8 1,060.0 1,174.7 1,355.6
Income from investment of shareholders’ funds 685.1 823.3 902.9 968.6
Net income 1,577.4 1,852.2 2,045.0 2,290.1
Profit before zakat and tax (PBZT) 588.9 717.4 802.1 819.9
Profit after zakat and tax (PAZT) 422.4 497.6 593.6 606.7
Profit after zakat, tax and MI (PAZTMI) 212.1 252.3 302.7 547.3
Outstanding shares (Mil) 1,066.8 1,066.8 1,066.8 1,920.2
EPS (sen) 19.9 23.7 28.4 28.5
EPS Growth (%) -8.1%* 19.0% 20.0% 0.4%
PER (x) 23.5 19.7 16.5 16.4
Net Dividend (sen) 10.8 12.0 14.2 14.3
Dividend yield (%) 2.3 2.6 3.0 3.1

MIDF EQUITY BEAT Monday, 30 September 2013
3
Personal financing (mainly to GLC employees with salary deduction) contributed 34.3% of BIMB’s total loan base and
followed by housing loans at 26.2% of total loans. In recent quarters, growth of personal financing was the key driver to
BIMB’s financing expansion. Presently, BIMB has a loan mix of 55%:45% between floating rate and fixed rate loans.
BIMB achieved a record profit in FY12. BIMB reported a PBZT of RM597.4m (+21.3%yoy) in FY12 which was a record
PBZT achieved since its inception in 1983. BIMB undertook a sustainable growth plan (SGP) with two key purposes: (i) to
return to profitability, and (ii) to position the Bank for sustainable growth. Through this plan, the Bank’s PBZT rose
21.8%yoy to RM600.3m with an ROE of 20.4% in FY12 (FY11: 18.4%). BIMB’s ROA grew 10bps yoy to 1.7% in FY12.
H2E, the new strategic blueprint (2013-2015). H2E, stands for Hijrah to Excellence, is BIMB’s new strategic plan
commencing 2013 until 2015. H2E focuses on 6 pillars, (i) Robust Organic Growth, (ii) Service Excellence, (iii) Shariah-
led Innovation, (iv) Resource Optimisation, (v) Employer of Choice, and (vi) Regionalisation. For FY13 to FY15, BIMB
targets to achieve a PBZT growth of 15.0% p.a. The bank targets to continue the strong growth momentum for its retail
banking, a key area of strength. BIMB targets a loan portfolio mix of 70% for consumer financing and 30% for business
financing. It plans to reduce its concentration in personal financing with a stronger growth in housing loans. For corporate
financing, it targets to finance projects under ETP.
BIMB plans to expand its delivery channels by opening more branches and outlets. Presently BIMB has 130
branches. By 2015, it intends to open 6 new branches, 3 new Ar-Rahnu outlets, 30 self-service terminals, and 2 Bureaus
De Change.
Bank Islam’s strategic plan transition (H2E) H2E Growth Targets (2013-2015)
Source: Company Source: Company
Figure 5: Contribution by business segments to Figure 6: Trend of BHB’s Net Profit (RM’Mil) and BHB’s PBZT (%) Growth (%)
Source: Company Source: Company
2012 2013-2015
Asset growth 16.2% 15.0% p.a
Financing growth 37.8% 25.0% p.a
Financing/deposit ratio 61.5% 75.0% by 2015
Non-fund based income 13.5% 15.0% by 2015
Pretax profit growth 21.8% 15.0% p.a

MIDF EQUITY BEAT Monday, 30 September 2013
4
Figure 7: Ownership of BHB (%) Figure 8: Net Financing to Deposit Ratio (%)
Source: Company Source: Company
Acquiring remaining 49.0% stake in BIMB (proposed acquisition). In Aug’13, BIMB announced that they have
entered into a Sale & Purchase agreement with Dubai Financial Group (DFG) and Lembaga Tabung Haji (LTH) to
acquire the remaining 49.0% stake in BIMB. Currently, DFG and LTH own 30.47% and 18.53% of BIMB shares
respectively. BHB holds 51.0% equity in BIMB and plans to fully own the subsidiary. With the acquisition of BIMB, BHB is
envisaged to be able to further strengthen its position in Islamic finance. The purchase price for the 49.0% equity stake in
BIMB translates into acquisition PB multiple of 1.9x based on BIMB’s net assets as at 31 Dec 2012. The deal will enable
BHB to recognise fully the profits of BIMB as wholly owned subsidiary of the Group in the future, riding on the growth
potential of the Bank.
Funding proposed acquisition via Rights Issues cum Warrants and Sukuk Securities. Funding for the acquisition
will be through Rights Issue cum Warrants and Sukuk Securities (Refer Table 2 below). For each of the existing 5 BHB
shares owned, shareholders of BHB will be able to subscribe to 2 Right Shares with 2 free Warrants (Indicative Rights
Share Price: RM3.60 and Warrants Exercise Price: RM3.9962). Warrants can be converted to ordinary shares of BHB on
a 1:1 conversion basis. The funding via Rights Issues and Warrants is expected to increase BHB’s outstanding shares to
1,920.2m shares from 1,066.8m shares assuming 100% conversion of Warrants and full subscription of Rights Shares.
Table 2: Funding for Proposed Acquisition
Source: Company
Alternative collateral proposed for Sukuk Securities. At the end of Aug’13, BNM announced that it had no objection to
BHB’s proposed acquisition of the 49.0% shares in BIMB from LTH and DFG. However, BNM will not allow BHB’s shares
to be pledged as collateral for the Sukuk Securities to be raised to fund the proposed acquisition. Arising from that, the
management of BHB has proposed for alternative collateral for the Sukuk Securities. Its management has proposed for
proceeds from the exercise of warrants conversion to be secured as collateral for the Sukuk Securities instead. It has
proposed for an assignment and eventually a charge over a sinking fund account which the proceeds from the warrant
conversion will be deposited into. We believe that the alternative proposed collateral is now pending the approval of BNM
to proceed further on the acquisition. Some time delay is expected due to this issue. Nonetheless, the overall deal still
looks positive and we expect the proposed acquisition to be completed eventually.
Proceeds raised from:
Current Scenario @ RM3.1795/USD Maximum Scenario @ RM3.35/USD
(RM’Mil) (RM’Mil)
Proposed Rights Issue with Warrants 1,536.2 1,536.2
Proposed Issuance of Sukuk Securities
1,317.5 1,471.3
Total 2,853.7 3,007.5

MIDF EQUITY BEAT Monday, 30 September 2013
5
Benefits from the proposed acquisition. The proposed acquisition will allow BHB to fully recognise the profits of BIMB
in the future, with 100% ownership in BIMB. Also, it will allow the Group to have greater flexibility to restructure its
companies under the Financial Holding Company structure based on the requirements of the Financial Services Act
(FSA) and Islamic Financial Services Act (ISFA). This will allow it to best optimise the capital ratios of the companies
under BHB to meet regulatory authority’s capital requirements.
FY14 net profit forecast based on 2 key assumptions. We expect the proposed acquisition to be finalised by end
FY13. As such, the acquisition will have no impact to our forecast for FY13. However, for FY14, our net profit forecast has
based on the following assumptions: (i) The acquisition will be carried out at the maximum scenario of exchange rate
possible as stated in the agreement of RM3.35/USD (See Table 3 below), and (ii) Assumed 100% subscription for Rights
Shares and full conversion of Warrants issued into ordinary shares of BHB which effectively expands the number of
shares outstanding from 1,066.8m to 1,920.2m
Initiate with NEUTRAL call with a target price of RM4.40 based on FY14 BVPS pegged to a PB multiple of 1.8x.
Our valuation is premised on the successful acquisition of the 49.0% stake of BIMB. We have adjusted the number of
outstanding shares for FY14 based on the assumption that the acquisition will be finalized by end of FY13. There has
been a slight delay due to the proposed changes to collateral to be utilised for the Sukuk Securities after BNM’s
feedback. Nonetheless, we believe BHB will eventually complete the acquisition of the 49.0% stake in BIMB. We believe
that much of the positives on the stock inclusive the news flow of it acquiring the 49.0% equity stake in BIMB from DFG
and LTH have priced in. Hence, we initiate coverage with a NEUTRAL call in view of a limited near term upside potential
on the stock. Our valuation is based on a PB multiple of 1.8x which is close the banking sector’s historical average PB
ratio of around 1.7x to 1.8x.
Table 3: Possible Acquisition Scenarios
Description of utilization of proceeds
Note
Current Scenario Maximum Scenario
@ RM3.1795/USD @ RM3.35/USD
(RM’Mil) (RM’Mil)
For payment of the Purchase
Consideration
DFG stake: USD550Mil 1,748.7 1,842.5
LTH stake: USD335Mil 1,063.9 1,120.9
Total: USD885Mil 2,812.6 2.963.4
Estimated stamp duty for the
Proposed Acquisitions
Approximately 0.3% of the total purchase
consideration 8.5 8.9
Estimated expenses for
Proposal Rights Issues,
Warrants and Sukuk
Securities
Includes expenses for the Proposed Rights Issue
with Warrants and Sukuk Securities (stamp duty,
professional fees, fees payable to the authorities,
printing cost of the circular and abridged
prospectus, advertising and other miscellaneous
expenses)
15.9 17.0
Working capital Expenses utilised for the Group's day-to-day
operations 16.7 18.2
Total Expenses Required 2,853.7 3,007.5
Source: Company
Background. BHB was established on 20 March 1997. It was listed on the Main Market of Bursa Malaysia six months
later. BHB is an investment holding company for Malaysia’s pioneer Shariah-compliant business entities and involves
mainly in Islamic banking, takaful insurance and stock broking. It is well-positioned to assist the aspirations in
Government’s establishing the country as a vibrant International Islamic Financial Center.
MIDF EQUITY BEAT Monday, 30 September 2013
6
Corporate Structure
51.17% 5.08% 5.11% 9.53% 29.11%
18.53%
30.47%
51.0% 60.96% 100.0% 100.0% 48.0%
49%
100% 63.09% 51%
100% 56% 100%
100% 42.73% 57.24% 100%
100% 52.67% 100%
100%
20%
Tabung Haji ASB PNB EPF Others
DFG LLC
BIMB Holdings
Berhad
Bank Islam Takaful MalaysiaBIMB Securities (Holdings)
Sdn BhdSyarikat Al-Ijarah Islamic Banking & Finance Institute Malaysia
BIMB Investment
Management Berhad
BIMB Foreign Currency
Clearing Agency Sdn Bhd
Asean Retakaful
International Ltd
PT Syarikat Takaful
Indonesia
BIMB Securities Sdn Bhd
BIMSBC Assets Management
Sdn Bhd
BIMSBC Nominees (Asing)
Sdn Bhd
BIMSBC Nominees
(Tempatan) Sdn Bhd
Farihan Corporation Sdn
Bhd
Bank Islam Trust Co.
(Labuan)
Amana Bank Ltd
Al-Wakalah Nominees
(Tempatan) Sdn Bhd
PT Asuransi Takaful
Keluarga
PT Asuransi Takaful
Umum
Source: MIDFR, BIMB
*DFG LLC: Dubai Financial Group LLC
BIMB continues to grow... BIMB is Malaysia’s pioneer Islamic bank which has been in business for 30 years since
1983. It is now the 3rd largest Islamic Bank in Malaysia in asset-size (current total assets: RM41.1b) and has more than
five million customers. To accommodate a larger customer base, BIMB has an impressive 130 branches with plans to
further add five more branches by end FY13. These branches will be situated in Padang Garong, Kelantan; Sungai
Petani, Kedah; Senawang, Negeri Sembilan; KL Sentral and at the new building of Utusan Malaysia situated at Jalan
Chan Sow Lin. The long-term target is to establish 150 branches by end FY15.
Syarikat Takaful Malaysia the 2nd largest revenue contributor to BHB. The incorporation of Syarikat Takaful
Malaysia was based on the recommendation of the “Task Force on the Study for the Establishment of an Islamic
Insurance Company in Malaysia” which was set up by the Government of Malaysia in 1981.
BIMB Securities (BIMBS), Syarikat Al-ijarah and Islamic Banking & Finance Institute Malaysia. As an investment
company, BHB is also involved in stockbroking and other shariah-complaint financial services provider through its
subsidiaries.
BIMBS is the first full-fledged shariah-compliant stock broking company in Malaysia. BIMBS was incorporated on
21st February 1994. BIMBS lays out a platform in which Muslim and Non-Muslim are able to invest in shares of listed
companies which only deal with Shariah compliant activities (based on the List of Shariah-Compliant Securities by the
Shariah Advisory Council of the Securities Commission (SC).
Syarikat Al-Ijarah is a private limited company and a wholly-owned subsidiary of BHB. It was incorporated in
Malaysia on 31st December 1983. It owns movable and immovable fixed assets and then provides leasing services of the
assets to companies within BHB group.
The Islamic Banking & Finance Institution Malaysia (IBFIM). IBFIM, an industry-owned institution commenced
operations on February 2001. The main purpose of its establishment was to produce well-trained, high competence
personnel and executives with the required talent in the Islamic finance industry.
MIDF EQUITY BEAT Monday, 30 September 2013
7
Key Strengths
• Low foreign shareholdings. BHB has low foreign shareholdings of 3.99% as at end June 2013. Hence, it is less
susceptible to a sell down in the event of foreign fund outflows from investment in local equities.
• Pioneer Islamic Bank since 1983 with key strength in consumer financing. BIMB is of the established Islamic
Banks locally and the 3rd largest among local Islamic Banks in terms of asset size.
• Healthy asset quality. The Group has a low gross impaired financing (GIF) ratio of 1.36% which is lower than the
Islamic Banking System’s GIF ratio.
Key Risks
• Regulatory lending guideline changes. Unexpected changes on lending guidelines by regulatory authorities may
impact the loan growth of BIMB and its profit contribution to BHB. As BIMB’s loan portfolio largely comprises of
consumer loans, further stringent guidelines on retails loans in addressing high household debt locally is expected to
impact BIMB’s net profit.
• Slower loan growth than expected and higher than expected credit cost. Weaker than expected macro
economic conditions and potential further rationalisation of subsidies locally to trim fiscal deficits may result in lower
exports and higher inflation. This may lead to a moderation in BIMB’s loan growth and potentially increase its credit
cost higher than our assumptions.
• Intensified competition in the Islamic Banking space may result in lower financing margin. Greater intensity in
competition among banks in Islamic Banking may result in lower than expected margin and drop in net income from
investment of depositors’ funds.
• Higher regulatory capital requirements likely to cause dilution in earnings. Should the regulatory authority
impose higher capital ratio requirements on holding company of banking groups, it is likely that BHB would need to
raise the additional capital. In the event that the additional capital requirements are to be raised from rights issue,
there will be dilution to its earnings.
This would also be the case if the Group intends to embark on any expansions in line with its regionalisation focus
under H2E strategic blueprint. In this situation, we believe additional capital would also be required and dilution to its
earnings is also likely. BIMB as we understand is still keen on an entry to the Indonesian market.
MIDF EQUITY BEAT Monday, 30 September 2013
8
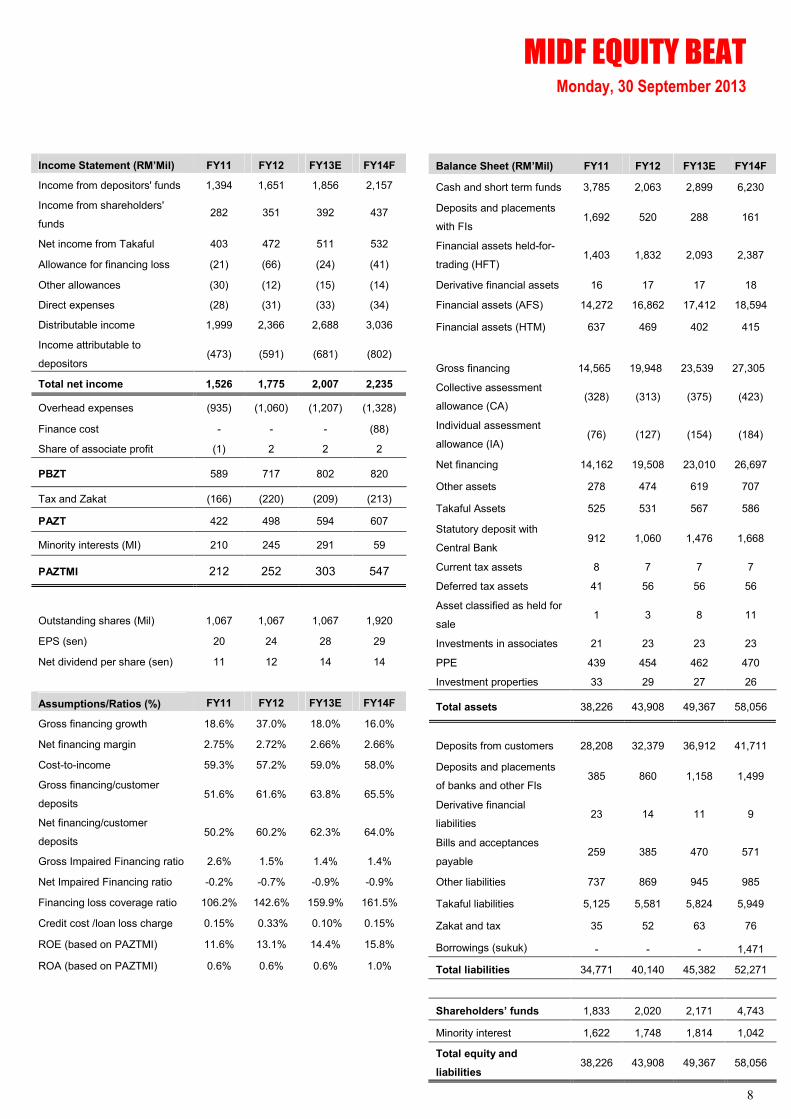
Income Statement (RM’Mil) FY11 FY12 FY13E FY14F
Income from depositors' funds 1,394 1,651 1,856 2,157
Income from shareholders'
funds 282 351 392 437
Net income from Takaful 403 472 511 532
Allowance for financing loss (21) (66) (24) (41)
Other allowances (30) (12) (15) (14)
Direct expenses (28) (31) (33) (34)
Distributable income 1,999 2,366 2,688 3,036
Income attributable to
depositors (473) (591) (681) (802)
Total net income 1,526 1,775 2,007 2,235
Overhead expenses (935) (1,060) (1,207) (1,328)
Finance cost - - - (88)
Share of associate profit (1) 2 2 2
PBZT 589 717 802 820
Tax and Zakat (166) (220) (209) (213)
PAZT 422 498 594 607
Minority interests (MI) 210 245 291 59
PAZTMI 212 252 303 547
Outstanding shares (Mil) 1,067 1,067 1,067 1,920
EPS (sen) 20 24 28 29
Net dividend per share (sen) 11 12 14 14
Assumptions/Ratios (%) FY11 FY12 FY13E FY14F
Gross financing growth 18.6% 37.0% 18.0% 16.0%
Net financing margin 2.75% 2.72% 2.66% 2.66%
Cost-to-income 59.3% 57.2% 59.0% 58.0%
Gross financing/customer
deposits 51.6% 61.6% 63.8% 65.5%
Net financing/customer
deposits 50.2% 60.2% 62.3% 64.0%
Gross Impaired Financing ratio 2.6% 1.5% 1.4% 1.4%
Net Impaired Financing ratio -0.2% -0.7% -0.9% -0.9%
Financing loss coverage ratio 106.2% 142.6% 159.9% 161.5%
Credit cost /loan loss charge 0.15% 0.33% 0.10% 0.15%
ROE (based on PAZTMI) 11.6% 13.1% 14.4% 15.8%
ROA (based on PAZTMI) 0.6% 0.6% 0.6% 1.0%
Balance Sheet (RM’Mil) FY11 FY12 FY13E FY14F
Cash and short term funds 3,785 2,063 2,899 6,230
Deposits and placements
with FIs 1,692 520 288 161
Financial assets held-for-
trading (HFT) 1,403 1,832 2,093 2,387
Derivative financial assets 16 17 17 18
Financial assets (AFS) 14,272 16,862 17,412 18,594
Financial assets (HTM) 637 469 402 415
Gross financing 14,565
19,948
23,539
27,305
Collective assessment
allowance (CA) (328) (313) (375) (423)
Individual assessment
allowance (IA) (76) (127) (154) (184)
Net financing 14,162 19,508 23,010 26,697
Other assets 278 474 619 707
Takaful Assets 525 531 567 586
Statutory deposit with
Central Bank 912 1,060 1,476 1,668
Current tax assets 8 7 7 7
Deferred tax assets 41 56 56 56
Asset classified as held for
sale 1 3 8 11
Investments in associates 21 23 23 23
PPE 439 454 462 470
Investment properties 33 29 27 26
Total assets 38,226 43,908 49,367 58,056
Deposits from customers 28,208 32,379 36,912 41,711
Deposits and placements
of banks and other FIs 385 860 1,158 1,499
Derivative financial
liabilities 23 14 11 9
Bills and acceptances
payable 259 385 470 571
Other liabilities 737 869 945 985
Takaful liabilities 5,125 5,581 5,824 5,949
Zakat and tax 35 52 63 76
Borrowings (sukuk) - - - 1,471
Total liabilities 34,771 40,140 45,382 52,271
Shareholders’ funds 1,833 2,020 2,171 4,743
Minority interest 1,622 1,748 1,814 1,042
Total equity and
liabilities 38,226 43,908 49,367 58,056

MIDF EQUITY BEAT Monday, 30 September 2013
9
Table 4: Breakdown of BIMB’s loans by product type (RM’Mil)
Loans 1Q11 2Q11 3Q11 4Q11 1Q12 2Q12 3Q12 4Q12 1Q13 2Q13
Cash line 553.9 608.1 696.8 406.6 417.8 454.2 536.3 618.6 665.1 680.2
Housing loans 9,700.4 10,133.6 10,600.7 4,393.0 4,560.0 4,758.5 4,946.9 5,186.3 5,403.0 5,717.0
Syndicated term loans 346.2 393.6 401.4 164.6 174.7 204.3 304.4 426.1 484.4 630.0
Lease receivables 649.6 611.8 607.9 280.4 273.4 268.0 207.9 203.6 202.1 207.1
Bridging financing 191.7 229.2 229.2 160.8 159.0 158.9 152.9 151.1 153.4 154.3
Personal financing 5,440.1 5,747.2 6,109.2 3,786.4 4,122.4 4,953.7 6,007.2 6,608.1 6,931.1 7,501.0
Other term financing 3,840.3 4,042.3 4,592.4 3,358.5 3,500.8 3,810.8 4,154.3 4,547.0 5,011.7 5,389.5
Staff loans/financing 307.4 314.7 314.1 157.5 158.1 161.2 163.7 165.4 166.4 170.3
Credit/charge cards
receivables 437.8 445.0 448.1 451.5 442.7 433.9 423.5 431.0 420.1 424.6
Trade bills discounted 1,300.6 1,371.9 1,219.5 1,309.6 1,376.2 1,446.0 1,596.1 1,480.2 1,360.7 863.9
Trust receipts 58.3 44.1 46.3 48.9 48.9 48.6 46.8 50.3 36.7 35.8
Pawn broking 18.6 24.7 31.7 47.4 60.9 75.9 - 80.6 79.9 84.3
Total Gross Financing 12,842.1 13,230.5 13,728.5 14,565.3 15,294.9 16,773.9 18,540.2 19,948.1 20,914.6 21,858.1
Table 5: Percentage of loans by product type (%)
Loans 1Q11 2Q11 3Q11 4Q11 1Q12 2Q12 3Q12 4Q12 1Q13 2Q13
Cash line 2.4% 2.5% 2.8% 2.8% 2.7% 2.7% 2.9% 3.1% 3.2% 3.1%
Housing loans 42.5% 42.3% 41.9% 30.2% 29.8% 28.4% 26.7% 26.0% 25.8% 26.2%
Syndicated term loans 1.5% 1.6% 1.6% 1.1% 1.1% 1.2% 1.6% 2.1% 2.3% 2.9%
Lease receivables 2.8% 2.6% 2.4% 1.9% 1.8% 1.6% 1.1% 1.0% 1.0% 0.9%
Bridging financing 0.8% 1.0% 0.9% 1.1% 1.0% 0.9% 0.8% 0.8% 0.7% 0.7%
Personal financing 23.8% 24.0% 24.1% 26.0% 27.0% 29.5% 32.4% 33.1% 33.1% 34.3%
Other term financing 16.8% 16.9% 18.2% 23.1% 22.9% 22.7% 22.4% 22.8% 24.0% 24.7%
Staff loans/financing 1.3% 1.3% 1.2% 1.1% 1.0% 1.0% 0.9% 0.8% 0.8% 0.8%
Credit/charge cards
receivables 1.9% 1.9% 1.8% 3.1% 2.9% 2.6% 2.3% 2.2% 2.0% 1.9%
Trade bills discounted 5.7% 5.7% 4.8% 9.0% 9.0% 8.6% 8.6% 7.4% 6.5% 4.0%
Trust receipts 0.3% 0.2% 0.2% 0.3% 0.3% 0.3% 0.3% 0.3% 0.2% 0.2%
Pawn broking 0.1% 0.1% 0.1% 0.3% 0.4% 0.5% 0.0% 0.4% 0.4% 0.4%
Total 100.0% 100.0% 100.0% 100.0% 100.0% 100.0% 100.0% 100.0% 100.0% 100.0%
MIDF EQUITY BEAT Monday, 30 September 2013
10
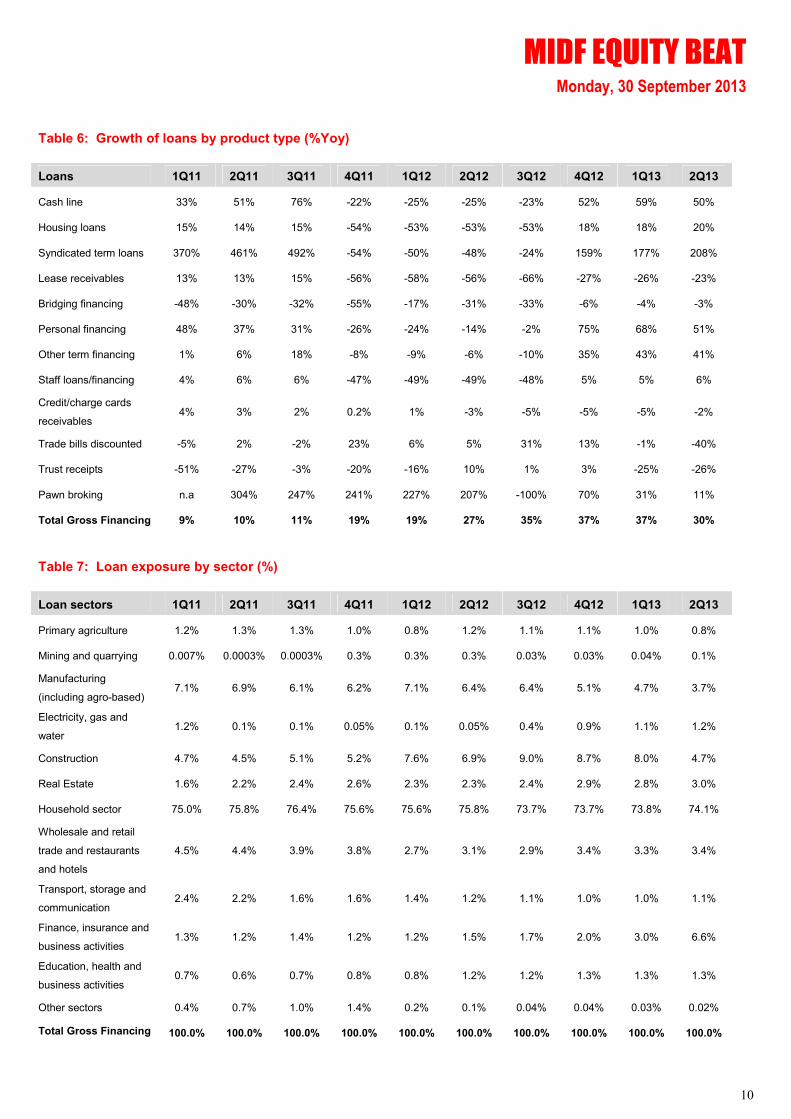
Table 6: Growth of loans by product type (%Yoy)
Loans 1Q11 2Q11 3Q11 4Q11 1Q12 2Q12 3Q12 4Q12 1Q13 2Q13
Cash line 33% 51% 76% -22% -25% -25% -23% 52% 59% 50%
Housing loans 15% 14% 15% -54% -53% -53% -53% 18% 18% 20%
Syndicated term loans 370% 461% 492% -54% -50% -48% -24% 159% 177% 208%
Lease receivables 13% 13% 15% -56% -58% -56% -66% -27% -26% -23%
Bridging financing -48% -30% -32% -55% -17% -31% -33% -6% -4% -3%
Personal financing 48% 37% 31% -26% -24% -14% -2% 75% 68% 51%
Other term financing 1% 6% 18% -8% -9% -6% -10% 35% 43% 41%
Staff loans/financing 4% 6% 6% -47% -49% -49% -48% 5% 5% 6%
Credit/charge cards
receivables 4% 3% 2% 0.2% 1% -3% -5% -5% -5% -2%
Trade bills discounted -5% 2% -2% 23% 6% 5% 31% 13% -1% -40%
Trust receipts -51% -27% -3% -20% -16% 10% 1% 3% -25% -26%
Pawn broking n.a 304% 247% 241% 227% 207% -100% 70% 31% 11%
Total Gross Financing 9% 10% 11% 19% 19% 27% 35% 37% 37% 30%
Table 7: Loan exposure by sector (%)
Loan sectors 1Q11 2Q11 3Q11 4Q11 1Q12 2Q12 3Q12 4Q12 1Q13 2Q13
Primary agriculture 1.2% 1.3% 1.3% 1.0% 0.8% 1.2% 1.1% 1.1% 1.0% 0.8%
Mining and quarrying 0.007% 0.0003% 0.0003% 0.3% 0.3% 0.3% 0.03% 0.03% 0.04% 0.1%
Manufacturing
(including agro-based) 7.1% 6.9% 6.1% 6.2% 7.1% 6.4% 6.4% 5.1% 4.7% 3.7%
Electricity, gas and
water 1.2% 0.1% 0.1% 0.05% 0.1% 0.05% 0.4% 0.9% 1.1% 1.2%
Construction 4.7% 4.5% 5.1% 5.2% 7.6% 6.9% 9.0% 8.7% 8.0% 4.7%
Real Estate 1.6% 2.2% 2.4% 2.6% 2.3% 2.3% 2.4% 2.9% 2.8% 3.0%
Household sector 75.0% 75.8% 76.4% 75.6% 75.6% 75.8% 73.7% 73.7% 73.8% 74.1%
Wholesale and retail
trade and restaurants
and hotels
4.5% 4.4% 3.9% 3.8% 2.7% 3.1% 2.9% 3.4% 3.3% 3.4%
Transport, storage and
communication 2.4% 2.2% 1.6% 1.6% 1.4% 1.2% 1.1% 1.0% 1.0% 1.1%
Finance, insurance and
business activities 1.3% 1.2% 1.4% 1.2% 1.2% 1.5% 1.7% 2.0% 3.0% 6.6%
Education, health and
business activities 0.7% 0.6% 0.7% 0.8% 0.8% 1.2% 1.2% 1.3% 1.3% 1.3%
Other sectors 0.4% 0.7% 1.0% 1.4% 0.2% 0.1% 0.04% 0.04% 0.03% 0.02%
Total Gross Financing 100.0% 100.0% 100.0% 100.0% 100.0% 100.0% 100.0% 100.0% 100.0% 100.0%
MIDF EQUITY BEAT Monday, 30 September 2013
11
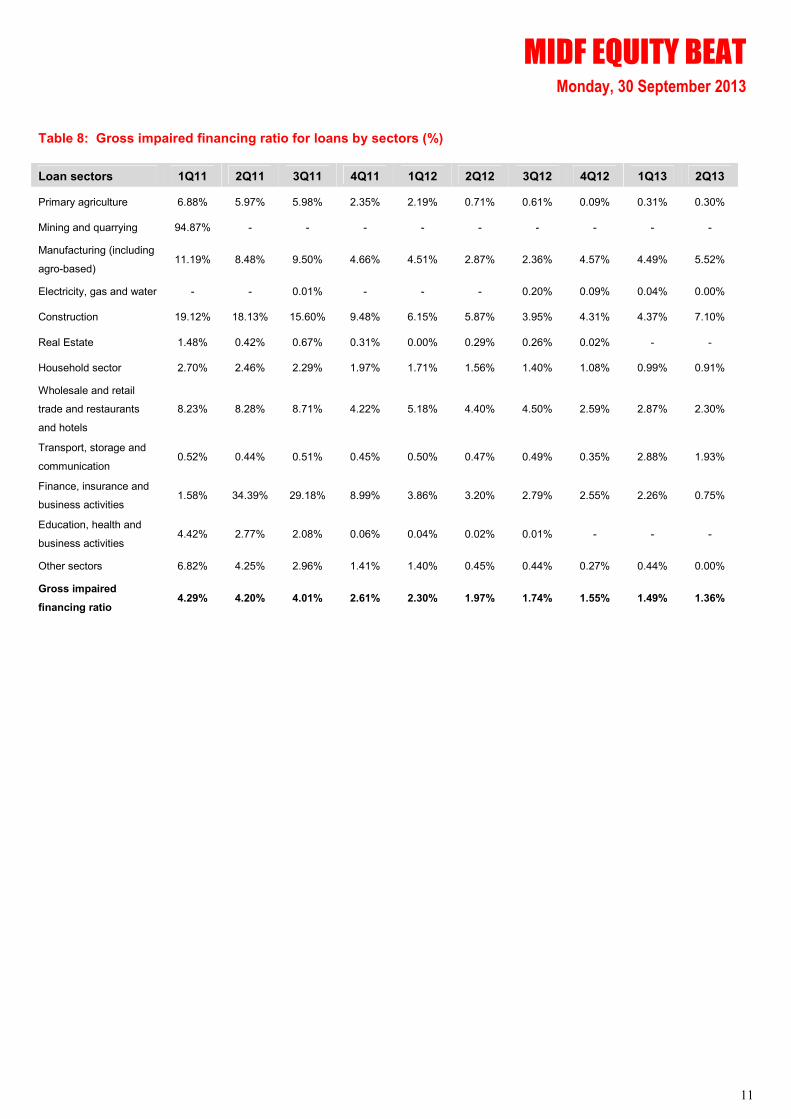
Table 8: Gross impaired financing ratio for loans by sectors (%)
Loan sectors 1Q11 2Q11 3Q11 4Q11 1Q12 2Q12 3Q12 4Q12 1Q13 2Q13
Primary agriculture 6.88% 5.97% 5.98% 2.35% 2.19% 0.71% 0.61% 0.09% 0.31% 0.30%
Mining and quarrying 94.87% - - - - - - - - -
Manufacturing (including
agro-based) 11.19% 8.48% 9.50% 4.66% 4.51% 2.87% 2.36% 4.57% 4.49% 5.52%
Electricity, gas and water - - 0.01% - - - 0.20% 0.09% 0.04% 0.00%
Construction 19.12% 18.13% 15.60% 9.48% 6.15% 5.87% 3.95% 4.31% 4.37% 7.10%
Real Estate 1.48% 0.42% 0.67% 0.31% 0.00% 0.29% 0.26% 0.02% - -
Household sector 2.70% 2.46% 2.29% 1.97% 1.71% 1.56% 1.40% 1.08% 0.99% 0.91%
Wholesale and retail
trade and restaurants
and hotels
8.23% 8.28% 8.71% 4.22% 5.18% 4.40% 4.50% 2.59% 2.87% 2.30%
Transport, storage and
communication 0.52% 0.44% 0.51% 0.45% 0.50% 0.47% 0.49% 0.35% 2.88% 1.93%
Finance, insurance and
business activities 1.58% 34.39% 29.18% 8.99% 3.86% 3.20% 2.79% 2.55% 2.26% 0.75%
Education, health and
business activities 4.42% 2.77% 2.08% 0.06% 0.04% 0.02% 0.01% - - -
Other sectors 6.82% 4.25% 2.96% 1.41% 1.40% 0.45% 0.44% 0.27% 0.44% 0.00%
Gross impaired
financing ratio 4.29% 4.20% 4.01% 2.61% 2.30% 1.97% 1.74% 1.55% 1.49% 1.36%
MIDF EQUITY BEAT Monday, 30 September 2013
12
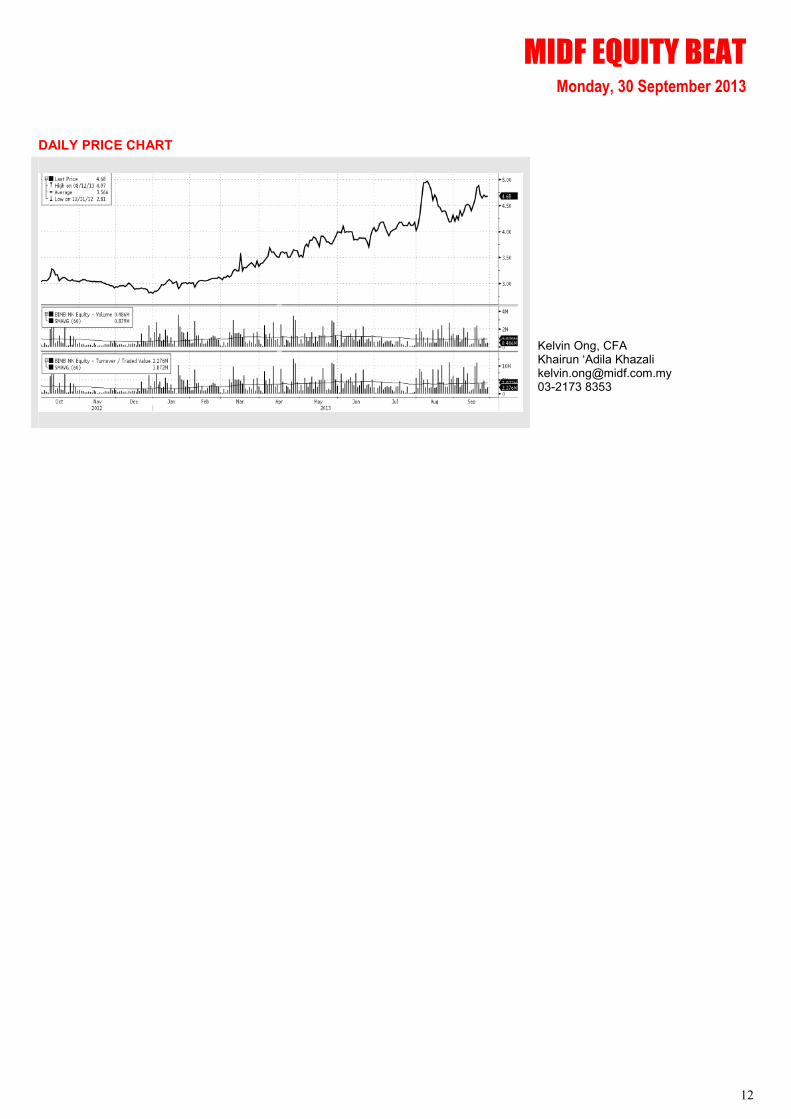
DAILY PRICE CHART
Kelvin Ong, CFA Khairun ‘Adila Khazali [email protected] 03-2173 8353
MIDF EQUITY BEAT Monday, 30 September 2013
13
MIDF RESEARCH is part of MIDF Amanah Investment Bank Berhad (23878 - X).
(Bank Pelaburan)
(A Participating Organisation of Bursa Malaysia Securities Berhad)
DISCLOSURES AND DISCLAIMER
This report has been prepared by MIDF AMANAH INVESTMENT BANK BERHAD (23878-X). It is for
distribution only under such circumstances as may be permitted by applicable law.
Readers should be fully aware that this report is for information purposes only. The opinions contained in
this report are based on information obtained or derived from sources that we believe are reliable. MIDF
AMANAH INVESTMENT BANK BERHAD makes no representation or warranty, expressed or implied, as
to the accuracy, completeness or reliability of the information contained therein and it should not be
relied upon as such.
This report is not, and should not be construed as, an offer to buy or sell any securities or other financial
instruments. The analysis contained herein is based on numerous assumptions. Different assumptions
could result in materially different results. All opinions and estimates are subject to change without
notice. The research analysts will initiate, update and cease coverage solely at the discretion of MIDF
AMANAH INVESTMENT BANK BERHAD.
The directors, employees and representatives of MIDF AMANAH INVESTMENT BANK BERHAD may
have interest in any of the securities mentioned and may benefit from the information herein. Members of
the MIDF Group and their affiliates may provide services to any company and affiliates of such
companies whose securities are mentioned herein This document may not be reproduced, distributed or
published in any form or for any purpose.
MIDF AMANAH INVESTMENT BANK : GUIDE TO RECOMMENDATIONS
STOCK RECOMMENDATIONS
BUY Total return is expected to be >15% over the next 12 months.
TRADING BUY Stock price is expected to rise by >15% within 3-months after a Trading Buy rating has been assigned due to positive newsflow.
NEUTRAL Total return is expected to be between -15% and +15% over the next 12 months.
SELL Total return is expected to be <15% over the next 12 months.
TRADING SELL Stock price is expected to fall by >15% within 3-months after a Trading Sell rating has been assigned due to negative newsflow.
SECTOR RECOMMENDATIONS
POSITIVE The sector is expected to outperform the overall market over the next 12 months.
NEUTRAL The sector is to perform in line with the overall market over the next 12 months.
NEGATIVE The sector is expected to underperform the overall market over the next 12 months.


![W8 Islamic Finance Cases - Zulkifli Hasan · 1987-2002 n Tinta Press Sdn Berhad v BIMB (1987) 1 MLJ 474; 1 CLJ 474: IJarah n Bank Islam Malaysia Berhad v Adnan Omar [1994] 3 CLJ 735;](https://img.dokumen.tips/doc/110x75/60d8f083d03a374b6f3026a8/w8-islamic-finance-cases-zulkifli-hasan-1987-2002-n-tinta-press-sdn-berhad-v-bimb.jpg)