Embed Size (px)
Citation preview

MANAGER:BIMB INVESTMENT MANAGEMENT BERHAD (276246-X)
BIMB DANA AL-MUNSIFANNUAL REPORT FOR THE YEAR ENDED
31 AUGUST 2017
LAPORAN TAHUNAN BAGI TAHUN BERAKHIR 31 OGOS 2017

2
Table of Content
No. Particulars Page
1.0 Manager‟s Report 3
1.1 Fund Name/ Fund Type/ Fund Category/ Fund Investment Objective/ Fund Performance Benchmark/ Fund Distribution Policy
3
1.2 Performance for the Financial Year Ended 31 August 2017 4
1.3 Economic and Market Review 7
1.4 Market Outlook And Strategy 12
1.5 Asset Allocation as at 31 August 2017 14
1.6 Other Performance Data for the Financial Year Ended 31 August 2017 15
1.7 Unit Holdings as at 31 August 2017 16
1.8 Policy on Rebate And Soft Commission 16
2.0 Trustee‟s Report 32
3.0 Shariah Committee‟s Report 33
4.0 Directors‟ Declaration 34
5.0 Independent Auditors‟ Report To The Unitholders of BIMB Dana Al-Munsif
35
6.0 Financial Statements (Audited) 38
7.0 Corporate Directory 63

3
1.0 Manager’s Report
Dear Unit Holders,
We are pleased to present the Manager‟s report of BIMB Dana Al-Munsif for the
financial year ended 31 August 2017.
1.1 Fund Name/ Fund Type/ Fund Category/ Fund Investment Objective/ Fund
Performance Benchmark/ Fund Distribution Policy
Fund Name BIMB Dana Al-Munsif
Fund Type Income and growth
Fund Category Balanced
Fund Investment Objective
The principal investment objective of the Fund is to provide a steady and consistent income and capital appreciation of the units over the medium to long term period. Accordingly, returns shall be
in the form of long term capital growth and regular income distribution to the unit holders.
Note: Any material change to the investment objective of the Fund would require unit holders’ approval.
Fund Performance Benchmark
60:40 ratio of the FBM Emas Shariah Index and 12-month Term Deposit-i Tawarruq (TDT-i) rate of Bank Islam Malaysia Berhad
Fund Distribution
Policy
The Fund intends to pay out annual income distribution to Unit
Holders if sufficient investment income has been accumulated during the year.
Payment Mode for
Income Distribution
Payment into Unit Holders‟ bank account or reinvestment.

4
1.2 Performance for the financial year ended 31 August 2017
1.2.1 Performance review for BIMB Dana Al-Munsif
For the financial year under review, BIMB Dana Al-Munsif (Fund) registered a return of
12.42%, as compared to its benchmark‟s return of 2.92%.
From its commencement on 27 December 2001 to 31 August 2017, the Fund has
registered a total return of 108.76% as compared to its benchmark‟s return of
111.43%.
The selected performance benchmark for the Fund is based on 60:40 ratio of the FBM
Emas Shariah Index and 12-month Term Deposit-i Tawarruq (TDT-i) rate of Bank
Islam Malaysia Berhad.
The Fund‟s strategy has remained to focus on well-established companies that could
potentially pay sustainable dividends and have good prospects for earnings growth.
During its financial year ended 31 August 2017, the Fund was not able to acquire
adequate trading gains to declare income distribution for the year as a result of
unexpected volatility in the markets. Notwithstanding the above, the Manager has
improved the Fund‟s performance via cutting exposure on non-performing stocks and
reinvesting into companies and sectors that offer brighter prospects and potential
growth, resulting in better performance of its Net Asset Value (NAV).
As at 31 August 2017, the Fund has 58.75% exposure in equities, 22.4% in Islamic
debt securities and 18.85% in short term investments, cash and cash equivalents. In
terms of total NAV, the Fund size as at 31 August 2017 was at RM17.96 million, as
compared to RM31.31 million as at 31 August 2016. The NAV per unit of the Fund
has increased to RM0.4861 as at 31 August 2017 from RM0.4324 as at 31 August
2016.
Equity allocation of the Fund had been maintained at around 60% to capitalize more on
share price upside movement for the Fund. Moving forward, the Manager will resume
investing in companies with good earnings visibility, strong balance sheet, and high
dividend yield with good valuation prospects given the suitable opportunity arises.
For the financial year ended 31 August 2017, there were no significant changes to the
state of affairs of the Fund and no circumstances that materially affect the interest of
Unit Holders that have taken place up to the date of this Manager‟s Report.
5
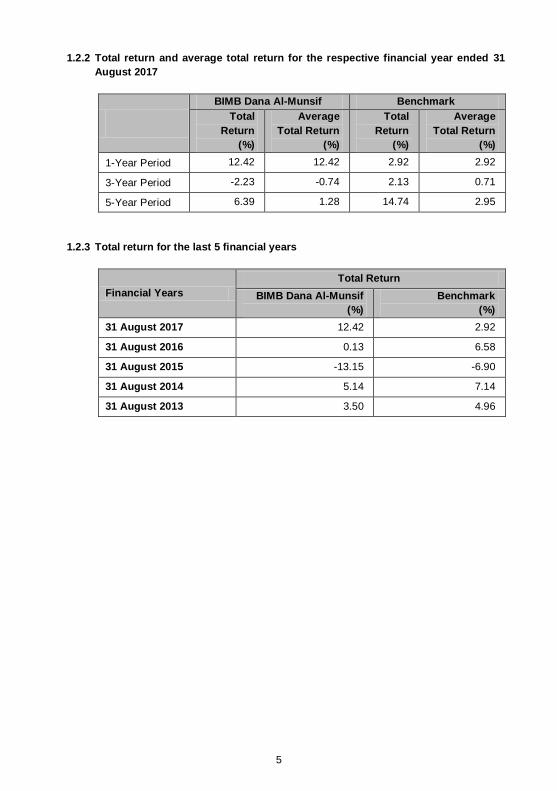
1.2.2 Total return and average total return for the respective financial year ended 31
August 2017
BIMB Dana Al-Munsif Benchmark
Total
Return
(%)
Average
Total Return
(%)
Total
Return
(%)
Average
Total Return
(%)
1-Year Period 12.42 12.42 2.92 2.92
3-Year Period -2.23 -0.74 2.13 0.71
5-Year Period 6.39 1.28 14.74 2.95
1.2.3 Total return for the last 5 financial years
Financial Years
Total Return
BIMB Dana Al-Munsif
(%)
Benchmark
(%)
31 August 2017 12.42 2.92
31 August 2016 0.13 6.58
31 August 2015 -13.15 -6.90
31 August 2014 5.14 7.14
31 August 2013 3.50 4.96
6
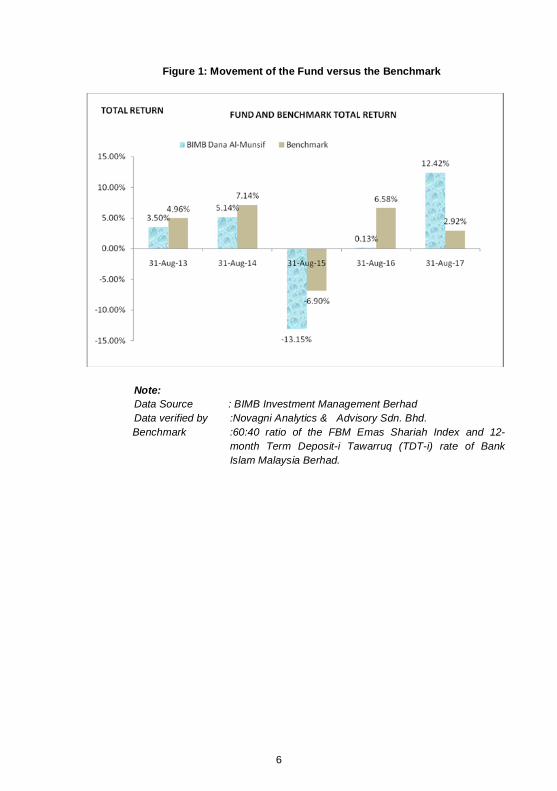
Figure 1: Movement of the Fund versus the Benchmark
Note:
Data Source : BIMB Investment Management Berhad
Data verified by :Novagni Analytics & Advisory Sdn. Bhd.
Benchmark :60:40 ratio of the FBM Emas Shariah Index and 12-
month Term Deposit-i Tawarruq (TDT-i) rate of Bank
Islam Malaysia Berhad.
7
1.3 Economic and Market Review
1.3.1 Economy
Global
The United States („US‟) Gross Domestic Product (GDP) grew at a rate of 2.6% in
the second quarter of 2017 as compared to 1.2% growth in the first quarter of 2017
and 1.8% in the fourth quarter of 2016. The acceleration in GDP for the second
quarter of 2017 was reflected in the upturns in federal government spending and
private inventory investment despite of deceleration in exports.
US headline inflation rate was up 1.9% in August 2017 compared to 1.5% in
September 2016 due to rising lodging and gasoline cost as Hurricane Harvey shut
down refineries in the Gulf coast.
US unemployment rate fell to 4.4% in August 2017 from 5.0% in September 2016 on
the back of rising income, consumer spending and economic growth.
The Euro zone economy grew 0.6% in the second quarter of 2017 as compared to
0.5% in the first quarter 2017 and 0.6% in the fourth quarter of 2016. The Euro zone
economic recovery has gained momentum while unemployment has fallen against a
backdrop of ultra-low interest rates which are among measures implemented by the
European Central Bank (ECB) to boost economic activity.
Euro zone‟s annual inflation increased to 1.5% in August 2017 from 0.4% in
September 2016, driven by better GDP growth in the Euro zone area.
The unemployment rate in the Euro zone area fell to 9.1 % in July 2017 compared to
10.0% in September 2016 that remained at its lowest level since July 2011.
The Chinese economy maintained a growth rate of 6.9% for the second quarter of
2017, maintaining comparable economic growth rate to the first quarter of 2017 as
industrial output and private consumption improved, aided by a robust property
market and recovery on the exports sector.
(Source: Bloomberg and RHB Research Institute Sdn Bhd)
Local
The Malaysian economy grew faster at 5.8% in the second quarter of 2017 as
compared to 5.6% in the first quarter 2017 and 4.5% in the fourth quarter 2016. The
stronger GDP result for the period was due to improvements in private consumption
and exports.
Malaysia‟s headline inflation in August 2017 increased to 3.7% from 1.5% in
September 2016 due to higher cost of food & non-alcoholic beverages, transportation
and housing, in tandem with higher oil prices and stronger GDP growth performance.

8
Bank Negara Malaysia‟s Monetary Policy Committee (MPC) maintained the
Overnight Policy Rate (OPR) at 3.00% during its July meeting to accommodate
growth prospects for the country.
Bank Negara‟s international reserve stood at USD 100.5 billion as at 30 August 2017
as compared to USD 97.7 billion in September 2016 with improvement of capital
inflow from foreign institutional investors into Malaysia.
(Source: Bloomberg, Bank Negara Malaysia and RHB Research Institute Sdn Bhd)
1.3.2 Market Review
Equity
FTSE Bursa Malaysia EMAS Shariah Index (“FBM Shariah”) commenced the year
under review at 12,430.50 points before it declined to the lowest point of 11,845.46 on
30 November 2016. Subsequently, the FBM Shariah gained and peaked at the highest
point of 13,126.04 on 16 May 2017 before ending the financial year at 12,749.09
points on 30 August 2017. For the year under review, the FBM Shariah gained 318.59
points or 2.56% whereas the FBM KLCI gained 65.32 points or 4.05% respectively.
Among the key factors that contributed to the movement of the index are highlighted
below:
The US Federal Reserve declined to raise interest rates in September 2016 ahead of
the US presidential election in November 2016 and reckoned that the US economy
still have room to improve before it run the risk of overheating.
Malaysia‟s Prime Minister unveiled the country‟s budget for 2017 on 21 October 2016
with the aim of capping the federal budget deficit at 3.0% versus 3.1% for 2016 with a
GDP growth target of 4% to 5% for 2017. An average crude oil price of USD45 per
barrel was benchmarked for Federal government‟s 2017 budget.
In November 2016, Donald Trump‟s victory in the U.S. presidential election caught
the general markets off-guard as investors flock to safe heaven assets like gold,
bond and the Japanese yen, perceiving Trump‟s administration would bring
uncertainty to the markets. The Asian markets reacted with a sharp selldown,
however global investors rebalanced their portfolio to take advantage of the
perceived stronger US growth and higher US bond yields.
In December 2016, the Federal Reserve raised the widely anticipated interest rate
hike by 0.25% to 0.75% in light of the healthy expansion pace of the US economy
while counteracting the President elect‟s goal to further stimulate a recovering
economy. During the month, OPEC members agreed to cut oil production to reduce
the global oil supply glut which caused oil prices to rise to a 16-month high above
USD55 per barrel on 5 December 2016.
9
In January 2017, Mr. Donald Trump‟s inauguration as the new president for United
States of America had brought more policy uncertainty to the world with regards to
US-Mexico cross border trade and potential new restriction on immigration and
travelling into US. Nonetheless, the Dow Jones Index and global financial markets
remained steady during the month.
The global equities market welcomed another surprise 25bps rate hike from US
Federal Reserve on the back of stronger than expected US economic data and a pro-
growth stance by the new administration, bringing the Fed fund rates to 1.00% post
rate hike on 15 March 2017.
In April 2017, historic meeting between Donald Trump and China‟s leader Xi Jin P ing
signaled more understanding between the two countries after a summit held in
Florida, USA that could potentially defuse a trade war between the world‟s two
largest economies.
For the second time in 2017, the Federal Reserve raised interest rates in June,
bringing the Fed fund rate to 1.25%. The Federal Reserve‟s second rate hike
approval was in light of a higher GDP growth expectation of 2.2% and lower
unemployment rate 4.3% for 2017. Notwithstanding the above, the move for the
second hike came in amid expectations of a lower inflation rate compared to the
central bank's target.
In August 2017, the North Korea-US dispute escalated to new heights post of North
Korea‟s missile testing exercise that had prompted President Trump to issue a
retaliation warning with catastrophic effects. As such, the risk-averse sentiment had
weighed down Asian markets.
(Source: Bank Negara Malaysia, Bloomberg and RHB Research Institute Sdn. Bhd.)

10
Bond Market and Money Market
a) Global
In November 2016, US Treasury (UST) yields started a surge amid expectation
of the newly-elected President Donald Trump to embark on further fiscal
expansion. Before the election, the UST yields was already pressured upward as
the Federal Reserve policymakers had signaled additional monetary tightening in
the near term while economists had already projected an upbeat US growth in
2017.
The surge in the 2-year US Treasury yield to above 1.3% at the end of June
2017 was well within expectation given the two US Federal Reserve rate hikes to
date. However, US Treasuries strengthened in August 2017 on the back of safe
haven demand from a series of geopolitical tensions arise when North Korea
threatened to attack Guam and launched a missile testing exercise that flew over
Japan.
Notwithstanding the above, during the financial period under review, the UST
yield increased as compared to the yield as at 31 August 2016.
Figure 2: US Treasury Yields
Source: US Treasury Department, 31 August 2017

11
b) Local
The sovereign bonds dominated the local bond market activities when Malaysian
Government Securities (MGS) and Government Investment Issues (GII) recorded
secondary market traded volume of RM835.5 billion for the financial year under
review. Both the government bond yields and corporate bonds yields increased
across the yield curve after the increase of the Fed Fund rate in June 2017 along
with the market expectation that the US Federal Reserve will increase the Fed
Fund Rate in the second half of 2017.
Table 1: Sukuk/ Islamic Bond Yields
Tenure/Date 31 August 2017
(%)
31 August 2016
(%)
Change
* (bps)
3-Year Bonds
GII 3.54 2.85 69.0
AAA Corporate 4.16 3.84 32.0
5-Year Bonds
GII 3.76 3.27 49.0
AAA Corporate 4.29 4.04 25.0
7-Year Bonds
GII 3.98 3.52 46.0
AAA Corporate 4.44 4.16 28.0
10-Year Bonds
GII 4.06 3.64 42.0
AAA Corporate 4.63 4.33 30.0
Source: Bond Pricing Agency Malaysia (BPAM), 31 August 2017

12
Figure 3: Overnight Policy Rate (OPR)
Source: Bank Negara Malaysia (BNM), 31 August 2017
1.4 Market Outlook and Strategy
a) Equity
The equity market outlook for 2017 is expected to be another volatile year.
External factors may likely influence the domestic market sentiment, which
includes the OPEC and Non-OPEC commitment to stabilize the oil glut,
President Trump‟s stance on North Korea‟s nuclear ambition and potential
military strike, ramifications of US interest rate hikes and currency movement,
political sentiment in the Euro zone, China‟s economic position and monetary
policies employed by Central Banks. With potential interest on selective
sector to support the domestic market, the local bourse should be able to
withstand external shocks given the ample domestic liquidity and buying
interest of foreign and local institutional investors.
While the global economy continues to expand at a moderate pace, there has
been increasing divergence in the growth momentum among the major
economies. For most of Asia, growth is supported by the continued
expansion of domestic demand. Looking ahead, the global economy is
expected to continue on a moderate recovery path.

13
For Malaysia, the resilience of domestic consumption remains the support for
growth. With higher spending on infrastructure projects underway, higher
public sector wages adjustments, improve outlook for CPO production
volume and a rebound in Government consumption and expenditure will help
to improve corporate earnings and consumer spending for the year. Going
forward, domestic demand will still remain as the key driver of growth but the
equities market is likely to be influence by key market risk such as outbreak
of war between North Korea and US and also more outflows from emerging
market as the US Federal Reserve expedite its quantitative tightening
measures in 2018 and 2019.
b) Sukuk Market and Money Market
Moving forward, it is viewed that MGS and corporate bonds will trend higher
compared to their average levels in 2H2016, albeit at a moderate pace. This
is despite of bond yields drifting lower in 1H2017 as it is expected that some
upticks in yield movements on the prospect of a third Fed rate hike as the US
economy continues to recover. Malaysia‟s improving economic fundamentals
should provide some cushion against any sharp yield upticks. It is also
expected that yield movements to become relatively less sharp going forward
as investors come to terms with the Trump presidency and central banks
become more transparent when expressing their desired policy direction.
Bank Negara Malaysia‟s (BNM) Monetary Policy Committee (MPC) kept the
overnight policy rate (OPR) unchanged at 3.00% for its sixth straight meeting
on 13 Jul 2017. Looking forward, it is expected that BNM to maintain OPR at
3.00% for the rest of 2017. It is believed that the monetary policy would
unlikely be tightened for the remaining part of this year, as inflation would
likely normalize moving forward, as the economy has just picked up with
Malaysian Ringgit seeing some stabilisation. On the other hand, stronger
domestic economic growth in the country, coupled with more aggressive rate
hikes and plans to reduce the Fed‟s balance sheet in the US, would likely
limit the scope for BNM to cut interest rates.

14
1.5 Asset allocation as at 31 August
BIMB Dana Al-Munsif 2017
(%)
2016
(%)
2015
(%)
Investment in Quoted Securities
Construction - 1.18 0.75
Consumer Products 1.52 1.74 0.37
Financial - 2.31 1.97
Industrial Products 20.08 14.77 4.77
Infrastructure - 2.84 -
Plantation - 3.70 2.41
Properties - 5.52 3.83
Technology 35.60 10.07 -
Trading and Services 1.55 18.07 9.93
58.75 60.20 24.03
INVESTMENT IN ISLAMIC DEBT
SECURITIES: 22.40 30.72 33.88
SHORT TERM INVESTMENTS: 18.85 9.08 42.09
100.00 100.00 100.00

15
1.6 Other Performance Data for the Financial Year Ended 31 August
BIMB Dana Al-Munsif 2017 2016 2015
Unit Prices (RM)
Highest NAV per unit for the year 0.4901 0.4654 0.5189
Lowest NAV per unit for the year 0.4219 0.4324 0.4407
Net Asset Value (NAV) and Units in
Circulation (UIC) as at the End of the Year
Total NAV (RM) 17,964,710 31,310,926 36,519,502
Units in Circulation (UIC) 36,956,669 72,404,772 82,037,110
NAV per unit (RM)* 0.4861 0.4324 0.4452
Return of Fund (%)(a) [page 17]
Capital Growth (%)(b)
12.42 -2.88 -13.15
Income Return (%)(c)
- 3.01 -
Return of Fund (%) 12.42 0.13 -13.15
Gross Distribution per Unit (Sen) - 1.34 -
Net Distribution per Unit (Sen) - 1.34 -
NAV per Unit before Distribution (RM) - 0.4458 -
NAV per Unit after Distribution (RM)* - 0.4324 -
Date of Distribution - 30 August
2016 -
Management Expense Ratio (MER) (%)(d)
1.86 1.79 1.71
Portfolio Turnover Ratio (PTR) (times)(e)
1.18 1.10 0.79
* The price and net asset value per unit are ex-distribution.
Note:
a) Return of the
Fund
= NAV per unit (end of year) - 1 NAV per unit (beginning of year)
b) Capital Growth = Total Return of the Fund – Income Return
c) Income Return = {Income Distribution per Unit / NAV per Unit on beginning of
year} x 100
d) Management
Expense Ratio
= The management expense ratio is the total management
expenses expressed as an annual percentage of the Fund‟s
average Net Asset Value.
e) Portfolio
Turnover Ratio
= It represents the average of the total acquisitions and disposals
of the investment in the Fund for the annual period over the
average Net Asset Value of the Fund calculated on a daily
basis.
16
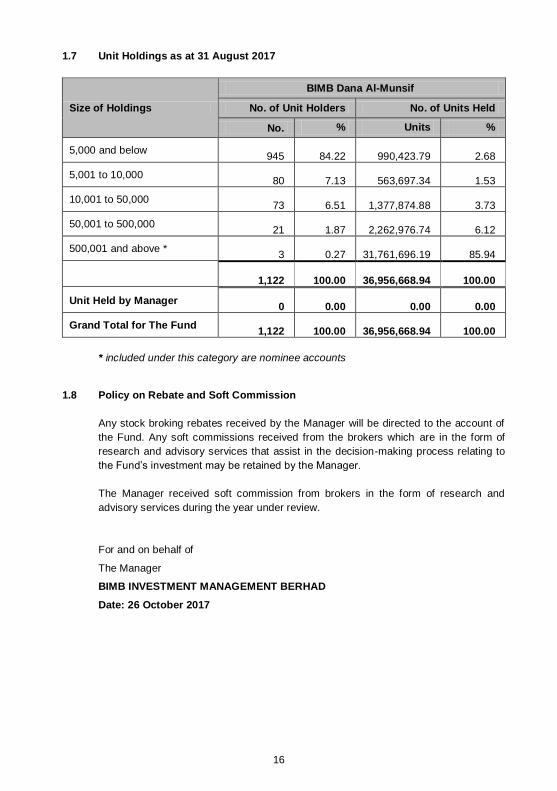
1.7 Unit Holdings as at 31 August 2017
Size of Holdings
BIMB Dana Al-Munsif
No. of Unit Holders No. of Units Held
No. % Units %
5,000 and below 945 84.22 990,423.79 2.68
5,001 to 10,000 80 7.13 563,697.34 1.53
10,001 to 50,000 73 6.51 1,377,874.88 3.73
50,001 to 500,000 21 1.87 2,262,976.74 6.12
500,001 and above * 3 0.27 31,761,696.19 85.94
1,122 100.00 36,956,668.94 100.00
Unit Held by Manager 0 0.00 0.00 0.00
Grand Total for The Fund 1,122 100.00 36,956,668.94 100.00
* included under this category are nominee accounts
1.8 Policy on Rebate and Soft Commission
Any stock broking rebates received by the Manager will be directed to the account of
the Fund. Any soft commissions received from the brokers which are in the form of
research and advisory services that assist in the decision-making process relating to
the Fund‟s investment may be retained by the Manager.
The Manager received soft commission from brokers in the form of research and
advisory services during the year under review.
For and on behalf of
The Manager
BIMB INVESTMENT MANAGEMENT BERHAD
Date: 26 October 2017

17
1.0 Laporan Pengurus
Para Pemegang Unit yang Dihormati,
Kami dengan sukacitanya membentangkan Laporan Pengurus BIMB Dana Al-Munsif
bagi tahun kewangan berakhir pada 31 Ogos 2017.
1.1 Nama Dana/ Jenis Dana/ Kategori Dana/ Objektif Pelaburan Dana/ Penanda Aras
Dana/ Polisi Agihan Dana
Nama Dana BIMB Dana Al-Munsif
Jenis Dana Pendapatan dan pertumbuhan
Kategori Dana Seimbang
Objektif
Pelaburan Dana
Objektif utama pelaburan Dana adalah untuk menyediakan
pendapatan yang stabil serta konsisten dan peningkatan modal Unit dalam jangkamasa sederhana hingga jangkamasa panjang. Sehubungan dengan itu, pulangan adalah dalam bentuk pertumbuhan
modal jangkamasa panjang dan pengagihan pendapatan yang konsisten kepada pemegang unit.
Nota: Sebarang perubahan ketara kepada objektif pelaburan Dana memerlukan kelulusan daripada pemegang unit.
Penanda Aras Dana
Nisbah 60:40 daripada Indeks Syariah FBM Emas dan 12 bulan Deposit Bertempoh-i Tawarruq (TDT-i) Bank Islam Malaysia Berhad
Polisi Agihan Dana
Dana ini bertujuan untuk membayar agihan pendapatan tahunan kepada pemegang unit sekiranya pendapatan pelaburan sepanjang
tahun terkumpul adalah mencukupi. Kaedah Pembayaran
Agihan Pendapatan
Bayaran ke akaun bank pelabur atau pelaburan semula.
18
1.2 Pencapaian bagi tahun berakhir 31 Ogos 2017
1.2.1 Kajian Pencapaian BIMB Dana Al-Munsif
Bagi tahun kewangan dalam kajian, BIMB Dana Al-Munsif (Dana) telah mencatatkan
pulangan sebanyak 12.42% berbanding dengan pulangan penanda aras sebanyak
2.92%.
Sejak penubuhannya pada 27 Disember 2001 hingga 31 Ogos 2017, Dana
mencatatkan pulangan berjumlah 108.76% berbanding pulangan penanda aras
sebanyak 111.43%.
Penanda aras terpilih prestasi Dana adalah berdasarkan kepada nisbah 60:40 Indeks
Syariah Emas FBM dan kadar 12 bulan Deposit Bertempoh-i Tawarruq (TDT-i) Bank
Islam Malaysia Berhad.
Strategi Dana secara konsistennya adalah kekal memberikan tumpuan kepada
syarikat-syarikat yang kukuh dan berpotensi untuk membayar dividen secara
berkekalan dan mempunyai prospek pertumbuhan pendapatan.
Dalam tahun kewangan berakhir pada 31 Ogos 2017, Dana tidak mendapat
keuntungan urus niaga yang mencukupi untuk mengumumkan agihan pendapatan
bagi tahun berkenaan disebabkan oleh kemeruapan pasaran yang di luar jangkaan.
Meskipun begitu, Pengurus telah meningkatkan prestasi Dana dengan mengurangkan
pendedahan terhadap saham-saham yang tidak berprestasi dan melaburnya semula
dalam syarikat-syarikat dan sektor-sektor yang menawarkan prospek dan potensi
lebih cerah untuk memberikan prestasi pergerakan Nilai Aset Bersih (NAB) yang lebih
baik.
Sehingga pada 31 Ogos 2017, Dana mempunyai pendedahan sebanyak 58.75%
dalam ekuiti, 22.4% dalam sekuriti hutang Islam dan 18.85% dalam pelaburan jangka
pendek, tunai dan setara tunai. Dari segi jumlah NAB, saiz Dana sehingga pada 31
Ogos 2017 adalah RM17.96 juta, berbanding RM31.31 juta sehingga pada 31 Ogos
2016. NAB seunit Dana telah meningkat kepada RM0.4861 pada 31 Ogos 2017
daripada RM0.4324 pada 31 Ogos 2016.
Peruntukan ekuiti Dana yang dikekalkan sekitar 60% untuk dimanfaatkan bagi
meningkatkan pelaburan ketika berlaku pergerakan menaik harga saham. Melangkah
ke hadapan, Pengurus akan meneruskan pelaburan dalam syarikat-syarikat yang
dijangka menawarkan pendapatan yang baik, mempunyai lembaran imbangan yang
kukuh, dan hasil dividen yang tinggi dengan prospek penilaian yang baik apabila
adanya peluang-peluang yang sesuai.
Bagi tahun kewangan berakhir pada 31 Ogos 2017, tidak terdapat sebarang
perubahan ketara dalam hal ehwal pengurusan Dana dan tidak berlaku sebarang
keadaan yang boleh menjejaskan kepentingan para pemegang unit sehingga tarikh
Laporan Pengurus ini disediakan.

19
1.2.2 Jumlah pulangan dan purata jumlah pulangan bagi setiap tahun berakhir 31
Ogos 2017
BIMB Dana Al-Munsif Penanda Aras
Jumlah
Pulangan
(%)
Purata
Jumlah
Pulangan
(%)
Jumlah
Pulangan
(%)
Purata
Jumlah
Pulangan
(%)
Jangkamasa
1-Tahun 12.42 12.42 2.92 2.92
Jangkamasa
3-Tahun -2.23 -0.74 2.13 0.71
Jangkamasa
5-Tahun 6.39 1.28 14.74 2.95
1.2.3 Jumlah pulangan tahunan bagi 5 tahun kewangan yang lalu
Tahun Kewangan
Jumlah Pulangan
BIMB Dana Al-Munsif
(%)
Penanda Aras
(%)
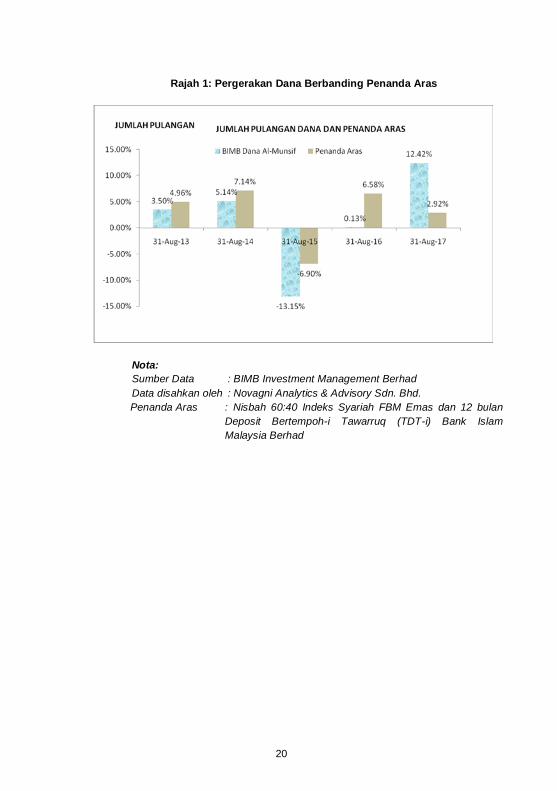
31 Ogos 2017 12.42 2.92
31 Ogos 2016 0.13 6.58
31 Ogos 2015 -13.15 -6.90
31 Ogos 2014 5.14 7.14
31 Ogos 2013 3.50 4.96
20
Rajah 1: Pergerakan Dana Berbanding Penanda Aras
Nota:
Sumber Data : BIMB Investment Management Berhad
Data disahkan oleh : Novagni Analytics & Advisory Sdn. Bhd.
Penanda Aras : Nisbah 60:40 Indeks Syariah FBM Emas dan 12 bulan
Deposit Bertempoh-i Tawarruq (TDT-i) Bank Islam
Malaysia Berhad

21
1.3 Ekonomi dan Kajian Pasaran
1.3.1 Ekonomi
Global
Keluaran Dalam Negara Kasar (KDNK) Amerika Syarikat ('AS') berkembang sebanyak
2.6% pada suku kedua 2017 berbanding pertumbuhan 1.2% pada suku pertama 2017
dan 1.8% pada suku keempat 2016. KDNK yang berkembang pantas pada suku kedua
2017 dapat dilihat daripada peningkatan perbelanjaan kerajaan persekutuan dan
pelaburan persediaan swasta walaupun diimbangi oleh penurunan dalam eksport.
Kadar inflasi utama AS meningkat sebanyak 1.9% pada bulan Ogos 2017 berbanding
1.5% pada bulan September 2016 disebabkan berlakunya peningkatan kos dan harga
gasolin apabila Taufan Harvey telah menyebabkan penutupan kilang penapis di pantai
Teluk.
Kadar pengangguran AS jatuh kepada 4.4% pada bulan Ogos 2017 daripada 5.0%
pada bulan September 2016, disokong oleh peningkatan pendapatan, perbelanjaan
pengguna dan pertumbuhan ekonomi.
Ekonomi zon Euro berkembang sebanyak 0.6% pada suku kedua 2017 berbanding
0.5% pada suku pertama 2017 dan 0.6% pada suku keempat 2016. Pemulihan
ekonomi zon Euro menyaksikan berlakunya peningkatan momentum manakala
pengangguran telah menurun di sebalik kejatuhan kadar faedah yang teramat rendah
diantara langkah-langkah lain yang dilaksanakan oleh Bank Pusat Eropah (ECB) untuk
meningkatkan aktiviti ekonomi.
Kadar inflasi tahunan zon Euro meningkat sebanyak 1.5% pada bulan Ogos 2017
daripada 0.4% pada bulan September 2016, didorong oleh prestasi pertumbuhan
KDNK yang lebih baik di kawasan zon Euro.
Kadar pengangguran di zon Euro jatuh kepada 9.1% pada bulan Julai 2017, merosot
daripada 10.0% pada bulan September 2016 dan kekal berada pada paras terendah
sejak bulan Julai 2011.
China mengekalkan kadar pertumbuhan ekonominya sebanyak 6.9% pada suku
kedua 2017, menyamai pertumbuhan pada suku pertama 2017 berikutan
peningkatan dalam pengeluaran perindustrian dan penggunaan swasta dengan
dibantu oleh pasaran hartanah yang kukuh dan pemulihan sektor eksport .
(Sumbe: Bloomberg dan RHB Research Institute Sdn Bhd)

22
Dalam Negara
Ekonomi Malaysia berkembang pantas sebanyak 5.8% pada suku kedua 2017
berbanding 5.6% pada suku pertama 2017 dan 4.5% pada suku keempat 2016. KDNK
yang lebih kukuh dalam tempoh berkenaan adalah hasil peningkatan dalam
penggunaan swasta dan eksport.
Kadar utama inflasi di Malaysia pada bulan Ogos 2017 meningkat kepada 3.7%
daripada 1.5% pada bulan September 2016, berikutan kos lebih tinggi bagi makanan
dan minuman bukan alkohol, pengangkutan dan perumahan, sejajar dengan kenaikan
lebih tinggi harga minyak mentah dan prestasi pertumbuhan KDNK yang lebih kukuh.
Jawatankuasa Dasar Monetari Bank Negara Malaysia (MPC) mengekalkan Kadar
Dasar Semalaman (OPR) pada paras 3.00% dalam mesyuaratnya yang diadakan pada
bulan Julai bersesuaian dengan prospek pertumbuhan negara.
Rizab antarabangsa Bank Negara berjumlah AS$100.5 bilion setakat pada 30 Ogos
2017 berbanding AS$97.7 bilion pada bulan September 2016 dengan terdapatnya
peningkatan aliran masuk modal daripada pelabur-pelabur institusi asing ke Malaysia.
(Sumber: Bloomberg, Bank Negara Malaysia dan RHB Research Institute Sdn Bhd)
1.3.2 Kajian Pasaran
Ekuiti
Indeks Syariah EMAS FTSE Bursa Malaysia (FBM Syariah) memasuki tahun dalam
kajian pada paras 12,430.50 mata sebelum jatuh ke paras terendah 11,845.46 pada
30 November 2016. FBM Syariah, kemudiannya meningkat ke paras tertinggi kepada
13,126.04 pada 16 Mei 2017 sebelum mengakhiri tahun kewangan di paras 12,749.09
mata pada 30 Ogos 2017. Bagi tahun dalam kajian, FBM Syariah meningkat 318.59
mata atau 2.56% manakala FBM KLCI mencatat kenaikan sebanyak 65.32 mata atau
4.05%. Antara faktor utama yang menyumbang kepada pergerakan indeks ini adalah
seperti berikut:
Rizab Persekutuan AS enggan menaikkan kadar faedah pada September 2016 iaitu
lebih awal daripada Pilihan Raya Presiden Amerika Syarikat yang diadakan pada
November 2016 kerana menganggap ekonomi AS masih mempunyai ruang untuk
meningkat sebelum berdepan dengan risiko mengalami pertumbuhan yang terlalu
tinggi.
Perdana Menteri Malaysia membentangkan Bajet 2017 pada 21 Oktober 2016 yang
bertujuan mengekang defisit bajet persekutuan pada paras 3.0% berbanding 3.1%
pada tahun 2016 dengan menyasarkan pertumbuhan KDNK antara 4% hingga 5% bagi
tahun 2017. Bajet 2017 itu disediakan berdasarkan harga purata minyak mentah pada
paras AS$45 setong.

23
Pada November 2016, kemenangan Donald Trump dalam Pilihan Raya Presiden AS
adalah di luar jangkaan dan mengejutkan pasaran amnya apabila para pelabur
berpusu-pusu mencari aset pelaburan yang selamat seperti emas, bon dan yen Jepun
kerana mempercayai bahawa pentadbiran Trump akan menyebabkan berlakunya
ketidaktentuan dalam pasaran. Pasaran Asia pula mengalami kegiatan jualan secara
besar-besaran sebelum para pelabur sejagat kemudiannya mengimbangi semula
portfolio mereka untuk mengambil faedah daripada pertumbuhan lebih kukuh dalam
ekonomi AS dan kadar hasil bon AS yang lebih tinggi.
Pada Disember 2016, Rizab Persekutuan menaikkan kadar faedah sebanyak 0.25%
kepada 0.75% seperti dijangkakan oleh banyak pihak berikutan berlakunya kadar
perkembangan yang menggalakkan dalam ekonomi AS sambil mengimbangi matlamat
Presiden yang baru dipilih untuk terus merangsang ekonomi negara itu. Pada bulan
tersebut, negara-negara anggota OPEC bersetuju mengurangkan pengeluaran minyak
mentah dalam usaha menangani lebihan komoditi berkenaan yang mengakibatkan
harga minyak mentah global meningkat ke paras tertinggi dalam tempoh 16 bulan iaitu
di atas paras AS$55 setong pada 5 Disember 2016.
Pada Januari 2017, Donald Trump secara rasminya menjadi presiden baharu Amerika
Syarikat namun beliau lebih banyak memperkenalkan dasar-dasar tidak jelas kepada
dunia berkaitan perdagangan melangkaui sempadan AS-Mexico dan potensi halangan
baharu imigresen dan perjalanan warga asing ke AS. Bagaimanapun, Indeks Dow
Jones dan pasaran kewangan global kekal stabil pada bulan itu.
Pasaran ekuiti global mengalu-alukan kenaikan mengejut kadar faedah AS sebanyak
25 mata asas oleh Rizab Persekutuan AS berikutan data ekonomi negara itu yang
lebih kukuh berbanding jangkaan dan juga pendirian pro-pertumbuhan oleh
pentadbiran baharu, menyebabkan kadar dana Persekutuan meningkat kepada 1.00%
selepas kenaikan kadar faedah pada 15 Mac 2017.
Pada April 2017, pertemuan bersejarah antara Donald Trump dan pemimpin China, Xi
Jin Ping telah meningkatkan persefahaman dalam hubungan antara kedua-dua negara
itu selepas sidang kemuncak diadakan di Florida, Amerika Syarikat yang mungkin
dapat menghapuskan potensi berlakunya perang perdagangan antara dua kuasa besar
ekonomi dunia.
Bagi kenaikan kali kedua dalam tahun 2017, Rizab Persekutuan AS telah menaikkan
kadar faedah pada bulan Jun dan menyaksikan kadar dana bank pusat itu berada
pada paras 1.25%. Kenaikan kali kedua itu diluluskan berdasarkan jangkaan
pertumbuhan KDNK lebih tinggi sebanyak 2.2% dan kadar pengangguran yang lebih
rendah sebanyak 4.3% bagi tahun 2017. Bagaimanapun, kenaikan kali kedua itu dibuat
di tengah-tengah jangkaan kadar inflasi yang lebih rendah berbanding sasaran bank
pusat.
Pada bulan Ogos 2017, pertikaian antara Korea Utara dengan AS semakin memuncak
menjadi lebih buruk selepas Korea Utara melakukan ujian peluru berpandu sehingga
mendorong Presiden Trump mengeluarkan amaran untuk bertindak balas dengan
kesan yang berat. Akibatnya, sentimen para pelabur mahu mengelak berdepan risiko
telah menjejaskan pasaran Asia.
24
Pasaran Bon dan Pasaran Wang
a) Global
Pada bulan November 2016, hasil Perbendaharaan AS mula melonjak dengan
jangkaan Presiden Donald Trump akan memulakan pengembangan fiskal.
Sebelum pilihan raya, hasil bon perbendaharaan AS (UST) telah berdepan tekanan
untuk mencatat peningkatan di mana penggubal dasar Rizab Persekutuan telah
memberi isyarat akan pelaksanaan dasar kewangan yang lebih ketat dalam masa
terdekat manakala pakar-pakar ekonomi telah membuat unjuran akan peningkatan
pertumbuhan AS pada tahun 2017.
Peningkatan dalam hasil 2 tahun UST untuk berada di atas paras 1.3% pada akhir
bulan Jun 2017 adalah dalam jangkaan memandangkan setakat ini terdapat dua
kenaikan kadar Rizab Persekutuan AS. Akan tetapi, bon perbendaharaan AS
mengukuh pada bulan Ogos 2017 dengan wujudnya permintaan terhadap
pelaburan lebih selamat berikutan terdapat satu siri ketegangan geopolitik di mana
Korea Utara mengancam untuk menyerang Guam dan melancarkan peluru
berpandu balistik melintasi ruang udara Jepun.
Walau bagaimanapun, dalam tempoh kewangan yang dikaji, hasil UST meningkat
berbanding hasil pada 31 Ogos 2016.

25
Rajah 2: Kadar Pulangan Perbendaharaan AS
Sumber : Jabatan Perbendaharaan AS, 31 Ogos 2017

26
b) Dalam Negara
Bon kedaulatan menguasai aktiviti pasaran bon tempatan apabila Sekuriti Kerajaan
Malaysia (MGS) dan Terbitan Pelaburan Kerajaan (GII) mencatatkan jumlah
dagangan pasaran sekunder sebanyak RM835.5 bilion bagi tahun kewangan
dalam kajian. Hasil bon kerajaan dan bon korporat meningkat di keseluruhan
keluk hasil selepas peningkatan kadar Dana Rizab Persekutuan AS pada bulan
Jun 2017 dan pasaran menjangkakan Rizab Persekutuan AS akan meningkatkan
Kadar Dana bank pusat itu pada separuh kedua tahun 2017.
Jadual 1: Kadar Pulangan Sukuk/ Bon Islam
Tempoh/ Tarikh 31 Ogos 2017
(%)
31 Ogos 2016
(%)
Perubahan
* (bps)
Bon 3 Tahun
GII 3.54 2.85 69.0
Korporat AAA 4.16 3.84 32.0
Bon 5 Tahun
GII 3.76 3.27 49.0
Korporat AAA 4.29 4.04 25.0
Bon 7 Tahun
GII 3.98 3.52 46.0
Korporat AAA 4.44 4.16 28.0
Bon 10 Tahun
GII 4.06 3.64 42.0
Korporat AAA 4.63 4.33 30.0
Sumber: Agensi Penetapan Harga Bon Malaysia (BPAM), 31 Ogos 2017

27
Rajah 3: Kadar Polisi Semalaman (OPR)
Sumber: Bank Negara Malaysia (BNM), 31 Ogos 2017
1.4 Tinjauan Pasaran dan Strategi
a) Ekuiti
Tinjauan pasaran ekuiti bagi tahun 2017 menunjukkan ia akan terus berada
dalam keadaan tidak menentu. Faktor luaran berkemungkinan mempengaruhi
sentimen pasaran domestik termasuklah komitmen negara-negara anggota Opec
dan bukan Opec untuk menstabilkan pasaran minyak yang mengalami lebihan
pengeluaran, pendirian Presiden Trump terhadap cita-cita nuklear Korea Utara
dan opsyen tindakan ketenteraan, kesan kenaikan kadar faedah AS dan
pergerakan mata wang, sentimen politik di zon Euro, pelarasan ekonomi China
dan dasar kewangan yang diterima pakai oleh Bank-bank Pusat. Dengan potensi
minat terhadap sektor terpilih untuk menyokong pasaran domestik, bursa
tempatan harus berupaya menahan kejutan luaran memandangkan terdapat
mudah tunai yang besar dalam negara dan minat belian daripada para
pelabur institusi asing dan tempatan.
Ketika ekonomi global terus berkembang pada kadar yang sederhana,
pencapahan didapati meningkat dalam momentum pertumbuhan didapati dalam
kalangan negara maju yang utama. Bagi sebahagian besar Asia,
pertumbuhannya disokong oleh pengembangan permintaan domestik yang
berterusan. Dalam melangkah ke hadapan, ekonomi global dijangka terus berada
pada landasan pemulihan yang sederhana.
28
Di Malaysia, ketahanan penggunaan domestik kekal menjadi penyokong kepada
pertumbuhannya. Dengan jumlah perbelanjaan lebih besar diperuntukkan kepada
projek-projek infrastruktur yang sedang dijalankan, upah sektor awam yang lebih
tinggi, tinjauan jumlah pengeluaran MSM (CPO) yang bertambah baik dan
terdapat lonjakan dalam penggunaan dan perbelanjaan Kerajaan akan
membantu menambah baik pendapatan korporat dan perbelanjaan pengguna
pada tahun ini. Dalam melangkah ke hadapan, permintaan dalam negeri kekal
menjadi pemacu utama pertumbuhan tetapi pasaran ekuiti mungkin akan
dipengaruhi oleh risiko pasaran utama seperti meletusnya perang antara Korea
Utara dan Amerika Syarikat dan juga pengaliran keluar dana daripada pasaran
baru muncul memandangkan Rizab Persekutuan AS mempercepatkan langkah
pengetatan kuantitatif pada tahun 2018 dan 2019.
b) Pasaran Sukuk dan Pasaran Wang
Bergerak ke hadapan, MGS dan bon korporat dilihat akan berada dalam aliran
menaik yang lebih tinggi berbanding paras puratanya pada setengah kedua
tahun 2016 walaupun pada tahap sederhana. Keadaan ini berlaku di sebalik hasil
bon berada di paras rendah dalam setengah pertama tahun 2017 kerana
terdapat jangkaan berlaku beberapa kenaikan dalam pergerakan hasil berikutan
prospek kenaikan kadar Rizab Persekutuan yang ketiga apabila AS terus
mencatat pemulihan ekonomi. Asas-asas ekonomi Malaysia yang semakin baik
akan menjadi penampan kepada sebarang kenaikan hasil yang mendadak.
Pergerakan hasil dijangka meningkat secara tidak mendadak dalam masa yang
mendatang apabila para pelabur lebih maklum tentang pendirian Trump dan
bank-bank pusat menjadi lebih telus apabila menyatakan arah dasar yang
dikehendaki.
Jawatankuasa Dasar Monetari Bank Negara Malaysia (MPC) mengekalkan kadar
dasar semalaman (OPR) pada paras 3.00% bagi mesyuarat yang ke-6 secara
berturut-turut pada 13 Julai 2017. Memandang ke hadapan, BNM dijangka
mengekalkan OPR pada kadar 3.00% untuk tempoh yang seterusnya dalam
tahun 2017. Dasar monetari ini dipercayai tidak akan diketatkan lagi dalam
bulan-bulan berikutnya pada tahun ini kerana kadar inflasi dijangka kembali
normal selepas ini memandangkan pertumbuhan ekonomi baru sahaja meningkat
dengan Ringgit Malaysia memperlihatkan kestabilannya. Sebaliknya,
pertumbuhan ekonomi domestik yang lebih kukuh ditambah pula dengan
kenaikan kadar faedah yang lebih agresif dan pelan untuk mengurangkan
lembaran imbangan Rizab Persekutuan di AS, berkemungkinan akan
mengehadkan skop bagi BNM mengurangkan kadar faedah dalam negara.

29
1.5 Peruntukan Aset Pada 31 Ogos
BIMB Dana Al-Munsif 2017
(%) 2016
(%) 2015
(%)
Pelaburan Sekuriti Tersiarharga:
Pembinaan - 1.18 0.75
Barangan Pengguna 1.52 1.74 0.37
Kewangan - 2.31 1.97
Barangan Industri 20.08 14.77 4.77
Infrastruktur - 2.84 -
Perladangan - 3.70 2.41
Hartanah - 5.52 3.83
Teknologi 35.60 10.07 -
Perdagangan dan Perkhidmatan 1.55 18.07 9.93
58.75 60.20 24.03
PELABURAN DALAM SEKURITI
HUTANG SECARA ISLAM: 22.40 30.72 33.88
PELABURAN JANGKA PENDEK: 18.85 9.08 42.09
100.00 100.00 100.00

30
1.6 Lain-Lain Data Prestasi Bagi Tahun Berakhir 31 Ogos
BIMB Dana Al-Munsif 2017 2016 2015
Harga Unit (RM)
NAB tertinggi seunit dalam setahun 0.4901 0.4654 0.5189
NAB terendah seunit dalam setahun 0.4219 0.4324 0.4407
Nilai asset Bersih (NAB) dan Unit Dalam Edaran (UDE) pada Akhir Tahun
Jumlah NAB (RM) 17,964,710 31,310,926 36,519,502
Unit Dalam Edaran (UDE) 36,956,669 72,404,772 82,037,110
NAB seunit (RM)* 0.4861 0.4324 0.4452
Jumlah Pulangan Dana (%)(a)
Pertumbuhan Modal (%)(b)
12.42 -2.88 -13.15
Pulangan Pendapatan (%)(c)
- 3.01 -
Jumlah Pulangan Dana (%) 12.42 0.13 -13.15
Agihan Kasar seunit (Sen) - 1.34 -
Agihan Bersih seunit (Sen) - 1.34 -
Nilai Aset Bersih sebelum Pengagihan (RM) - 0.4458 -
Nilai Aset Bersih selepas Pengagihan (RM)* - 0.4324 -
Tarikh Pengagihan - 30 Ogos
2016 -
Nisbah Perbelanjaan Pengurusan (NPP)
(%)(d) 1.86 1.79 1.71
Nisbah Pusing Ganti Portfolio (Kali)(e)
1.18 1.10 0.79
* Harga NAB selepas pengagihan pendapatan.
Nota:-
a) Pulangan ke
atas Dan
= Harga seunit (pada akhir tahun) - 1
Harga seunit (pada awal tahun)
b) Penambahan
Modal
= Pulangan Ke atas Dana – Pulangan Pendapatan
c) Pulangan
Pendapatan
= {Pengagihan Pendapatan Se Unit / NAB se unit pada awal tahun}
x 100
d) Nisbah
Perbelanjaan
Pengurusan
= Ia dikira dengan mengambil jumlah perbelanjaan pengurusan
sepertimana yang dinyatakan sebagai peratusan tahunan daripada
jumlah purata Nilai Aset Bersih Dana.
e) Nisbah Pusing
Ganti Portfolio
= Ia dikira dengan mengambil purata jumlah perolehan dan pelupusan
pelaburan dalam Dana bagi tempoh tahunan dibahagi dengan
purata Nilai Aset Bersih Dana yang dikira pada asas harian
31
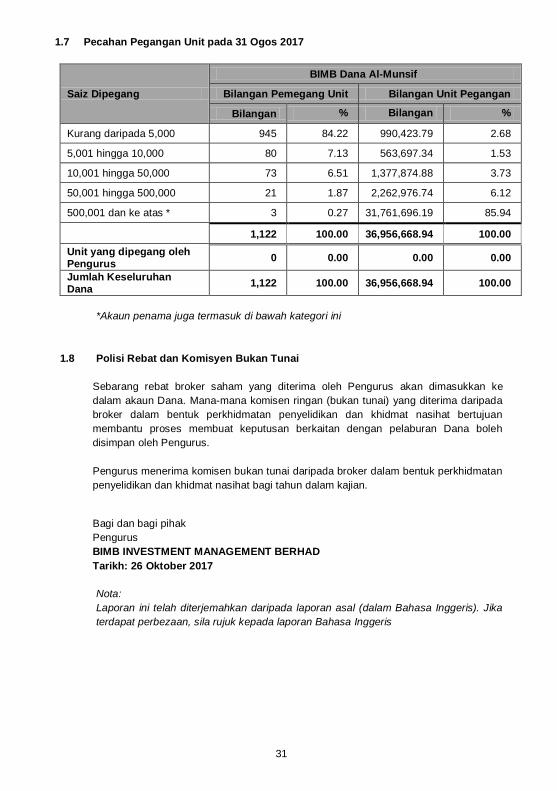
1.7 Pecahan Pegangan Unit pada 31 Ogos 2017
Saiz Dipegang
BIMB Dana Al-Munsif
Bilangan Pemegang Unit Bilangan Unit Pegangan
Bilangan % Bilangan %
Kurang daripada 5,000 945 84.22 990,423.79 2.68
5,001 hingga 10,000 80 7.13 563,697.34 1.53
10,001 hingga 50,000 73 6.51 1,377,874.88 3.73
50,001 hingga 500,000 21 1.87 2,262,976.74 6.12
500,001 dan ke atas * 3 0.27 31,761,696.19 85.94
1,122 100.00 36,956,668.94 100.00
Unit yang dipegang oleh Pengurus
0 0.00 0.00 0.00
Jumlah Keseluruhan Dana
1,122 100.00 36,956,668.94 100.00
*Akaun penama juga termasuk di bawah kategori ini
1.8 Polisi Rebat dan Komisyen Bukan Tunai
Sebarang rebat broker saham yang diterima oleh Pengurus akan dimasukkan ke
dalam akaun Dana. Mana-mana komisen ringan (bukan tunai) yang diterima daripada
broker dalam bentuk perkhidmatan penyelidikan dan khidmat nasihat bertujuan
membantu proses membuat keputusan berkaitan dengan pelaburan Dana boleh
disimpan oleh Pengurus.
Pengurus menerima komisen bukan tunai daripada broker dalam bentuk perkhidmatan
penyelidikan dan khidmat nasihat bagi tahun dalam kajian.
Bagi dan bagi pihak
Pengurus
BIMB INVESTMENT MANAGEMENT BERHAD
Tarikh: 26 Oktober 2017
Nota:
Laporan ini telah diterjemahkan daripada laporan asal (dalam Bahasa Inggeris). Jika
terdapat perbezaan, sila rujuk kepada laporan Bahasa Inggeris

32
2.0 Trustee’s Report
AFFIN HWANG TRUSTEE BERHAD
ANNUAL REPORT FOR THE YEAR ENDED 31 AUGUST 2017
To the Unit Holders of
BIMB Dana Al-Munsif
We have acted as Trustee of BIMB Dana Al-Munsif (“the Fund”) for the year ended 31
August 2017. To the best of our knowledge, BIMB Investment Management Berhad
(“the Manager” or “the Management Company”) has managed the Funds in accordance
with the following:
1. The limitations imposed on the investment powers of the Management Company and
the Trustee under the Deeds, the Securities Commission‟s Guidelines on Unit Trust
Funds, the Capital Markets and Services Act 2007 and other applicable laws;
2. The valuation or pricing of the Funds is carried out in accordance with the Deeds and
any regulatory requirement;
3. The creation and cancellation of units of the Funds are carried out in accordance
with the Deeds and any regulatory requirement; and
For Affin Hwang Trustee Berhad
…………………..…………
Tan Ping Ying
Authorised Signatory
………………………
Wong Chiew Leng
Authorised Signatory
Date: 26 October 2017

33
3.0 Shariah Committee’s Report
ANNUAL REPORT FOR THE YEAR ENDED 31 AUGUST 2017
حيم ن ٱلر ـ حم بسم ٱهلل ٱلر To the Unit Holders of
BIMB Dana Al-Munsif
We have acted as the Shariah Committee of BIMB Dana Al-Munsif.
Our responsibilities are to ensure that the procedures and processes employed by BIMB
Investment Management Berhad and that the provisions of the Deed dated 6 December
2001 are in accordance with Shariah principles.
In our opinion, BIMB Investment Management Berhad has managed BIMB Dana Al-
Munsif in accordance with Shariah principles and complied with applicable guidelines,
rulings or decisions issued by the Securities Commission pertaining to Shariah matters
for the year ended 31 August 2017.
In addition, we also confirm that the investment portfolio of BIMB Dana Al-Munsif
comprises securities which have been classified as Shariah-compliant by the Shariah
Advisory Council (SAC) of the Securities Commission, as the case may be and that all
deposits and money market instruments placed by the Funds are Shariah-compliant.
أعلم وهللا
For and on behalf of the Shariah Committee ………………………………………………..
USTAZ DR. AHMAD SHAHBARI@SOBRI SALAMON (Chairman)
……………………………………………….. USTAZ DR. YUSOF RAMLI (Committee Member)
……………………………………………….. USTAZAH DR. ASMAK AB. RAHMAN
(Committee Member) Date: 26 October 2017

34
4.0 Directors’ Declaration
ANNUAL REPORT FOR THE YEAR ENDED 31 AUGUST 2017
To the Unit Holders of
BIMB Dana Al-Munsif
We, Dato‟ Ghazali Bin Awang and Najmuddin Bin Mohd Lutfi, being two of the directors
of the Manager, BIMB Investment Management Berhad, for BIMB Dana Al-Munsif, do
hereby state that in our opinion, the accompanying Statement of Financial Position,
Statement of Profit or Loss and other Comprehensive Income, Statement of Changes in
Net Asset Value and Statement of Cash Flows are drawn up so as to give true and fair
view of the Statement of Financial Position of the Fund as at 31 August 2017 and
Statement of Profit or Loss and other Comprehensive Income, Statement of Changes in
Net Asset Value and Statement of Cash Flows for the year ended on that date.
For and on behalf of the Board of Directors,
…………………………………
DATO’ GHAZALI BIN AWANG
(Non Executive Independent Director)
…………………………………
NAJMUDDIN BIN MOHD LUTFI
(Chief Executive Officer)
Date: 26 October 2017

35
5.0 Independent Auditor’s Report
Independent Auditors’ Report to the Unitholders of BIMB Dana Al-Munsif
(Established in Malaysia)
Report on the Financial Statements
We have audited the financial statements of BIMB Dana Al-Munsif (“the Fund”), which
comprise the statement of financial position as at 31 August 2017, and the statement of profit
or loss and other comprehensive income, statement of changes in net asset value and cash
flows for the year then ended, and notes to the financial statements, including a summary of
significant accounting policies, as set out on pages 38 to 62.
In our opinion, the accompanying financial statements give a true and fair view of the financial
position of the Fund as at 31 August 2017, and of its financial performance and its cash flows
for the year then ended in accordance with Malaysian Financial Reporting Standards,
International Financial Reporting Standards and Securities Commission‟s Guidelines on Unit
Trust Funds in Malaysia.
Basis for Opinion
We conducted our audit in accordance with approved standards on auditing in Malaysia and
International Standards on Auditing. Our responsibilities under those standards are further
described in the Auditors’ Responsibilities for the Audit of the Financial Statements section of
our report. We believe that the audit evidence we have obtained is sufficient and appropriate
to provide a basis for our opinion.
Independence and Other Ethical Responsibilities
We are independent of the Fund in accordance with the By-Laws (on Professional Ethics,
Conduct and Practice) of the Malaysian Institute of Accountants (“By-Laws”) and the
International Ethics Standards Board for Accountants‟ Code of Ethics for Professional
Accountants (“IESBA Code”), and we have fulfilled our other ethical responsibilities in
accordance with the By-Laws and the IESBA Code.
Information Other than the Financial Statements and Auditors’ Report Thereon
The Manager of the Fund is responsible for the other information. The other information
comprises the information included in the annual report, but does not include the financial
statements of the Fund and our auditors‟ report thereon.
Our opinion on the financial statements of the Fund does not cover the annual report and we
do not express any form of assurance conclusion thereon.

36
Auditors’ Responsibilities for the Audit of the Financial Statements (continued)
Information Other than the Financial Statements and Auditors’ Report Thereon
(continued)
In connection with our audit of the financial statements of the Fund, our responsibility is to
read the annual report and, in doing so, consider whether annual report is materially
inconsistent with the financial statements of the Fund or our knowledge obtained in the audit
or otherwise appears to be materially misstated.
If, based on the work we have performed, we conclude that there is a material misstatement
of the annual report, we are required to report that fact. We have nothing to report in this
regard.
Responsibilities of the Manager and Trustee for the Financial Statements
The Manager of the Fund is responsible for the preparation of financial statements of the
Fund that give a true and fair view in accordance with Malaysian Financial Reporting
Standards, International Financial Reporting Standards and Securities Commission‟s
Guidelines on Unit Trust Funds in Malaysia. The Manager is also responsible for such internal
control as the Manager determine is necessary to enable the preparation of financial
statements of the Fund that are free from material misstatement, whether due to fraud or
error.
In preparing the financial statements of the Fund, the Manager is responsible for assessing
the ability of the Fund to continue as a going concern, disclosing, as applicable, matters
related to going concern and using the going concern basis of accounting unless the Manager
either intend to liquidate the Fund or to cease operations, or have no realistic alternative but
to do so.
The Trustee is responsible for ensuring that the Manager maintains proper accounting and
other records as necessary to enable true and fair presentations of these financial statement.
Auditors’ Responsibilities for the Audit of the Financial Statements
Our objectives are to obtain reasonable assurance about whether the financial statements of
the Fund as a whole are free from material misstatement, whether due to fraud or error, and
to issue an auditors‟ report that includes our opinion. Reasonable assurance is a high level of
assurance, but is not a guarantee that an audit conducted in accordance with approved
standards on auditing in Malaysia and International Standards on Auditing will always detect a
material misstatement when it exists. Misstatements can arise from fraud or error and are
considered material if, individually or in the aggregate, they could reasonably be expected to
influence the economic decisions of users taken on the basis of these financial statements.
As part of an audit conducted in accordance with approved standards on auditing in Malaysia
and International Standards on Auditing, we exercise professional judgement and maintain
professional scepticism throughout the audit. We also:

37
Auditors’ Responsibilities for the Audit of the Financial Statements (continued)
Identify and assess the risk of material misstatement of the financial statements of the
Fund, whether due to fraud or error, design and perform audit procedures responsive to
those risks, and obtain audit evidence that is sufficient and appropriate to provide a basis
for our opinion. The risk of not detecting a material misstatement resulting from fraud is
higher than for one resulting from error, as fraud may involve collusion, forgery,
intentional omissions, misrepresentations, or the override of internal control.
Obtain an understanding of internal control relevant to the audit in order to design audit
procedures that are appropriate in the circumstances, but not for the purpose of
expressing an opinion on the effectiveness of the Fund‟s internal control.
Evaluate the appropriateness of accounting policies used and the reasonableness of
accounting estimates and related disclosures made by the Manager.
Conclude on the appropriateness of the Manager‟s use of the going concern basis of
accounting and, based on the audit evidence obtained, whether a material uncertainty
exists related to events or conditions that may cast significant doubt on the ability of the
Fund to continue as a going concern. If we conclude that a material uncertainty exists,
we are required to draw attention in our auditors‟ report to the related disclosures in the
financial statements of the Fund or, if such disclosures are inadequate, to modify our
opinion. Our conclusions are based on the audit evidence obtained up to the date of our
auditors‟ report. However, future events or conditions may cause the Fund to cease to
continue as a going concern.
Evaluate the overall presentation, structure and content of the financial statements of the
Fund, including the disclosures, and whether the financial statements of the Fund
represents the underlying transactions and events in a manner that gives a true and fair
view.
We communicate with the Manager regarding, among other matters, the planned scope and
timing of the audit and significant audit findings, including any significant deficiencies in
internal control that we identify during our audit.
Other matter
This report is made solely to the unitholders of the Fund, as a body, in accordance with
Securities Commission‟s Guidelines on Unit Trust Funds in Malaysia and for no other
purpose. We do not assume responsibility to any other person for the content of this report.
KPMG Desa Megat PLT
(LLP0010082-LCA & AF 0759)
Chartered Accountant
Adrian Lee Lye Wang
Approval Number: 2679/11/17(J)
Chartered Accountants
Petaling Jaya, Selangor
Date: 26 October 2017

38
6.0 Financial Statements (Audited) BIMB Dana Al-Munsif
6.1 Statement of Financial Position as at 31 August 2017
Note 2017 2016
RM RM
Assets
Quoted securities 4 10,554,000 18,849,727
Islamic debt securities 5 4,024,920 9,618,745
Amount due from Manager 1,306 1,691
Other receivables 35,234 127,662
Current tax assets - 5,991
Cash and cash equivalents 6 3,414,603 2,944,389
Total assets 18,030,063 31,548,205
Liabilities
Amount due to Manager 9,813 135,119
Other payables 55,540 84,192
Distribution payable - 17,968
Total liabilities 65,353 237,279
Net asset value 17,964,710 31,310,926
Unitholders’ fund
Unitholders‟ capital 7 22,358,416 37,892,073
Accumulated losses (4,393,706) (6,581,147)
Net asset value attributable to unitholders 17,964,710 31,310,926
Number of units in circulation 7 36,956,669 72,404,772
Net asset value per unit
-Ex distribution (sen)
48.61
43.24
The notes on pages 42 to 62 are an integral part of these financial statements.
39
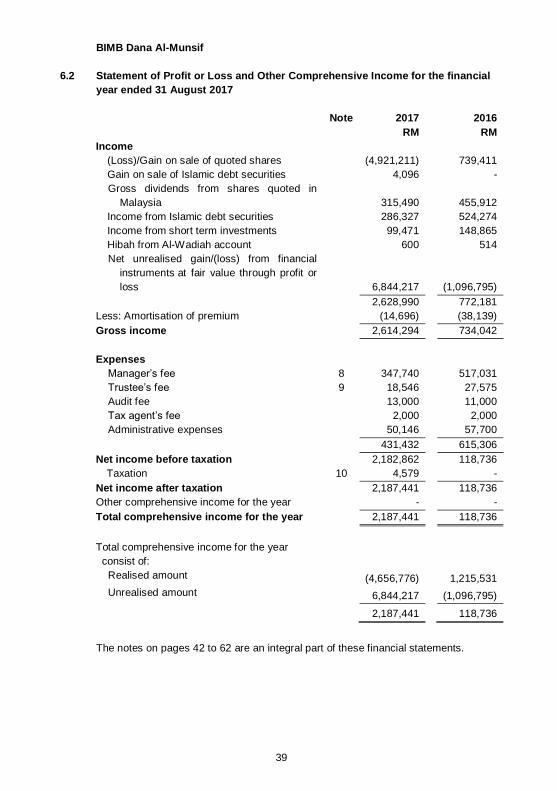
BIMB Dana Al-Munsif
6.2 Statement of Profit or Loss and Other Comprehensive Income for the financial
year ended 31 August 2017
Note 2017 2016
RM RM
Income
(Loss)/Gain on sale of quoted shares (4,921,211) 739,411
Gain on sale of Islamic debt securities 4,096 -
Gross dividends from shares quoted in
Malaysia 315,490 455,912
Income from Islamic debt securities 286,327 524,274
Income from short term investments 99,471 148,865
Hibah from Al-Wadiah account 600 514
Net unrealised gain/(loss) from financial
instruments at fair value through profit or
loss
6,844,217
(1,096,795)
2,628,990 772,181
Less: Amortisation of premium (14,696) (38,139)
Gross income 2,614,294 734,042
Expenses
Manager‟s fee 8 347,740 517,031
Trustee‟s fee 9 18,546 27,575
Audit fee 13,000 11,000
Tax agent‟s fee 2,000 2,000
Administrative expenses 50,146 57,700
431,432 615,306
Net income before taxation 2,182,862 118,736
Taxation 10 4,579 -
Net income after taxation 2,187,441 118,736
Other comprehensive income for the year - -
Total comprehensive income for the year 2,187,441 118,736
Total comprehensive income for the year
consist of:
Realised amount (4,656,776) 1,215,531
Unrealised amount 6,844,217 (1,096,795)
2,187,441 118,736
The notes on pages 42 to 62 are an integral part of these financial statements.
40
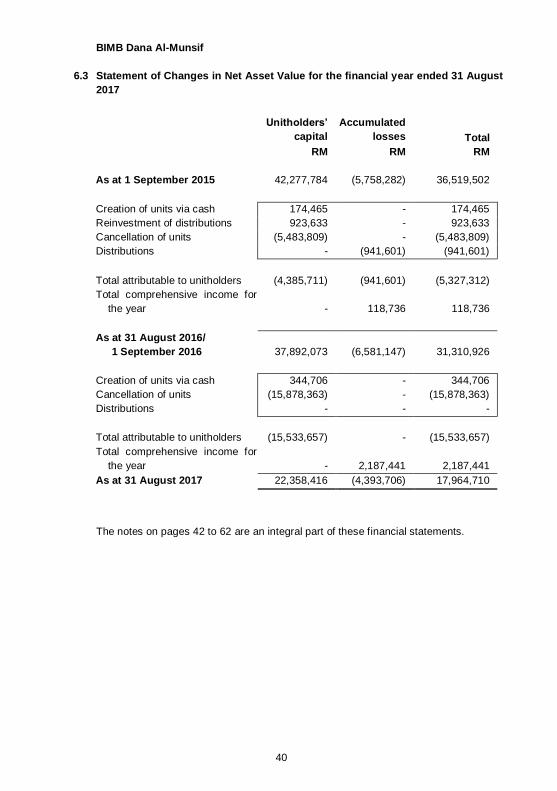
BIMB Dana Al-Munsif
6.3 Statement of Changes in Net Asset Value for the financial year ended 31 August
2017
Unitholders’
capital
Accumulated
losses Total
RM RM RM
As at 1 September 2015 42,277,784 (5,758,282) 36,519,502
Creation of units via cash 174,465 - 174,465
Reinvestment of distributions 923,633 - 923,633
Cancellation of units (5,483,809) - (5,483,809)
Distributions - (941,601) (941,601)
Total attributable to unitholders (4,385,711) (941,601) (5,327,312)
Total comprehensive income for
the year - 118,736 118,736
As at 31 August 2016/
1 September 2016
37,892,073
(6,581,147)
31,310,926
Creation of units via cash 344,706 - 344,706
Cancellation of units (15,878,363) - (15,878,363)
Distributions - - -
Total attributable to unitholders (15,533,657) - (15,533,657)
Total comprehensive income for
the year - 2,187,441 2,187,441
As at 31 August 2017 22,358,416 (4,393,706) 17,964,710
The notes on pages 42 to 62 are an integral part of these financial statements.

41
BIMB Dana Al-Munsif
6.4 Statement of Cash Flows for the financial year ended 31 August 2017
2017 2016
RM RM
Cash flows from operating activities
Proceeds from sale of quoted investments 29,753,658 29,412,328
Purchase of quoted investments (19,494,600) (40,100,735)
Purchase of Islamic debt securities - (1,527,900)
Maturity of Islamic debt securities 5,542,900 4,500,000
Dividend received 363,346 502,146
Income from Islamic debt securities and short
term investments
430,971
696,570
Management fee paid (366,360) (519,747)
Trustee fee paid (19,539) (27,712)
Audit fee paid (22,000) -
Tax agent fee paid (4,500) -
Payment for administrative expenses (47,686) (57,369)
Cash generated from/(used in) operations 16,136,190 (7,122,419)
Tax refund 10,570 -
Net cash generated from/(used in) operating
activities 16,146,760 (7,122,419)
Cash flows from financing activities
Cash receipt for creation of units 345,092 273,134
Cash payment for cancellation of units (16,003,670) (5,448,516)
Payment of distributions (17,968) -
Net cash used in financing activities (15,676,546) (5,175,382)
Net increase/(decrease) in cash and cash
equivalents 470,214 (12,297,801)
Cash and cash equivalents at 1 September 2,944,389 15,242,190
Cash and cash equivalents at 31 August 3,414,603 2,944,389
Cash and cash equivalents comprise:
Cash at bank 324,465 297,797
Short term placements 3,090,138 2,646,592
3,414,603 2,944,389
The notes on pages 42 to 62 are an integral part of these financial statements.
42
BIMB Dana Al-Munsif
6.5 Notes to the Financial Statements
1. Information on the Fund
BIMB Dana Al-Munsif (hereinafter referred to as “the Fund”) was constituted pursuant
to the execution of a Deed dated 6 December 2001 between the Manager - BIMB
Investment Management Berhad, the Trustee and the registered unitholders of the
Fund. Effective from 5 September 2017 the trustee has been changed from Affin
Hwang Trustee Berhad to SCBMB Trustee Berhad.
The principal activity of the Fund is to invest in authorised investments as defined in
the Deed, which include stocks and shares of companies quoted on Bursa Malaysia,
short term deposits and Islamic debt securities.
The Manager, BIMB Investment Management Berhad, a company incorporated in
Malaysia, is a subsidiary of Bank Islam Malaysia Berhad.
The financial statements were approved by the Board of Directors of the Manager on
26 October 2017.
2. Basis of preparation
(a) Statement of compliance
The financial statements of the Fund have been prepared in accordance with
Malaysian Financial Reporting Standards (“MFRS”), International Financial
Reporting Standards (“IFRS”), the Deed and Securities Commission‟s Guidelines
on Unit Trust Funds (“Guidelines”) in Malaysia.
The following are accounting standards, amendments and interpretations that
have been issued by the Malaysian Accounting Standards Board (“MASB”) but
have not been adopted by the Fund:
MFRSs, Interpretations and amendments effective for annual periods
beginning on or after 1 January 2017
Amendments to MFRS 12, Disclosure of Interests in Other Entities (Annual
Improvements to MFRS Standards 2014-2016 Cycle)
Amendments to MFRS 107, Statement of Cash Flows – Disclosure Initiative
Amendments to MFRS 112, Income Taxes – Recognition of Deferred Tax
Assets for Unrealised Losses

43
2. Basis of preparation (continued)
(a) Statement of compliance (continued)
MFRSs, Interpretations and amendments effective for annual periods
beginning on or after 1 January 2018
MFRS 9, Financial Instruments (2014)
MFRS 15, Revenue from Contracts with Customers
Clarifications to MFRS 15, Revenue from Contracts with Customers
IC Interpretation 22, Foreign Currency Transactions and Advance
Consideration
Amendments to MFRS 1, First-time Adoption of Malaysian Financial Reporting
Standards (Annual Improvements to MFRS Standards 2014-2016 Cycle)
Amendments to MFRS 2, Share-based Payment – Classification and
Measurement of Share-based Payment Transactions
Amendments to MFRS 4, Insurance Contracts – Applying MFRS 9 Financial
Instruments with MFRS 4 Insurance Contracts
Amendments to MFRS 128, Investments in Associates and Joint Ventures
(Annual Improvements to MFRS Standards 2014-2016 Cycle)
Amendments to MFRS 140, Investment Property – Transfers of Investment
Property
MFRSs, Interpretations and amendments effective for annual periods
beginning on or after 1 January 2019
MFRS 16, Leases
IC Interpretation 23, Uncertainty over Income Tax Treatments
MFRSs, Interpretations and amendments effective for annual periods
beginning on or after 1 January 2021
MFRS 17, Insurance Contracts
MFRSs, Interpretations and amendments effective for a date yet to be
confirmed
Amendments to MFRS 10, Consolidated Financial Statements and MFRS 128,
Investments in Associates and Joint Ventures – Sale or Contribution of Assets
between an Investor and its Associate or Joint Venture
The Fund plans to apply the abovementioned accounting standards,
amendments and interpretations, where applicable:
from the annual period beginning on 1 September 2017 for those amendments
that are effective for annual periods beginning on or after 1 January 2017;
from the annual period beginning on 1 September 2018 for those accounting
standards, amendments and interpretation that are effective for annual periods
beginning on or after 1 January 2018;

44
2. Basis of preparation (continued)
(a) Statement of compliance (continued)
from the annual period beginning on 1 September 2019 for the accounting
standard that is effective for annual periods beginning on or after 1 January
2019.
from the annual period beginning on 1 September 2021 for the accounting
standard that is effective for annual periods beginning on or after 1 January
2021.
The initial application of the accounting standards, amendments or
interpretations are not expected to have any material financial impacts to the
current year and prior year financial statements of the Fund, except as
mentioned below:
(i) MFRS 9, Financial Instruments
MFRS 9 replaces the guidance in MFRS 139, Financial Instruments:
Recognition and Measurement on the classification and measurement of
financial assets and financial liabilities, and on hedge accounting.The Fund
is currently assessing the financial impact that may arise from the adoption
of MFRS 9.
(b) Basis of measurement
The financial statements are prepared on the historical cost basis except as
disclosed in Note 3(a)(ii).
(c) Functional and presentation currency
These financial statements are presented in Ringgit Malaysia (“RM”), which is the
Fund‟s functional currency.
(d) Use of estimates and judgements
The preparation of financial statements in conformity with MFRSs requires
management to make judgements, estimates and assumptions that affect the
application of accounting policies and the reported amounts of assets, liabilities,
income and expenses. Actual results may differ from these estimates.
Estimates and underlying assumptions are reviewed on an ongoing basis.
Revisions to accounting estimates are recognised in the period in which the
estimate is revised and in any future years affected.
There are no significant areas of estimation uncertainty and critical judgements in
applying accounting policies that have significant effect on the amounts
recognised in the financial statements.
45
3. Significant accounting policies
The accounting policies set out below have been applied consistently to the periods
presented in these financial statements, unless otherwise stated.
(a) Financial instruments
(i) Initial recognition and measurement
A financial instrument is recognised in the statement of financial position
when, and only when, the Fund becomes a party to the contractual
provisions of the instrument.
A financial instrument is recognised initially, at its fair value plus, in the case
of a financial instrument not at fair value through profit or loss, transaction
costs that are directly attributable to the acquisition or issue of the financial
instrument.
(ii) Financial instrument categories and subsequent measurement
The Fund categorises financial instruments as follows:
Financial assets
(a) Financial assets at fair value through profit or loss
Fair value through profit or loss category comprises financial assets
that are held for trading, or financial assets that are specifically
designated into this category upon initial recognition. These include
Islamic debt securities.
Financial assets categorised as fair value through profit or loss are
subsequently measured at their fair values with the gain or loss
recognised in the statement of profit or loss.
(b) Financing and receivables
Financing and receivables category are debt instruments that are
not quoted in an active market and these comprises amount due
from Managers, other receivables, cash and cash equivalents and
short term investments.
Financial assets categorised as financing and receivables are
subsequently measured at amortised cost using the effective profit
method.
All financial assets except for those measured at fair value through profit or
loss, are subject to review for impairment, see Note 3(e).

46
3. Significant accounting policies (continued)
(a) Financial instruments (continued)
(ii) Financial instrument categories and subsequent measurement
(continued)
Financial liabilities
All financial liabilities are subsequently measured at amortised cost.
Financial liabilities measured at amortised cost comprises amount due to
Manager and other payables.
(iii) Derecognition
A financial asset or part of it is derecognised when, and only when the
contractual rights to the cash flows from the financial asset expire or the
financial asset is transferred to another party without retaining control or
substantially all risks and rewards of the asset. On derecognition of a
financial asset, the difference between the carrying amount and the sum of
the consideration received (including any new asset obtained less any new
liability assumed) and any cumulative gain or loss that had been recognised
in equity is recognised in profit or loss.
A financial liability or a part of it is derecognised when, and only when, the
obligation specified in the contract is discharged or cancelled or expires. On
derecognition of a financial liability, the difference between the carrying
amount of the financial liability extinguished or transferred to another party
and the consideration paid, including any non-cash assets transferred or
liabilities assumed, is recognised in profit or loss.
(b) Income recognition
(i) Dividend income
Dividend income is recognised in profit or loss on the date that the Fund‟s
right to receive payment is established, which in the case of quoted shares
is the entitlement date.
(ii) Income from short term investments and Islamic debt securities
Income from short term investments and Islamic debt securities are
recognised as it accrues, using the effective profit method in profit or loss.

47
3. Significant accounting policies (continued)
(b) Income recognition
(iii) Gain on sale of investments
The realised gain on sale of investments is measured as the difference
between the net disposal proceeds and the carrying amount of the
investments. The carrying amount for determining the realised gain on sale
of investments is based on the weighted average cost method and where
applicable adjusted for accretion for discount and amortisation of premium.
(c) Islamic debt securities
Islamic debt securities are investments in sukuk which are held for trading. It is
categorised as fair value through profit or loss and subsequently measured at
their fair values with the gain or loss recognised in profit or loss.
(d) Cash and cash equivalents
Cash and cash equivalents consist of cash at bank and short term placement
with licensed financial institutions which have insignificant risk of changes in fair
value with original maturities of less than 30 days, and are used by the Fund in
the management of its short term commitments.
Cash and cash equivalents are categorised and measured as financing and
receivables in accordance with policy Note 3(a)(ii)(b).
(e) Impairment
Financial assets
All financial assets (except for financial assets categorised as fair value through
profit or loss) are assessed at each reporting date whether there is any objective
evidence of impairment as a result of one or more events having an impact on
the estimated future cash flows of the asset. Losses expected as a result of
future events, no matter how likely, are not recognised.
An impairment loss in respect of financing and receivables is recognised in profit
or loss and is measured as the difference between the asset‟s carrying amount
and the present value of estimated future cash flows discounted at the asset‟s
original effective profit rate. The carrying amount of the asset is reduced through
the use of an allowance account.

48
3. Significant accounting policies (continued)
(f) Income tax
Income tax expense comprises current tax. Current tax is recognised in profit or
loss except to the extent that it relates to items recognised directly in equity or
other comprehensive income.
Current tax is the expected tax payable or receivable on the taxable income for
the year, using tax rates enacted or substantively enacted at the statement of
financial position date, and any adjustment to tax payable in respect of previous
years.
(g) Unitholders’ capital
The Fund issues cancellable units, which are cancelled at the unitholder‟s option
and are classified as equity. Cancellable units can be put back to the Fund at any
time for cash equal to a proportionate share of the Fund‟s net asset value. The
outstanding units is carried at the redemption amount that is payable at the
financial position date if the holder exercises the right to put the unit back to the
Fund.
Units are created and cancelled at the unitholders‟ option at prices based on the
Fund‟s net asset value per unit at the time of creation or cancellation. The Fund‟s
net asset value per unit is calculated by dividing the net asset attributable to
unitholders with the total number of outstanding units. In accordance with the
Securities Commission‟s Guidelines on Unit Trust Funds in Malaysia, investment
positions are valued based on the last traded market price for the purpose of
determining the net asset value per unit for creations and cancellations.
The units in the Fund are puttable instruments, classified as equity, which entitle
the unitholders to a pro-rata share of the net asset of the Fund. The units are
subordinated and have identical features. There is no contractual obligation to
deliver cash or another financial assets other than the obligation on the Fund to
repurchase the units. The total expected cash flows from the units are based on
the change in the net asset of the Fund.
(h) Distribution
Distribution is at the discretion of the Fund. A distribution to the Fund‟s
unitholders is accounted for as a deduction from realised reserves. A proposed
distribution is recognised as a liability or equity in the year in which they are
declared.

49
3. Significant accounting policies (continued)
(i) Net Asset Value
The Net Asset Value is calculated after deducting the retained profits allocated
for distribution.
(j) Fair value measurement
The Fund adopted MFRS 13, Fair Value Measurement which prescribed that fair
value of an asset or a liability, except for share-based payment and lease
transactions, is determined as the price that would be received to sell an asset or
paid to transfer a liability in an orderly transaction between market participants at
the measurement date. The measurement assumes that the transaction to sell
the asset or transfer the liability takes place either in the principal market or in the
absence of a principal market, in the most advantageous market.
For non-financial asset, the fair value measurement takes into account a market
participant‟s ability to generate economic benefits by using the asset in its
highest and best use or by selling it to another market participant that would use
the asset in its highest and best use.
When measuring the fair value of an asset or a liability, the Fund uses
observable market data as far as possible. Fair value are categorised into
different levels in a fair value hierarchy based on the input used in the valuation
technique as follows:
Level 1: quoted prices (unadjusted) in active markets for identical assets or
liabilities that the Fund can access at the measurement date.
Level 2: inputs other than quoted prices included within Level 1 that are
observable for the asset or liability, either directly or indirectly.
Level 3: unobservable inputs for the asset or liability.
The Fund recognises transfers between levels of the fair value hierarchy as of
the date of the event or change in circumstances that caused the transfers.

50
4. Quoted securities
As at 31 August 2017
Company’s Name
Number
of shares
Cost
Market
value
Percentage
of value of
funds at
2017
held RM RM %
Main Market
(i) Consumer products
IQ Group Holdings Bhd. 67,000 247,084 272,690 1.52
(ii) Industrial products
Hartalega Holdings Bhd. 159,000 814,325 1,079,610 6.01
Heveaboard Bhd. 640,000 963,070 1,068,800 5.95
Kossan Rubber Industries Bhd. 30,000 205,757 216,000 1.20
Seacera Group Bhd. 135,000 181,542 129,600 0.72
SKP Resources Bhd. 125,000 185,093 185,000 1.03
Top Glove Corporation Bhd. 60,000 332,031 336,600 1.87
V.S. Industry Bhd. 250,000 474,816 592,500 3.30
3,156,634 3,608,110 20.08
(iii) Technology
Globetronics Technology Bhd. 265,000 1,511,660 1,701,300 9.47
Inari Amertron Bhd. 528,000 1,084,916 1,341,120 7.47
Malaysian Pacific Industries Bhd. 87,500 913,727 1,232,000 6.86
Pentamaster Corporation Bhd. 202,000 729,054 997,880 5.55
Unisem (M) Bhd. 274,000 898,397 1,123,400 6.25
5,137,754 6,395,700 35.60
(iv) Trading and services
Xin Hwa Holdings Bhd. 250,000 280,914 277,500 1.55
Total portfolio investment
as at 31 August 2017 8,822,386 10,554,000 58.75

51
4. Quoted securities (continued)
As at 31 August 2016
Company’s Name
Number
of shares
held
Cost
Market
value
Percentage
of value of
funds at
2016
RM RM %
Main Market
(i) Construction
WCT Holdings Bhd. 234,749 527,421 370,903 1.18
(ii) Consumer products
Kawan Food Bhd. 125,000 456,704 457,500 1.46
UMW Holdings Bhd. 16,000 199,428 89,120 0.28
656,132 546,620 1.74
(iii) Finance
BIMB Holdings Bhd.* 180,000 807,562 721,800 2.31
(iv) Industrial products
Coastal Contract Bhd. 264,000 779,424 388,080 1.24
Evergreen Fibreboard Bhd. 418,000 494,482 323,950 1.03
Hartalega Holdings Bhd. 55,000 309,709 240,900 0.77
Jaya Tiasa Holdings Bhd. 220,000 348,690 268,400 0.86
Kossan Rubber Industries Bhd. 101,500 700,551 666,855 2.13
Petronas Chemicals Group Bhd. 57,500 425,778 384,675 1.23
Petronas Gas Bhd. 30,000 697,235 666,000 2.13
SKP Resources Bhd. 404,000 582,427 484,800 1.55
Supermax Corporation Bhd. 45,000 97,347 91,350 0.29
Ta Ann Holdings Bhd. 49,200 225,037 175,644 0.56
Top Glove Corporation Bhd. 133,000 751,351 565,250 1.81
WTK Holdings Bhd. 365,000 534,884 365,000 1.17
5,946,915 4,620,904 14.77
(v) Infrastructure
DiGi.Com Bhd. 177,000 1,013,294 888,540 2.84
(vi) Plantation
Felda Global Ventures
Holdings Bhd.
510,000
1,098,691
1,157,700
3.70

52
4. Quoted securities (continued)
As at 31 August 2016
Company’s Name
Number
of shares
Cost
Market
value
Percentage
of value of
funds at
2016
held RM RM %
Main Market (continued)
(vii) Properties
Eastern & Oriental Bhd. 117,300 223,604 195,891 0.63
Malaysian Resources Corporation
Bhd.
436,000
913,843
545,000
1.74
S P Setia Bhd. 224,000 909,927 781,760 2.50
UEM Sunrise Bhd. 188,900 517,944 204,012 0.65
2,565,318 1,726,663 5.52
(viii) Technology
Globetronics Technology Bhd. 123,000 728,197 360,390 1.15
Inari Amertron Bhd. 254,000 831,726 805,180 2.57
Malaysian Pacific Industries Bhd. 43,000 342,182 331,960 1.06
Unisem (M) Bhd. 271,000 740,976 718,150 2.29
Vivocom Intl Holdings Bhd. 3,351,000 1,030,151 938,280 3.00
3,673,232 3,153,960 10.07
(ix) Trading and services
Axiata Group Bhd. 180,828 1,175,438 992,746 3.17
Brahims Holdings Bhd. 189,900 275,277 157,617 0.50
Dayang Enterprise Holdings Bhd. 58,000 179,320 58,580 0.19
Dialog Group Bhd. 620,928 1,150,023 956,229 3.05
E.A Technique Bhd. 419,000 555,005 326,820 1.04
Maxis Bhd. 79,700 537,141 500,516 1.60
Media Chinese International Ltd. 187,500 276,810 135,938 0.43
MMC Corporation Bhd. 82,000 244,959 184,500 0.59
My E.G Services Bhd. 130,000 295,633 284,700 0.91
Petronas Dagangan Bhd. 33,900 903,881 793,260 2.53
Sime Darby Bhd. 66,009 580,721 520,811 1.66
UMW Oil & Gas Corporation Bhd. 414,000 1,050,838 374,670 1.20
Uzma Bhd. 215,000 489,044 376,250 1.20
7,714,090 5,662,637 18.07
Total portfolio investment
as at 31 August 2016 24,002,655 18,849,727 60.20
* The Fund holds investments in companies which are related parties to the Manager.
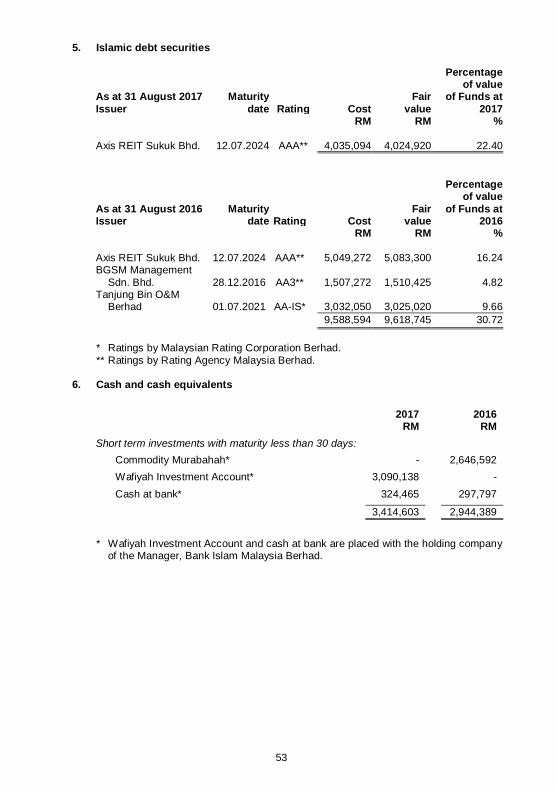
53
5. Islamic debt securities
As at 31 August 2017
Issuer
Maturity
date
Rating
Cost
Fair
value
Percentage of value
of Funds at
2017 RM RM %
Axis REIT Sukuk Bhd. 12.07.2024 AAA** 4,035,094 4,024,920 22.40
As at 31 August 2016 Issuer
Maturity date
Rating
Cost
Fair value
Percentage of value
of Funds at 2016
RM RM %
Axis REIT Sukuk Bhd. 12.07.2024 AAA** 5,049,272 5,083,300 16.24 BGSM Management
Sdn. Bhd.
28.12.2016
AA3**
1,507,272
1,510,425
4.82 Tanjung Bin O&M
Berhad 01.07.2021 AA-IS* 3,032,050 3,025,020 9.66
9,588,594 9,618,745 30.72
* Ratings by Malaysian Rating Corporation Berhad.
** Ratings by Rating Agency Malaysia Berhad.
6. Cash and cash equivalents
2017 2016 RM RM
Short term investments with maturity less than 30 days:
Commodity Murabahah* - 2,646,592
Wafiyah Investment Account* 3,090,138 -
Cash at bank* 324,465 297,797
3,414,603 2,944,389
* Wafiyah Investment Account and cash at bank are placed with the holding company of the Manager, Bank Islam Malaysia Berhad.

54
7. Unitholders’ capital
No. of units RM
As at 31 August 2015/1 September 2015 82,037,110 42,277,784
Creation of units 2,523,380 1,098,098
Cancellation of units (12,155,718) (5,483,809)
As at 31 August 2016/1 September 2016 72,404,772 37,892,073
Creation of units 724,272 344,706
Cancellation of units (36,172,375) (15,878,363)
As at 31 August 2017 36,956,669 22,358,416
8. Manager’s fee
The manager‟s fee payable to the Manager of the Fund is based on 1.50% (2016:
1.50%) per annum of the net asset value of the Fund calculated on a daily basis. 9. Trustee’s fee
The trustee‟s fee is payable to the trustee of the Fund is based on 0.08% (2016: 0.08%) per annum subject to a minimum of RM18,000 (2016: RM18,000) per annum
of the net asset value of the Fund calculated on a daily basis.
10. Tax expense
2017 2016
RM RM
Tax expense
- Current year - -
- Over provision in prior year (4,579) -
Reconciliation of effective tax expense
Net income before taxation 2,182,862 118,736
Income tax using Malaysian tax rate @ 24% 523,887 28,497
Non-assessable income (1,812,048) (448,554)
Non-deductible expenses 1,189,548 279,482
Restrictions on the tax deductible expenses
for unit trust funds 98,613
140,575
Over provision in prior years (4,579) -
(4,579) -
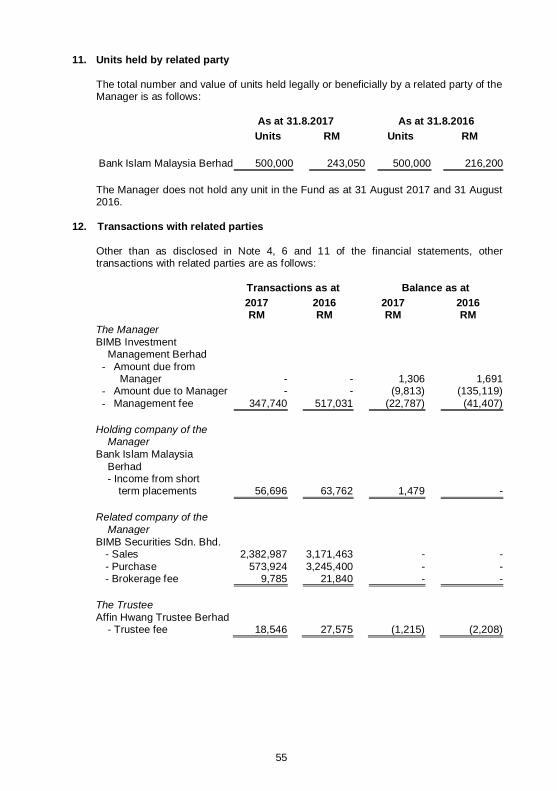
55
11. Units held by related party
The total number and value of units held legally or beneficially by a related party of the Manager is as follows:
As at 31.8.2017 As at 31.8.2016
Units RM Units RM
Bank Islam Malaysia Berhad 500,000 243,050 500,000 216,200
The Manager does not hold any unit in the Fund as at 31 August 2017 and 31 August 2016.
12. Transactions with related parties
Other than as disclosed in Note 4, 6 and 11 of the financial statements, other transactions with related parties are as follows:
Transactions as at Balance as at
2017 2016 2017 2016 RM RM RM RM
The Manager BIMB Investment Management Berhad
- Amount due from Manager - - 1,306 1,691
- Amount due to Manager - - (9,813) (135,119)
- Management fee 347,740 517,031 (22,787) (41,407)
Holding company of the Manager
Bank Islam Malaysia
Berhad
- Income from short term placements
56,696
63,762
1,479
-
Related company of the
Manager
BIMB Securities Sdn. Bhd.
- Sales 2,382,987 3,171,463 - -
- Purchase 573,924 3,245,400 - - - Brokerage fee 9,785 21,840 - -
The Trustee Affin Hwang Trustee Berhad - Trustee fee 18,546 27,575 (1,215) (2,208)

56
13. Transactions with related and other stockbroking companies
Value of
trade
Percentage
of total
trade
Brokerage
fee
Percentage of total
brokerage fee
RM % RM %
2017 Hong Leong Investment Bank Bhd. 6,846,932 12.83 22,339 13.74
TA Securities Holdings Bhd. 5,872,253 11.01 19,483 11.98
Maybank Investment Bank Bhd. 5,165,300 9.68 17,410 10.71
Public Investment Bank Bhd. 4,916,277 9.21 16,402 10.09
MIDF Amanah Investment Bank Bhd.
4,806,531
9.01
14,890
9.16
Kenanga Investment Bank Bhd. 3,763,757 7.06 11,911 7.33
RHB Investment Bank Bhd. 3,395,444 6.36 11,290 6.94 KAF Seagroatt & Campbell Securities Sdn. Bhd. 3,243,067 6.08 10,280 6.32
Hong Leong Bank Bhd. 3,046,915 5.71 - -
BIMB Securities Sdn. Bhd.* 2,956,911 5.54 9,785 6.02
Other brokers 9,338,713 17.51 28,811 17.71
53,352,100 100.00 162,601 100.00
2016
RHB Investment Bank Bhd. 12,606,133 17.75 41,273 17.82
CIMB Investment Bank Bhd. 10,148,573 14.29 32,703 14.12
MIDF Amanah Investment Bank Bhd.
7,286,201
10.26
24,404
10.54
BIMB Securities Sdn. Bhd.* 6,416,863 9.04 21,840 9.43
TA Securities Holdings Bhd. 6,209,712 8.74 21,031 9.08
Kenanga Investment Bank Bhd. 5,071,985 7.14 16,624 7.18
Maybank Investment Bank Bhd. 4,831,788 6.80 16,945 7.32
Macquarie Capital Securities Sdn. Bhd.
4,481,678
6.31
15,049
6.50
Public Investment Bank Bhd. 4,432,427 6.24 14,304 6.17
Hong Leong Investment Bank Bhd.
4,261,707
6.00
14,696
6.34
Other Brokers 5,275,385 7.43 12,727 5.50
71,022,452 100.00 231,596 100.00
* Transactions with the related parties have been entered into in the normal course of
business and have been transacted at arm‟s lengths basis.

57
14. Management Expense Ratio (“MER”)
The management expense ratio for the financial year is 1.86% (2016: 1.79%). Management expense ratio is the ratio of total fees and recovered expenses of the Fund expressed as a percentage of the Fund‟s average net asset value. It is a total
management expenses expressed as an annual percentage of the Fund‟s average net asset value.
15. Portfolio Turnover Ratio (“PTR”)
The portfolio turnover ratio for the financial year is 1.18 times (2016: 1.10 times). It
represents the average of total acquisitions and disposals of the investments in the Fund for the financial year over the average net asset value of the Fund calculated on a daily basis.
16. Financial instruments
16.1 Categories of financial instruments
The table below provides an analysis of financial instruments categorised as
follows: (a) Financing and receivables (“F&R”);
(b) Fair value through profit or loss (“FVTPL”); (c) Financial liabilities measured at amortised cost (“FL”).
Carrying
amount
F&R/
(FL)
FVTPL
RM RM RM
2017
Financial assets
Quoted securities 10,554,000 - 10,554,000
Islamic debt securities 4,024,920 - 4,024,920
Cash and cash equivalents 3,414,603 3,414,603 -
Other receivables 36,540 36,540 -
18,030,063 3,451,143 14,578,920
Financial liabilities
Payables (65,353) (65,353) -
2016
Financial assets
Quoted securities 18,849,727 - 18,849,727
Islamic debt securities 9,618,745 - 9,618,745
Cash and cash equivalents 2,944,389 2,944,389 -
Other receivables 129,353 129,353 -
31,542,214 3,073,742 28,468,472
Financial liabilities
Payables (237,279) (237,279) -
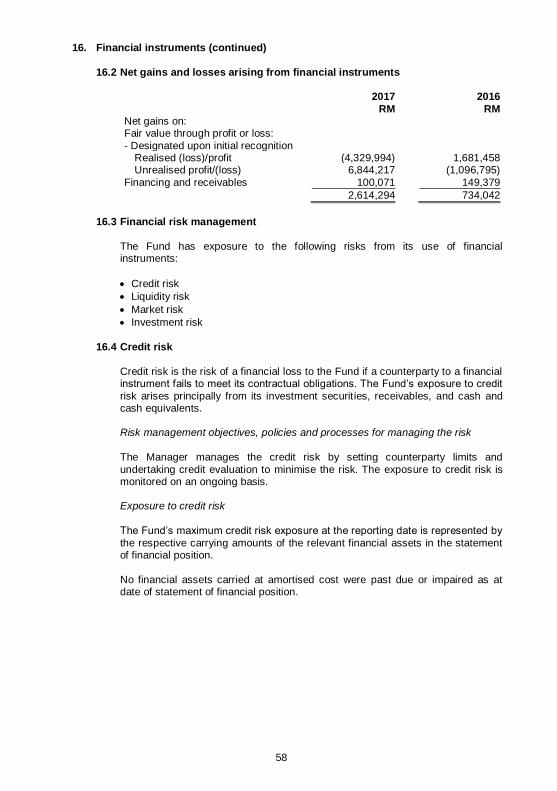
58
16. Financial instruments (continued)
16.2 Net gains and losses arising from financial instruments
2017 2016
RM RM Net gains on: Fair value through profit or loss:
- Designated upon initial recognition Realised (loss)/profit (4,329,994) 1,681,458 Unrealised profit/(loss) 6,844,217 (1,096,795)
Financing and receivables 100,071 149,379
2,614,294 734,042
16.3 Financial risk management
The Fund has exposure to the following risks from its use of financial instruments:
Credit risk
Liquidity risk
Market risk
Investment risk
16.4 Credit risk
Credit risk is the risk of a financial loss to the Fund if a counterparty to a financial instrument fails to meet its contractual obligations. The Fund‟s exposure to credit
risk arises principally from its investment securities, receivables, and cash and cash equivalents. Risk management objectives, policies and processes for managing the risk
The Manager manages the credit risk by setting counterparty limits and
undertaking credit evaluation to minimise the risk. The exposure to credit risk is monitored on an ongoing basis. Exposure to credit risk
The Fund‟s maximum credit risk exposure at the reporting date is represented by
the respective carrying amounts of the relevant financial assets in the statement of financial position.
No financial assets carried at amortised cost were past due or impaired as at date of statement of financial position.

59
16. Financial instruments (continued)
16.5 Liquidity risk
Liquidity risk is the risk that the Fund will not be able to meet its financial
obligations as they fall due. The Fund‟s exposure to liquidity risk arises principally from its various payables which are due within one year.
The Fund maintains sufficient level of liquid assets, after consultation with the Trustee, to meet anticipated payments and cancellation of units by unitholders. Liquid assets comprise cash and other instruments, which are capable of being
converted into cash within 7 days.
16.6 Market risk
Market risk is the risk that changes in market prices, such as profit rates and market prices will affect the Fund‟s financial position or cash flows.
Profit rate risk
The profit rate profile of the Fund‟s significant profit-bearing financial instruments, based on carrying amounts as at the end of reporting period was:
Effective profit rate
per annum 2017
Effective profit rate
per annum 2016
% RM % RM
Fixed rate instruments
Islamic debt securities 4.50 4,024,920 4.50 – 5.90 9,618,745
Cash and cash equivalents
-Short term investments with maturity less than 30 days 3.20 – 3.30 3,090,138 2.95 2,646,592
Fair value sensitivity analysis for fixed rate instruments
The Fund accounts for Islamic debt securities at fair value through profit or loss whereas short term investment are at amortised cost.
An increase of 100 basis point (bp) in profit rates of Islamic debts securities at the end of the reporting period would have decreased on the equity and profit or
loss by RM228,063 (2016: RM450,683). A decrease of 100 basis point (bp) in profit rates would have equal but opposite effect on the equity and profit or loss respectively.
60
16. Financial instruments (continued)
16.6 Market risk (continued)
Market price risk
Equity price risk arises from the Fund‟s investments in quoted securities. Risk management objectives, policies and processes for managing the risk
The Fund is restricted to invest in securities issued by any issuer of not more
than 10% of its net asset value. Under such restriction, the exposure risk to the securities of any issuer is mitigated. Equity price risk sensitivity analysis
This analysis assumes that all other variables remain constant and the Fund‟s
equity investments are positively correlated to each other. A 10% strengthening in the equity prices at the end of the reporting year would
have increased the net asset value and unitholders‟ fund by RM1,055,400 (2016: RM1,884,973). A 10% weakening in equity prices would have had equal but opposite effect on the net asset value and unitholders‟ fund respectively.
16.7 Investment risk
Investments are bound by Deed and prospectus that govern the maximum securities holdings and maximum liquid assets holdings.
Investment risks for equity funds consist primarily of market risk, specific stock risk and liquidity risk. The mechanism employed to control investment risk for equity funds is by placing acceptable stock and sector limits.
Risk management objectives, policies and processes for managing the risk
The Manager has written policies and guidelines on risk management, which set out the overall investment risks strategies and general risk management philosophies. These processes monitor, measure and control risks associated
with the business. Matters relating to investment risks in respect of Funds portfolio are discussed during the Investment Committee meetings of the Manager held at least 6 (2016: 6) times a year.

61
16. Financial instruments (continued)
16.8 Fair value of financial instruments
The carrying amounts of cash and cash equivalents, short term receivables and payables approximate fair values due to the relatively short term nature of these financial instruments.
The table below analyses financial instruments carried at fair value and carrying amounts shown in the statement of financial position.
Fair value of financial instruments carried at
fair value
Carrying
Level 1 Level 2 Level 3 Total amount
RM RM RM RM RM
2017
Financial assets
Quoted securities 10,554,000 - - 10,554,000 10,554,000
Islamic debt
securities
-
4,024,920
-
4,024,920
4,024,920
10,554,000 4,024,920 - 14,578,920 14,578,920
2016
Financial assets
Quoted securities 18,849,727 - - 18,849,727 18,849,727
Islamic debt
securities
-
9,618,745
-
9,618,745
9,618,745
18,849,727 9,618,745 - 28,468,472 28,468,472
Policy on transfer between levels The fair value of an asset to be transferred between levels is determined as of
the date of the event or change in circumstances that caused the transfer. Level 1 fair value
Level 1 fair value is derived from quoted price (unadjusted) in active markets for identical financial assets or liabilities that the entity can access at the
measurement date. Quoted equities
Quoted equities in Malaysia are valued at closing market price quoted on the Bursa Malaysia at the date of the statement of financial position, in accordance
with the Deed. Unrealised gain or loss is taken to statement of profit or loss and other comprehensive income.
62
16. Financial instruments (continued)
16.8 Fair value of financial instruments (continued)
Level 2 fair value Level 2 fair value is estimated using inputs other than quoted prices included
within Level 1 that are observable for the financial assets or liabilities, either directly or indirectly. Islamic debt securities
Islamic debt securities issued by Malaysian corporations and rated by the Rating
Agency Malaysia Berhad or Malaysian Rating Corporation Berhad are carried at fair value. In arising at fair value gain/loss, the acquisition cost is adjusted for the amortisation of any premium or accretion of any discount over their par values at
the time of acquisition. The premium or discount is amortised or accreted on a yield to maturity basis over the remaining term of the investments from the date of acquisition.
This adjusted cost (carrying value) is then revalued to reflect its fair value (indicative market value) using the fair price quoted by an independent bond
pricing agency (BPA) registered with the Securities Commission. If such quotations are not available, it will be valued on a weekly basis or as and when appropriate by reference to average indicative yield quoted by the three
reputable financial institutions in over-the-counter markets as the close of trading. These institutions include investment banks and commercial banks.
Transfers between Level 1 and Level 2 fair values There has been no transfer between Level 1 and 2 fair values during the financial
year (2016: No transfer in either direction). Level 3 fair value
Level 3 fair value is estimated using unobservable inputs for the financial assets and liabilities.
17. Capital management
The Fund‟s capital is represented by the unitholders‟ fund in the statement of financial position. The Manager of the Fund monitors the adequacy of capital on an ongoing basis. There is no external capital requirement imposed on the Fund.

63
7.0 Corporate Directory
Manager
BIMB Investment Management Berhad
Registered Office
Level 32, Menara Bank Islam, No. 22, Jalan Perak
50450, Kuala Lumpur
Business Office
Level 19, Menara Bank Islam, No. 22, Jalan Perak
50450, Kuala Lumpur
Board of Directors
Khairul Kamarudin (Chairman - Non-Executive Non
Independent Director)
Dato‟ Ghazali Awang (Non-Executive Independent Director)
Datuk Noripah Kamso (Non-Executive Independent Director)
Dr. Mohd Hatta Dagap (Non-Executive Independent Director)
Malkiat Singh @ Malkit Singh Maan (Non-Executive Non
Independent Director)
Najmuddin Mohd Lutfi (Chief Executive Officer)
Shariah Committee Ustaz Dr. Ahmad Shahbari @ Sobri Salamon
Ustaz Dr. Yusof Ramli
Ustazah Dr. Asmak Ab. Rahman
Investment Committee Khairul Muzamel Perera Abdullah (Chairman – Non
Independent Member)
Datuk Noripah Kamso (Independent Member)
Dato‟ Darawati Hussain (Independent Member)
Audit Committee Dato‟ Ghazali Awang (Chairman - Independent Member)
Dr. Mohd Hatta Dagap (Independent Member)
Malkiat Singh @ Malkit Singh Maan (Non-Executive Non
Independent Member)
Company Secretaries
Aidil Haznul Zulkifli (MACS 01638)
Level 32, Menara Bank Islam, No.22 Jalan Perak,
50450 Kuala Lumpur
Norhidayati Mohamat Salim (MIA 27364)
Level 32, Menara Bank Islam, No. 22, Jalan Perak 50450,
Kuala Lumpur
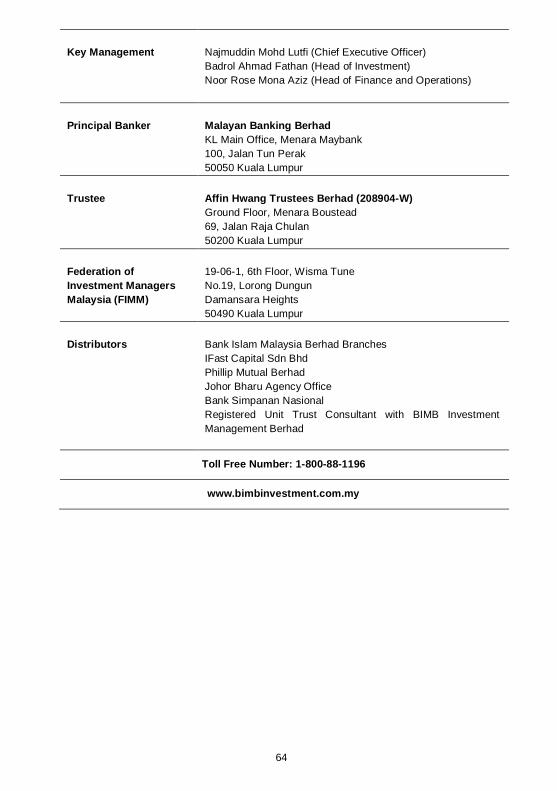
64
Key Management Najmuddin Mohd Lutfi (Chief Executive Officer)
Badrol Ahmad Fathan (Head of Investment)
Noor Rose Mona Aziz (Head of Finance and Operations)
Principal Banker Malayan Banking Berhad
KL Main Office, Menara Maybank
100, Jalan Tun Perak
50050 Kuala Lumpur
Trustee Affin Hwang Trustees Berhad (208904-W)
Ground Floor, Menara Boustead
69, Jalan Raja Chulan
50200 Kuala Lumpur
Federation of
Investment Managers
Malaysia (FIMM)
19-06-1, 6th Floor, Wisma Tune
No.19, Lorong Dungun
Damansara Heights
50490 Kuala Lumpur
Distributors Bank Islam Malaysia Berhad Branches
IFast Capital Sdn Bhd
Phillip Mutual Berhad
Johor Bharu Agency Office
Bank Simpanan Nasional
Registered Unit Trust Consultant with BIMB Investment
Management Berhad
Toll Free Number: 1-800-88-1196
www.bimbinvestment.com.my