Embed Size (px)
Citation preview
Bill Killacky Crime Data Exploratory Analysis and Dataset Creations Page 1 of 13
Exercise in Data Extraction, Transformation, and Creation of a Student Dataset for Research Exercises Data.Gov / City of Chicago / Crimes - One year prior to present Dataset Downloaded Nov 16, 2014
Data.Gov / City of Chicago / Crimes - One year prior to present Dataset description: https://data.cityofchicago.org This dataset reflects reported incidents of crime (with the exception of murders where data exists for each victim) that have occurred in the City of Chicago over the past year, minus the most recent seven days of data. I’ve attached the R program that downloaded the original dataset, reduced the dataset to crime rows within an area of interest, and added columns that could be of interest to student researchers using this new dataset. I’ll include some simple graphics in this document to take a simple view of the data; but all the code to produce the plots and tables is included in the attached R program. I downloaded the Chicago crime dataset on 11/16/14
It had 274,265 total rows
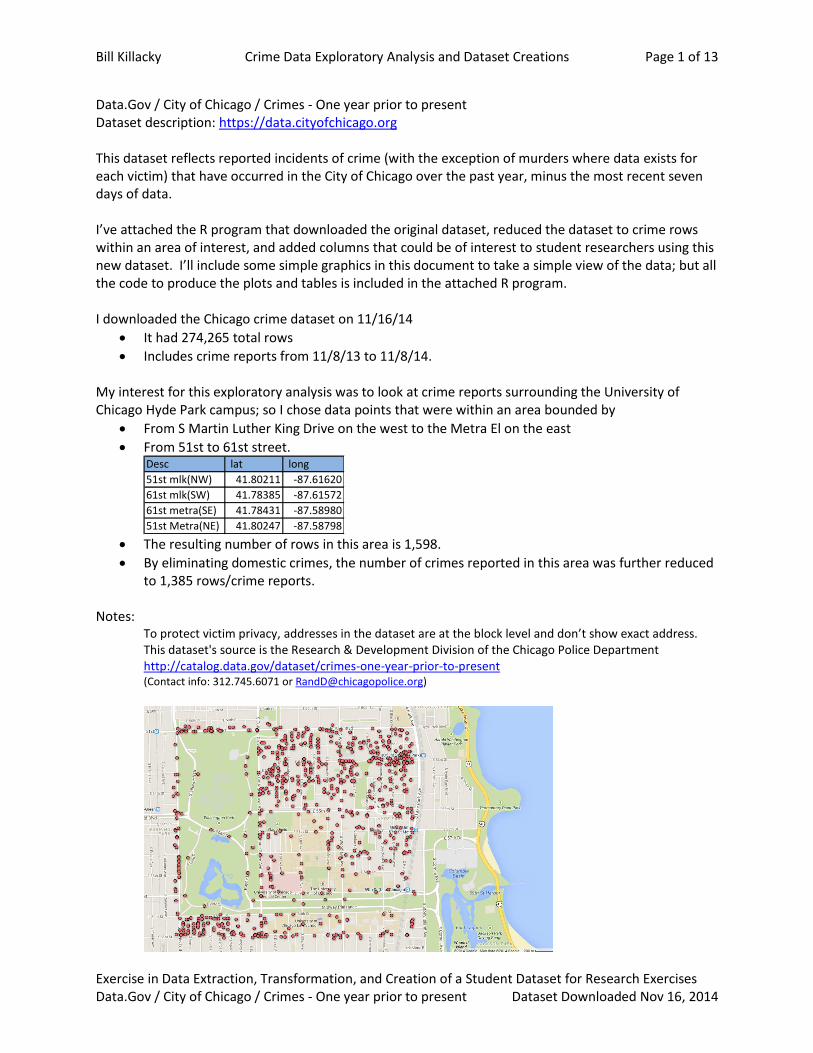
Includes crime reports from 11/8/13 to 11/8/14. My interest for this exploratory analysis was to look at crime reports surrounding the University of Chicago Hyde Park campus; so I chose data points that were within an area bounded by
From S Martin Luther King Drive on the west to the Metra El on the east
From 51st to 61st street.
The resulting number of rows in this area is 1,598.
By eliminating domestic crimes, the number of crimes reported in this area was further reduced to 1,385 rows/crime reports.
Notes:
To protect victim privacy, addresses in the dataset are at the block level and don’t show exact address. This dataset's source is the Research & Development Division of the Chicago Police Department http://catalog.data.gov/dataset/crimes-one-year-prior-to-present (Contact info: 312.745.6071 or [email protected])
Desc lat long
51st mlk(NW) 41.80211 -87.61620
61st mlk(SW) 41.78385 -87.61572
61st metra(SE) 41.78431 -87.58980
51st Metra(NE) 41.80247 -87.58798

Bill Killacky Crime Data Exploratory Analysis and Dataset Creations Page 2 of 13
Exercise in Data Extraction, Transformation, and Creation of a Student Dataset for Research Exercises Data.Gov / City of Chicago / Crimes - One year prior to present Dataset Downloaded Nov 16, 2014
Some simple questions to answer with the data: 1. Are crimes more likely to occur in the AM or PM? 2. What months are crimes more likely to occur? What season? 3. What hours are crimes more likely to occur? Are some times more dangerous than others? 4. What days of the week are crimes more likely to occur? Are weekends more dangerous? 5. What days of the month are crimes more likely to occur? Is there a payday factor? 6. What crimes occur in the greatest frequency? 7. What percentage of crimes resulted in an arrest? 8. What locations are crimes more likely to occur? Where not to park my car, or stroll past.
Are crimes more likely to occur in the AM or PM?
library(plyr) par(las=1) crimes <- count(uchgoCrime, vars = 'amPM') crimes <- crimes[order(-crimes[2]),] barplot(crimes$freq, names.arg=crimes$amPM, main='Frequency of Crimes by AM/PM')
What months are crimes more likely to occur? What season?
par(las=1) crimes <- count(uchgoCrime, vars = 'month') crimes <- crimes[order(-crimes[2]),] barplot(crimes$freq, names.arg=crimes$month, main='Frequency of Crimes by Month\n(Freq Order)')

Bill Killacky Crime Data Exploratory Analysis and Dataset Creations Page 3 of 13
Exercise in Data Extraction, Transformation, and Creation of a Student Dataset for Research Exercises Data.Gov / City of Chicago / Crimes - One year prior to present Dataset Downloaded Nov 16, 2014
What hours are crimes more likely to occur? Are some times more dangerous than others?
par(las=2) crimes <- count(uchgoCrime, vars = 'Hr') crimes <- crimes[order(-crimes[2]),] barplot(crimes$freq, names.arg=crimes$Hr, main='Frequency of Crimes by Hour\n(Freq Order)', xlab='24 Hour Time')
par(las=2) crimes <- count(uchgoCrime, vars = 'Hr') crimes <- crimes[order(crimes[1]),] barplot(crimes$freq, names.arg=crimes$Hr, main='Frequency of Crimes by Hour\n(Time Order)', xlab='24 Hour Time')
par(las=1) crimes <- count(uchgoCrime, vars = 'TimeOfDay') crimes <- crimes[order(-crimes[2]),] barplot(crimes$freq, names.arg=crimes$TimeOfDay, main='Frequency of Crimes by Time of Day')
Bill Killacky Crime Data Exploratory Analysis and Dataset Creations Page 4 of 13
Exercise in Data Extraction, Transformation, and Creation of a Student Dataset for Research Exercises Data.Gov / City of Chicago / Crimes - One year prior to present Dataset Downloaded Nov 16, 2014
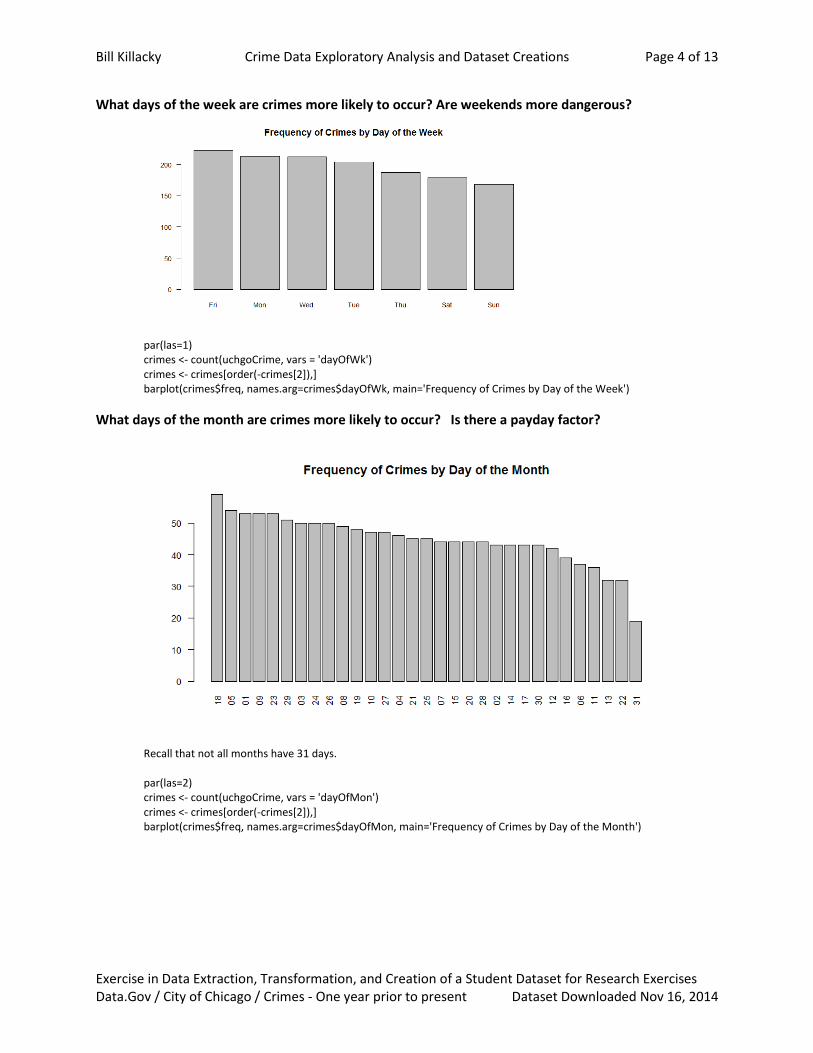
What days of the week are crimes more likely to occur? Are weekends more dangerous?
par(las=1) crimes <- count(uchgoCrime, vars = 'dayOfWk') crimes <- crimes[order(-crimes[2]),] barplot(crimes$freq, names.arg=crimes$dayOfWk, main='Frequency of Crimes by Day of the Week')
What days of the month are crimes more likely to occur? Is there a payday factor?
Recall that not all months have 31 days. par(las=2) crimes <- count(uchgoCrime, vars = 'dayOfMon') crimes <- crimes[order(-crimes[2]),] barplot(crimes$freq, names.arg=crimes$dayOfMon, main='Frequency of Crimes by Day of the Month')

Bill Killacky Crime Data Exploratory Analysis and Dataset Creations Page 5 of 13
Exercise in Data Extraction, Transformation, and Creation of a Student Dataset for Research Exercises Data.Gov / City of Chicago / Crimes - One year prior to present Dataset Downloaded Nov 16, 2014
What crimes occur in the greatest frequency?
15 crime descriptions with the highest frequency:
offenses <- count(uchgoCrime, vars=c('PRIMARY.DESCRIPTION', 'SECONDARY.DESCRIPTION')) offenses <- offenses[order(-offenses[3]),] head(offenses,15)
par(las=2) par(cex.axis=0.60) #reduce size of axis labels name <- paste(offenses$PRIMARY.DESCRIPTION, offenses$SECONDARY.DESCRIPTION, sep='\n') name <- name[1:15] barplot(offenses$freq[1:15], names.arg=name, main='Frequency of Top 15 Crimes')
PRIMARY.DESCRIPTION SECONDARY.DESCRIPTION freq
THEFT $500 AND UNDER 236
THEFT OVER $500 124
BATTERY SIMPLE 83
CRIMINAL DAMAGE TO PROPERTY 82
CRIMINAL DAMAGE TO VEHICLE 82
BURGLARY FORCIBLE ENTRY 66
MOTOR VEHICLE THEFT AUTOMOBILE 64
BURGLARY UNLAWFUL ENTRY 56
THEFT FROM BUILDING 49
ASSAULT SIMPLE 44
THEFT RETAIL THEFT 42
NARCOTICS POSS: CANNABIS 30GMS OR LESS 33
ROBBERY ARMED: HANDGUN 30
ROBBERY STRONGARM - NO WEAPON 24
CRIMINAL TRESPASS TO LAND 19

Bill Killacky Crime Data Exploratory Analysis and Dataset Creations Page 6 of 13
Exercise in Data Extraction, Transformation, and Creation of a Student Dataset for Research Exercises Data.Gov / City of Chicago / Crimes - One year prior to present Dataset Downloaded Nov 16, 2014
This is the output dataset structure. See attached file: ucCrime1yrB4-20141108.csv for your own use. The bottom (highlighted) fields were added to the original dataset from the Chicago Police. str(uchgoCrime)
'data.frame': 1385 obs. of 26 variables: $ CASE. : chr "HW526674" "HW526524" "HW526782" "HW528151" ... $ DATE..OF.OCCURRENCE : chr "11/09/2013 12:30:00 AM" "11/09/2013 12:50:00 AM" "11/09/2013 09:45:00 AM" "11/10/2013 12:10:00 PM" ... $ BLOCK : chr "060XX S EBERHART AVE" "010XX E 55TH ST" "051XX S WOODLAWN AVE" "005XX E 60TH ST" ... $ IUCR : chr "1305" "0560" "0320" "0340" ... $ PRIMARY.DESCRIPTION : chr "CRIMINAL DAMAGE" "ASSAULT" "ROBBERY" "ROBBERY" ... $ SECONDARY.DESCRIPTION: chr "CRIMINAL DEFACEMENT" "SIMPLE" "STRONGARM - NO WEAPON" "ATTEMPT: STRONGARM-NO WEAPON" ... $ LOCATION.DESCRIPTION : chr "RESIDENCE" "RESTAURANT" "SIDEWALK" "PARK PROPERTY" ... $ ARREST : chr "N" "N" "N" "N" ... $ DOMESTIC : chr "N" "N" "N" "N" ... $ BEAT : int 313 235 233 233 235 234 233 313 235 234 ... $ WARD : int 20 5 4 20 20 4 5 20 5 4 ... $ FBI.CD : chr "14" "08A" "03" "03" ... $ X.COORDINATE : int 1180593 1184088 1185054 1180658 1182641 1185522 1183092 1182494 1182938 1187435 ... $ Y.COORDINATE : int 1865070 1868709 1871380 1865380 1865336 1870329 1870498 1864776 1866306 1868879 ... $ LATITUDE : num 41.8 41.8 41.8 41.8 41.8 ... $ LONGITUDE : num -87.6 -87.6 -87.6 -87.6 -87.6 ... $ LOCATION : chr "(41.78500933171809, -87.61340715485667)" "(41.7949140369685, -87.60047939368071)" "(41.80222081605326, -87.59685320410082)" "(41.78585850714399, -87.61315931906343)" ... $ crimeTimeP : POSIXlt, format: "2013-11-09 00:30:00" "2013-11-09 00:50:00" "2013-11-09 09:45:00" "2013-11-10 12:10:00" ... $ amPM : chr "AM" "AM" "AM" "PM" ... $ dayOfWk : chr "Sat" "Sat" "Sat" "Sun" ... $ month : chr "Nov" "Nov" "Nov" "Nov" ... $ dayOfMon : chr "09" "09" "09" "10" ... $ Hr : chr "00" "00" "09" "12" ... $ Hr2 : chr "12 AM" "12 AM" "09 AM" "12 PM" ... $ TimeOfDay : chr "[9pm-midnight]" "[9pm-midnight]" "[9am-5pm]" "[9am-5pm]" ... $ Cat : chr "Other" "Thug" "Thug" "Thug" ...
Bill Killacky Crime Data Exploratory Analysis and Dataset Creations Page 7 of 13
Exercise in Data Extraction, Transformation, and Creation of a Student Dataset for Research Exercises Data.Gov / City of Chicago / Crimes - One year prior to present Dataset Downloaded Nov 16, 2014
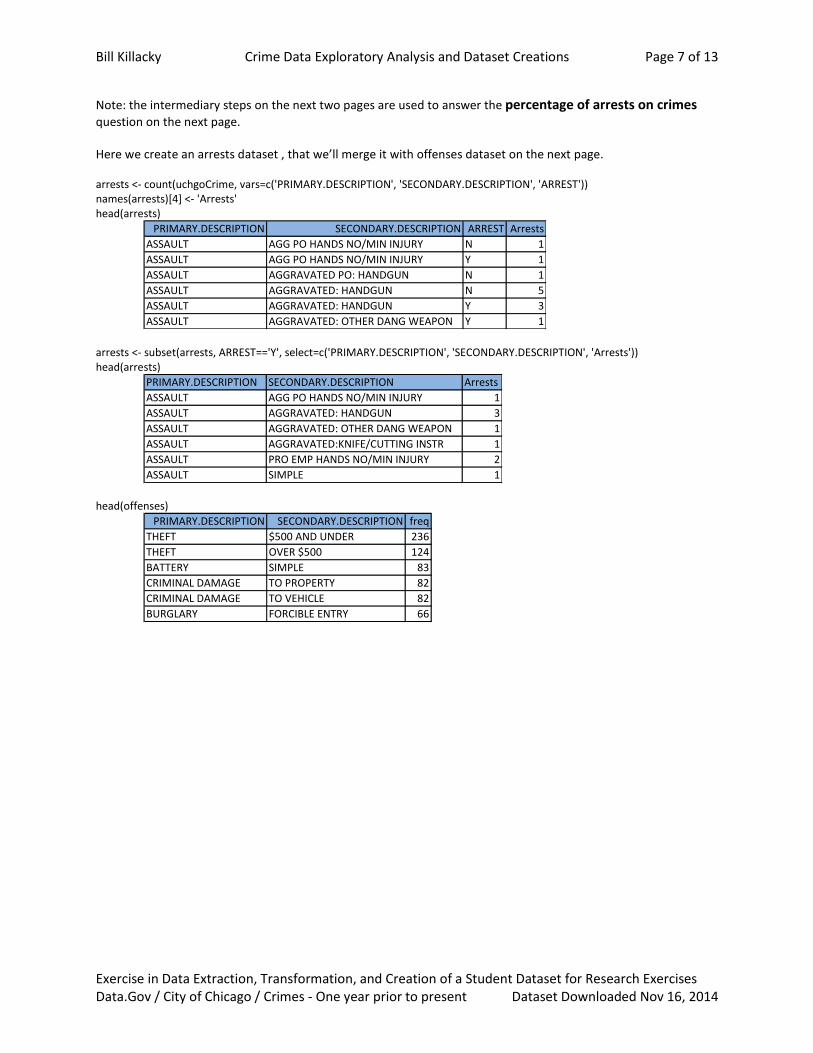
Note: the intermediary steps on the next two pages are used to answer the percentage of arrests on crimes
question on the next page. Here we create an arrests dataset , that we’ll merge it with offenses dataset on the next page. arrests <- count(uchgoCrime, vars=c('PRIMARY.DESCRIPTION', 'SECONDARY.DESCRIPTION', 'ARREST')) names(arrests)[4] <- 'Arrests' head(arrests)
arrests <- subset(arrests, ARREST=='Y', select=c('PRIMARY.DESCRIPTION', 'SECONDARY.DESCRIPTION', 'Arrests')) head(arrests)
head(offenses)
PRIMARY.DESCRIPTION SECONDARY.DESCRIPTION ARREST Arrests
ASSAULT AGG PO HANDS NO/MIN INJURY N 1
ASSAULT AGG PO HANDS NO/MIN INJURY Y 1
ASSAULT AGGRAVATED PO: HANDGUN N 1
ASSAULT AGGRAVATED: HANDGUN N 5
ASSAULT AGGRAVATED: HANDGUN Y 3
ASSAULT AGGRAVATED: OTHER DANG WEAPON Y 1
PRIMARY.DESCRIPTION SECONDARY.DESCRIPTION Arrests
ASSAULT AGG PO HANDS NO/MIN INJURY 1
ASSAULT AGGRAVATED: HANDGUN 3
ASSAULT AGGRAVATED: OTHER DANG WEAPON 1
ASSAULT AGGRAVATED:KNIFE/CUTTING INSTR 1
ASSAULT PRO EMP HANDS NO/MIN INJURY 2
ASSAULT SIMPLE 1
PRIMARY.DESCRIPTION SECONDARY.DESCRIPTION freq
THEFT $500 AND UNDER 236
THEFT OVER $500 124
BATTERY SIMPLE 83
CRIMINAL DAMAGE TO PROPERTY 82
CRIMINAL DAMAGE TO VEHICLE 82
BURGLARY FORCIBLE ENTRY 66

Bill Killacky Crime Data Exploratory Analysis and Dataset Creations Page 8 of 13
Exercise in Data Extraction, Transformation, and Creation of a Student Dataset for Research Exercises Data.Gov / City of Chicago / Crimes - One year prior to present Dataset Downloaded Nov 16, 2014
o <- merge(offenses, arrests, all.x=TRUE, by=c('PRIMARY.DESCRIPTION', 'SECONDARY.DESCRIPTION') ) head(o)
o$Arrests[is.na(o$Arrests)] <- 0 head(o)
o$Apct <- o$Arrests / o$freq o$Apct <- round((o$Apct*100), digits=0) o <- o[order(-o[3]),] head(o, 25)
What percentage of crimes resulted in an arrest? (Note: column Apct is the Arrest %)
PRIMARY.DESCRIPTION SECONDARY.DESCRIPTION freq Arrests
ASSAULT AGG PO HANDS NO/MIN INJURY 2 1
ASSAULT AGGRAVATED PO: HANDGUN 1 NA
ASSAULT AGGRAVATED: HANDGUN 8 3
ASSAULT AGGRAVATED: OTHER DANG WEAPON 1 1
ASSAULT AGGRAVATED:KNIFE/CUTTING INSTR 1 1
ASSAULT PRO EMP HANDS NO/MIN INJURY 8 2
PRIMARY.DESCRIPTION SECONDARY.DESCRIPTION freq Arrests
ASSAULT AGG PO HANDS NO/MIN INJURY 2 1
ASSAULT AGGRAVATED PO: HANDGUN 1 0
ASSAULT AGGRAVATED: HANDGUN 8 3
ASSAULT AGGRAVATED: OTHER DANG WEAPON 1 1
ASSAULT AGGRAVATED:KNIFE/CUTTING INSTR 1 1
ASSAULT PRO EMP HANDS NO/MIN INJURY 8 2
PRIMARY.DESCRIPTION SECONDARY.DESCRIPTION freq Arrests Apct
THEFT $500 AND UNDER 236 6 3
THEFT OVER $500 124 3 2
BATTERY SIMPLE 83 16 19
CRIMINAL DAMAGE TO PROPERTY 82 2 2
CRIMINAL DAMAGE TO VEHICLE 82 2 2
BURGLARY FORCIBLE ENTRY 66 1 2
MOTOR VEHICLE THEFT AUTOMOBILE 64 4 6
BURGLARY UNLAWFUL ENTRY 56 1 2
THEFT FROM BUILDING 49 2 4
ASSAULT SIMPLE 44 1 2
THEFT RETAIL THEFT 42 36 86
NARCOTICS POSS: CANNABIS 30GMS OR LESS 33 32 97
ROBBERY ARMED: HANDGUN 30 2 7
ROBBERY STRONGARM - NO WEAPON 24 1 4
CRIMINAL TRESPASS TO LAND 19 15 79
DECEPTIVE PRACTICE FINANCIAL IDENTITY THEFT OVER $ 300 19 0 0
OTHER OFFENSE TELEPHONE THREAT 19 0 0
DECEPTIVE PRACTICE CREDIT CARD FRAUD 16 0 0
OTHER OFFENSE HARASSMENT BY TELEPHONE 15 1 7
DECEPTIVE PRACTICE ILLEGAL USE CASH CARD 13 0 0
BATTERY DOMESTIC BATTERY SIMPLE 12 5 42
THEFT POCKET-PICKING 11 0 0
DECEPTIVE PRACTICE FRAUD OR CONFIDENCE GAME 10 0 0
ROBBERY AGGRAVATED 9 2 22
THEFT FINANCIAL ID THEFT: OVER $300 9 2 22

Bill Killacky Crime Data Exploratory Analysis and Dataset Creations Page 9 of 13
Exercise in Data Extraction, Transformation, and Creation of a Student Dataset for Research Exercises Data.Gov / City of Chicago / Crimes - One year prior to present Dataset Downloaded Nov 16, 2014
What locations are crimes more likely to occur? Where not to park my car, or stroll past.
Worst 30 Campus Blocks for Category of Crime
# Worst blocks by Category of crime campus <- subset(uchgoCrime, BEAT == 235) crimes <- count(campus, vars=c('BLOCK', 'Cat')) crimes <- crimes[order(-crimes[3]),] head(crimes, 30)
Worst 30 Campus Blocks for Crime
# Worst blocks of crime campus <- subset(uchgoCrime, BEAT == 235) crimes <- count(campus, vars='BLOCK') crimes <- crimes[order(-crimes[2]),] head(crimes, 30)
BLOCK Cat freq
058XX S MARYLAND AVE Thief 24
056XX S UNIVERSITY AVE Thief 8
060XX S COTTAGE GROVE AVE Thief 6
057XX S UNIVERSITY AVE Thief 5
058XX S MARYLAND AVE Thug 5
013XX E 56TH ST Thief 4
013XX E 57TH ST Thief 4
057XX S MARYLAND AVE Thief 4
060XX S COTTAGE GROVE AVE Car 4
013XX E 57TH ST Other 3
014XX E 55TH ST Other 3
014XX E 55TH ST Thief 3
015XX E 57TH ST Thief 3
055XX S HARPER AVE Thief 3
057XX S KIMBARK AVE Thief 3
057XX S WOODLAWN AVE Thief 3
058XX S MARYLAND AVE Other 3
060XX S COTTAGE GROVE AVE Thug 3
009XX E 58TH ST Other 2
009XX E 60TH ST Other 2
011XX E 56TH ST Other 2
012XX E 55TH ST Other 2
013XX E 56TH ST Thug 2
014XX E 55TH PL Other 2
014XX E 55TH PL Thug 2
015XX E 59TH ST Thief 2
055XX S KENWOOD AVE Car 2
056XX S DORCHESTER AVE Other 2
056XX S HARPER AVE Thief 2
056XX S KIMBARK AVE Thug 2
BLOCK freq
058XX S MARYLAND AVE 32
060XX S COTTAGE GROVE AVE 14
056XX S UNIVERSITY AVE 12
057XX S MARYLAND AVE 9
013XX E 57TH ST 8
013XX E 56TH ST 6
014XX E 55TH PL 6
014XX E 55TH ST 6
057XX S KIMBARK AVE 5
057XX S UNIVERSITY AVE 5
011XX E 56TH ST 4
012XX E 55TH ST 4
015XX E 57TH ST 4
055XX S HARPER AVE 4
056XX S DORCHESTER AVE 4
057XX S HARPER AVE 4
008XX E 61ST ST 3
009XX E 58TH ST 3
009XX E 60TH ST 3
055XX S DORCHESTER AVE 3
055XX S KIMBARK AVE 3
055XX S WOODLAWN AVE 3
056XX S BLACKSTONE AVE 3
056XX S HARPER AVE 3
056XX S KIMBARK AVE 3
056XX S LAKE PARK AVE 3
057XX S WOODLAWN AVE 3
058XX S BLACKSTONE AVE 3
058XX S ELLIS AVE 3
058XX S WOODLAWN AVE 3

Bill Killacky Crime Data Exploratory Analysis and Dataset Creations Page 10 of 13
Exercise in Data Extraction, Transformation, and Creation of a Student Dataset for Research Exercises Data.Gov / City of Chicago / Crimes - One year prior to present Dataset Downloaded Nov 16, 2014
Create a csv file for importing into Google Fusion for interactive mapping purposes: map <- with(uchgoCrime, data.frame(BEAT, WARD, BLOCK, LOCATION, PRIMARY.DESCRIPTION, SECONDARY.DESCRIPTION, LOCATION.DESCRIPTION) ) write.csv(map, file="uchgCrimeMap.csv")
Feature map format of waypoints of crime locations:
Heatmap format of crime locations:

Bill Killacky Crime Data Exploratory Analysis and Dataset Creations Page 11 of 13
Exercise in Data Extraction, Transformation, and Creation of a Student Dataset for Research Exercises Data.Gov / City of Chicago / Crimes - One year prior to present Dataset Downloaded Nov 16, 2014
Crime waypoints for BEAT 235:
Zoomed in Crime waypoints for BEAT 235:

Bill Killacky Crime Data Exploratory Analysis and Dataset Creations Page 12 of 13
Exercise in Data Extraction, Transformation, and Creation of a Student Dataset for Research Exercises Data.Gov / City of Chicago / Crimes - One year prior to present Dataset Downloaded Nov 16, 2014
Interactive map instructions
Go to this site: https://www.google.com/fusiontables/DataSource?docid=1J7rXOPK6KW7_-7Q5-AVz278okjkrHSpgGAgxmr9_
Choose the Map 1 tab
Hit the to select BEAT and set the value range to 235 – 235 and hit [Find] as illustrated below:
o
Hit the to further select Cat, TimeOfDay, PRIMARY.DESCRIPTION, and SECONDARY.DESCRIPTION as below:

Bill Killacky Crime Data Exploratory Analysis and Dataset Creations Page 13 of 13
Exercise in Data Extraction, Transformation, and Creation of a Student Dataset for Research Exercises Data.Gov / City of Chicago / Crimes - One year prior to present Dataset Downloaded Nov 16, 2014
Here is an example with filters set to BEAT 235, Cat=Car, TimeOfDay=[9am-5pm].
Note there are 12 matches indicating either criminal damage to a car or theft of a car on campus between work hours.
Recall that this is interactive, so zoom, change filter values, and change filters.
Click a check mark on and off…
This is an excellent way to answer location questions for different types of crimes.


