Embed Size (px)
Citation preview

Volume 34, No. 4, May 31, 2005
Conroy ChinoConroy ChinoConroy ChinoConroy ChinoConroy ChinoSecretarySecretarySecretarySecretarySecretary
Prepared by Economic Research and AnalysisP.O. Box 1928, Albuquerque, N.M. 87103Ph: (505) 841-8645
Bill RichardsonBill RichardsonBill RichardsonBill RichardsonBill RichardsonGovernorGovernorGovernorGovernorGovernor
HIGHLIGHTS � April 2005
LLLLLaborMMMMMarketRRRRReport
New MexicoNew MexicoNew MexicoNew MexicoNew Mexico
www.dol.state.nm.us
NM & MSA Highlights
Page 2 - 6
NM Occupational
Shortages & Surpluses
Page 7
NM Household Data HistoryPage 8
Total Nonfarm Growth
NM Ranking
Page 8
NM Labor Force Estimates
Page 9
Unemployment Rate Rankings
by County and State
Page 10 & 11
Nonfarm Employment:
State & MSAsPage 12-16
Average Hours & Earnings
& US Consumer Price Index
Page 17
NM Unemployment Insurance
Page 17
NM Economic Activity by AreaPage 18-19
IIIIINSIDE
Current Regional Nonfarm Employment Growth
April 2005 over April 2004 - Not Seasonally Adjusted
6.4%
3.8%3.5%
1.9% 1.9% 1.9% 1.8% 1.8% 1.7%1.2%
0.0%
1.0%
2.0%
3.0%
4.0%
5.0%
6.0%
7.0%
NV AZ UT CO OK WY CA NM US TX
Gro
wth U
.S. A
vera
ge
...New Mexico�s over-the-year rate of job growth came in at a moderate 1.8 percent.
...In the last 12 months, employment in the Albuquerque MSA has grown 1.6 percent,decelerating from its most recent peak of 2.8 percent in November 2004.
...The rate of over-the-year job growth for the Las Cruces MSA was 2.1 percent. TheLas Cruces area has added 1,300 jobs over the year.
...Over-the-year job growth for the Santa Fe MSA was 1.7 percent, adding 1,000 jobs.
...Over the year Farmington has added jobs at a faster rate then any other metropoli-tan area in NM. Job growth for Farmington has been a strong 3.4 percent, adding1,600 jobs.

-2-
New Mexico Labor Force and Payroll Employment
New Mexico Prel. Revised Change FromSeasonally Adjusted Apr 2005 Mar 2005 Apr 2004 Mar 2005 Apr 2004Civilian Labor Force 941,700 935,200 910,400 +6,500 +31,300Employment 885,000 880,000 857,900 +5,000 +27,100Unemployment 56,700 55,200 52,500 +1,500 +4,200Rate 6.0% 5.9% 5.8%Rate (not seasonally adjusted) 5.8% 5.9% 5.6%
New Mexico�s seasonally adjusted unemployment rate was6.0 percent in April 2005, little changed from the March rateof 5.9 percent. Recent increases in the unemployment ratehave wiped out the gains that were made during 2004. A yearago New Mexico�s unemployment rate was lower, at 5.8 per-cent. Prior to April, the rate had not reached 6.0 percent sinceJanuary 1999. The national unemployment rate was 5.2 per-cent in April 2005.
New Mexico�s over-the-year rate of job growth came in at 1.8percent, which is in the moderate range. The job growthnumber compares the latest month with the same month a yearago. In this case, the year-ago number for April 2004 was thestrongest in recent history (2.3 percent). So our current rate ofjob growth shows a 1.8 percent improvement on top of lastyear�s strong number � a fairly good showing. Many otherstates have started to add jobs from last year�s base that in-cluded massive job losses. Therefore, in recent months theirrate of job growth has surpassed New Mexico�s rate. The statenow ranks 14th nationally.
The state has added 14,600 jobs since last year. Three of thelarger industries have added almost 11,000 jobs between them.Those industries are government, health services, and con-struction. Looking at percentage growth since last year, thesmaller mining industry comes in first with a growth rate of 8.8percent. In second and third place respectively are the muchlarger construction and health services industries. Six indus-tries have either lost jobs over the year or have only added asmall number of jobs.
The mining industry has added 1,300 jobs since last year. Thisindustry continues to do well from sustained higher prices foroil and natural gas as well as a rebound in copper mining.Construction employment grew by 3,200 with increases in allthe industry groups, including residential construction, pub-lic works, and commercial construction.
The state�s largest private industry, educational and healthservices, has grown 3.6 percent, adding 3,700 jobs. This is afairly modest growth rate compared to recent history, due tothe end of the Medicaid-driven surge in home health careemployment. Financial activities employment added 900 jobs,
from gains that were mostly in the finance and insurancecategory. Job growth in the professional and business ser-vices industry dropped to 2.0 percent (adding 1,800 jobs),which is still fairly strong but no longer building upon weakyear-ago employment.
Government employment increased 1.9 percent, adding 3,900jobs in a year, mostly from a very strong local governmentsector that includes Indian tribes and their casinos. Stategovernment has also increased but federal government haslost jobs. The miscellaneous other services category added500 jobs, growing 1.8 percent.
Four industries reported employment levels lower than a yearago. The information industry has suffered a series of joblosses in the telecommunications component of the industry.The industry remains down 700 jobs but has made a few gainsnow that New Mexico�s aspiring film industry appears to beexpanding. The employment survey has difficulty measur-ing employment of movie extras because of the short durationof the work and the out-of-state companies that do the hiring.When the data become available, it is likely that informationemployment will be revised upward to reflect filming activ-ity.
Minor job losses also came from transportation, warehousingand utilities, which was down 100 jobs since last year. Whole-sale trade employment was down by 300 jobs from last year.Manufacturing employment was also down 300 jobs from ayear ago, with some weakness in electronic products.
The leisure and hospitality industry made unremarkable gainsof 0.4 percent, adding just 300 jobs and showing little expan-sion from eating and drinking places. Retail trade employ-ment was also restrained, increasing by just 400 jobs, likelyreflecting big box efficiency trends in a market that is increas-ingly dominated by large retailers and a shrinking number ofspecialty retailers.

-3-
(Bernalillo, Sandoval, Torrance & Valencia Counties)
Albuquerque MSA Labor Force and Payroll Employment
Albuquerque Prel. Revised Change FromSeasonally Adjusted Apr 2005 Mar 2005 Apr 2004 Mar 2005 Apr 2004Civilian Labor Force 403,600 400,300 392,300 +3,300 +11,300Employment 380,500 378,000 371,500 +2,500 +9,000Unemployment 23,100 22,300 20,800 +800 +2,300Rate 5.7% 5.6% 5.3%Rate (not seasonally adjusted) 5.3% 5.4% 5.0%
Seasonally adjusted unemployment in the Albuquerque MSA was5.7 percent in April 2005, up slightly from 5.6 percent in March.A year ago, the unemployment rate was 5.3 percent.
Payroll employment rose 0.5 percent over the month, adding1,700 new jobs to the Albuquerque area economy. Employmentincreases are typical this time of year when construction andtourism begin to pick up. Leisure and hospitality grew by a strong3.7 percent or 1,300 jobs, reflecting a seasonal increase in tourist-related businesses like food services and accommodation. Con-struction also did well in April, adding 500 jobs for growth of 1.9percent. Professional and business services rose 0.5 percent (300jobs), aided by a seasonal increase in temporary help. Wholesaletrade gained 100 jobs, as did the transportation, warehousing, andutilities sector. Four industries posted over-the-month declines of100-200, while employment in three others remained at last month�slevels.
In the last 12 months, employment in the Albuquerque MSA hasgrown 1.6 percent, decelerating from its most recent peak of 2.8percent in November 2004. Construction growth remained ex-ceptionally vibrant at 8.4 percent, with no hint of slowing downanytime soon. New housing developments are springing up al-most overnight in Rio Rancho and on Albuquerque�s west side,driven by continued low interest rates and population growth.Still, mortgage rates are bound to increase eventually, reducingthe demand for new homes and causing building activity to slow.The question is not if, but rather when, this will happen.
Growth in educational and health services continued to be robustat 4.6 percent or 2,100 over the year. Most of the increase was inthe health care and social assistance component, with privateeducation accounting for only 200 of the new jobs. The healthservices industry plays a strong role in the Albuquerque employ-ment picture, remaining steady even when other segments of theeconomy falter. This industry has not experienced an over-the-year decline since the latest payroll employment series began in1990.
Government employment grew by 1,700 or 2.3 percent, despite adecline of 200 in the federal branch. Local government added1,500 new jobs, accounting for the bulk of the increase, whilestate government added 400.
Professional and business services rose by 900 in the past 12months for growth of 1.5 percent. The majority of the increasecame from business support services, which includes the rapidly
expanding arena of telephone call centers. Scientific research anddevelopment also grew, adding 200 new jobs.
With an over-the-year increase of 1.2 percent, retail trade growthwas not as strong as in recent months. Industry growth reached 2.6percent in July 2004 but has gradually diminished since then. Allof the 500 new jobs were in unpublished components such asmotor vehicle dealers, electronic stores, and sporting goods stores.Employment in general merchandise stores, which includes largediscounters like Wal-Mart and Target, was stagnant both over themonth and over the year. However, with construction underwayon several big box stores, employment will begin to rise again inthe coming months.
An increase of 300 in financial activities was largely due toexpansions in industry-related call centers, especially in the RioRancho area. The miscellaneous category of other services gained100 jobs over the year.
Manufacturing posted a disappointing loss of 200 jobs, its firstover-the-year decline since last December. Thankfully, this shouldbe just a temporary occurrence and not an indication of anotherdownward trend. Upcoming expansions in aircraft manufacturingshould put employment back on track before long, though it willnever again reach the peak levels that were attained in the lastdecade.
Leisure and hospitality employment was down by 200, its fourthover-the-year decline in as many months. Job losses were concen-trated in eating and drinking places. Following a flood of newrestaurants during the last couple of years, it appears that thisindustry is pausing to let demand catch up with supply before itstarts to expand once again.
Wholesale trade continued on its downward slide, losing 400 jobssince last April. This industry has not experienced an over-the-year increase since early 2001. Job growth has been hindered bytechnological improvements that made the work less labor inten-sive, as well as long-term declines in manufacturing activity.
Information was down 1,000, the only industry to lose a largenumber of jobs over the year. The losses were caused by a series ofdifficulties in the telecommunications portion of the industry,including last year�s closure of the MCI call center. The onlyother industry to decline over the year was transportation, ware-housing, and utilities, down 100 jobs.

-4-
(Doña Ana County)
Las Cruces MSA Labor Force and Payroll Employment
Annual Nonfarm Job Growth Rates - NM and Las Cruces
Las Cruces Prel. Revised Change FromSeasonally Adjusted Apr 2005 Mar 2005 Apr 2004 Mar 2005 Apr 2004Civilian Labor Force 84,700 84,300 82,300 +400 +2,400Employment 79,100 78,900 77,000 +200 +2,100Unemployment 5,600 5,400 5,300 +200 +300Rate 6.6% 6.4% 6.4%Rate (not seasonally adjusted) 6.9% 7.0% 6.6%
The seasonally adjusted unemployment rate in the Las CrucesMSA was 6.6 percent in April 2005, up a little from March'srate of 6.4 percent. A year ago the area's unemployment ratewas 6.4 percent.
The Las Cruces area added 300 jobs in April 2005, with gainsof 100 jobs in each of four industries and the loss of 100 jobs inmanufacturing. The industries gaining jobs this month wereconstruction, financial activities, professional & business ser-vices, and leisure & hospitality.
The rate of over-the-year job growth for the Las Cruces areawas 2.1 percent comparing April 2005 with the same month ayear ago. The Las Cruces area has added 1,300 jobs over theyear. This rate of job growth is close to the statewide average,but still lower than the Las Cruces area has come to expect.
The industry gaining the greatest number of new jobs over thelast year was the relatively large educational and health ser-vices industry, adding 400 jobs and increasing 4.5 percent.The health services component enjoyed rapid growth for manyyears until fierce competition between rival hospitals over-heated the industry and the job count eventually declined.Now this industry is once again adding a fair number of newjobs.
Construction employment also appears to be doing well inthe Las Cruces area, making gains of 5.1 percent over the year,adding 200 jobs. The construction boom is also happening inmost other parts of the state as well.
Manufacturing employment has done very well in the area forthe last two and a half years, particularly in the Santa TeresaIndustrial Park. The area has held on to the significant jobgains already made, but the number of new jobs added hasslowed down to just 100 over the last year.
Six other industries have also gained 100 jobs each over thelast year. Both wholesale trade and retail trade added 100jobs each. The transportation, warehousing and utilities in-dustry gained 100 jobs, growing 6.2 percent. Informationemployment posted a 100-job gain now that the job losses inthe telecommunications component of the industry are out ofthe year-ago comparison. The gain of another 100 jobs wasreported in financial activities, as well as a similar employ-ment gain for the leisure and hospitality industry.
The miscellaneous other services category of employmenthas failed to grow. The same was also true for the professionaland business services industry and the large government sec-tor. The loss of 200 federal jobs and 100 state governmentjobs cancelled out the gain of 300 local government jobs.
-1.0%
0.0%
1.0%
2.0%
3.0%
4.0%
5.0%
6.0%
Jan-
00
Apr
-00
Jul-0
0
Oct
-00
Jan-
01
Apr
-01
Jul-0
1
Oct
-01
Jan-
02
Apr
-02
Jul-0
2
Oct
-02
Jan-
03
Apr
-03
Jul-0
3
Oct
-03
Jan-
04
Apr
-04
Jul-0
4
Oct
-04
Jan-
05
Apr
-05
New MexicoLas Cruces

-5-
(Santa Fe County)
Santa Fe MSA Labor Force and Payroll Employment
Annual Nonfarm Job Growth Rates - NM and Santa Fe
Santa Fe Prel. Revised Change FromSeasonally Adjusted Apr 2005 Mar 2005 Apr 2004 Mar 2005 Apr 2004Civilian Labor Force 79,200 78,200 76,200 +1,000 +3,000Employment 75,400 74,700 72,800 +700 +2,600Unemployment 3,800 3,500 3,400 +300 +400Rate 4.8% 4.5% 4.5%Rate (not seasonally adjusted) 4.5% 4.5% 4.2%
The seasonally adjusted unemployment rate in Santa Fe was4.8 percent in April 2005, up from the March rate of 4.5percent. A year ago, the area had an unemployment rate of 4.5percent, which was lower than the current rate.
Santa Fe added 400 jobs in April, following another 400-jobgain in March. In April four industries gained jobs and oneindustry lost jobs. Leisure and hospitality added 200 jobs;construction, retail trade, and government each added 100jobs; and education and health services lost 100 jobs.
Over-the-year job growth for Santa Fe was 1.7 percent, adding1,000 jobs. The Santa Fe job market continues to make gainsin only four of the 12 industries, leaving seven others withemployment levels that are unchanged from last year, and oneindustry that has lost jobs.
Almost all of the job gains came from local government, up800 jobs on the year, growing 12.5 percent. These gains havecome mostly from employment in local school districts. Thegains are due to increased enrollment as well as more accuratereporting of teaching jobs. State and federal governmentemployment remains at the same level as last year.
In the private sector, educational and health services added200 jobs, growing 2.4 percent. The professional and businessservices industry added 200 jobs since last year, growing 4.0percent. This industry has done well in Santa Fe for about twoyears. The strength appears to be across the board, rather thanin any individual component. Financial activities posted a100-job gain.
The construction industry lost 300 jobs, the worst this indus-try has done in more than two years. The absence of anyconstruction employment gains makes Santa Fe an exceptionto the housing boom in other parts of the state.
All other industries remain at last year's employment levels.These industries were manufacturing; retail trade; wholesaletrade; transportation, warehousing & utilities; information;leisure and hospitality; and other services. Earlier in the yearleisure and hospitality employment had made gains during asuccessful ski season, but the industry has settled back whilegetting ready for the summer season.
-0.5%
0.0%
0.5%
1.0%
1.5%
2.0%
2.5%
3.0%
3.5%
4.0%
Jan-
00
Apr
-00
Jul-0
0
Oct
-00
Jan-
01
Apr
-01
Jul-0
1
Oct
-01
Jan-
02
Apr
-02
Jul-0
2
Oct
-02
Jan-
03
Apr
-03
Jul-0
3
Oct
-03
Jan-
04
Apr
-04
Jul-0
4
Oct
-04
Jan-
05
Apr
-05
New MexicoSanta Fe

-6-
(San Juan County)
Farmington MSA Labor Force and Payroll Employment
Annual Nonfarm Job Growth Rates - NM and Farmington
Farmington Prel. Revised Change FromSeasonally Adjusted Apr 2005 Mar 2005 Apr 2004 Mar 2005 Apr 2004Civilian Labor Force 56,400 56,200 53,400 +200 +3,000Employment 52,700 52,700 50,100 0 +2,600Unemployment 3,700 3,500 3,300 +200 +400Rate 6.6% 6.2% 6.2%Rate (not seasonally adjusted) 5.8% 6.0% 5.7%
The seasonally adjusted unemployment rate in Farmingtonwas 6.6 percent in April 2005, up from March's rate of 6.2percent. A year ago, the area had an unemployment rate of 6.2percent.
The Farmington area added 200 jobs in April, following gainsof 900 jobs in March and 800 jobs in February. April saw thecombined loss of 200 jobs in goods-producing industries anda gain of 400 jobs in private service-providing industries.Government employment was unchanged.
Over the last year, Farmington has added jobs at a faster ratethan any other metropolitan area in the state. Job growth forFarmington has been a strong 3.4 percent, adding 1,600 jobs.The current boom peaked last month (in March) when theover-the-year rate of job growth reached 4.9 percent. This wasthe fastest increase in jobs since mid-1995.
The area's employment boom is from strong growth in the oil andgas industry, and construction activity on the oil pipeline. Muchof the work on the pipeline ended in March and some workers werelaid off. This moderated the strong employment growth a little.
The strong job market is entirely driven by the private sector.Government employment remains at last year's levels. The mainsources of private sector strength have been the goods-producingindustries of mining and construction. The area's large miningindustry has done very well recently from sustained higher pricesfor oil and natural gas. Private services providing industries arealso doing well in the area, adding 1,100 jobs over the year,growing 4.2 percent.
-2.0%
-1.0%
0.0%
1.0%
2.0%
3.0%
4.0%
5.0%
6.0%
Jan-
00
Apr
-00
Jul-0
0
Oct
-00
Jan-
01
Apr
-01
Jul-0
1
Oct
-01
Jan-
02
Apr
-02
Jul-0
2
Oct
-02
Jan-
03
Apr
-03
Jul-0
3
Oct
-03
Jan-
04
Apr
-04
Jul-0
4
Oct
-04
Jan-
05
Apr
-05
New MexicoFarmington

-7-
New Mexico Occupational Shortages & Surpluses
APPLICANTS JOB OPENINGS PROJECTED MOST OPENINGSOffice Clerks, General Construction Laborers Retail SalespersonsCashiers Cashiers CashiersConstruction Laborers Sales Reps, Services, All Other Waiters and WaitressesOffice & Admin. Support Workers Electricians Combined Food Prep & Srvg. WorkersCustomer Service Representatives Customer Service Representatives Registered NursesExec. Secretaries & Admin. Assistants Truck Drivers, Heavy General and Operations ManagersReceptionists and Information Clerks Security Guards Janitors and CleanersRetail Salespersons Maids and Housekeeping Cleaners Office Clerks, GeneralProduction Workers, Helpers Grounds Maintenance Workers Customer Service RepresentativesAgricultural Workers, All Other Retail Salespersons Farmworkers & Laborers
APPLICANTS JOB OPENINGS PROJECTED MOST OPENINGSCustomer Service Representatives Stock Clerks Retail SalespersonsOffice Clerks, General Security Guards CashiersExec. Secretaries & Admin. Assistants Cashiers Waiters and WaitressesOffice & Admin. Support Workers Correctional Officers and Jailers Combined Food Prep & Srvg. WorkersStock Clerks Grounds Maintenance Workers Customer Service RepresentativesCashiers Janitors and Cleaners Registered NursesReceptionists and Information Clerks Construction Laborers General and Operations ManagersAdministrative Services Managers Customer Service Representatives Office Clerks, GeneralConstruction Laborers Sales Reps, Services, All Other Janitors and CleanersGeneral Managers Production Workers, Helpers Security Guards
APPLICANTS JOB OPENINGS PROJECTED MOST OPENINGSCashiers Retail Salespersons Retail SalespersonsOffice Clerks, General Maids and Housekeeping Cleaners Waiters and WaitressesConstruction Laborers Construction Laborers CashiersOffice & Admin. Support Workers Sup/Mgrs. of Lab. & Mtrl. Movers, Hand Combined Food Prep & Srvg. WorkersMaintenance & Repair Workers Lawyers Maids and Housekeeping CleanersManagers, All Other Security Guards General and Operations ManagersExec. Secretaries & Admin. Assistants Landscaping & Grndskping. Workers Police and Sheriff's Patrol OfficersJanitors & Cleaners Cashiers Registered NursesElectricians Home Health Aides Janitors and CleanersReceptionists and Information Clerks Laborers, Freight, Stock, Mtrl. Movers Office Clerks, General
APPLICANTS JOB OPENINGS PROJECTED MOST OPENINGSOffice Clerks, General Combined Food Prep & Srvg. Workers Farmworkers & LaborersCashiers Production Workers, Helpers Waiters and WaitressesRetail Salespersons Laborers, Freight, Stock, Mtrl. Movers CashiersReceptionists and Information Clerks Construction Laborers Combined Food Prep & Srvg. WorkersConstruction Laborers Production, Planning Clerks Retail SalespersonsHome Health Aides Telemarketers Registered NursesExec. Secretaries & Admin. Assistants Retail Salespersons Elementary School TeachersBkping., Accounting, & Auditing Clerks Landscaping & Grndskping. Workers Teacher AssistantsSecretaries Bus Drivers, School General and Operations ManagersOffice & Admin. Support Workers Security Guards Janitors and Cleaners
APPLICANTS JOB OPENINGS PROJECTED MOST OPENINGSOffice Clerks, General Construction Laborers CashiersReceptionists and Information Clerks Retail Salespersons Retail SalespersonsConstruction Laborers Landscaping & Grndskping. Workers Waiters and WaitressesCashiers Sup/Mgrs. Of Const. & Extraction Wkrs. Combined Food Prep & Srvg. WorkersOffice & Admin. Support Workers Electricians Registered NursesExec. Secretaries & Admin. Assistants Material Moving Workers, All Other Truck Drivers, Heavy & Tractor-TrailerElectricians Agricultural Workers, All Other General and Operations ManagersOperating Engineers Cleaners of Vehicles & Equipment Janitors and CleanersTruck Drivers, Heavy Truck Drivers, Heavy Teacher AssistantsCustomer Service Representatives Sup/Mgrs. of Lab. & Mtrl. Movers, Hand Receptionists and Information Clerks
Farmington Workforce Development Center
Las Cruces Workforce Development Center
Albuquerque Workforce Development Center
Santa Fe Workforcement Development Center
New Mexico

-8-
New Mexico � Seasonally Adjusted
Labor Force, Employment, Unemployment, & Unemployment Rate
Total Nonfarm Employment Growth Rankings
New Mexico and United States
April April %State Rank 2004 2005 Change ChangeNevada 1 1,140.4 1,213.7 73.3 6.4%Arizona 2 2,371.9 2,463.0 91.1 3.8%Utah 3 1,099.1 1,137.1 38.0 3.5%Oregon 4 1,580.4 1,633.1 52.7 3.3%Hawaii 5 577.9 595.9 18.0 3.1%Florida 6 7,522.2 7,741.0 218.8 2.9%Idaho 7 581.6 598.1 16.5 2.8%DC 8 418.6 428.9 10.3 2.5%Maryland 9 2,500.3 2,554.7 54.4 2.2%Washington 10 2,683.9 2,737.2 53.3 2.0%Colorado 11 2,166.3 2,208.0 41.7 1.9%Wyoming 12 250.7 255.5 4.8 1.9%Oklahoma 13 1,472.9 1,500.2 27.3 1.9%New Mexico 14 790.0 804.6 14.6 1.8%California 15 14,465.8 14,719.1 253.3 1.8%Alabama 16 1,898.1 1,931.3 33.2 1.7%United States 131,150.0 133,374.0 2,224.0 1.7%South Dakota 17 380.4 386.8 6.4 1.7%Virginia 18 3,567.4 3,626.6 59.2 1.7%New Jersey 19 3,970.7 4,035.7 65.0 1.6%North Dakota 20 337.1 342.6 5.5 1.6%North Carolina 21 3,818.9 3,879.0 60.1 1.6%Nebraska 22 920.4 933.7 13.3 1.4%Alaska 23 295.2 299.3 4.1 1.4%New Hampshire 24 620.7 629.0 8.3 1.3%Kansas 25 1,328.2 1,345.8 17.6 1.3%Connecticut 26 1,645.9 1,667.2 21.3 1.3%Indiana 27 2,933.9 2,971.3 37.4 1.3%Texas 28 9,477.0 9,593.6 116.6 1.2%Rhode Island 29 485.7 491.5 5.8 1.2%Arkansas 30 1,157.7 1,171.5 13.8 1.2%Vermont 31 299.8 303.3 3.5 1.2%Montana 32 409.0 413.7 4.7 1.1%Pennsylvania 33 5,634.0 5,695.4 61.4 1.1%Delaware 34 673.8 681.0 7.2 1.1%New York 35 8,390.8 8,479.0 88.2 1.1%Kentucky 36 1,798.0 1,816.3 18.3 1.0%Mississippi 37 1,129.9 1,140.9 11.0 1.0%Wisconsin 38 2,783.7 2,810.3 26.6 1.0%Iowa 39 1,460.0 1,473.9 13.9 1.0%Minnesota 40 2,668.5 2,693.5 25.0 0.9%Tennessee 41 2,702.8 2,728.1 25.3 0.9%Maine 42 604.4 608.7 4.3 0.7%Missouri 43 2,707.0 2,725.1 18.1 0.7%Illinois 44 5,787.5 5,825.4 37.9 0.7%Massachusetts 45 3,172.3 3,193.0 20.7 0.7%West Virginia 46 736.9 741.0 4.1 0.6%Georgia 47 3,891.2 3,907.1 15.9 0.4%Ohio 48 5,394.8 5,414.7 19.9 0.4%Louisiana 49 1,928.4 1,934.2 5.8 0.3%South Carolina 50 1,834.9 1,827.8 -7.1 -0.4%Michigan 51 4,394.3 4,361.3 -33.0 -0.8%Source: U.S. Department of Labor, Bureau of Labor Statistics
Employment numbers are not seasonally adjusted.
Employment numbers are in thousands.
Civilian Un- Unadj.Labor Employ- Employ- Rate RateForce ment ment % %
1985 649,300 593,000 56,300 8.7%1986 667,200 605,800 61,400 9.2%1987 674,200 613,400 60,800 9.0%1988 682,000 630,300 51,700 7.6%1989 691,800 645,300 46,500 6.7%1990 711,900 663,700 48,200 6.8%1991 719,200 667,700 51,500 7.2%1992 735,500 680,500 55,000 7.5%1993 755,100 700,300 54,800 7.3%1994 776,800 725,400 51,400 6.6%1995 798,700 744,600 54,100 6.8%1996 812,800 751,800 61,000 7.5%1997 822,600 768,600 54,000 6.6%1998 835,900 783,700 52,200 6.2%1999 840,000 793,100 46,900 5.6%2000 850,800 808,500 42,300 5.0%2001 861,600 819,400 42,200 4.9%2002 875,400 827,500 47,900 5.5%2003 893,400 840,900 52,500 5.9%2004 912,000 860,000 52,000 5.7%
2004 JAN 903,800 850,800 53,000 5.9% 6.1%FEB 905,800 853,000 52,800 5.8% 5.9%MAR 907,500 854,900 52,600 5.8% 5.9%APR 910,400 857,900 52,500 5.8% 5.6%MAY 910,800 858,600 52,200 5.7% 5.6%JUN 911,000 859,000 52,000 5.7% 6.5%JUL 912,200 860,400 51,800 5.7% 6.0%AUG 912,600 861,000 51,600 5.7% 5.6%SEP 914,400 862,900 51,500 5.6% 5.5%OCT 916,900 865,500 51,300 5.6% 5.3%NOV 918,300 867,100 51,200 5.6% 5.2%DEC 919,500 868,400 51,100 5.6% 5.1%
2005 JAN 922,000 873,500 48,500 5.3% 5.4%FEB 930,100 877,700 52,400 5.6% 5.8%MAR 935,200 880,000 55,200 5.9% 5.9%APR 941,700 885,000 56,700 6.0% 5.8%MAYJUNJULAUGSEPOCTNOVDEC
# CHANGE FROMMonth Ago 6,500 5,000 1,500 0.1% -0.1%Year Ago 31,300 27,100 4,200 0.2% 0.2%2 Yrs. Ago 52,500 48,000 4,500 0.1% 0.2%3 Yrs. Ago 70,100 59,900 10,200 0.7% 0.6%
% CHANGE FROMMonth Ago 0.7% 0.6% 2.7%Year Ago 3.4% 3.2% 8.0%2 Yrs. Ago 5.9% 5.7% 8.6%3 Yrs. Ago 8.0% 7.3% 21.9%

-9-
New Mexico Labor Force Estimates � Not Seasonally Adjusted 1/
1/ All estimates are made in strict accordance with methodology provided by the U. S. Department of Labor, Bureau of Labor Statistics2/ Metropolitan Statistical Area - Bernalillo, Sandoval, Torrance & Valencia Counties3/ Metropolitan Statistical Area - San Juan County4/ Metropolitan Statistical Area - Doña Ana County5/ Metropolitan Statistical Area - Santa Fe County
PRELIMINARY APRIL 2005 REVISED MARCH 2005 Absolute Change Percent ChangeLabor Force Empl. Unemp. Rate Labor Force Empl. Unemp. Rate Labor Force Empl. Unemp. Labor Force Empl. Unemp.
STATEWIDE 936,224 881,503 54,721 5.8% 928,195 873,280 54,915 5.9% 8,029 8,223 -194 0.9% 0.9% -0.4%Albuquerque MSA 2/ 403,668 382,282 21,386 5.3% 399,902 378,483 21,419 5.4% 3,766 3,799 -33 0.9% 1.0% -0.2% Bernalillo 314,612 298,311 16,301 5.2% 311,672 295,347 16,325 5.2% 2,940 2,964 -24 0.9% 1.0% -0.1% Sandoval 49,231 46,452 2,779 5.6% 48,748 45,990 2,758 5.7% 483 462 21 1.0% 1.0% 0.8% Torrance 7,793 7,333 460 5.9% 7,733 7,260 473 6.1% 60 73 -13 0.8% 1.0% -2.7% Valencia 32,032 30,186 1,846 5.8% 31,749 29,886 1,863 5.9% 283 300 -17 0.9% 1.0% -0.9%Farmington MSA 3/ 56,016 52,751 3,265 5.8% 55,468 52,145 3,323 6.0% 548 606 -58 1.0% 1.2% -1.7%Las Cruces MSA 4/ 85,489 79,593 5,896 6.9% 84,529 78,619 5,910 7.0% 960 974 -14 1.1% 1.2% -0.2%Santa Fe MSA 5/ 78,475 74,916 3,559 4.5% 77,509 74,014 3,495 4.5% 966 902 64 1.2% 1.2% 1.8%Catron 1,388 1,284 104 7.5% 1,303 1,184 119 9.1% 85 100 -15 6.5% 8.4% -12.6%Chaves 26,224 24,489 1,735 6.6% 26,055 24,311 1,744 6.7% 169 178 -9 0.6% 0.7% -0.5%Cibola 12,713 11,964 749 5.9% 12,604 11,828 776 6.2% 109 136 -27 0.9% 1.1% -3.5%Colfax 6,663 6,241 422 6.3% 6,924 6,529 395 5.7% -261 -288 27 -3.8% -4.4% 6.8%Curry 21,347 20,301 1,046 4.9% 21,125 20,095 1,030 4.9% 222 206 16 1.1% 1.0% 1.6%De Baca 982 927 55 5.6% 981 925 56 5.7% 1 2 -1 0.1% 0.2% -1.8%Eddy 24,687 23,329 1,358 5.5% 24,432 23,096 1,336 5.5% 255 233 22 1.0% 1.0% 1.6%Grant 10,690 9,862 828 7.7% 10,711 9,843 868 8.1% -21 19 -40 -0.2% 0.2% -4.6%Guadalupe 1,730 1,571 159 9.2% 1,728 1,558 170 9.8% 2 13 -11 0.1% 0.8% -6.5%Harding 438 421 17 3.9% 437 421 16 3.7% 1 0 1 0.2% 0.0% 6.3%Hidalgo 2,296 2,136 160 7.0% 2,263 2,107 156 6.9% 33 29 4 1.5% 1.4% 2.6%Lea 26,341 25,007 1,334 5.1% 25,886 24,611 1,275 4.9% 455 396 59 1.8% 1.6% 4.6%Lincoln 11,282 10,785 497 4.4% 11,112 10,599 513 4.6% 170 186 -16 1.5% 1.8% -3.1%Los Alamos 12,127 11,766 361 3.0% 12,047 11,713 334 2.8% 80 53 27 0.7% 0.5% 8.1%Luna 11,682 9,394 2,288 19.6% 11,746 9,251 2,495 21.2% -64 143 -207 -0.5% 1.5% -8.3%McKinley 27,997 25,794 2,203 7.9% 27,771 25,569 2,202 7.9% 226 225 1 0.8% 0.9% 0.0%Mora 2,204 1,914 290 13.2% 2,184 1,879 305 14.0% 20 35 -15 0.9% 1.9% -4.9%Otero 27,709 26,183 1,526 5.5% 27,579 26,034 1,545 5.6% 130 149 -19 0.5% 0.6% -1.2%Quay 4,071 3,812 259 6.4% 4,035 3,763 272 6.7% 36 49 -13 0.9% 1.3% -4.8%Rio Arriba 22,456 20,946 1,510 6.7% 22,308 20,681 1,627 7.3% 148 265 -117 0.7% 1.3% -7.2%Roosevelt 9,813 9,379 434 4.4% 9,753 9,334 419 4.3% 60 45 15 0.6% 0.5% 3.6%San Miguel 14,212 13,227 985 6.9% 13,994 13,022 972 6.9% 218 205 13 1.6% 1.6% 1.3%Sierra 5,196 4,865 331 6.4% 5,115 4,784 331 6.5% 81 81 0 1.6% 1.7% 0.0%Socorro 9,194 8,712 482 5.2% 9,034 8,543 491 5.4% 160 169 -9 1.8% 2.0% -1.8%Taos 17,081 15,686 1,395 8.2% 17,599 16,360 1,239 7.0% -518 -674 156 -2.9% -4.1% 12.6%Union 2,052 1,964 88 4.3% 2,057 1,977 80 3.9% -5 -13 8 -0.2% -0.7% 10.0%
PRELIMINARY APRIL 2005 REVISED APRIL 2004 Absolute Change Percent ChangeLabor Force Empl. Unemp. Rate Labor Force Empl. Unemp. Rate Labor Force Empl. Unemp. Labor Force Empl. Unemp.
STATEWIDE 936,224 881,503 54,721 5.8% 905,160 854,442 50,718 5.6% 31,064 27,061 4,003 3.4% 3.2% 7.9%
Note: The U.S. Bureau of Labor Statistics (BLS) has discovered an error in one of theemployment inputs they provided to the states for county labor force estimation. This erroraffects previously published estimates of the size of the labor force for all New Mexicocounties and metropolitan areas from January 2000 forward. Levels of unemployment arenot affected, and there is little effect on unemployment rates. This error impacts county andmetropolitan labor force estimates in almost every state, but statewide estimates are notaffected. The New Mexico Department of Labor will begin revising its labor forceestimates for counties and metropolitan areas as soon as the corrected inputs are available.Because year-ago estimates will be revised, publication of over-the-year comparisons ofsubstate labor force data will be delayed until all error corrections are implemented.

-10-
Unemployment Rates in New Mexico (Not Seasonally Adjusted)
1/ Metropolitan Statistical Area - Bernalillo, Sandoval, Torrance & Valencia Counties2/ Metropolitan Statistical Area - San Juan County3/ Metropolitan Statistical Area - Doña Ana County4/ Metropolitan Statistical Area - Santa Fe County
PRELIMINARY APRIL 2005 REVISED MARCH 2005
AREAS RANK RATE AREAS RANK RATE
LUNA 1 19.6% LUNA 1 21.2%MORA 2 13.2% MORA 2 14.0%GUADALUPE 3 9.2% GUADALUPE 3 9.8%TAOS 4 8.2% CATRON 4 9.1%MCKINLEY 5 7.9% GRANT 5 8.1%GRANT 6 7.7% MCKINLEY 6 7.9%CATRON 7 7.5% RIO ARRIBA 7 7.3%HIDALGO 8 7.0% LAS CRUCES MSA 3/ 8 7.0%LAS CRUCES MSA 3/ 9 6.9% TAOS 9 7.0%SAN MIGUEL 10 6.9% HIDALGO 10 6.9%RIO ARRIBA 11 6.7% SAN MIGUEL 11 6.9%CHAVES 12 6.6% CHAVES 12 6.7%QUAY 13 6.4% QUAY 13 6.7%SIERRA 14 6.4% SIERRA 14 6.5%COLFAX 15 6.3% CIBOLA 15 6.2%CIBOLA 16 5.9% FARMINGTON MSA 2/ 16 6.0%FARMINGTON MSA 2/ 17 5.8% STATEWIDE 5.9%STATEWIDE 5.8% COLFAX 17 5.7%DE BACA 18 5.6% DE BACA 18 5.7%EDDY 19 5.5% OTERO 19 5.6%OTERO 20 5.5% EDDY 20 5.5%ALBUQUERQUE MSA 1/ 21 5.3% ALBUQUERQUE MSA 1/ 21 5.4%SOCORRO 22 5.2% SOCORRO 22 5.4%LEA 23 5.1% CURRY 23 4.9%CURRY 24 4.9% LEA 24 4.9%SANTA FE MSA 4/ 25 4.5% LINCOLN 25 4.6%LINCOLN 26 4.4% SANTA FE MSA 4/ 26 4.5%ROOSEVELT 27 4.4% ROOSEVELT 27 4.3%UNION 28 4.3% UNION 28 3.9%HARDING 29 3.9% HARDING 29 3.7%LOS ALAMOS 30 3.0% LOS ALAMOS 30 2.8%
See boxnote on page 9.
For fast and easy access to the latest labor market information, please visit the New Mexico Department of Labor's website.There you will find a wide variety of information and tools for all kinds of people, including job seekers, employers, teachers,grant writers, career counselors, and students. All of our publications, including the one you are reading now, can be accessedonline and are available sooner than if delivered by mail. This website also includes information on Department of Laborprograms, contact names and addresses, and frequently asked questions about Department functions. In addition, all NMDOLemployer forms can be downloaded from our website for easy access. Also provided are links to other related websites,including America's Job Bank for nationwide job searches. All this and more is available on our website at:
Need Labor Market Information?We have several major publications detailing New Mexicoís:
Current economic conditions and trendsWages by occupations and areasLarger employersGrowing jobs with skills and training needsJob market with hints for finding and keeping a job
They are available, at no cost, by dropping by any NMDOL office.
www.dol.state.nm.us
...Check Out Our Website!

Unemployment Rate by State (Seasonally Adjusted)
-11-
Preliminary April Revised April2005 2004
State Rank Rate State Rank RateDistrict of Columbia 1 7.7 District of Columbia 1 7.9Michigan 2 7.0 Alaska 2 7.4Mississippi 3 6.8 Oregon 3 7.4Alaska 4 6.7 Michigan 4 6.7Oregon 5 6.5 South Carolina 5 6.7South Carolina 6 6.5 California 6 6.4Ohio 7 6.1 Washington 7 6.3New Mexico 8 6.0 Illinois 8 6.2Illinois 9 5.9 Texas 9 6.2Tennessee 10 5.8 Ohio 10 6.1Kentucky 11 5.6 New York 11 6.0Missouri 12 5.6 New Mexico 12 5.8Texas 13 5.5 Arkansas 13 5.7Washington 14 5.5 Louisiana 14 5.7California 15 5.4 North Carolina 15 5.7Indiana 16 5.4 Alabama 16 5.6North Carolina 17 5.3 Mississippi 17 5.6Colorado 18 5.2 Colorado 18 5.5Kansas 19 5.2 Kansas 19 5.5United States 5.2 Kentucky 20 5.5West Virginia 20 5.2 United States 5.5Louisiana 21 5.1 Missouri 21 5.4Arizona 22 5.0 Pennsylvania 22 5.4Georgia 23 5.0 Tennessee 23 5.4Arkansas 24 4.9 West Virginia 24 5.4Connecticut 25 4.9 Massachusetts 25 5.3New York 26 4.9 Rhode Island 26 5.3Pennsylvania 27 4.9 Arizona 27 5.2Utah 28 4.9 Utah 28 5.2Maine 29 4.7 Indiana 29 5.1Massachusetts 30 4.7 New Jersey 30 5.1Rhode Island 31 4.7 Connecticut 31 5.0Iowa 32 4.5 Oklahoma 32 5.0Oklahoma 33 4.5 Wisconsin 33 5.0Wisconsin 34 4.5 Idaho 34 4.9Alabama 35 4.4 Florida 35 4.8Montana 36 4.4 Iowa 36 4.7Maryland 37 4.3 Minnesota 37 4.5Florida 38 4.2 Nevada 38 4.5New Jersey 39 4.2 Georgia 39 4.4Idaho 40 4.0 Maine 40 4.4Minnesota 41 4.0 Montana 41 4.4Nevada 42 4.0 Maryland 42 4.2Delaware 43 3.9 Delaware 43 4.1Nebraska 44 3.9 New Hampshire 44 4.0South Dakota 45 3.7 Vermont 45 3.8Virginia 46 3.6 Nebraska 46 3.7Wyoming 47 3.5 Virginia 47 3.7New Hampshire 48 3.4 Wyoming 48 3.6Vermont 49 3.3 Hawaii 49 3.4North Dakota 50 3.2 South Dakota 50 3.4Hawaii 51 2.9 North Dakota 51 3.2
Source: U.S. Department of Labor, Bureau of Labor Statistics

0.4
0.4
1.8
1.8
1.9
2.0
2.6
3.6
6.5
8.8
-4.8
-1.3
-0.8
-0.4
Information
Wholesale Trade
Mfg.
Trans, Warehsing, & Util.
Retail Trade
Leisure & Hospitality
Other Services
Total
Gov.
Pro & Bus. Services
Financial Activities
Educ. & Health Services
Const.
Natural Res. & Mining
-12-
New Mexico Nonagricultural Wage and Salary Employment
New Mexico and Albuquerque Annual Nonfarm Job Growth Rates
NAICS Industries
Annual Growth Rates by Industry
Retail T rade11%
Information2%
Financial Activities4%
Pro & Bus. Services11%
Trans, Warehousing,& Utilities 3%
Gov.26%
OtherServices
4%
Natural Res.& Mining
2%
Leisure & Hospitality10%
Educ. & Health Services14%
Const.6%
Mfg.4%
Wholesale Trade3%

-13-
Nonagricultural Wage and Salary Employment
Preliminary Revised Revised ChangeApr-05 Mar-05 Apr-04 Monthly Yearly
TOTAL NONAGRICULTURAL EMPLOYMENT 1/ 804,600 799,100 790,000 5,500 14,600
GOODS PRODUCING 103,400 102,000 99,200 1,400 4,200SERVICES-PROVIDING 701,200 697,100 690,800 4,100 10,400
NATURAL RESOURCES AND MINING 16,100 15,900 14,800 200 1,300Oil & Gas Extraction, Well Drilling 12,200 11,900 11,000 300 1,200Mining, Except Oil and Gas 3,800 3,800 3,600 0 200
CONSTRUCTION 52,200 51,000 49,000 1,200 3,200Construction of Buildings 14,700 14,300 13,800 400 900
Residential Building Construction 8,400 8,100 7,600 300 800Heavy and Civil Engineering Construction 8,800 8,500 8,000 300 800Specialty Trade Contractors 28,700 28,200 27,200 500 1,500
MANUFACTURING 35,100 35,100 35,400 0 -300Durable Goods 24,700 24,700 24,800 0 -100
Computer and Electronic Products 9,900 10,000 10,500 -100 -600 Semiconductor and Other Electronics 6,700 6,800 7,100 -100 -400
Non-Durable Goods 10,400 10,400 10,600 0 -200
WHOLESALE TRADE 22,100 22,100 22,400 0 -300
RETAIL TRADE 91,600 91,400 91,200 200 400Motor Vehicle and Parts Dealers 12,800 12,800 12,700 0 100Food and Beverage Stores 12,200 12,200 12,200 0 0General Merchandise Stores 20,000 19,700 20,200 300 -200 Department Stores 6,300 6,300 6,400 0 -100 Other General Merchandise Stores 13,700 13,400 13,800 300 -100Miscellaneous Store Retailers 6,700 6,800 6,900 -100 -200Nonstore Retailers 3,000 3,000 2,800 0 200
TRANSPORTATION, WAREHOUSING, AND UTILITIES 23,100 23,100 23,200 0 -100Utilities 3,900 3,900 3,900 0 0Transportation and Warehousing 19,200 19,200 19,300 0 -100
Truck Transportation 6,600 6,600 6,600 0 0
INFORMATION 14,000 14,000 14,700 0 -700Telecommunications 5,900 5,900 6,800 0 -900
FINANCIAL ACTIVITIES 35,200 35,100 34,300 100 900Finance and Insurance 24,700 24,600 24,000 100 700
Credit Intermediation and Related Activities 13,400 13,400 12,800 0 600Insurance Carriers and Related Activities 9,400 9,400 9,400 0 0
Real Estate and Rental and Leasing 10,500 10,500 10,300 0 200
PROFESSIONAL AND BUSINESS SERVICES 91,700 91,000 89,900 700 1,800Professional, Scientific, and Technical 43,000 42,900 42,300 100 700
Architectural, Engineering, and Related 10,800 10,800 10,800 0 0Scientific Research and Development 13,600 13,500 13,400 100 200
Management of Companies and Enterprises 5,100 5,100 5,200 0 -100Administrative & Support & Waste Mgt & Remediation Services 43,600 43,000 42,400 600 1,200
Employment Services 16,500 16,300 16,300 200 200Business Support Services 6,500 6,400 5,500 100 1,000
EDUCATIONAL AND HEALTH SERVICES 106,800 106,000 103,100 800 3,700Educational Services 14,100 13,700 13,500 400 600
Health Care and Social Assistance 92,700 92,300 89,600 400 3,100Ambulatory Health Care Services 38,800 38,600 37,200 200 1,600
Offices of Physicians 10,500 10,400 10,100 100 400Outpatient Care Centers 8,700 8,500 8,100 200 600Home Health Care Services 8,300 8,400 8,300 -100 0
Hospitals 19,800 19,800 19,500 0 300Nursing and Residential Care Facilities 13,800 13,700 13,400 100 400
Nursing Care Facilities 7,400 7,400 7,200 0 200Social Assistance 20,300 20,200 19,500 100 800
LEISURE AND HOSPITALITY 83,300 81,700 83,000 1,600 300Arts, Entertainment, and Recreation 8,000 8,100 8,000 -100 0
Accommodation and Food Services 75,300 73,600 75,000 1,700 300Accommodation 13,400 13,300 13,300 100 100Food Services and Drinking Places 61,900 60,300 61,700 1,600 200
Full-Service Restaurants 28,800 28,200 29,100 600 -300Limited-Service Eating Places 26,400 25,500 25,600 900 800
OTHER SERVICES 28,600 28,500 28,100 100 500Repair and Maintenance 7,700 7,700 7,700 0 0
GOVERNMENT 204,800 204,200 200,900 600 3,900Federal Government 29,500 29,100 29,900 400 -400State Government 2/ 70,300 70,400 69,300 -100 1,000
State Government Education 29,200 29,200 29,200 0 0Local Government 105,000 104,700 101,700 300 3,300
Local Government Education 58,300 58,300 56,600 0 1,7001/ Estimates include all full-time and part-time wage and salary workers who worked or received pay during the pay period which includes the 12th day of the month.
2/ Includes employees of Los Alamos National Laboratory, federally funded state programs, state supported universities, and the three branches of government.
NEW MEXICO

-14-
Nonagricultural Wage and Salary Employment
Preliminary Revised Revised Change
Apr-05 Mar-05 Apr-04 Monthly Yearly
TOTAL NONAGRICULTURAL EMPLOYMENT 1/ 376,100 374,400 370,300 1,700 5,800
GOODS PRODUCING 49,400 49,100 47,500 300 1,900
SERVICES-PROVIDING 326,700 325,300 322,800 1,400 3,900
NATURAL RESOURCES AND MINING & CONSTRUCTION 27,100 26,600 25,000 500 2,100
Specialty Trade Contractors 17,000 16,800 15,600 200 1,400
MANUFACTURING 22,300 22,500 22,500 -200 -200
Computer and Electronic Products 9,000 9,100 9,500 -100 -500
Semiconductor and Other Electronics 6,500 6,600 6,900 -100 -400
WHOLESALE TRADE 12,800 12,700 13,200 100 -400
RETAIL TRADE 42,600 42,600 42,100 0 500
Food and Beverage Stores 4,700 4,700 4,700 0 0
General Merchandise Stores 8,100 8,100 8,100 0 0
Department Stores 3,100 3,100 3,200 0 -100
TRANSPORTATION, WAREHOUSING, AND UTILITIES 10,500 10,400 10,600 100 -100
INFORMATION 8,600 8,700 9,600 -100 -1,000
Telecommunications 4,100 4,100 5,200 0 -1,100
FINANCIAL ACTIVITIES 19,300 19,300 19,000 0 300
Finance and Insurance 14,100 14,000 13,700 100 400
Credit Intermediation and Related Activities 6,300 6,300 6,000 0 300
Depository Credit Intermediation 4,300 4,300 4,000 0 300
PROFESSIONAL AND BUSINESS SERVICES 59,800 59,500 58,900 300 900
Professional, Scientific, and Technical 29,400 29,300 28,800 100 600
Scientific Research and Development 12,000 11,900 11,800 100 200
Management of Companies and Enterprises 3,500 3,500 3,600 0 -100
Administrative & Support & Waste Mgt & Remediation Services 26,900 26,700 26,500 200 400
Employment Services 12,100 12,000 12,100 100 0
Business Support Services 4,100 4,100 3,300 0 800
EDUCATIONAL AND HEALTH SERVICES 47,400 47,400 45,300 0 2,100
Health Care and Social Assistance 41,600 41,600 39,700 0 1,900
Ambulatory Health Care Services 19,800 19,700 18,900 100 900
Hospitals 7,700 7,700 7,300 0 400
LEISURE AND HOSPITALITY 36,900 35,600 37,100 1,300 -200
Food Services and Drinking Places 28,300 27,800 28,900 500 -600
Full-Service Restaurants 13,200 12,900 13,500 300 -300
OTHER SERVICES 11,800 11,900 11,700 -100 100
GOVERNMENT 77,000 77,200 75,300 -200 1,700
Federal Government 13,900 13,900 14,100 0 -200
State Government /2 25,200 25,400 24,800 -200 400
Local Government 37,900 37,900 36,400 0 1,500
1/ Estimates include all full-time and part-time wage and salary workers who worked or received pay during the pay period which included the 12th day of the month.
2/ Includes employees of federally funded state programs, state supported universities, and the three branches of state government.
ALBUQUERQUE

-15-
Nonagricultural Wage and Salary Employment
1/ Estimates include all full-time and part-time wage and salary workers who worked or received pay during the pay period which included the 12th day of the month.2/ Includes employees of federally funded state programs, state supported universities, and the three branches of state government.
Preliminary Revised Revised ChangeApr-05 Mar-05 Apr-04 Monthly Yearly
TOTAL NONAGRICULTURAL EMPLOYMENT /1 63,900 63,600 62,600 300 1,300GOODS PRODUCING 7,700 7,700 7,400 0 300SERVICE PRODUCING 56,200 55,900 55,200 300 1,000
NATURAL RESOURCES MINING & CONSTRUCTION 4,100 4,000 3,900 100 200
MANUFACTURING 3,600 3,700 3,500 -100 100
WHOLESALE TRADE 1,100 1,100 1,000 0 100
RETAIL TRADE 6,800 6,800 6,700 0 100
TRANSPORTATION, WAREHOUSING, AND UTILITIES 1,700 1,700 1,600 0 100
INFORMATION 1,200 1,200 1,100 0 100
FINANCIAL ACTIVITIES 2,500 2,400 2,400 100 100
PROFESSIONAL & BUSINESS SERVICES 5,000 4,900 5,000 100 0
EDUCATIONAL AND HEALTH SERVICES 9,300 9,300 8,900 0 400
LEISURE AND HOSPITALITY 6,300 6,200 6,200 100 100
OTHER SERVICES 1,500 1,500 1,500 0 0
GOVERNMENT 20,800 20,800 20,800 0 0 Federal 3,200 3,200 3,400 0 -200 State 9,000 9,100 9,100 -100 -100 Local 8,600 8,500 8,300 100 300
Preliminary Revised Revised ChangeApr-05 Mar-05 Apr-04 Monthly Yearly
TOTAL NONAGRICULTURAL EMPLOYMENT /1 61,400 61,000 60,400 400 1,000GOODS PRODUCING 5,500 5,400 5,800 100 -300SERVICE PRODUCING 55,900 55,600 54,600 300 1,300
NATURAL RESOURCES, MINING & CONSTRUCTION 4,300 4,200 4,600 100 -300
MANUFACTURING 1,200 1,200 1,200 0 0
WHOLESALE TRADE 1,000 1,000 1,000 0 0
RETAIL TRADE 8,400 8,300 8,400 100 0
TRANSPORTATION, WAREHOUSING, AND UTILITIES 700 700 700 0 0
INFORMATION 900 900 900 0 0
FINANCIAL ACTIVITIES 2,900 2,900 2,800 0 100
PROFESSIONAL & BUSINESS SERVICES 5,200 5,200 5,000 0 200
EDUCATIONAL AND HEALTH SERVICES 8,500 8,600 8,300 -100 200
LEISURE AND HOSPITALITY 9,000 8,800 9,000 200 0
OTHER SERVICES 2,800 2,800 2,800 0 0
GOVERNMENT 16,500 16,400 15,700 100 800 Federal 1,200 1,100 1,200 100 0 State /2 8,100 8,300 8,100 -200 0 Local 7,200 7,000 6,400 200 800
Preliminary Revised Revised ChangeApr-05 Mar-05 Apr-04 Monthly Yearly
TOTAL NONAGRICULTURAL EMPLOYMENT 49,200 49,000 47,600 200 1,600TOTAL PRIVATE 37,800 37,600 36,200 200 1,600GOODS PRODUCING 10,400 10,600 9,900 -200 500SERVICE PRODUCING 38,800 38,400 37,700 400 1,100PRIVATE SERVICE PRODUCING 27,400 27,000 26,300 400 1,100
NATURAL RESOURCES, MINING & CONSTRUCTION 9,000 9,100 8,500 -100 500
TRADE, TRANSPORTATION AND UTILITIES 10,400 10,400 10,100 0 300
EDUCATIONAL AND HEALTH SERVICES 5,500 5,500 5,400 0 100
LEISURE AND HOSPITALITY 4,900 4,800 4,900 100 0
GOVERNMENT 11,400 11,400 11,400 0 0 Federal 1,700 1,700 1,700 0 0 State 500 500 500 0 0 Local 9,200 9,200 9,200 0 0
LAS CRUCES MSA
SANTA FE MSA
FARMINGTON MSA
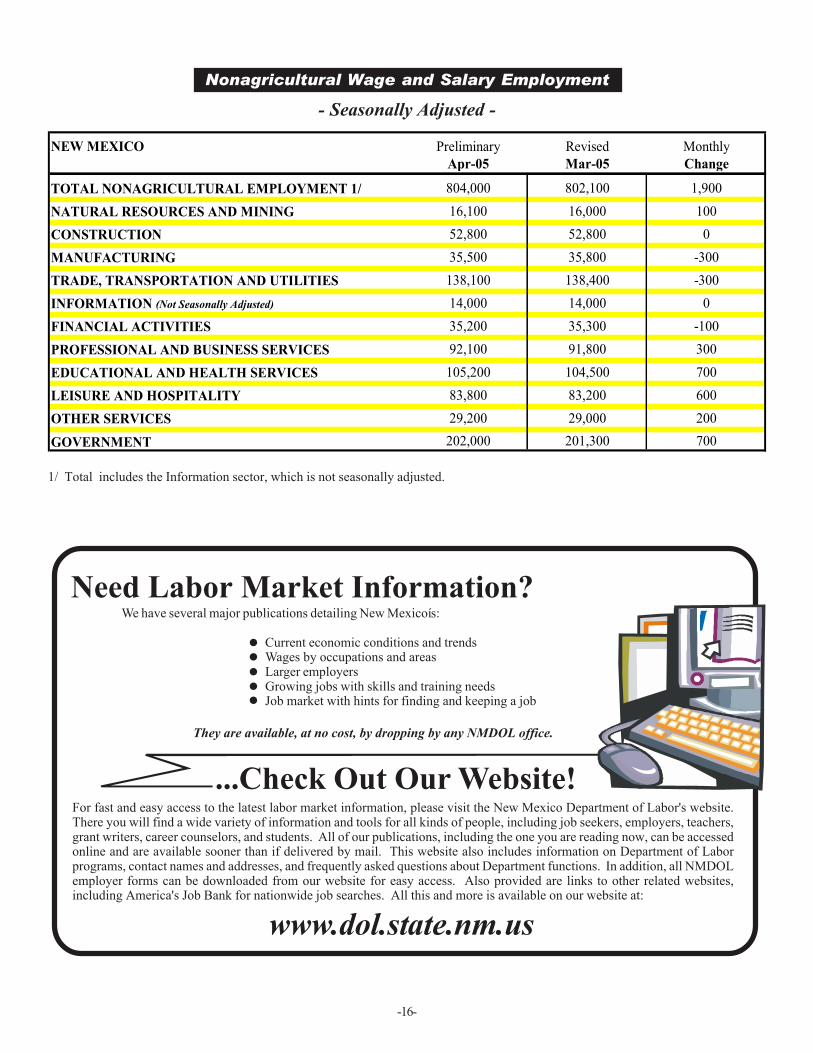
Nonagricultural Wage and Salary Employment
- Seasonally Adjusted -
-16-
1/ Total includes the Information sector, which is not seasonally adjusted.
For fast and easy access to the latest labor market information, please visit the New Mexico Department of Labor's website.There you will find a wide variety of information and tools for all kinds of people, including job seekers, employers, teachers,grant writers, career counselors, and students. All of our publications, including the one you are reading now, can be accessedonline and are available sooner than if delivered by mail. This website also includes information on Department of Laborprograms, contact names and addresses, and frequently asked questions about Department functions. In addition, all NMDOLemployer forms can be downloaded from our website for easy access. Also provided are links to other related websites,including America's Job Bank for nationwide job searches. All this and more is available on our website at:
Need Labor Market Information?We have several major publications detailing New Mexicoís:
Current economic conditions and trendsWages by occupations and areasLarger employersGrowing jobs with skills and training needsJob market with hints for finding and keeping a job
They are available, at no cost, by dropping by any NMDOL office.
www.dol.state.nm.us
...Check Out Our Website!
NEW MEXICO Preliminary Revised Monthly
Apr-05 Mar-05 Change
TOTAL NONAGRICULTURAL EMPLOYMENT 1/ 804,000 802,100 1,900
NATURAL RESOURCES AND MINING 16,100 16,000 100
CONSTRUCTION 52,800 52,800 0
MANUFACTURING 35,500 35,800 -300
TRADE, TRANSPORTATION AND UTILITIES 138,100 138,400 -300
INFORMATION (Not Seasonally Adjusted) 14,000 14,000 0
FINANCIAL ACTIVITIES 35,200 35,300 -100
PROFESSIONAL AND BUSINESS SERVICES 92,100 91,800 300
EDUCATIONAL AND HEALTH SERVICES 105,200 104,500 700
LEISURE AND HOSPITALITY 83,800 83,200 600
OTHER SERVICES 29,200 29,000 200
GOVERNMENT 202,000 201,300 700

-17-
Average Hours and EarningsPrepared in cooperation with the U.S. Bureau of Labor Statistics
U.S. Consumer Price Index
New Mexico Unemployment Insurance^
AVERAGE WEEKLY EARNINGS AVERAGE WEEKLY HOURS AVERAGE HOURLY EARNINGS
NEW MEXICO Apr 05 Mar 05 Apr 04 Apr 05 Mar 05 Apr 04 Apr 05 Mar 05 Apr 04
NATURAL RES. & MINING $766.91 $767.36 $741.75 43.5 43.6 43.0 $17.63 $17.60 $17.25
CONSTRUCTION $614.20 $612.61 $600.26 39.6 39.6 39.7 $15.51 $15.47 $15.12
MANUFACTURING $529.98 $529.20 $520.47 39.2 39.2 39.7 $13.52 $13.50 $13.11
WHOLESALE TRADE $518.00 $520.96 $520.17 35.0 35.2 35.8 $14.80 $14.80 $14.53
RETAIL TRADE $347.07 $347.52 $338.74 31.9 32.0 32.2 $10.88 $10.86 $10.52
FINANCIAL ACTIVITIES $489.58 $492.39 $483.38 35.4 35.5 35.7 $13.83 $13.87 $13.54
ALBUQUERQUE MSA Apr 05 Mar 05 Apr 04 Apr 05 Mar 05 Apr 04 Apr 05 Mar 05 Apr 04
MANUFACTURING $638.04 $631.40 $583.12 39.0 40.5 39.4 $16.36 $15.59 $14.80
Estimates include all full-time and part-time wage and salary workers who worked or received pay during the pay period which includedthe 12th day of the month. Self-employed, family workers, household workers and members of the Armed Forces are excluded. Theaverage earnings are "gross" reflecting not only changes in basic hourly and incentive wage rates but also such factors as premiumpay for overtime and shift differentials. The work week information relates to the average hours for which pay was received,and is different from standard or scheduled hours due to absenteeism, labor turnover, part time work, overtime work etc.
Index Base Year 1982-84 = 100 PERCENT CHANGE Apr 05 Mar 05 Apr 04 Month to Month Year to Year
CPI-U 194.6 193.3 188.0 0.7% 3.5%CPI-W 190.2 188.6 183.5 0.8% 3.7% *CPI-U - All Urban Consumers *CPI-W - Urban Wage Earners and Clerical Workers - Source: U.S. Department of Labor, Bureau of Labor Statistics
Apr-05 Mar-05 Apr-04CLAIMS ACTIVITIES from Mar-05 From Apr-04 Initial Claims 4,186 4,974 4,964 -15.8% -15.7% Continued Claims # 50,172 56,655 57,135 -11.4% -12.2% Insured Unemployed # 12,736 13,235 14,396 -3.8% -11.5% Insured Unemployment Rate 1.8% 1.8% 2.0%PAYMENT ACTIVITIES First Payments 2,110 2,319 2,277 -9.0% -7.3% Final Payments 1,037 980 1,353 5.8% -23.4% Weeks Compensated 43,661 47,871 49,637 -8.8% -12.0% Net Benefit Payments $9,275,784 $10,130,339 $10,384,358 -8.4% -10.7% Average WBA* $216.78 $216.44 $211.67 0.2% 2.4% Average Duration (weeks)* 17.8 17.9 17.8 -0.6% -0.1% Exhaustion Rate * 43.2% 43.4% 44.2%
^ Regular UI program only. # includes intrastate and interstate agent claims. ** 12-month moving average.
Percent Change
Average Duration and Final Payments
0
2
4
6
8
10
12
14
16
18
20
Jan-
99
Jul-9
9
Jan-
00
Jul-0
0
Jan-
01
Jul-0
1
Jan
02
Jul-0
2
Jan-
03
Jul-0
3
Jan-
04
Jul-0
4
Jan-
05
Avg
. D
urat
ion
(week
s)
0
200
400
600
800
1,000
1,200
1,400
1,600
1,800
2,000
Fin
al P
aym
ents
Avg. Duration Final

-18-
(SOURCES: Published articles, government documents, private and public sector news releases and reports from local New Mexico Department of Labor Workforce Centers. In most cases, no attempt is made to verify accuracy of information.)
New Mexico Area Economic Activity
Statewide:
The stateís Job Training Incentive Board awarded a total of $243,577to two companies at the April board meeting. Strategic Analytics Inc.,a Santa Fe based software company, received $56,577 to train fiveemployees. Space Micro Inc. was approved for $187,000 to train sixworkers in its Albuquerque office. Space Microís jobs are in the$110,000 per year range.
New Mexico has opened a trade office in Tokyo, Japan. Hideji Kuriharawill run the office and represent New Mexicoís interests. Mr. Kuriharawill seek to encourage Japanese companies to invest in New Mexicoand also strive to improve export opportunities for New Mexico busi-nesses.
New Mexicoís farmers are being hard hit by the higher costs of oil andgas. In addition to the direct costs of fuel for farm machinery andhigher transportation costs, farmers also have seen prices rise forfertilizers and pesticides. Nitrogen based fertilizer is up by 25 to 30percent and the cost of ammonia-based fertilizer, which is made fromnatural gas, has also increased. Many farmers are having a hard timeraising prices enough to cover their increased expenses.
Albuquerque Area, Bernalillo County:
The Little Anitaís Restaurant at the corner of University and Menaulis being rebuilt and will reopen in July. The restaurant was destroyedby fire last October when roofers accidentally set the roof on fireduring a repair.
The City of Albuquerque is going to build a 95,000-square-foot aircrafthangar at the Albuquerque Sunport. The hangar will be leased toEclipse Aviation and will be configured with two paint booths forpainting Eclipse 500 aircraft as they are completed. Work on thebuilding should be completed by this December. Eclipse plans to hireabout 80 more employees to work in the new facility.
The nine-story, 261-suite Embassy Suites Hotel and spa opened inAlbuquerque. The hotel is just off of the Interstate at 1000 WoodwardPlace NE, provides convenient access to I-40 and I-25, and is situatedapproximately five minutes from Albuquerque International Airport. Itis the first large full-service hotel to be built in Albuquerque since theHyatt Regency was completed in 1989. The hotel features a privatebedroom in every suite, a living room with a sofa sleeper, wet bar,refrigerator, microwave and coffeemaker. The hotel has about 188employees.
Ultimate Electronics will auction all of its 62 stores to satisfy creditors.The company has not publicly commented on the possibility of clos-ing the Albuquerque Ultimate Electronics store, which currently em-ploys about 55 people.
Eclipse Aviation will supply aircraft for DayJetís innovative "per-seat, on-demand" jet services. DayJet Corporation signed a long-term agreement with Eclipse to supply a fleet of next-generation,very light jets (VLJ). The agreement includes firm orders for 239 ofthe Eclipse 500 jets and options to purchase 70 additional aircraft.Deliveries of the planes will begin shortly after the Eclipse 500receives FAA certification, which is on track to occur in March2006. Additionally, this month Eclipse successfully completedmaiden flights for its second and third flight test aircraft.
Independent bookseller Bound to be Read will close by the end of thisyear. The bookstore opened in 1996 and has featured promotions withmany local and nationally known authors. Books account for about 80percent of the storeís inventory, with stationary, candleholders, dishes,picture frames and handbags making up the remainder. The bookstorehas a staff of about 30 workers.
Sento Corp. has selected Albuquerque to be the site of the companyísfirst Spanish language customer support center. The company islooking for a 35,000-square-foot facility and may ultimately employ asmany as 800 people in the Albuquerque center. At present they needabout 25 people to serve Overstock.com, the one client they haveunder contract. Sento expects to have enough work for about 150employees by the end of the year.
Roswell Area, Chaves County:
The downtown Dennyís Restaurant has been closed and all of therestaurantís 30 to 40 employees have been re-employed at otherlocations. Increased competition for downtown diners and a decline inthe number of late-night customers were noted as reasons for theclosure. The Dennyís at 2200 North Main St. will remain open.
Clovis Area, Curry County:
The first Clovis area Advanced Auto Parts opened at 2109 North PrinceStreet. The store occupies about 7,000 square feet and employs 12workers.
Artesia Area, Eddy County:
The Eddy County Commission gave approval for Oops Unlimited tobuild a gasification plant to produce ethanol from cow manure inSeven Rivers. The plant will process about 12 truckloads of manureper day into alcohol. About 40 people will be needed to operate thenew facility.

-19-
Alamogordo Area, Otero County:
The Otero County Economic Development Department announcedthat a cookie manufacturer is considering setting up shop inAlamogordo. The unnamed company, referred to as ìProjectCrispî to protect confidentiality, is considering renovating theformer Presto cookware plant on LaVelle Road. Various economicincentives totaling $3 million have been requested by the com-pany. The cookie manufacturer has moved some of its equipmentto the Presto facility for temporary storage while details of the planare being worked out.
Portales Area, Roosevelt County:
Construction of the 120-wind turbine San Juan Mesa Wind Projectwill begin in May. Xcel Energy Inc. will develop a site for theturbines near Elida, about 65 miles northeast of Roswell. The plantis expected to produce about 120 megawatts, enough to providepower for about 41,600 homes.
Bernalillo, Sandoval County:
Site preparation for the 170-acre Santiago housing development isunderway at the site of the old Priceís Dairy off of N.M. 528.Intrepid Development plans to build about 780 homes within threeseparate communities at the site. The project is expected to alterthe demographics of the town of Bernalillo, which currently has apopulation of about 7,000.
Rio Rancho Area, Sandoval County:
Lions Gate Television will shoot 11 episodes of the TV showìWildfireî in Sandoval County. The pilot episode was filmed in thelocal area earlier this year and the ABC Family Channel picked upthe show for series production. The showís story is about atroubled teenage girl who starts a new life on a ranch. Productionon the series will run through at least August. Most of the filmingwill be done in Algodones, but the programís production office willbe in Rio Rancho. Veteran actor and New Mexico resident DennisWeaver stars with Nana Visitor, who was in Star Trek: Deep SpaceNine.
High Desert Investing is making infrastructure improvements inthe 10-square-mile tract near Unser Boulevard and U.S. 550 inpreparation to begin building homes in the Mariposa Communitiesdevelopment. The project has a 26-year development plan, butcompany spokespersons have said that they expect the project tobe completed long before that. The Mariposa project will ultimatelyconstruct homes for about 20,000 people when the development iscompleted.
Deming Area, Luna County:
A pipeline project will bring about 400 out-of-town constructionworkers to Deming later this year. The project, Kinder MorganEnergy Partnersí Eastline Expansion Project, will transport pe-troleum by pipeline from Phoenix, AZ to El Paso, TX. Deming willbe used as a temporary headquarters for the project during theconstruction phase.
Taos Area, Taos County:
Recent price increases in molybdenum have prompted Unical toseek additional workers for its Questa mining operation. The com-pany is looking for underground miners for about 20 temporarypositions.
A Profile of Older Workers in New MexicoReport Now Available!
The report, A Profile of Older Workers in New Mexico, highlights the age composition of New Mexicoís workforce, job gains and losses of older workers by industry, industries in which older workers were concentrated,and job stability and earnings of older workers.
The full report can be accessed through the NMDOL website in PDF format at:http://www.dol.state.nm.us/pdf/LED-NM.pdf
Or call Michelle Doran, Labor Economist, NMDOL at:(505) 841 8999

New Mexico Department of LaborEconomic Research and Analysis (CC6097)P.O. Box 1928Albuquerque, New Mexico 87103
Official BusinessPenalty for Private Use, $300
To be placed on our mailing list, orif your address has changed, or ifyou do NOT desire to continue re-ceiving this publication, please callor write to:
New Mexico Labor Market Reportis a monthly publication from the New MexicoDepartment of Labor
Art Martinez, Bureau Chief Economic Research and Analysis Bureau
Major Contributors: Mark Boyd, Economist Susan Beard, Economist Karl Romero, Graphic Artist
Other Contributors: Herb Greenwall, Economist Supervisor Theresa Sandoval, Economist Mary Riordan, Economist
PRSRT STDUS POSTAGEPAIDALBUQUERQUE, NMPERMIT No. G-12
New MexicoDepartment of LaborEconomic Research & AnalysisP.O. Box 1928Albuquerque, NM 87103Phone: (505) 841-8673Fax: (505) 841-9007