Embed Size (px)
Citation preview

Bilfinger SE Company Presentation
October 2016

1. Bilfinger at a glance
2. Sale of Building and Facility
3. Industrial at a glance
4. Update on Power
5. Facts and Figures Q2 2016
6. Financial backup
Agenda
Bilfinger SE | Company Presentation | October 2016 page 2

▪ Multinational player with leading positions in attractive markets
▪ High-quality services provider and partner to our customers
▪ Strong customer base with long-term relationships
▪ Approx. 60% recurring business
▪ 2015: Output volume of € 5.0 billion, adjusted EBITA of € -23m
Bilfinger at a glance
Bilfinger SE | Company Presentation | October 2016 page 3
€ 5.0bn output volume
employees
recurring business thereof ~60%
40,000 Approx.

Leading European engineering and services group
Segment Industrial Power
Service Focus
Output volume 2015
Services for Process Industry
€ 3.7bn (76%)
Utilities
€ 1.3bn (24%)
Adj. EBITA 2015 / margin € 128m / 3.5% € -69m / -5.4%
Divisions Industrial Maintenance
Engineering Solutions
Insulation, Scaffolding and Painting
Oil and Gas
Power
Outlook 2016
Output volume
Adj. EBITA
Significant decrease to about € 3.1
billion
At prior-year level
Significant decrease to about € 1.0
billion
Significant improvement, but still
negative
Bilfinger SE | Company Presentation | October 2016 page 4
Germany
23%
Rest of
Europe
52%
America
17%
Asia
5%
Output volume
2016e
Africa
3%

Restructuring of administration raises transparency and strength
and improves our competitiveness
Restructuring of administration raises transparency and strength and
improves our competitiveness
page 5
Standardization of processes,
harmonization of IT systems
One-time expenses in the high
double digit million euro range
(over €50 million in investments
in IT)
Streamlining of Group
headquarters
Commitment to Mannheim
location
GROUP HEAD-
QUARTERS
SAVINGS
EFFECTS
INDUSTRIAL
Reduction in the number of divisions and
companies
Bundling of administrative tasks / expansion
of shared service centers to Europe
Establishment of lead companies in
selected countries
Annual savings of roughly €100
million from 2018 (initial effects
from 2017)
Discussions with social partners
already begun
Bilfinger SE | Company Presentation | October 2016
Program to enhance efficiency in administration
Optimize administrative processes, reduce costs
INVESTMENTS
IN THE FUTURE

1. Bilfinger at a glance
2. Sale of Building and Facility
3. Industrial at a glance
4. Update on Power
5. Facts and Figures Q2 2016
6. Financial backup
Agenda
Bilfinger SE | Company Presentation | October 2016 page 6
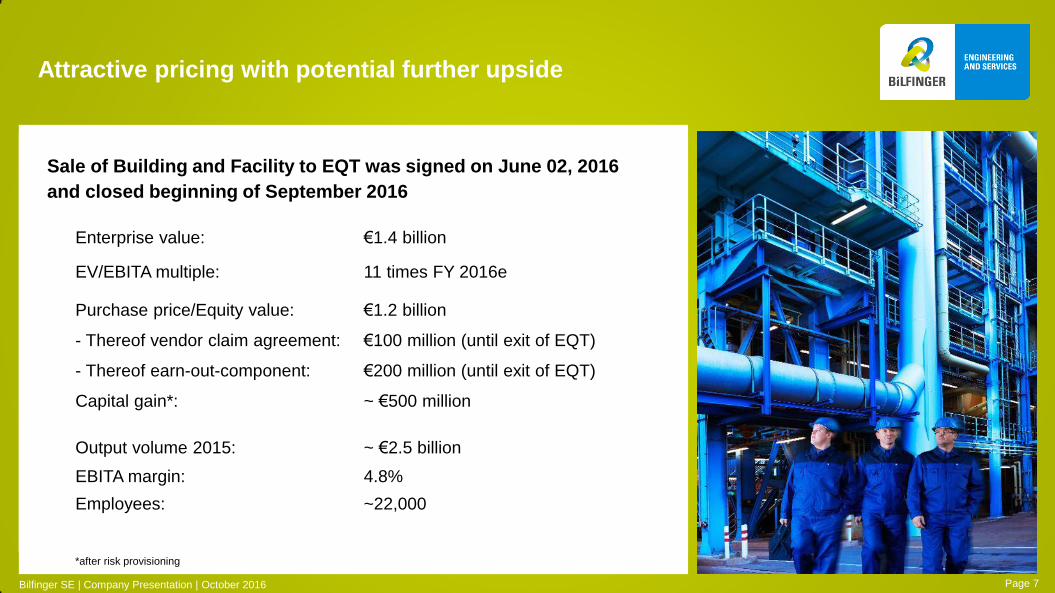
Attractive pricing with potential further upside
Bilfinger SE | Company Presentation | October 2016 Page 7
Sale of Building and Facility to EQT was signed on June 02, 2016
and closed beginning of September 2016
Enterprise value: €1.4 billion
EV/EBITA multiple: 11 times FY 2016e
Purchase price/Equity value: €1.2 billion
- Thereof vendor claim agreement: €100 million (until exit of EQT)
- Thereof earn-out-component: €200 million (until exit of EQT)
Capital gain*: ~ €500 million
Output volume 2015: ~ €2.5 billion
EBITA margin: 4.8%
Employees: ~22,000
*after risk provisioning

Considerations regarding allocation of funds
Strategic investments and acquisitions in Industrial business
Further strengthen the company’s capital structure
Sale of Building and Facility provides Bilfinger
with significant amount of funds
Bilfinger SE | Company Presentation | October 2016 Page 8

Growth
Additional resources to actively participate in ongoing market
consolidation and to invest in growth areas
Markets
Distinct customer base with stronger management focus
No restraints from ‘the other business‘
Perception
Clear identity and focused market approach strengthen Bilfinger brand
Management
Far-reaching harmonization of internal structures, e.g. IT
Faster decision making processes
Capital markets
Reduced complexity and increased comparability for investors
concentrating on specific businesses/market cycles
Pure play Industrial
opens attractive strategic opportunities
Bilfinger SE | Company Presentation | October 2016 Page 9

1. Bilfinger at a glance
2. Sale of Building and Facility
3. Industrial at a glance
4. Update on Power
5. Facts and Figures Q2 2016
6. Financial backup
Agenda
Bilfinger SE | Company Presentation | October 2016 page 10

2015: Output volume of € 3.65 billion, adjusted EBITA of € 128 million
Approx. 30,000 employees
Customer focus: Process Industry
i.e. chemicals, pharma, oil and gas, energy
Approx. 70% recurring business
Four divisions:
Industrial Maintenance
Engineering Solutions
Insulation, Scaffolding and Painting
Oil and Gas
Industrial at a glance
Bilfinger SE | Company Presentation | October 2016 Page 11
€ 3.65bn output volume
EBITA adjusted
employees
recurring business thereof ~70%
€128m
30,000 Approx.

Strong market position in Europe and strong potential
to expand in faster growing regions outside Europe
Number 1 industrial services provider in various markets in Europe
(German-speaking countries, Nordics, UK, Offshore North-Sea, BeNe, Central-Eastern
Europe)
Combination of engineering, construction and asset performance management
(comprises services striving to increase plant availability, extension of plant life time,
reducing maintenance costs) realized as project and recurring business
Robust business model proven by comparably stable margins in sometimes tough
environment (e.g. turmoil in oil markets)
Well-established broad customer base covering the entire process industry including
oil and gas, chemical, petrochemical, agrochemical, gas processing, biotech pharma,
pharmaceutical, food processing, pulp and paper, steel and aluminum production
Highly recognized safety and quality performance
Page 12 Bilfinger SE | Company Presentation | October 2016

Bilfinger helps its customers to optimize their asset performance
Plant Optimizatio
Installation /
Commissioning
Decommissioning
Design
DISMANTLING/
REMOVAL
CONSTRUCTION
CONSULTING &
ENGINEERING
INVEST PHASE
Engineering and Construction Services for new
assets
OPERATING PHASE
Industrial Services for existing assets
DIVESTMENT PHASE
MAINTENANCE SERVICES / TRADES
CONVERSION / MODERNIZATION /
EXTENSION
OPERATIONS
SERVICES
Asset Life
Cycle and
Service
Portfolio
Page 13 Bilfinger SE | Company Presentation | October 2016

Customers Medium term Long term
Imbalance between supply and demand on the raw
materials markets
Over-capacity among our customers
Regulation of the supply and demand situation
Reduction of over-capacities
Increasing demand with limited supply
(+ high break-even costs)
Industrial countries: slump in demand
Developing countries: growth in demand
Germany: continued uncertainty due to
transformation of the energy market
Developing countries: continued high demand
Germany and industrial countries: market opportunities in
renewable energies
Concentration/specialization through mergers and
subsequent separation
Basis chemicals stable, specialty chemicals growing
Middle East, USA: basis and specialty chemicals growing
Europe: basis chemicals declining
Industrial countries: growth through demographic
development among other things
Developing countries: growth through population
increases and expanding wealth
Industrial and developing countries: growth trends continue
Good long-term perspectives in our markets
Sources: OECD; ExxonMobil; EvaluatePharma; Roland Berger; Lünendonk
Bilfinger SE | Company Presentation | October 2016 Page 14
Energy
Oil and Gas
Chemicals
Pharma

Four strategic goals will solidify and enhance
Bilfinger’s market position
Bilfinger SE | Company Presentation | October 2016
Enhance strong
market position /
market leadership in
Europe
Strengthen service
portfolio in
engineering and
advanced asset
performance
management
Establish local
presence in selected
international growth
markets
Increase
digitization-based
services offering
Markets Where do we participate in growth markets?
Services / Innovation How do we differentiate from competitors?
Page 15

Digitization / Industry 4.0
Bilfinger with a good starting position
Digitization trend will sustainably change the processes and assets of our customers
Market expects significant efficiency increase in the process industry through Industry 4.0
Maintenance processes considered to have one of the biggest optimization potentials
Competitive landscape will change, new business models will be developed
Being market leader and provider of services along the entire value chain of assets provides many starting points
for the creation of digital innovation
Bilfinger SE | Company Presentation | October 2016 Page 16
Digitization is both, challenge and opportunity for Bilfinger

New
products
and services
Digitization / Industry 4.0
From internal process optimization to the development of
new products and services
Bilfinger SE | Company Presentation | October 2016
Digitization of processes
(vertical integration)
Integration and
collaboration
(horizontal integration)
Remote monitoring
Smart metering
Remote Maintenance
Predictive Maintenance
Mobile Maintenance
Digital documentation of maintenance work
Augmented Reality
Time recording via fingerprint
Client service portals
Supplier portals
Integrated work order management
Page 17
Examples:

Digitization / Industry 4.0
Various digital products and services already in use
Bilfinger SE | Company Presentation | October 2016
Condition Monitoring: VibraCheck
Autonomous condition monitoring
system for vibration measurement
Features (selection):
mobile signal transmission,
remote control, automatic alerts,
data evaluation
(e.g. of the amplitude spectrum)
iMaintenance: intelligent maintenance
Mobile application for optimization of
inspection and maintenance intervals
Features (selection): collection and
evaluation of process- and experience-
based data about inspection and
maintenance, deduction of recommended
optimization measures regarding
inspection and maintenance intervals
Mobile Maintenance
Optimized Work-Order-Management
System sends orders directly to the
respective employee
Features (selection):
time recording, material consumption,
barcode-identification, documentation
including pictures (as basis for quick
service acceptance and settlement)
Time recording using fingerprint scan
Fingerprint scan to document start
and end of presence at construction
site
Features (selection): work time
documentation, validity checks,
transmission to ERP-system
Page 18

Further change from “provider of single services relationship”
to a “knowledge-based partnership“
Bilfinger SE | Company Presentation | October 2016
Strategic Partnership
Value generation Cost minimization
Individual Services
Simple Supply and Service
Relationship
Rotating Equipment
Static Equipment
Electrical
Instrumentation and Control Technology
Valves Services
Insulation, Scaffolding, Corrosion Protection
Industrial Cleaning etc.
Bundling of Services
Segment Mechanical Services
Segment E/I&C Services
Modification and Extension
Turnaround
System Service Provider
Integrated Asset Service
Main Contract Value
Performance Contract
(Outsourcing)
Page 19
Optimized maintenance cycles, win-win for service provider and customer

Summary
▪ Strong position as market leader in Europe
▪ Faster growing markets outside Europe
▪ Increasing demand for advanced asset performance services
▪ Significant resources available to exploit growth potentials
Page 20
Divestment of Building and Facility supports the funding
Bilfinger SE | Company Presentation | October 2016

1. Bilfinger at a glance
2. Sale of Building and Facility
3. Industrial at a glance
4. Update on Power
5. Facts and Figures Q2 2016
6. Financial backup
Agenda
page 21 Bilfinger SE | Company Presentation | October 2016

2015: Output volume of € 1.3 billion, adjusted EBITA of € -69 million
Approx. 10,000 employees
Customer focus: Energy sector
Approx. 80% project business
Power at a glance
Page 22
€ 1.3bn output volume
employees
project business thereof ~80%
10,000 Approx.
Bilfinger SE | Company Presentation | October 2016

Update on Power:
Process is now geared towards sale of single units
Result of the selling process until June 2016:
None of the bids for the entire business reflect the true value
A number of attractive indicative bids for single units have been received
even without targeted marketing approach
Sale of single units allows for a more targeted approach, potential buyers
vary from business to business
Own restructuring and repositioning as alternative way to increase value
Bilfinger SE | Company Presentation | October 2016 Page 23
Driving value-enhancing development, including sale of single units

1. Bilfinger at a glance
2. Sale of Building and Facility
3. Industrial at a glance
4. Update on Power
5. Facts and Figures Q2 2016
6. Financial backup
Agenda
page 24 Bilfinger SE | Company Presentation | October 2016

▪ Adjusted EBITA: substantial improvement compared to
weak prior year
▪ Industrial: book to bill at 1, earnings at prior-year level, efficiency
measures taking effect
▪ Power: orders received and output volume decline further;
earnings still negative but improved
▪ Cash flow from operating activities below prior year
▪ Outlook for 2016 confirmed and specified
January to June 2016: Business Highlights
Business development in line with expectations
Bilfinger SE | Company Presentation | October 2016 page 25

▪ Pure play Industrial opens new perspectives
▪ Cash inflow allows for strategic investments in growth fields
▪ Power business will be further developed to optimize value
▪ Realignment of administration will reduce costs, simplify
structures and increase performance
▪ Investment program established for Group-wide harmonization of
IT infrastructure
January to June 2016: Strategic Highlights
Sale of Building and Facility to EQT for EV of € 1.4 bn
Bilfinger SE | Company Presentation | October 2016 page 26

3,537
2,677
Q1-Q2 2015 Q1-Q2 2016
2,297
2,039
Q1-Q2 2015 Q1-Q2 2016
January to June 2016:
Decrease in output volume and orders received as expected
Bilfinger SE | Company Presentation | October 2016 page 27
Order backlog
-24%
organic -20%
Orders received
-11%
organic -8%
Output volume
-11%
organic -8%
2,412
2,141
Q1-Q2 2015 Q1-Q2 2016
in € million in € million in € million
All figures refer to continuing operations unless stated otherwise

January to June 2016:
Substantial improvement in earnings compared to weak prior year
Bilfinger SE | Company Presentation | October 2016 page 28
Net profit*
-439
-134
Q1-Q2 2015 Q1-Q2 2016
in € million
All figures refer to continuing operations unless stated otherwise * includes continuing and discontinued operations
-59
-13
Q1-Q2 2015 Q1-Q2 2016
-48
-15
Q1-Q2 2015 Q1-Q2 2016
Adjusted net profit
Adjusted EBITA
in € million in € million

-139
-285
Q1-Q2 2015 Q1-Q2 2016
-22
-124
Q1-Q2 2015 Q1-Q2 2016
Free cash flow
January to June 2016:
Operating cash flow below prior-year level due to restructuring payments as
well as increase in working capital
Bilfinger SE | Company Presentation | October 2016 page 29
in € million in € million
All figures refer to continuing operations unless stated otherwise
Operating cash flow

January to June 2016:
Business development in both segments as expected
Bilfinger SE | Company Presentation | October 2016 page 30
Industrial
76%
Power
24%
45
-17
Industrial Power
Output volume*
EBITA adjusted
* Before consolidation/others
in € million Q1-Q2 2016 Q1-Q2 2015 Year-on-year
Industrial 1,622 1,781 -9%
Power 505 607 -17%
Consolidation/other 14 24
Group 2,141 2,412 -11%
in € million Q1-Q2 2016 Q1-Q2 2015 Year-on-year
Industrial 45 48 -6%
Power -17 -71 +76%
Consolidation/other -41 -36
Group -13 -59 +78%

in € million Q2 2016 Q2 2015 Change FY 2015
Output volume 834 946 -12% 3,650
Orders received 825 876 -6% 3,302
Order backlog 2,001 2,416 -17% 2,101
Capital expenditure 14 10 40% 47
Depreciation of P, P & E 15 24 -38% 70
EBITA adjusted 31 39 -21% 128
EBITA margin adjusted 3.7% 4.1% 3.5%
Market situation
▪ Europe:
Good demand for turnarounds
Industrial scaffolding solid; highly-competitive environment for plant insulation in GER
Business development in British and Scandinavian oil and gas sector remains restrained
Generally limited willingness to invest in projects except for biotech pharma industry
▪ United States:
Project business negatively impacted after the end of the shale gas boom
Demand for maintenance in process industry more stable
Industrial:
Stable demand for maintenance services in chemical and
pharmaceutical industries
Bilfinger SE | Company Presentation | October 2016 page 31
24% Germany
57% Rest of Europe
17% America
FY 2016e
2% Asia
Output volume by region
*In Q2 2015: thereof €7m exceptional depreciation (restructuring Industrial)
*

Quarterly development
▪ Organic development in orders
received almost stable
▪ Lower EBITA due to lower output
volume, mainly in European oil
and gas sector, as well as weak
environment for US project
business
▪ Efficiency enhancement measures
start to take effect – will show
even higher impact in second half
Industrial:
Book-to-bill at 1
Bilfinger SE | Company Presentation | October 2016 page 32
in € million Q2 2016
reported Year-on-year Organic
Output volume 834 -12% -8%
Orders received 825 -6% -2%
EBITA adjusted 31 -21% -17%
0
200
400
600
800
1,000
0%
2%
4%
6%
Q2 2015 Q3 2015 Q4 2015 Q1 2016 Q2 2016
Output volume
EBITA margin adjusted

Market situation
▪ Fossil fuel power plants:
Germany and other European countries: Substantial price pressure due to market
over-capacities, demand for services declining as a result of insufficient capacity
utilization and profitability of the power plants
South Africa and Middle East: Stable demand in services business
▪ Nuclear Power:
Individual projects in Germany and abroad offer medium term prospects
Power:
Demand in project business remains low
Bilfinger SE | Company Presentation | October 2016 page 33
Output volume by region
FY 2016e
41% Rest of Europe
27% Germany
2% America
14% Africa
16% Asia
*In Q2 2016: thereof €14m (in FY 2015: thereof €14m) exceptional depreciation (restructuring Power)
*
in € million Q2 2016 Q2 2015 Change FY 2015
Output volume 258 320 -19% 1,284
Orders received 189 262 -28% 986
Order backlog 650 1,050 -38% 762
Capital expenditure 2 2 0% 9
Depreciation of P, P & E 18 6 200% 37
EBITA adjusted -11 -53 79% -69
EBITA margin adjusted -4.3% -16.6% -5.4%
*

Quarterly development
▪ Orders received on low level due
to substantially fewer projects in
the market for fossil fuel power
plants
▪ Still negative, but significantly
improved EBITA adjusted through
positive effects from capacity
adjustments and reduced project
losses based on better risk
management
Power:
Reduction in output volume due to sustained market weakness
Bilfinger SE | Company Presentation | October 2016 page 34
in € million Q2 2016
reported Year-on-year Organic
Output volume 258 -19% -13%
Orders received 189 -28% -20%
EBITA adjusted -11 +79% +77%
0
200
400
-20%
-15%
-10%
-5%
0%
5%
Q2 2015 Q3 2015 Q4 2015 Q1 2016 Q2 2016
Output volume EBITA margin adjusted

Outlook FY 2016
Outlook confirmed despite weak environment for US project business
Efficiency enhancement measures with higher impact in second half
Output volume Adjusted EBITA
in € million 2015 expected 2016 2015 expected 2016
Industrial 3,650 significant decrease to
about €3.1 billion 128 at prior-year level
Power 1,284 significant decrease
to about €1.0 billion -69
significant improvement,
but still negative
HQ/Others* 68 - -82 -
Group 5,002 significant decrease
to about €4.1 billion -23 significant improvement
* Including Government Services
Definition for the qualified comparative forecast:
at prior-year level: + / -0%; slight: 1-5%; significant: > 5%
Bilfinger SE | Company Presentation | October 2016 page 35

Outlook FY 2016
Special items
In 2016, from today’s perspective, we expect the following significant special items:
Capital gain from the sale of the Building and Facility segment of ~ €500 million
One-time expenses for the program to reduce administrative expenses in the high double-digit million euro range.
This includes investments of over €50 million for the harmonization of our IT systems, of which a small portion will
be incurred in 2016. Restructuring costs are also included, of which the majority will be recognized in profit or loss
in the current year.
In the Power business segment, additional restructuring expenses in the mid double-digit million euro range as
well as extraordinary non-cash impairments on tangible assets in the amount of €14 million.
A substantial portion of the one-time expenses in connection with the further development of our compliance
system and the conclusion of older cases in the total amount of approximately €50 million.
Reported net profit will also be burdened by the non-capitalization of deferred tax assets on the negative result
of the holding.
Bilfinger SE | Company Presentation | October 2016 page 36
Backup

1. Bilfinger at a glance
2. Sale of Building and Facility
3. Industrial at a glance
4. Update on Power
5. Facts and Figures Q2 2016
6. Financial backup
Agenda
Bilfinger SE | Company Presentation | October 2016 page 37

Q2 2016
Volume and contract overview
Bilfinger SE | Company Presentation | October 2016 page 38
Backup
in € million Q2 2016 Q2 2015 Change Q2 2016 Q2 2015 Change Q2 2016 Q2 2015 Change
Industrial 834 946 -12% 825 876 -6% 2,001 2,416 -17%
Power 258 320 -19% 189 262 -28% 650 1,050 -38%
Consolidation/ Other 5 15 12 46 26 71
Continuing
Operations1,097 1,281 -14% 1,026 1,184 -13% 2,677 3,537 -24%
Output volume Orders received Order backlog

in € million H1 2016 H1 2015 Change H1 2016 H1 2015 Change H1 2016 H1 2015 Change
Industrial 1,622 1,781 -9% 1,607 1,716 -6% 2,001 2,416 -17%
Power 505 607 -17% 419 586 -28% 650 1,050 -38%
Consolidation/ Other 14 24 13 -5 26 71
Continuing
Operations2,141 2,412 -11% 2,039 2,297 -11% 2,677 3,537 -24%
Output volume Orders received Order backlog
Q1-Q2 2016
Volume and contract overview
Bilfinger SE | Company Presentation | October 2016 page 39
Backup

FY 2015
Volume and contract overview (new structure)
Bilfinger SE | Company Presentation | October 2016 page 40
Backup
Output Volume Orders received Order backlog
in € million FY 2015 FY 2015 FY 2015
Industrial 3,650 3,302 2,101
Power 1,284 986 762
Consolidation/ Other 68 13 39
Continuing Operations 5,002 4,301 2,902

Organic development output volume
Bilfinger SE | Company Presentation | October 2016 page 41
Backup
in € million H1 2015 Δ Net acquisitions Δ F/X Δ Organic H1 2016
Industrial 1,781 -12 -1% -29 -1% -118 -7% 1,622 -9%
Power 607 -12 -2% -20 -4% -70 -11% 505 -17%
Continuing Operations 2,412 -25 -1% -49 -2% -197 -8% 2,141 -11%
in € million Q2 2015 Δ Net acquisitions Δ F/X Δ Organic Q2 2016
Industrial 946 -12 -1% -21 -3% -79 -8% 834 -12%
Power 320 -12 -3% -9 -3% -41 -13% 258 -19%
Continuing Operations 1,281 -25 -2% -30 -2% -129 -10% 1,097 -14%

Organic development orders received
Bilfinger SE | Company Presentation | October 2016 page 42
Backup
in € million Q2 2015 Δ Net acquisitions Δ F/X Δ Organic Q2 2016
Industrial 876 -14 -2% -17 -2% -20 -2% 825 -6%
Power 262 -12 -5% -8 -3% -53 -20% 189 -28%
Continuing Operations 1,184 -26 -2% -25 -2% -107 -9% 1,026 -13%
in € million H1 2015 Δ Net acquisitions Δ F/X Δ Organic H1 2016
Industrial 1,716 -14 -1% -28 -1% -67 -4% 1,607 -6%
Power 586 -12 -2% -15 -2% -140 -24% 419 -28%
Continuing Operations 2,297 -26 -1% -43 -2% -189 -8% 2,039 -11%

Organic development EBITA adjusted
Bilfinger SE | Company Presentation | October 2016 page 43
Backup
in € million Q2 2015 Δ Net acquisitions Δ F/X Δ Organic Q2 2016
Industrial 39 -1 -2% -1 -2% -6 -17% 31 -21%
Power -53 0 -1% 2 +3% 40 +77% -11 +79%
Continuing Operations -34 -1 -2% 1 +3% 36 +105% 2 +106%
in € million H1 2015 Δ Net acquisitions Δ F/X Δ Organic H1 2016
Industrial 48 -1 -2% -1 -2% -1 -2% 45 -6%
Power -71 0 0% 1 2% 53 +74% -17 +76%
Continuing Operations -59 -1 -1% -1 -1% 48 +80% -13 +78%

Income statement
Bilfinger SE | Company Presentation | October 2016 page 44
Backup
in € million Q1-Q2 2016 Q1-Q2 2015 FY 2015 Comments Q1-Q2 2016
Output volume 2,141 2,412 5,002
EBITA -118 -44 -157
EBITA adjusted -13 -59 -23 See separate slide „Overview of earnings adjustments“
EBITA margin adjusted -0.6% -2.4% -0.5%
Amortization 6 338 344 FY 2016e: ~€10m
EBIT -124 -382 -501 Depreciation of P, P&E: €54m
Net interest result -11 -17 -30 In Q1-Q2 2015 higher interest expenses due to a project financing in Power
EBT -135 -399 -531
Income taxes -11 -68 -60 Nearly no deferred taxes were capitalized for tax losses
Earnings after taxes from continuing
operations -146 -467 -591
Earnings after taxes from discontinued
operations 10 23 64
Operating result of divisions sold to EQT €26m, Concessions €0m, result
from the sale of Water division -€16m, operating result Water division -€3m,
operating result Offshore and the former Construction activities €2m
Minority interest 2 5 17
Net profit -134 -439 -510
Net profit adjusted (continuing operations) -15 -48 -30

Overview of earnings adjustments
Bilfinger SE | Company Presentation | October 2016 page 45
Backup
in € million Q1-Q2 2016 Q1-Q2 2015 FY 2015 Comments Q1-Q2 2016
EBITA -118 -44 -157
Adjustments special items (pre-tax) 105 -15 134
In Q1-Q2 2016: restructuring (particularly Power) €43m
Sale of Engineering Services Asian Pacific and MCE Stahlbau, reversal of the
acquisition of Mauell as well as sales related expenses €28m
Impairments on tangible assets Power €14m
Efficiency enhancements headquarters €12m
Further development compliance system €8m
In Q1-Q2 2015: capital gain from the sale and re-evaluation of Nigerian activities and
sale of remaining concessions activities -€58m
Restructuring (particularly Industrial) €24m
Impairments on tangible assets Industrial €7m
Sales related expenses €4m
Efficiency enhancements headquarters €4m
Further development compliance system €4m
EBITA adjusted -13 -59 -23
Net interest -11 -17 -30
Normalized/ Underlying tax rate 7 24 16 Normalized tax rate of 31%
Minorities 2 4 7
Net Profit adjusted continuing operations -15 -48 -30
EPS adjusted continuing operations -0.34 -1.09 -0.68

Bilfinger SE | Company Presentation | October 2016 page 46
1,378
196
June 30, 2016
Equity and Liabilities
4,596
1,167
144
523
June 30, 2016
296
96
Assets
4,596
855
1,322
1,048
421
162
1,584 -269
-231
-2
+3
-50
-40
-589 -589
-98
-232
-9 +3
+1
-3
-251
Assets held for sale
Cash and cash equivalents
Receivables and other current assets
Other non-current assets
Property, plant and equipment
Intangible assets1)
Compared to pro-forma balance sheet as of Dec. 31, 2015
1) Thereof goodwill €844 million (including intangibles
from acquisitions)
Liabilities held for sale
Other current liabilities
Prepayments received
Other non-current liabilities
Pension provisions
Financial debt
Shareholders’ equity
in € million
Balance sheet
Backup

Valuation net debt
Bilfinger SE | Company Presentation | October 2016 page 47
Backup
* Pro-forma balance sheet as of Dec. 31, 2015
in € million Jun. 30, 2016 Dec. 31, 2015* Comments Jun. 30, 2016
Cash and cash equivalents 196 427 See cash flow statement for details of change
Financial debt -523 -526 Including €500 million corporate bond (due Dec. 2019)
Net cash (+) / net debt (-) -327 -99
Pension provisions -296 -295
Increase due to lower discount rate (from 2.25% to 1.30% in Euro-
Zone), offset by deconsolidation of Mauell (€36m)
Expected cash-in disposals Approx. 935 Approx. 1,125 Expected sale of Building and Facility divisions €900 million
Expected sale Nigerian activities €35m
Inter-company loan Building and Facility divisions sold to EQT -77 -180
Financial assets (disposal Building and Facility divisions) 300 300 Approx. €200 million earn-out agreement and approx. €100 million
vendor’s claim
Future cash-out restructuring and risk provisions Approx. -180 Approx. -223
Including future cash-out restructuring Industrial and Power, SG&A
efficiency program (approx. €160m)
and legacy (Tubin, approx. €20m)
Future cash-out Compliance -40 -50
Further intra-year working capital need (seasonal shift) - -150 to -200
Valuation cash (+) / net debt (-) Approx. 300 Approx. 400

Cashflow statement
page 48 Bilfinger SE | Company Presentation | October 2016
Backup
in € million Q1-Q2 2016 Q1-Q2 2015 FY 2015 Comments Q1-Q2 2016
Cash earnings from continuing operations -81 -49 -122
Change in working capital -218 -51 203 Typical intra-year increase in working capital, though more pronounced
as in previous year. Power in previous year with extraordinary lower working capital.
Gains on disposals of non-current assets 14 -39 -42 Contains expenses from disposals
Cash flow from operating activities of continuing operations -285 -139 39
Net capital expenditure on property, plant and equipment /
intangibles -17 -19 -36 Gross Capex FY 2016e: up to 100m EUR
Proceeds from the disposal of financial assets 178 136 214 Esp. cash inflow from the sale of Water division
Free cash flow (continuing operations) -124 -22 217
Investments in financial assets of continuing operations -2 -1 -4
Cash flow from financing activities of continuing operations -4 -3 -105
Change in cash and cash equivalents of continuing
operations -130 -26 108
Change in cash and cash equivalents of discontinued
operations -110 -93 -45 Thereof divisions sold to EQT: -€61m, Construction: -€27m, Offshore: -€30m
F/X effects -1 4 2
Cash and cash equivalents at Jan. 1 475 403 403 Change in cash and cash equivalents classified as assets held for
sale -38 -51 7
Cash and cash equivalents at Jun. 30 196 237 475

▪ The Building, Facility Services and Real Estate divisions
were sold in June 2016 to financial investor EQT, the
transaction is expected to be completed in the third
quarter of 2016.
▪ Output volume: In the magnitude of the prior year.
▪ Orders received: Below unusually high prior-year figure,
typical volatility in this business.
▪ Adjusted EBITA: At prior-year level.
Discontinued operations: Building and Facility
Bilfinger SE | Company Presentation | October 2016 page 49
Backup
in € million H1 2016 H1 2015 Change FY 2015
Output volume 1,165 1,183 -2% 2,501
Orders received 1,207 1,774 -32% 3,286
Order backlog 2,625 2,410 9% 2,581
Capital expenditure 6 10 -40% 16
Depreciation of P, P & E 4 4 0% 17
EBITA adjusted 45 47 -4% 126
EBITA margin adjusted 3.9% 4.0% 5.0%
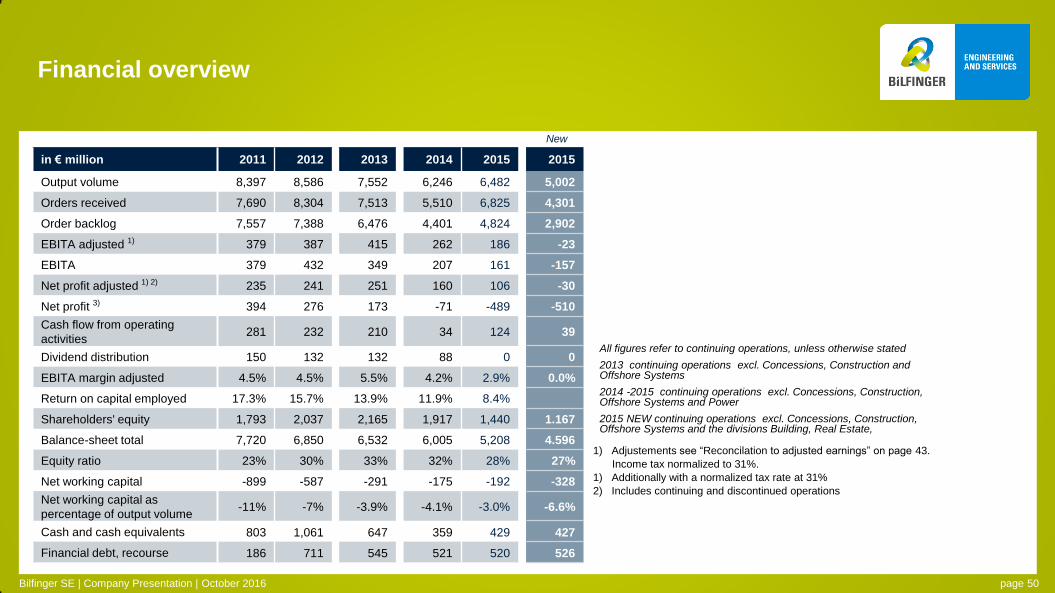
in € million 2011 2012 2013 2014 2015 2015
Output volume 8,397 8,586 7,552 6,246 6,482 5,002
Orders received 7,690 8,304 7,513 5,510 6,825 4,301
Order backlog 7,557 7,388 6,476 4,401 4,824 2,902
EBITA adjusted 1) 379 387 415 262 186 -23
EBITA 379 432 349 207 161 -157
Net profit adjusted 1) 2) 235 241 251 160 106 -30
Net profit 3) 394 276 173 -71 -489 -510
Cash flow from operating
activities 281 232 210 34 124 39
Dividend distribution 150 132 132 88 0 0
EBITA margin adjusted 4.5% 4.5% 5.5% 4.2% 2.9% 0.0%
Return on capital employed 17.3% 15.7% 13.9% 11.9% 8.4%
Shareholders' equity 1,793 2,037 2,165 1,917 1,440 1.167
Balance-sheet total 7,720 6,850 6,532 6,005 5,208 4.596
Equity ratio 23% 30% 33% 32% 28% 27%
Net working capital -899 -587 -291 -175 -192 -328
Net working capital as
percentage of output volume -11% -7% -3.9% -4.1% -3.0% -6.6%
Cash and cash equivalents 803 1,061 647 359 429 427
Financial debt, recourse 186 711 545 521 520 526
Financial overview
1) Adjustements see “Reconcilation to adjusted earnings” on page 43.
Income tax normalized to 31%.
1) Additionally with a normalized tax rate at 31%
2) Includes continuing and discontinued operations
Bilfinger SE | Company Presentation | October 2016
All figures refer to continuing operations, unless otherwise stated
2013 continuing operations excl. Concessions, Construction and Offshore Systems
2014 -2015 continuing operations excl. Concessions, Construction, Offshore Systems and Power
2015 NEW continuing operations excl. Concessions, Construction, Offshore Systems and the divisions Building, Real Estate,
page 50
New

Shareholder structure
▪ High proportion of institutional investors
▪ International shareholder base
▪ Free float according to Deutsche Boerse: 70.39%
Treasury Stock
▪ 1,815,085 shares
▪ No cancellation planned
Shareholder structure
Bilfinger SE | Company Presentation | October 2016
Jun. 30, 2016
Treasury Stock 4%
Undisclosed/ Retail
Investors 35%
Institutional Investors: 61%
Cevian Capital 26%
Germany 9%
Switzerland 8%
UK 6%
USA 6%
Scandinavia 4%
France 1%
Other 1%
page 51

November 10, 2016
Interim Report Q3 2016
February 14, 2017
Preliminary Report FY 2016
March 15, 2017
Press conference on financial statements
May 15, 2017
Interim Report Q1 2017
May 24, 2017
Annual General Meeting
August 14, 2017
Interim Report Q2 2017
November 14, 2017
Interim Report Q3 2017
Financial calendar and share facts
1) Including 1,815,085 shares held as treasury stock
52 week high / low: € 45.35 / € 25.05 (as of October 27, 2016)
Closing price € 32.17 (as of October 27, 2016)
Market cap: 1) € 1.5 bn (as of October 27, 2016)
Shares outstanding: 1) 46,024,127
ISIN / Ticker abbreviation: DE0005909006 / GBF
Main stock markets: XETRA / Frankfurt
Segments Deutsche Boerse / Indices:
Prime Standard
MDAX,
DAXsubsector Industrial Products & Services Idx.,
Euro STOXX Low Carbon, STOXX Europe 600, Euro
STOXX, STOXX EUROPE TMI Support Services
Bilfinger SE | Company Presentation | October 2016 page 52

Bilfinger bond and rating
Bilfinger SE | Company Presentation | October 2016
ISIN / Stock exchange
abbreviation DE000A1R0TU2
WKN A1R0TU
Listing Luxembourg (official trading)
Emission volume € 500 million
Interest coupon 2.375%
Maturity December 07, 2019
Closing 103.84% (as of October 27, 2016)
Rating Agency Standard & Poors
Current Corporate
Credit Rating BB+ / Stable Outlook / B
page 53
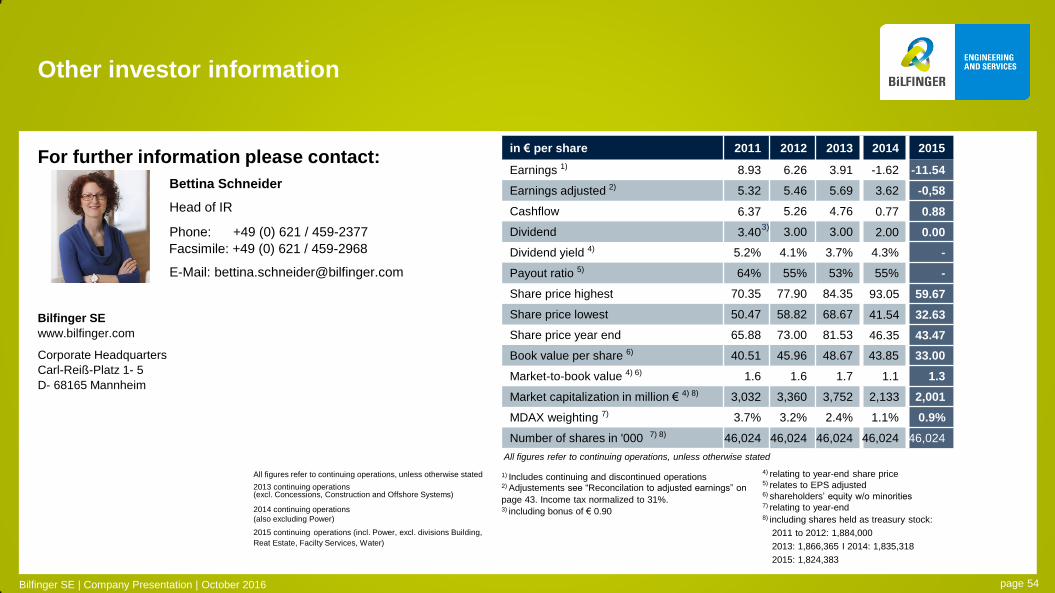
For further information please contact:
Bettina Schneider
Head of IR
Phone: +49 (0) 621 / 459-2377
Facsimile: +49 (0) 621 / 459-2968
E-Mail: [email protected]
Bilfinger SE
www.bilfinger.com
Corporate Headquarters
Carl-Reiß-Platz 1- 5
D- 68165 Mannheim
Other investor information
1) Includes continuing and discontinued operations
2) Adjustements see “Reconcilation to adjusted earnings” on
page 43. Income tax normalized to 31%. 3) including bonus of € 0.90
in € per share 2011 2012 2013 2014 2015
Earnings 1) 8.93 6.26 3.91 -1.62 -11.54
Earnings adjusted 2) 5.32 5.46 5.69 3.62 -0,58
Cashflow 6.37 5.26 4.76 0.77 0.88
Dividend 3.40 3.00 3.00 2.00 0.00
Dividend yield 4) 5.2% 4.1% 3.7% 4.3% -
Payout ratio 5) 64% 55% 53% 55% -
Share price highest 70.35 77.90 84.35 93.05 59.67
Share price lowest 50.47 58.82 68.67 41.54 32.63
Share price year end 65.88 73.00 81.53 46.35 43.47
Book value per share 6) 40.51 45.96 48.67 43.85 33.00
Market-to-book value 4) 6) 1.6 1.6 1.7 1.1 1.3
Market capitalization in million € 4) 8) 3,032 3,360 3,752 2,133 2,001
MDAX weighting 7) 3.7% 3.2% 2.4% 1.1% 0.9%
Number of shares in '000 7) 8) 46,024 46,024 46,024 46,024 46,024
3)
Bilfinger SE | Company Presentation | October 2016
4) relating to year-end share price
5) relates to EPS adjusted 6) shareholders’ equity w/o minorities 7) relating to year-end 8) including shares held as treasury stock:
2011 to 2012: 1,884,000
2013: 1,866,365 I 2014: 1,835,318
2015: 1,824,383
All figures refer to continuing operations, unless otherwise stated
All figures refer to continuing operations, unless otherwise stated
2013 continuing operations (excl. Concessions, Construction and Offshore Systems)
2014 continuing operations
(also excluding Power)
2015 continuing operations (incl. Power, excl. divisions Building,
Reat Estate, Facilty Services, Water)
page 54

Disclaimer
Bilfinger SE | Company Presentation | October 2016 page 55
This presentation has been produced for support of oral information purposes only and contains
forward-looking statements which involve risks and uncertainties. Forward-looking statements are statements
that are not historical facts, including statements about our beliefs and expectations. Such statements made
within this document are based on plans, estimates and projections as they are currently available to Bilfinger
SE. Forward-looking statements are therefore valid only as of the date they are made, and we undertake no
obligation to update publicly any of them in light of new information or future events. Apart from this, a number
of important factors could therefore cause actual results to differ materially from those contained in any
forward-looking statement. Such factors include the conditions in worldwide financial markets as well as the
factors that derive from any change in worldwide economic development.
This document does not constitute any form of offer or invitation to subscribe for or purchase any securities. In
addition, the shares of Bilfinger SE have not been registered under United States Securities Law and may not
be offered, sold or delivered within the United States or to U.S. persons absent registration under or an
applicable exemption from the registration requirements of the United States Securities Law.