Embed Size (px)
Citation preview
Big Sky Regional Carbon
Sequestration Partnership – Kevin
Dome Carbon StorageFC26-05NT42587
Lee Spangler, Montana State University
U.S. Department of Energy
National Energy Technology Laboratory
Carbon Storage R&D Project Review Meeting
Transforming Technology through Integration and Collaboration
August 18-20, 2015

Acknowledgments
• US Department of Energy
• Altamont Oil & Gas, Inc.
• Columbia University & Barnard College
• Idaho National Laboratory
• Los Alamos National Laboratory
• Lawrence Berkeley National Laboratory
• Schlumberger Carbon Services
• SWCA Environmental Consultants
• Vecta Oil and Gas, Ltd.
• Washington State University
2
3
Presentation Outline
• Program Goals / Scope of Work / Goals & Objectives
• Project Overview
– Geology of Kevin Dome / Regional Significance
– Site Characteristics – Scientific Opportunities
• Site Characterization
• Modeling
• Monitoring
• Results to Date and Accomplishments
• Summary
4
Benefit to the Program
• Support industries' ability to predict CO2 storage capacity in geologic
formations to within ±30%
The project will correlate logs, core studies, seismic and modeling efforts
with multiple iterations through all stages of the project to determine
actual storage compared to predicted. The project also tests storage in
a regionally significant formation and in regionally significant structural
closures that should refine regional capacity estimates.
• Develop and validate technologies to ensure 99 percent storage
permanence.
The project will use 3D, 9C surface seismic, VSP, in zone and above
zone geochemical sampling, repeat pulsed neutron logging, tracers,
distributed T and P sensors and assurance monitoring techniques to
verify location that the CO2 remains in the storage complex.
5
Benefit to the Program
• Develop technologies to improve reservoir storage efficiency while
ensuring containment effectiveness.
Pulsed neutron logging and heat pulses to the reservoir combined with
distributed temperature sensing should provide saturation information
which can be studied as a function of injection rate. We will also
measure rock physics properties as a function of CO2 saturation to try to
improve understanding of seismic response to SCO2.
• Develop Best Practice Manuals for monitoring, verification,
accounting, and assessment; site screening, selection and initial
characterization; public outreach; well management activities; and
risk analysis and simulation.
BSCSP will use information from this project to contribute to best
practices manuals.
6
Project Overview: Goals and Objectives
Primary objective - Demonstrate that the target formation and other analogous
formations are a viable and safe target for sequestration of a large fraction of the
region’s CO2 emissions.
Success Criteria – Project safely injects CO2 into the storage formation and models
and monitoring indicate permanence of storage in the reservoir.
Other objectives include improving the understanding of injectivity, capacity, and
storativity in a regionally significant formation.
Success Criteria – Site characterization, laboratory core studies, well tests, models
coupled with operational data deepen understanding of use of site characterization
data for predicting geologic system performance. Comparison of natural analog data
with laboratory studies and geochemical sampling in the injection region improve
understanding of injected CO2 behavior in reactive rock.
7
Project Overview: Goals and Objectives
Operational objectives - Safely procure, transport, inject and monitor up to one
million tons of CO2 into the target formation; understand the behavior of the injected
CO2 within the formation; verify and improve predictive models of CO2 behavior; test
and validate monitoring, verification and accounting (MVA) methodology.
Success Criteria – Safe and successful injection; good history matching of multi-phase
flow and reactive transport models; monitoring techniques detect CO2 when present
and provide information of plume development.
Post-injection phase objective - Assess any resultant changes from the CO2
injection and to continue to monitor the CO2 plume.
Success Criteria – Continued detection of plume evolution and models showing
predictive capability.
Regional characterization objectives - Understand the costs of carbon
sequestration; determine the best management practices to sequester carbon in the
soil of agricultural systems; and refine regional assessments of CO2 sources and
capacity estimates.
8
Project Overview
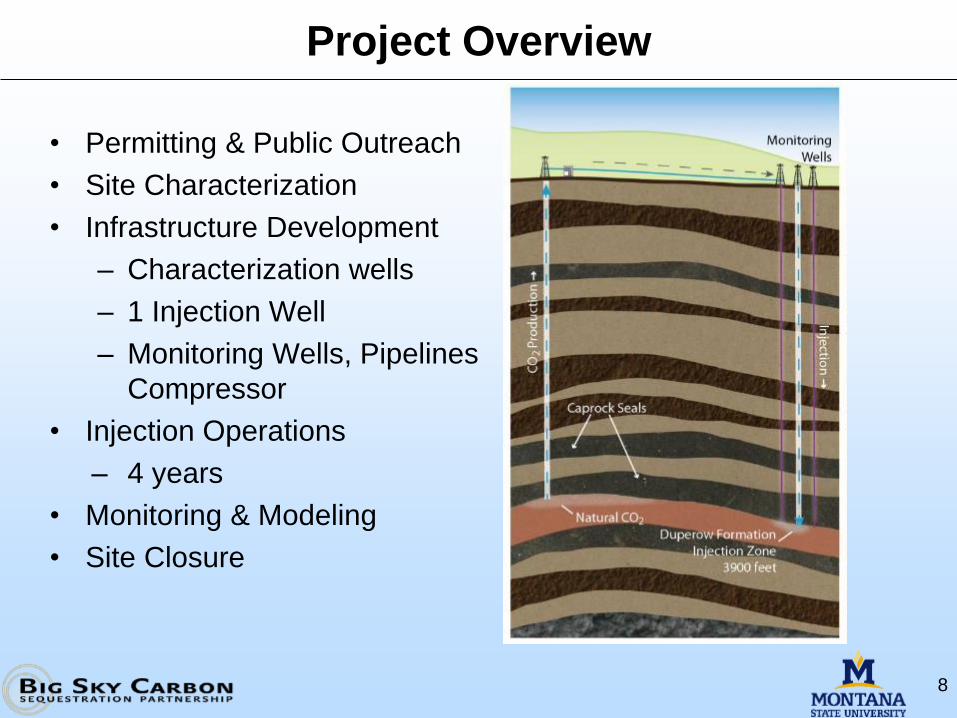
• Permitting & Public Outreach
• Site Characterization
• Infrastructure Development
– Characterization wells
– 1 Injection Well
– Monitoring Wells, Pipelines
Compressor
• Injection Operations
– 4 years
• Monitoring & Modeling
• Site Closure
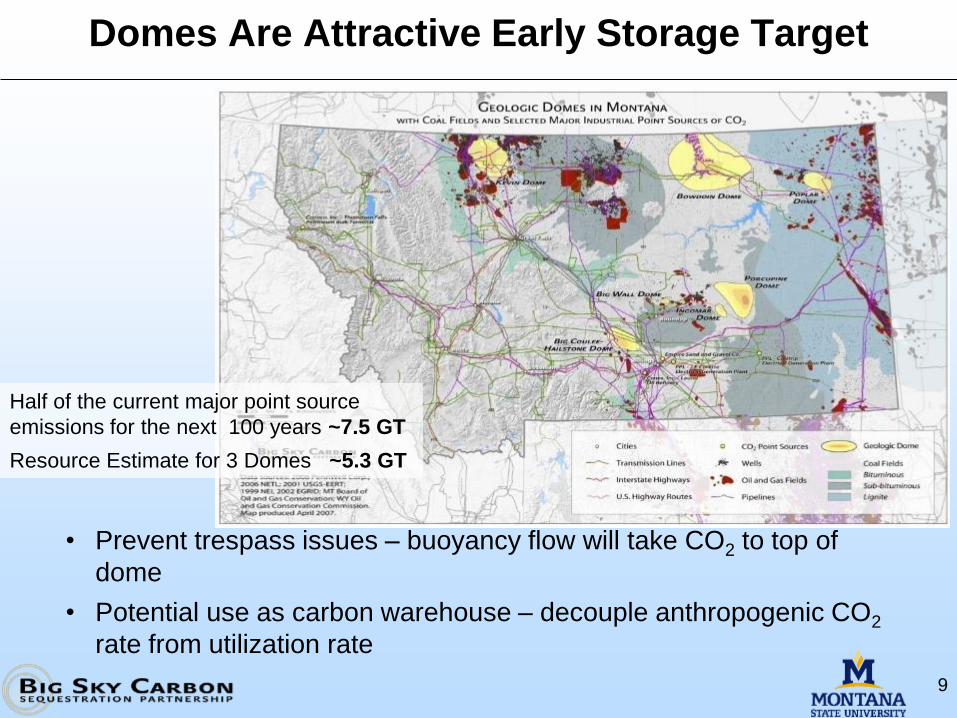
Domes Are Attractive Early Storage Target
9
Half of the current major point source
emissions for the next 100 years ~7.5 GT
Resource Estimate for 3 Domes ~5.3 GT
• Prevent trespass issues – buoyancy flow will take CO2 to top of
dome
• Potential use as carbon warehouse – decouple anthropogenic CO2
rate from utilization rate
Kevin Dome
10
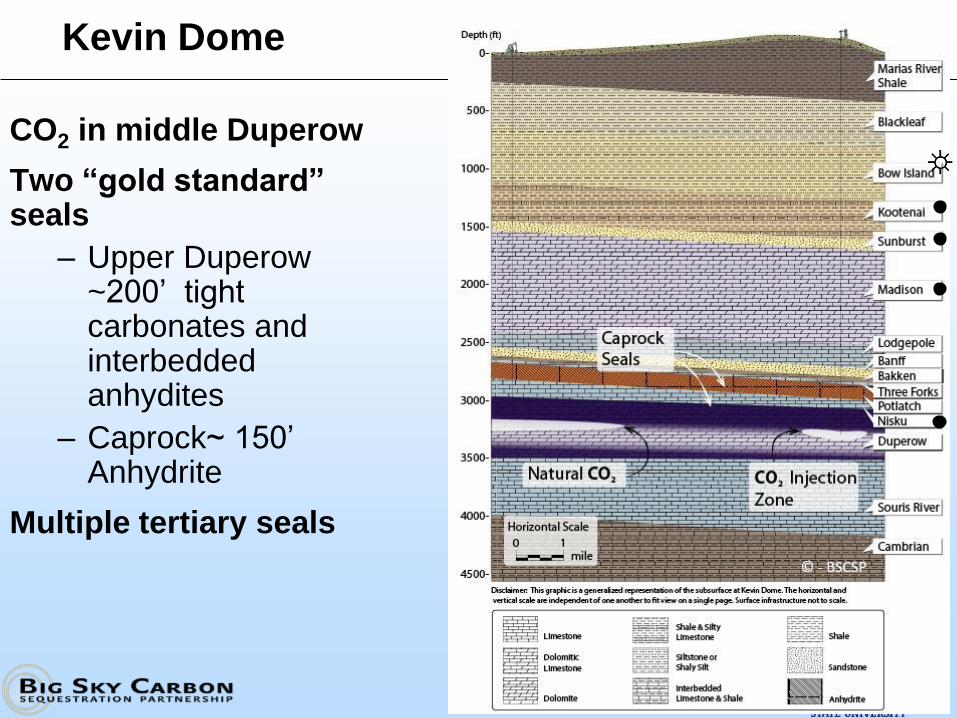
CO2 in middle Duperow
Two “gold standard” seals
– Upper Duperow~200’ tight carbonates and interbeddedanhydites
– Caprock~ 150’ Anhydrite
Multiple tertiary seals
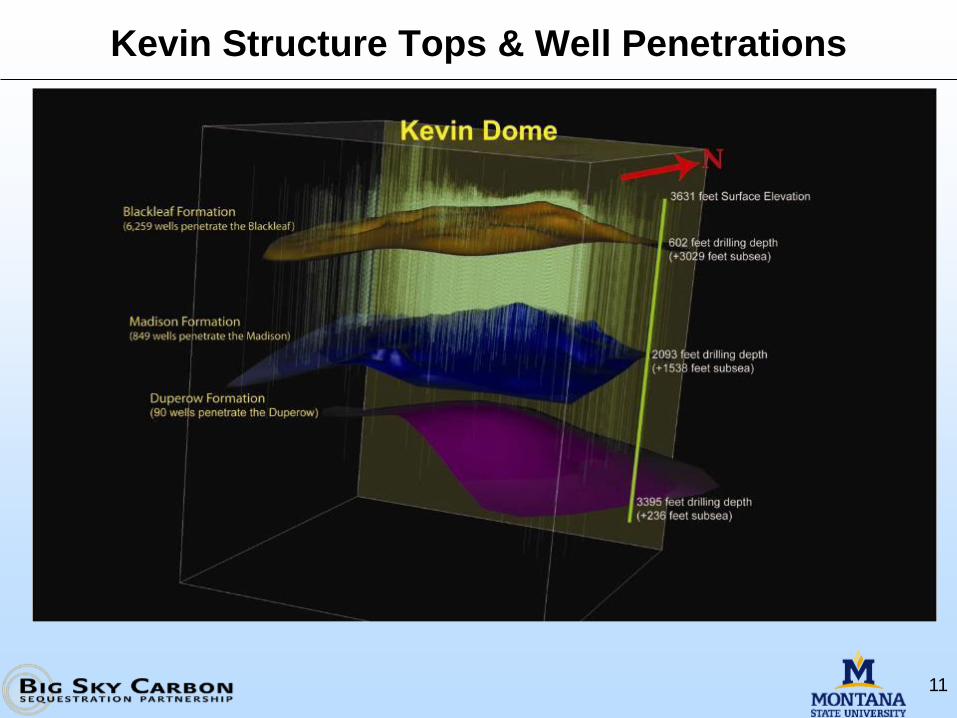
Kevin Structure Tops & Well Penetrations
11
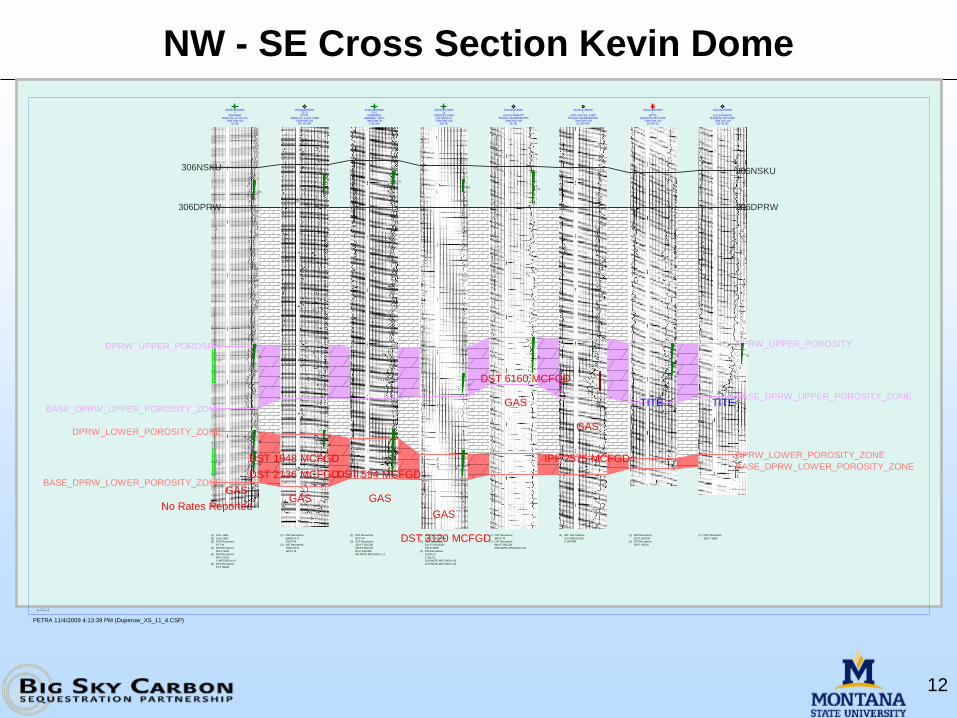
NW - SE Cross Section Kevin Dome
12
250350720600005
MCNAMERUNION OIL CO OF CAL
T36N R5W S15NE NE
2510123859000022-21
STATECABOT OIL & GAS CORP
T35N R4W S21SW SE NW
2510121208000022-6
ENNEBERGGRANNELL DRLG
T35N R3W S6C SE NW
251010772700002X
GOEDDEZ-AGENFULTON W M
T35N R3W S16SW NE
251010526300001
GLEN E MOFFATTTEXACO INCORPORATED
T34N R1W S30NE NE
251012179500001
POTLATCH OIL & REFTEXACO INCORPORATED
T34N R1W S29E2 SW NW
251012136600001
BATTSQUINTANA PET CORP
T33N R1W S12E2 NW SE
251012127500001
CULLEN-WEDINQUINTANA PET CORP
T33N R1E S18SW NE NE
306NSKU 306NSKU
306DPRW 306DPRW
DPRW_UPPER_POROSITY DPRW_UPPER_POROSITY
BASE_DPRW_UPPER_POROSITY_ZONE
BASE_DPRW_UPPER_POROSITY_ZONE
DPRW_LOWER_POROSITY_ZONE
DPRW_LOWER_POROSITY_ZONE
BASE_DPRW_LOWER_POROSITY_ZONE
BASE_DPRW_LOWER_POROSITY_ZONE
(1)
(2)
(3)
(4)
(5)
(6)
(1) Core: O&G
(2) Core: O&G
(3) DST Recoveries
6 FT M
(4) DST Recoveries
58 FT GCM
(5) DST Recoveries
50 FT GCM
0 MTS:GAS in 14
(6) DST Recoveries
5 FT SGCM
(1)
(2)
(1) DST Recoveries
89000 CF G
220 FT M
(2) DST Recoveries
77000 CF G
120 FT M
(1)
(2)
(1) DST Recoveries
40 FT M
(2) DST Recoveries
120 FT SGCZW
155 FT MGCZW
90 FT HGCZW
594 MCFD MTS:GAS in 11
(1)
(2)
(3)
(1) DST Recoveries
130 FT VSO&GCM
(2) DST Recoveries
110 FT HGCBZM
700 FT BZW
(3) DST Recoveries
10 GAL C
2 GAL M
3120 MCFD MTS:GAS in 15
2740 MCFD MTS:GAS in 60
(1)
(2)
(1) DST Recoveries
860 FT M
(2) DST Recoveries
840 FT BGCZM
6160 MCFD MTS:GAS in 33
(1)
(1) IPF: Test Volumes
2575 MCFD GAS
0 WATER
(1)
(2)
(1) DST Recoveries
20 FT ZHGCM
(2) DST Recoveries
20 FT HGCM
(1)
(1) DST Recoveries
330 FT BZW
HS=1131
PETRA 11/4/2009 4:13:39 PM (Duperow_XS_11_4.CSP)
GAS GAS
GAS
GAS
GAS
TITE TITE
IPF 2575 MCFGD
DST 6160 MCFGD
DST 3120 MCFGD
DST 594 MCFGD
GAS
DST 2136 MCFGD
DST 1848 MCFGD
No Rates Reported
Site Characteristics – Scientific Opportunities
13
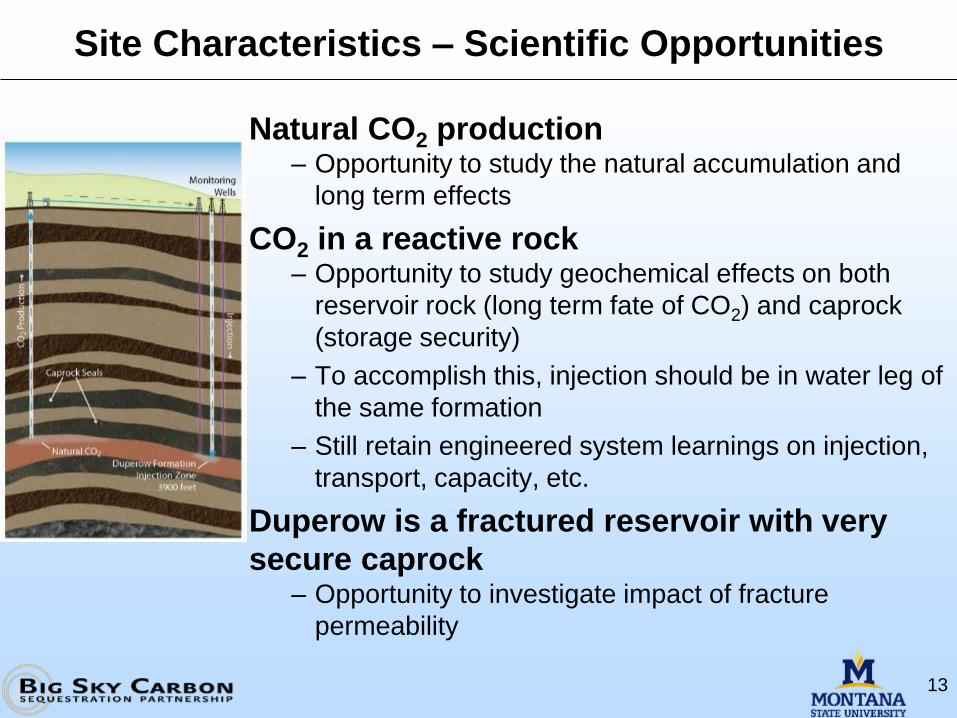
Natural CO2 production– Opportunity to study the natural accumulation and
long term effects
CO2 in a reactive rock– Opportunity to study geochemical effects on both
reservoir rock (long term fate of CO2) and caprock
(storage security)
– To accomplish this, injection should be in water leg of
the same formation
– Still retain engineered system learnings on injection,
transport, capacity, etc.
Duperow is a fractured reservoir with very
secure caprock– Opportunity to investigate impact of fracture
permeability
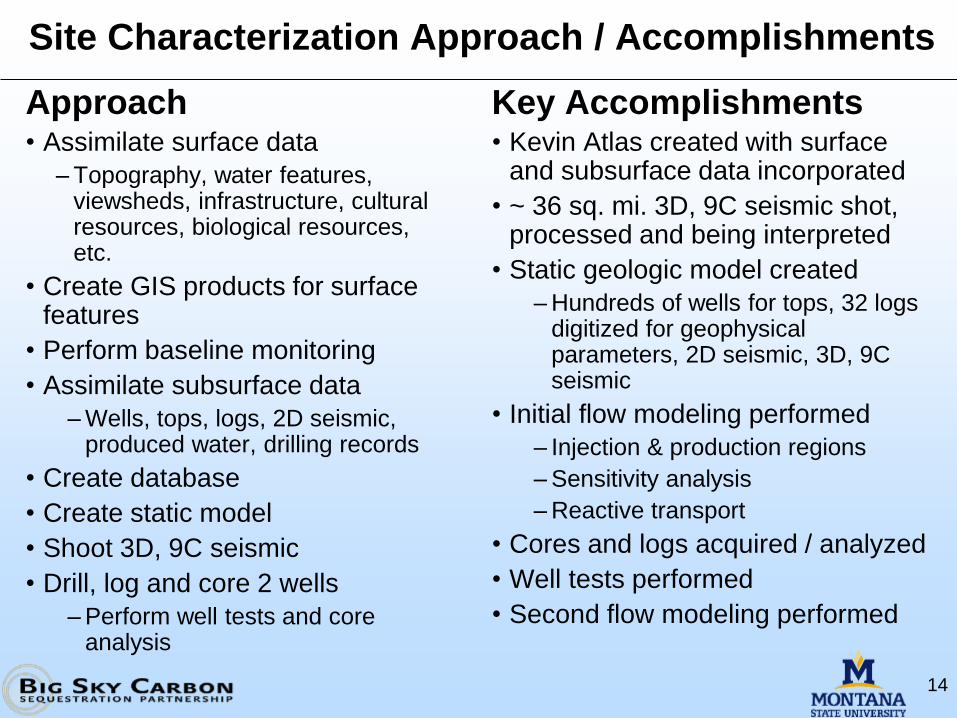
Site Characterization Approach / Accomplishments
Approach• Assimilate surface data
– Topography, water features, viewsheds, infrastructure, cultural resources, biological resources, etc.
• Create GIS products for surface features
• Perform baseline monitoring
• Assimilate subsurface data
– Wells, tops, logs, 2D seismic, produced water, drilling records
• Create database
• Create static model
• Shoot 3D, 9C seismic
• Drill, log and core 2 wells
– Perform well tests and core analysis
Key Accomplishments• Kevin Atlas created with surface
and subsurface data incorporated
• ~ 36 sq. mi. 3D, 9C seismic shot, processed and being interpreted
• Static geologic model created
– Hundreds of wells for tops, 32 logs digitized for geophysical parameters, 2D seismic, 3D, 9C seismic
• Initial flow modeling performed
– Injection & production regions
– Sensitivity analysis
– Reactive transport
• Cores and logs acquired / analyzed
• Well tests performed
• Second flow modeling performed
14
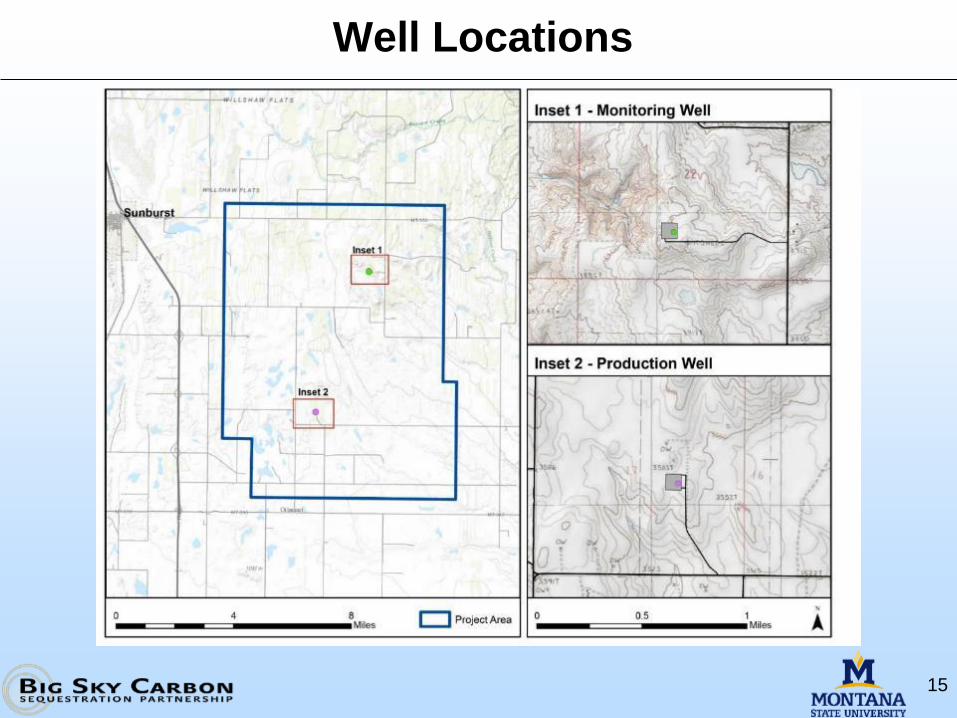
Well Locations
15
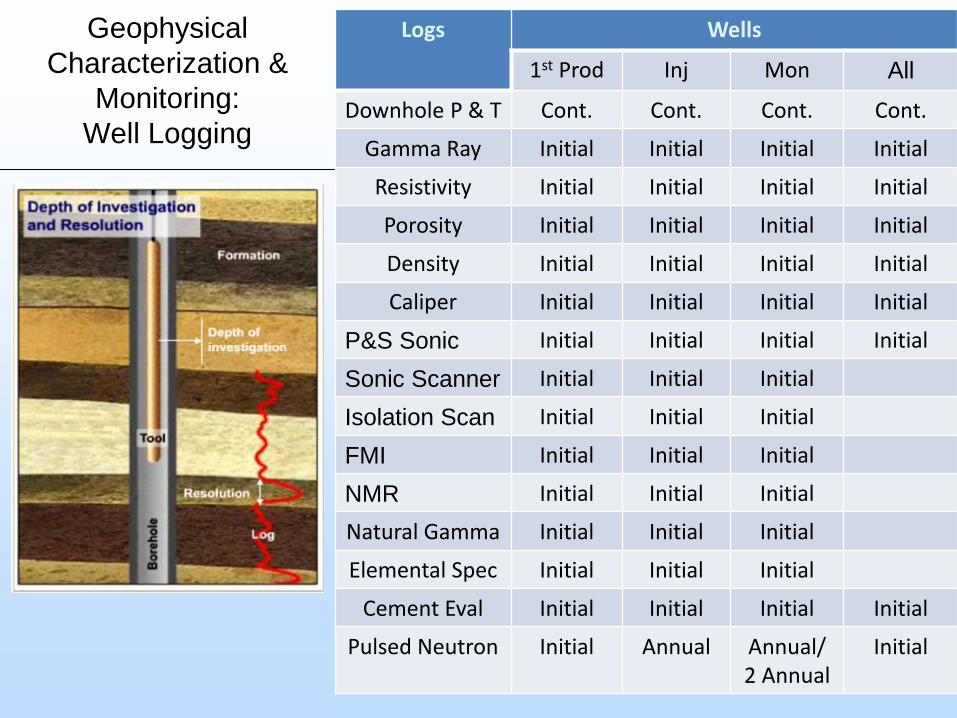
Geophysical
Characterization &
Monitoring:
Well Logging
16
Logs Wells
1st Prod Inj Mon All
Downhole P & T Cont. Cont. Cont. Cont.
Gamma Ray Initial Initial Initial Initial
Resistivity Initial Initial Initial Initial
Porosity Initial Initial Initial Initial
Density Initial Initial Initial Initial
Caliper Initial Initial Initial Initial
P&S Sonic Initial Initial Initial Initial
Sonic Scanner Initial Initial Initial
Isolation Scan Initial Initial Initial
FMI Initial Initial Initial
NMR Initial Initial Initial
Natural Gamma Initial Initial Initial
Elemental Spec Initial Initial Initial
Cement Eval Initial Initial Initial Initial
Pulsed Neutron Initial Annual Annual/ 2 Annual
Initial
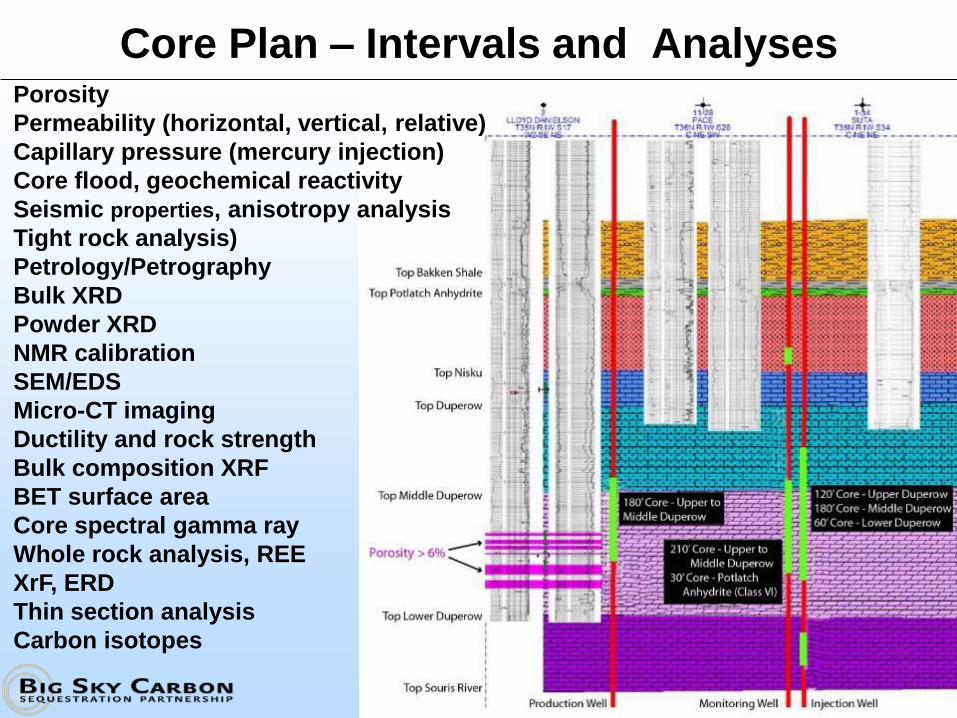
Core Plan – Intervals and AnalysesPorosity
Permeability (horizontal, vertical, relative)
Capillary pressure (mercury injection)
Core flood, geochemical reactivity
Seismic properties, anisotropy analysis
Tight rock analysis)
Petrology/Petrography
Bulk XRD
Powder XRD
NMR calibration
SEM/EDS
Micro-CT imaging
Ductility and rock strength
Bulk composition XRF
BET surface area
Core spectral gamma ray
Whole rock analysis, REE
XrF, ERD
Thin section analysis
Carbon isotopes
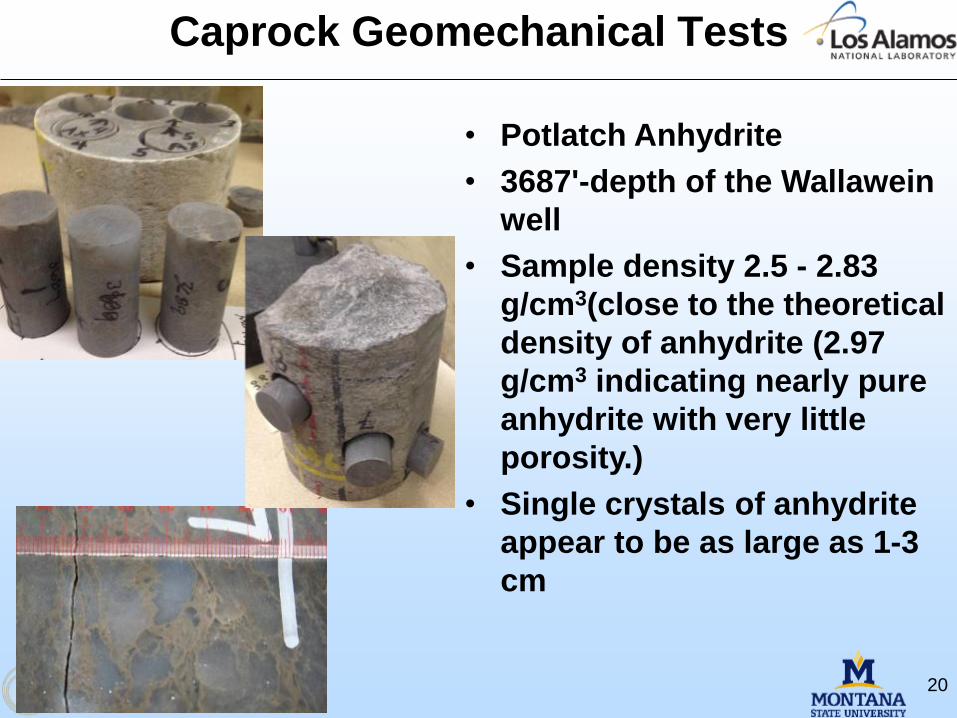
Caprock Geomechanical Tests
20
• Potlatch Anhydrite
• 3687'-depth of the Wallawein
well
• Sample density 2.5 - 2.83
g/cm3(close to the theoretical
density of anhydrite (2.97
g/cm3 indicating nearly pure
anhydrite with very little
porosity.)
• Single crystals of anhydrite
appear to be as large as 1-3
cm
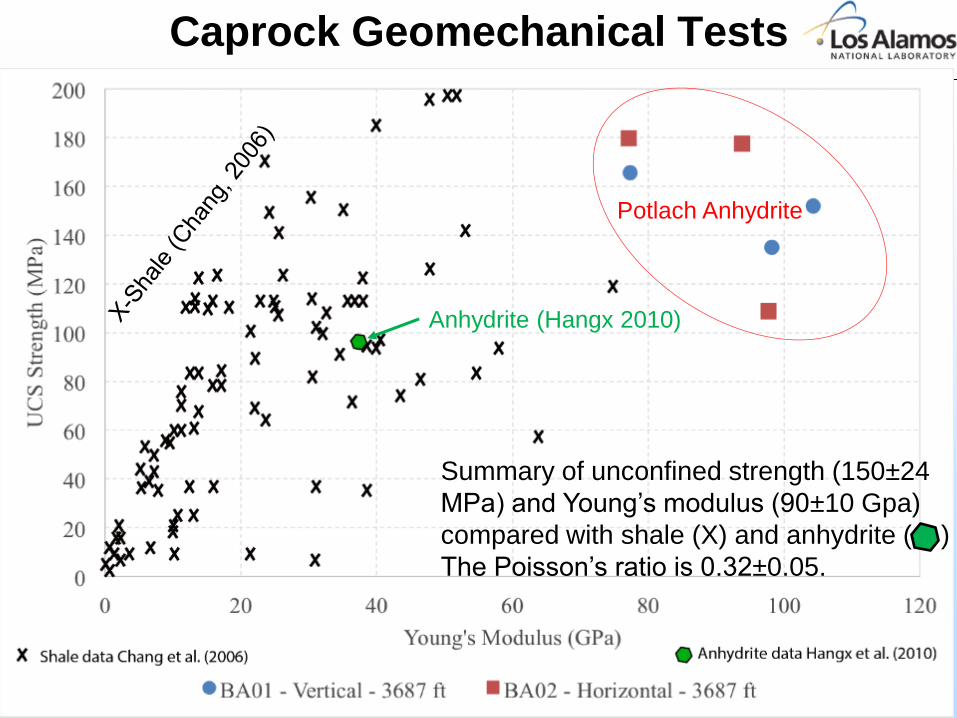
Caprock Geomechanical Tests
21
Summary of unconfined strength (150±24
MPa) and Young’s modulus (90±10 Gpa)
compared with shale (X) and anhydrite ( )
The Poisson’s ratio is 0.32±0.05.
Anhydrite (Hangx 2010)
Potlach Anhydrite
Caprock Geomechanical Tests
22
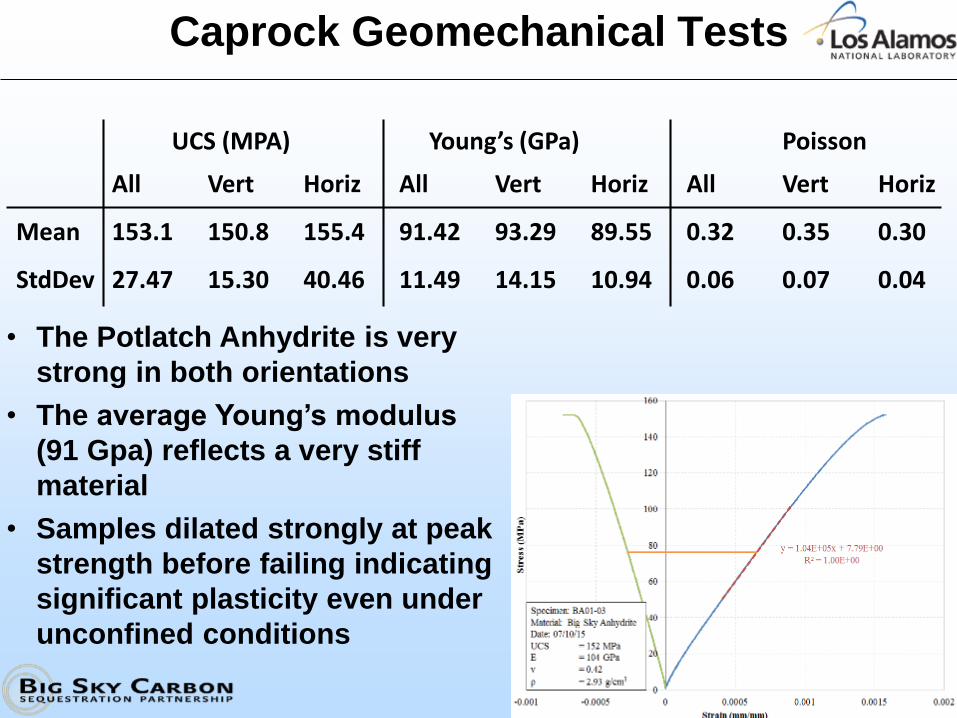
UCS (MPA) Young’s (GPa) Poisson
All Vert Horiz All Vert Horiz All Vert Horiz
Mean 153.1 150.8 155.4 91.42 93.29 89.55 0.32 0.35 0.30
StdDev 27.47 15.30 40.46 11.49 14.15 10.94 0.06 0.07 0.04
• The Potlatch Anhydrite is very
strong in both orientations
• The average Young’s modulus
(91 Gpa) reflects a very stiff
material
• Samples dilated strongly at peak
strength before failing indicating
significant plasticity even under
unconfined conditions
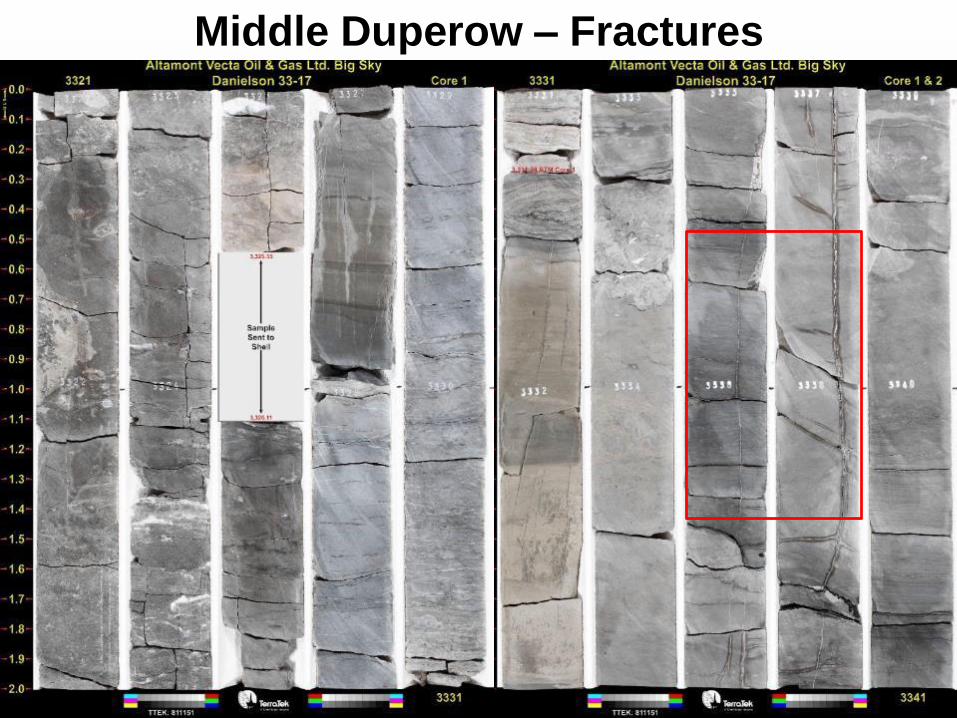
Middle Duperow – Fractures
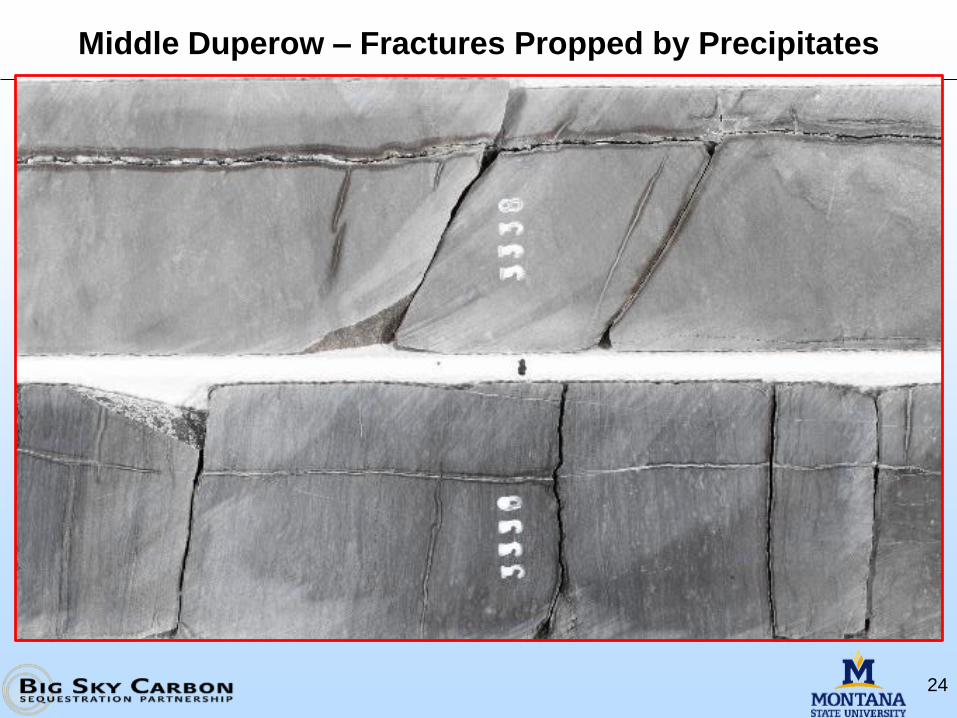
Middle Duperow – Fractures Propped by Precipitates
24
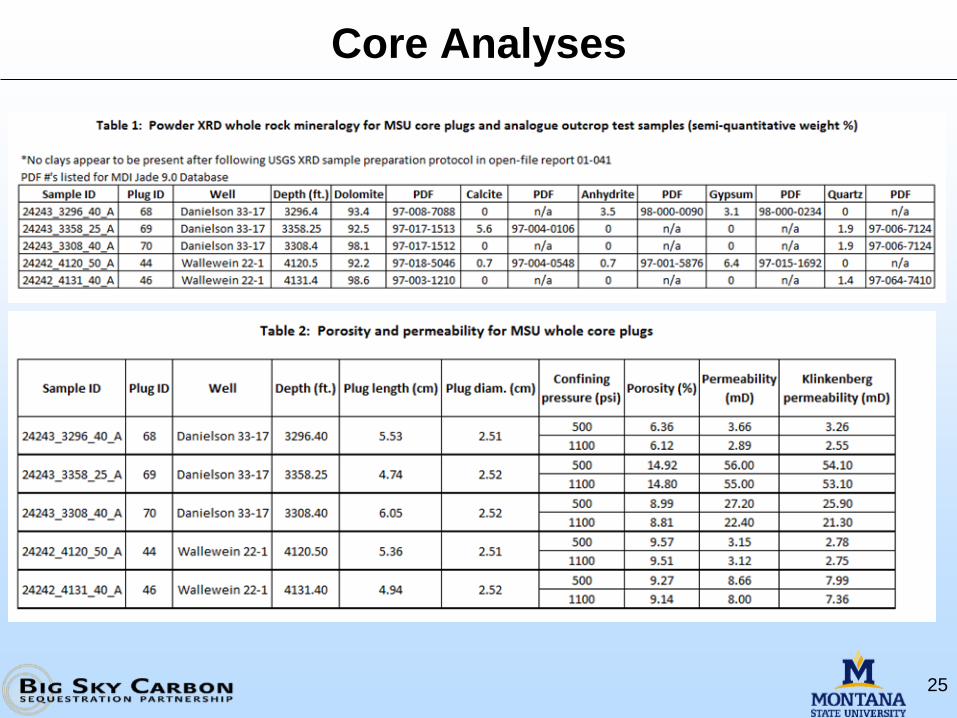
Core Analyses
25
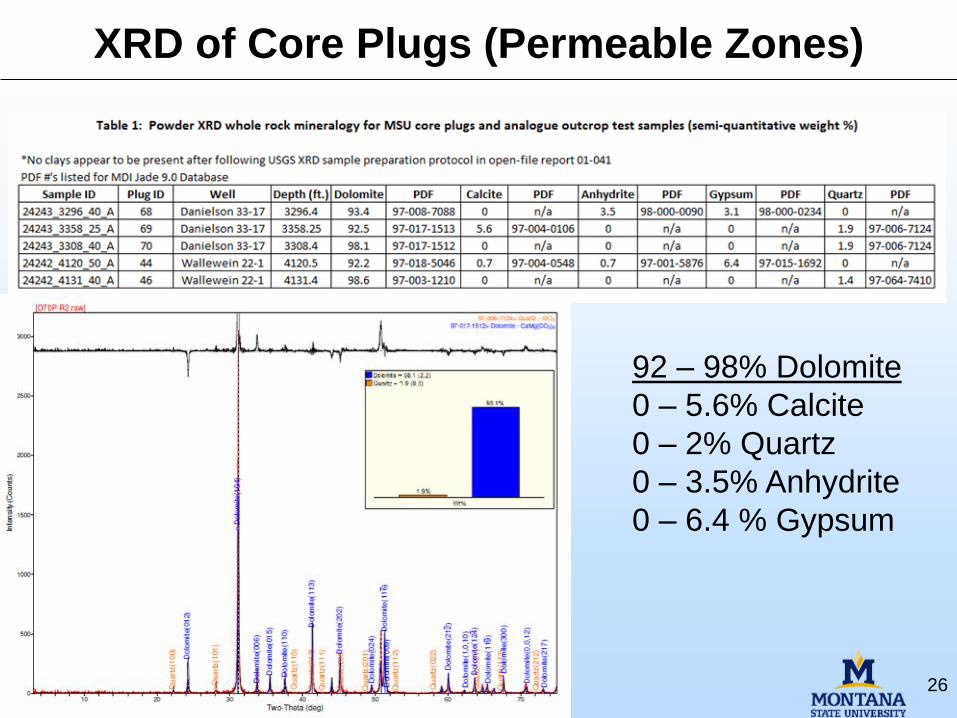
XRD of Core Plugs (Permeable Zones)
26
92 – 98% Dolomite
0 – 5.6% Calcite
0 – 2% Quartz
0 – 3.5% Anhydrite
0 – 6.4 % Gypsum
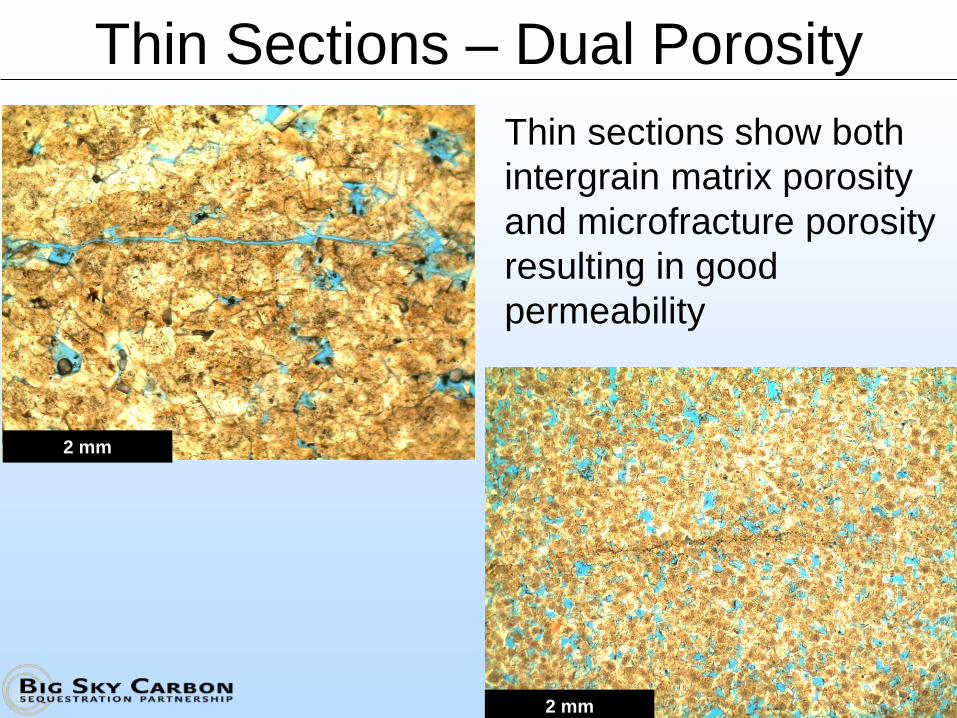
Thin Sections – Dual Porosity
27
Thin sections show both
intergrain matrix porosity
and microfracture porosity
resulting in good
permeability
2 mm
2 mm
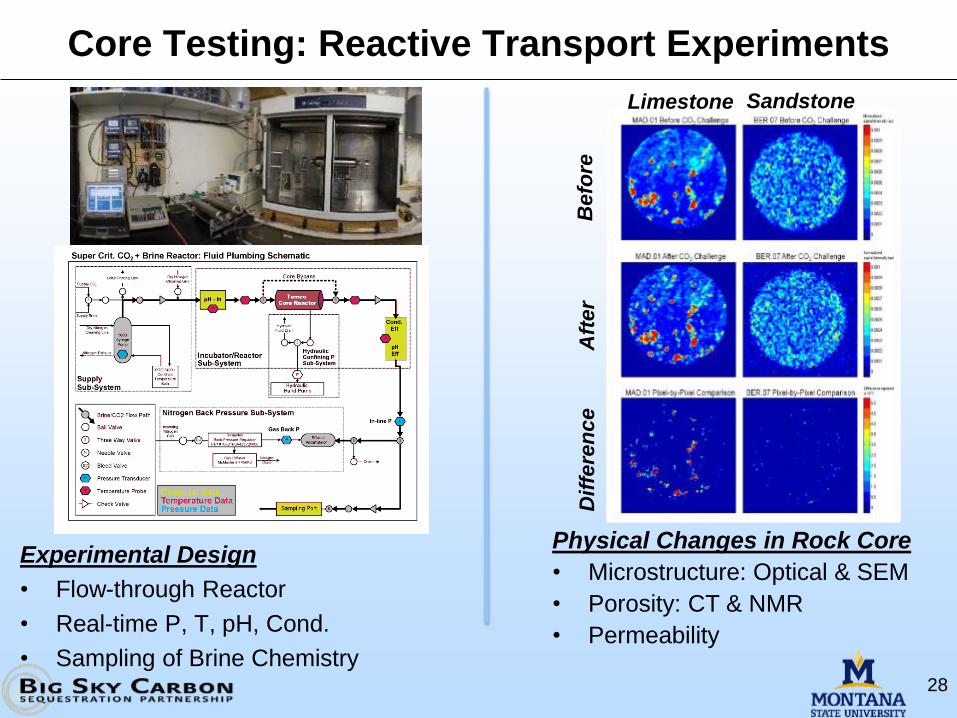
Core Testing: Reactive Transport Experiments
28
Experimental Design
• Flow-through Reactor
• Real-time P, T, pH, Cond.
• Sampling of Brine Chemistry
Physical Changes in Rock Core
• Microstructure: Optical & SEM
• Porosity: CT & NMR
• Permeability
Limestone Sandstone
Befo
reA
fter
Dif
fere
nce
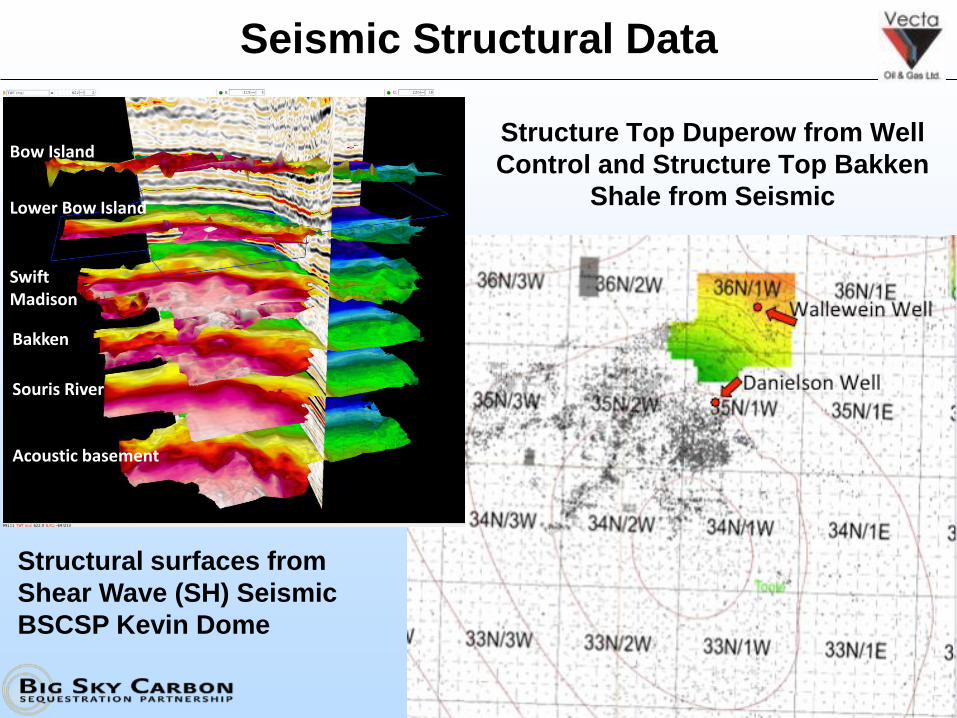
Seismic Structural Data
29
Bow Island
Lower Bow Island
SwiftMadison
Bakken
Souris River
Acoustic basement
Structure Top Duperow from Well
Control and Structure Top Bakken
Shale from Seismic
Structural surfaces from
Shear Wave (SH) Seismic
BSCSP Kevin Dome
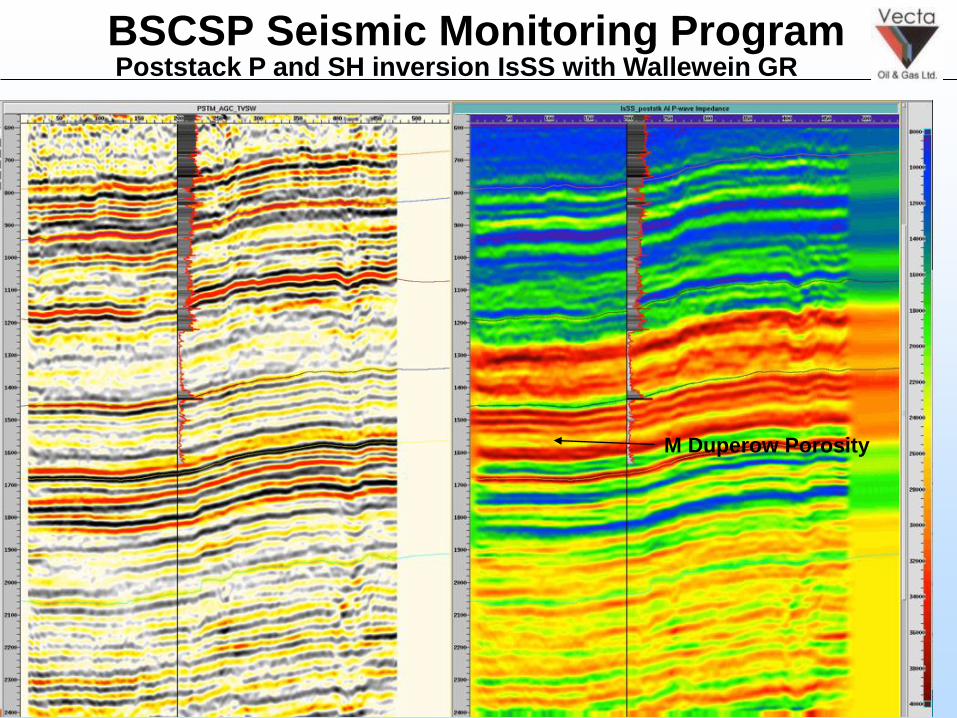
BSCSP Seismic Monitoring ProgramPoststack P and SH inversion IsSS with Wallewein GR
M Duperow Porosity
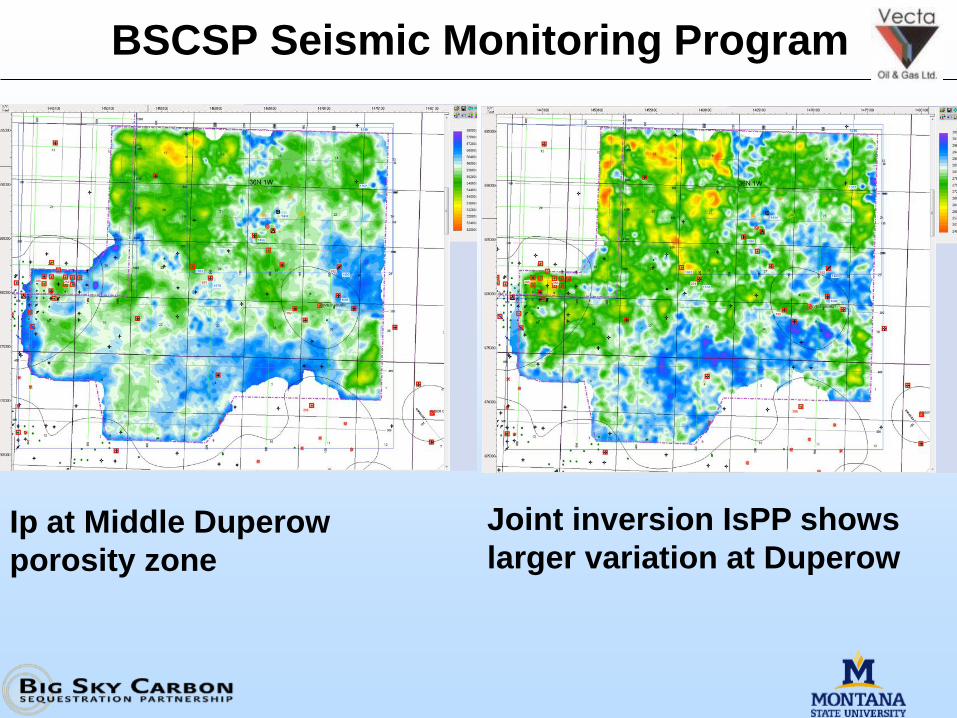
BSCSP Seismic Monitoring Program
Joint inversion IsPP shows
larger variation at DuperowIp at Middle Duperow
porosity zone
BSCSP Seismic Monitoring Program
9C dataset has good to excellent P and SH signal useful for characterizing
Middle Duperow porosity zones
• Well to seismic matches, particularly in paleozoic, are excellent on P and SH
datasets
• Subtle NE-SW structural fabric points back at crest of Kevin dome throughout
paleozoic section
• Joint inversion performance was good, as expected, and middle Duperow
porosity zone is readily visible on both impedances
• Meaningful impedance variations are visible on joint inversion output at middle
Duperow level
33
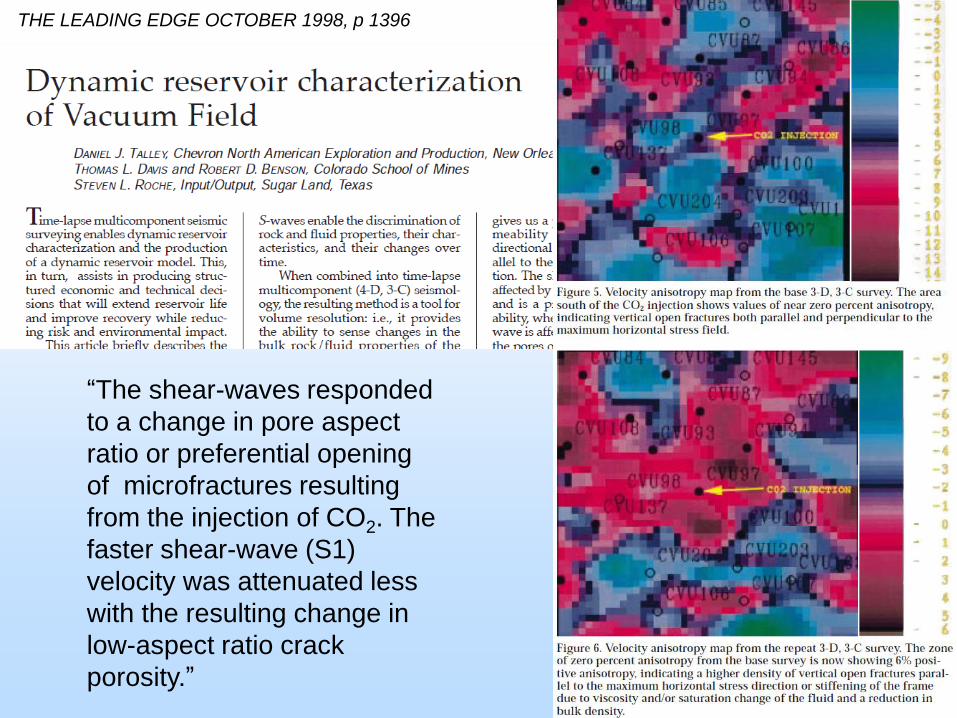
THE LEADING EDGE OCTOBER 1998, p 1396
“The shear-waves responded
to a change in pore aspect
ratio or preferential opening
of microfractures resulting
from the injection of CO2. The
faster shear-wave (S1)
velocity was attenuated less
with the resulting change in
low-aspect ratio crack
porosity.”
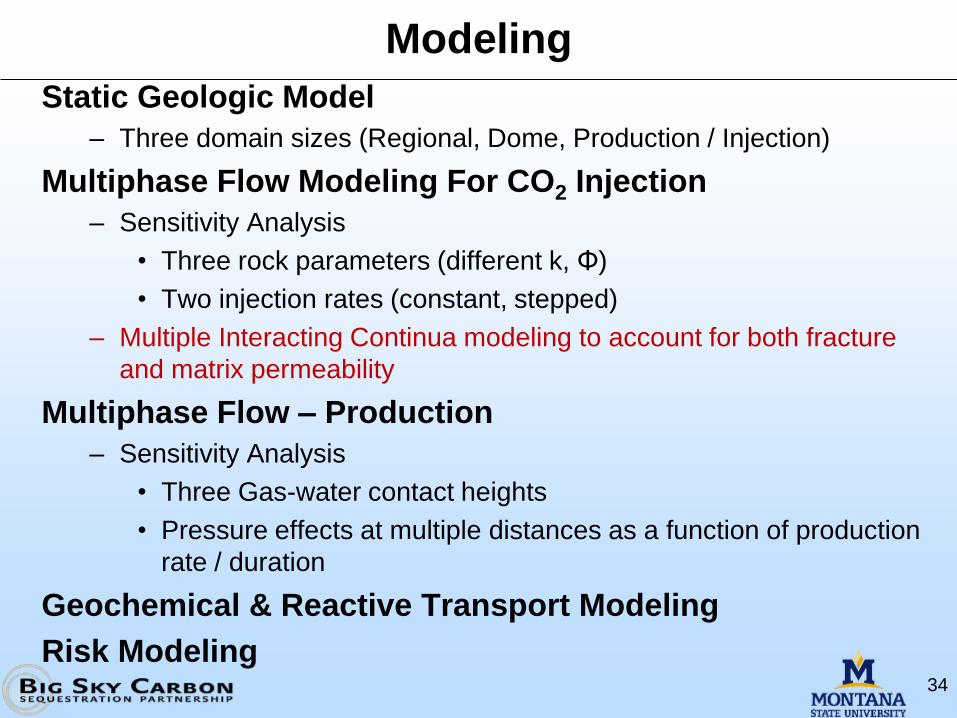
Modeling
Static Geologic Model
– Three domain sizes (Regional, Dome, Production / Injection)
Multiphase Flow Modeling For CO2 Injection
– Sensitivity Analysis
• Three rock parameters (different k, Φ)
• Two injection rates (constant, stepped)
– Multiple Interacting Continua modeling to account for both fracture
and matrix permeability
Multiphase Flow – Production
– Sensitivity Analysis
• Three Gas-water contact heights
• Pressure effects at multiple distances as a function of production
rate / duration
Geochemical & Reactive Transport Modeling
Risk Modeling34
35
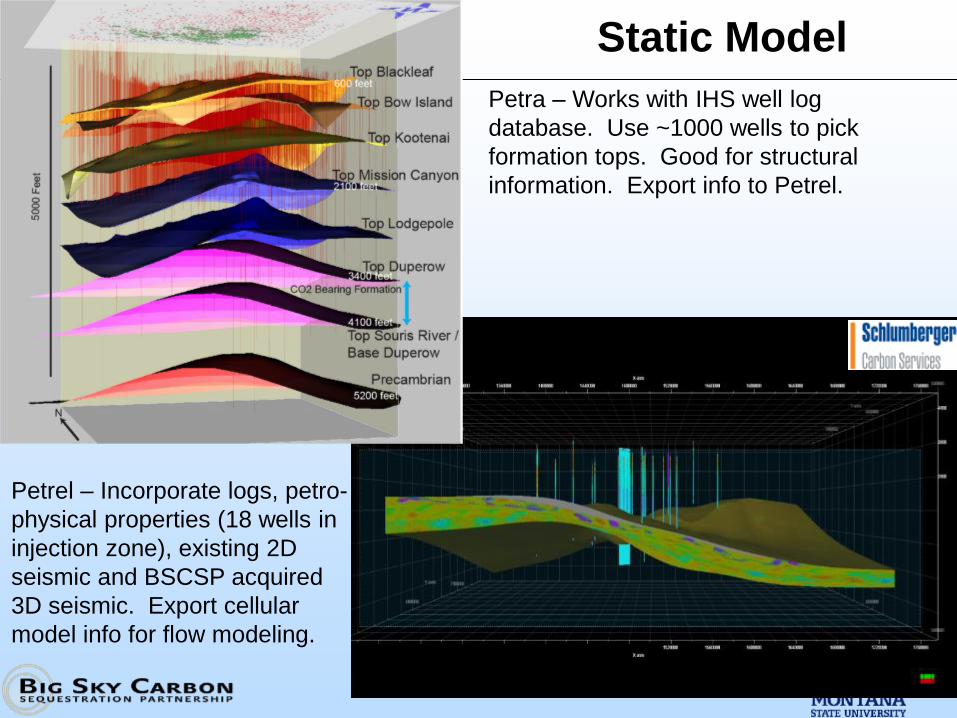
Static Model
Petra – Works with IHS well log
database. Use ~1000 wells to pick
formation tops. Good for structural
information. Export info to Petrel.
Petrel – Incorporate logs, petro-
physical properties (18 wells in
injection zone), existing 2D
seismic and BSCSP acquired
3D seismic. Export cellular
model info for flow modeling.
36
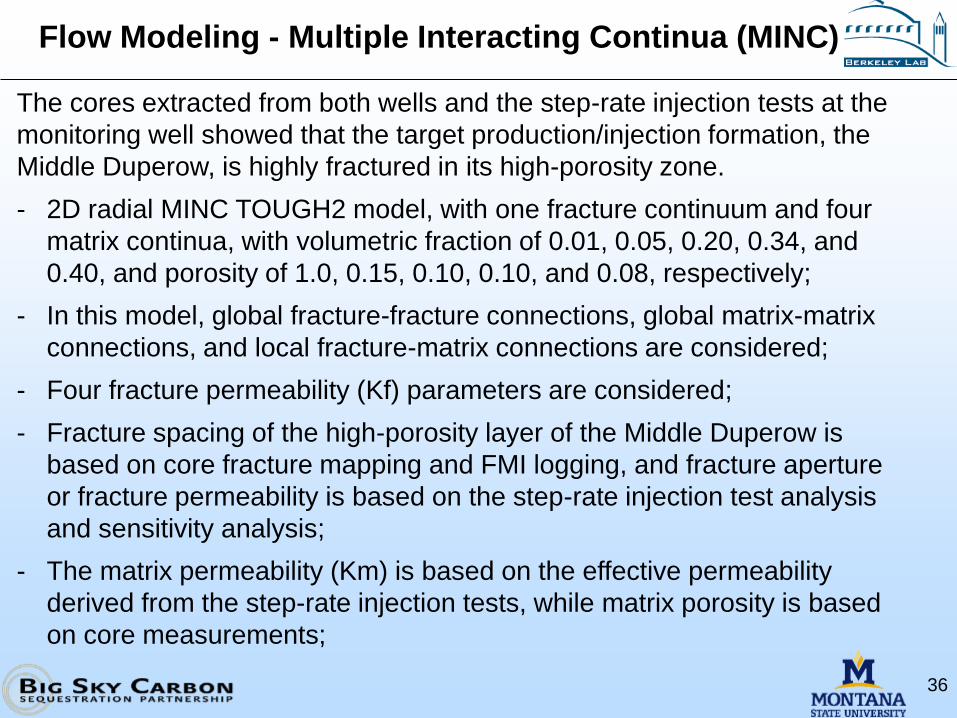
Flow Modeling - Multiple Interacting Continua (MINC)
The cores extracted from both wells and the step-rate injection tests at the
monitoring well showed that the target production/injection formation, the
Middle Duperow, is highly fractured in its high-porosity zone.
- 2D radial MINC TOUGH2 model, with one fracture continuum and four
matrix continua, with volumetric fraction of 0.01, 0.05, 0.20, 0.34, and
0.40, and porosity of 1.0, 0.15, 0.10, 0.10, and 0.08, respectively;
- In this model, global fracture-fracture connections, global matrix-matrix
connections, and local fracture-matrix connections are considered;
- Four fracture permeability (Kf) parameters are considered;
- Fracture spacing of the high-porosity layer of the Middle Duperow is
based on core fracture mapping and FMI logging, and fracture aperture
or fracture permeability is based on the step-rate injection test analysis
and sensitivity analysis;
- The matrix permeability (Km) is based on the effective permeability
derived from the step-rate injection tests, while matrix porosity is based
on core measurements;
37
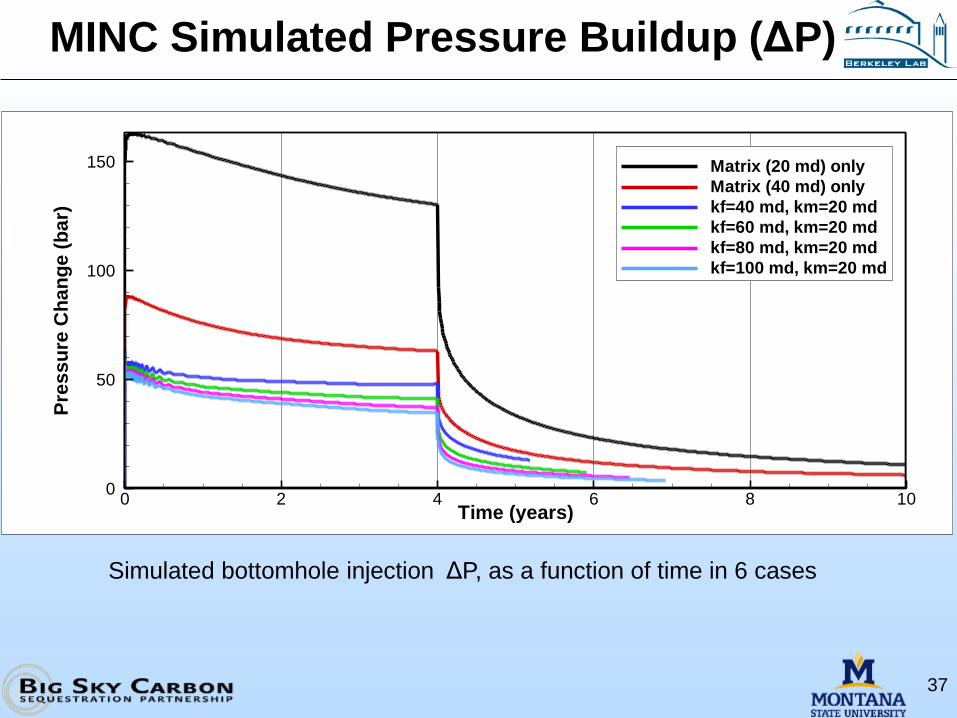
MINC Simulated Pressure Buildup (ΔP)
Time (years)
Pre
ss
ure
Ch
an
ge
(ba
r)
0 2 4 6 8 100
50
100
150 Matrix (20 md) only
Matrix (40 md) only
kf=40 md, km=20 md
kf=60 md, km=20 md
kf=80 md, km=20 md
kf=100 md, km=20 md
Time (years)
Pre
ss
ure
Ch
an
ge
(ba
r)
10-6
10-5
10-4
10-3
10-2
10-1
100
1010
10
20
30
40
50
60
70
kf=40 md
kf=60 md
kf=80 md
kf=100 md
high-resolution (kf=40 md)
Simulated bottomhole injection ΔP, as a function of time in 6 cases
MINC Simulated CO2 Plumes
Radial Distance (m)
Ele
vati
on
sR
ela
tiv
eto
Nis
ku
To
p(m
)
0 200 400 600 800 1000
-200
-150
-100
-50
0.5
0.45
0.4
0.35
0.3
0.25
0.2
0.15
0.1
0.05
(a) 0.5 year
Nisku
Upper Duperow
Injection Interval (MD)
Middle Duperow
Lower Duperow
Radial Distance (m)
Ele
vati
on
sR
ela
tiv
eto
Nis
ku
To
p(m
)
0 200 400 600 800 1000
-200
-150
-100
-50
0.5
0.45
0.4
0.35
0.3
0.25
0.2
0.15
0.1
0.05
(b) 1 year
Radial Distance (m)
Ele
vati
on
sR
ela
tiv
eto
Nis
ku
To
p(m
)
0 200 400 600 800 1000
-200
-150
-100
-50
0.5
0.45
0.4
0.35
0.3
0.25
0.2
0.15
0.1
0.05
(c) 1.5 year
Radial Distance (m)E
lev
ati
on
sR
ela
tiv
eto
Nis
ku
To
p(m
)
0 200 400 600 800 1000
-200
-150
-100
-50
0.5
0.45
0.4
0.35
0.3
0.25
0.2
0.15
0.1
0.05
(d) 2 year
Radial Distance (m)
Ele
vati
on
sR
ela
tiv
eto
Nis
ku
To
p(m
)
0 200 400 600 800 1000
-200
-150
-100
-50
0.5
0.45
0.4
0.35
0.3
0.25
0.2
0.15
0.1
0.05
(e) 3 year
Radial Distance (m)
Ele
vati
on
sR
ela
tiv
eto
Nis
ku
To
p(m
)
0 200 400 600 800 1000
-200
-150
-100
-50
0.5
0.45
0.4
0.35
0.3
0.25
0.2
0.15
0.1
0.05
(f) 4 year
Radial Distance (m)
Ele
vati
on
sR
ela
tiv
eto
Nis
ku
To
p(m
)
0 200 400 600 800 1000
-200
-150
-100
-50
0.7
0.6
0.5
0.4
0.3
0.2
0.1
0.05
(a) 0.5 year
Nisku
Upper Duperow
Injection Interval (MD)
Middle Duperow
Lower Duperow
Radial Distance (m)
Ele
vati
on
sR
ela
tiv
eto
Nis
ku
To
p(m
)
0 200 400 600 800 1000
-200
-150
-100
-50
0.7
0.6
0.5
0.4
0.3
0.2
0.1
0.05
(b) 1 year
Radial Distance (m)
Ele
vati
on
sR
ela
tiv
eto
Nis
ku
To
p(m
)
0 200 400 600 800 1000
-200
-150
-100
-50
0.7
0.6
0.5
0.4
0.3
0.2
0.1
0.05
(c) 1.5 year
Radial Distance (m)
Ele
vati
on
sR
ela
tiv
eto
Nis
ku
To
p(m
)
0 200 400 600 800 1000
-200
-150
-100
-50
0.7
0.6
0.5
0.4
0.3
0.2
0.1
0.05
(d) 2 year
Radial Distance (m)
Ele
vati
on
sR
ela
tiv
eto
Nis
ku
To
p(m
)
0 200 400 600 800 1000
-200
-150
-100
-50
0.7
0.6
0.5
0.4
0.3
0.2
0.1
0.05
(e) 3 year
Radial Distance (m)
Ele
vati
on
sR
ela
tiv
eto
Nis
ku
To
p(m
)
0 200 400 600 800 1000
-200
-150
-100
-50
0.7
0.6
0.5
0.4
0.3
0.2
0.1
0.05
(f) 4 year
Fracture Matrix
MINC Simulated CO2 PlumesFracture
Radial Distance (m)
Ele
vati
on
sR
ela
tiv
eto
Nis
ku
To
p(m
)
0 200 400 600 800 1000
-200
-150
-100
-50
0.7
0.6
0.5
0.4
0.3
0.2
0.1
0.05
(a) 0.5 year
Nisku
Upper Duperow
Injection Interval (MD)
Middle Duperow
Lower Duperow
Radial Distance (m)
Ele
vati
on
sR
ela
tiv
eto
Nis
ku
To
p(m
)
0 200 400 600 800 1000
-200
-150
-100
-50
0.7
0.6
0.5
0.4
0.3
0.2
0.1
0.05
(b) 1 year
Radial Distance (m)
Ele
vati
on
sR
ela
tiv
eto
Nis
ku
To
p(m
)
0 200 400 600 800 1000
-200
-150
-100
-50
0.7
0.6
0.5
0.4
0.3
0.2
0.1
0.05
(c) 1.5 year
Radial Distance (m)
Ele
vati
on
sR
ela
tiv
eto
Nis
ku
To
p(m
)
0 200 400 600 800 1000
-200
-150
-100
-50
0.7
0.6
0.5
0.4
0.3
0.2
0.1
0.05
(d) 2 year
Radial Distance (m)
Ele
vati
on
sR
ela
tiv
eto
Nis
ku
To
p(m
)
0 200 400 600 800 1000
-200
-150
-100
-50
0.7
0.6
0.5
0.4
0.3
0.2
0.1
0.05
(e) 3 year
Radial Distance (m)
Ele
vati
on
sR
ela
tiv
eto
Nis
ku
To
p(m
)
0 200 400 600 800 1000
-200
-150
-100
-50
0.7
0.6
0.5
0.4
0.3
0.2
0.1
0.05
(f) 4 year
Radial Distance (m)
Ele
vati
on
sR
ela
tiv
eto
Nis
ku
To
p(m
)
0 200 400 600 800 1000
-200
-150
-100
-50
0.7
0.6
0.5
0.4
0.3
0.2
0.1
0.05
(a) 0.5 year
Nisku
Upper Duperow
Injection Interval (MD)
Middle Duperow
Lower Duperow
Radial Distance (m)
Ele
vati
on
sR
ela
tiv
eto
Nis
ku
To
p(m
)
0 200 400 600 800 1000
-200
-150
-100
-50
0.7
0.6
0.5
0.4
0.3
0.2
0.1
0.05
(b) 1 year
Radial Distance (m)
Ele
vati
on
sR
ela
tiv
eto
Nis
ku
To
p(m
)
0 200 400 600 800 1000
-200
-150
-100
-50
0.7
0.6
0.5
0.4
0.3
0.2
0.1
0.05
(c) 1.5 year
Radial Distance (m)
Ele
vati
on
sR
ela
tiv
eto
Nis
ku
To
p(m
)
0 200 400 600 800 1000
-200
-150
-100
-50
0.7
0.6
0.5
0.4
0.3
0.2
0.1
0.05
(d) 2 year
Radial Distance (m)
Ele
vati
on
sR
ela
tiv
eto
Nis
ku
To
p(m
)
0 200 400 600 800 1000
-200
-150
-100
-50
0.7
0.6
0.5
0.4
0.3
0.2
0.1
0.05
(e) 3 year
Radial Distance (m)
Ele
vati
on
sR
ela
tiv
eto
Nis
ku
To
p(m
)
0 200 400 600 800 1000
-200
-150
-100
-50
0.7
0.6
0.5
0.4
0.3
0.2
0.1
0.05
(f) 4 year
Radial Distance (m)
Ele
vati
on
sR
ela
tiv
eto
Nis
ku
To
p(m
)
0 200 400 600 800 1000
-200
-150
-100
-50
0.5
0.45
0.4
0.35
0.3
0.25
0.2
0.15
0.1
0.05
(a) 0.5 year
Nisku
Upper Duperow
Injection Interval (MD)
Middle Duperow
Lower Duperow
Radial Distance (m)
Ele
vati
on
sR
ela
tiv
eto
Nis
ku
To
p(m
)
0 200 400 600 800 1000
-200
-150
-100
-50
0.5
0.45
0.4
0.35
0.3
0.25
0.2
0.15
0.1
0.05
(b) 1 year
Radial Distance (m)
Ele
vati
on
sR
ela
tiv
eto
Nis
ku
To
p(m
)
0 200 400 600 800 1000
-200
-150
-100
-50
0.5
0.45
0.4
0.35
0.3
0.25
0.2
0.15
0.1
0.05
(c) 1.5 year
Radial Distance (m)
Ele
vati
on
sR
ela
tiv
eto
Nis
ku
To
p(m
)
0 200 400 600 800 1000
-200
-150
-100
-50
0.5
0.45
0.4
0.35
0.3
0.25
0.2
0.15
0.1
0.05
(d) 2 year
Radial Distance (m)
Ele
vati
on
sR
ela
tiv
eto
Nis
ku
To
p(m
)
0 200 400 600 800 1000
-200
-150
-100
-50
0.5
0.45
0.4
0.35
0.3
0.25
0.2
0.15
0.1
0.05
(e) 3 year
Radial Distance (m)
Ele
vati
on
sR
ela
tiv
eto
Nis
ku
To
p(m
)
0 200 400 600 800 1000
-200
-150
-100
-50
0.5
0.45
0.4
0.35
0.3
0.25
0.2
0.15
0.1
0.05
(f) 4 year
Matrix
40
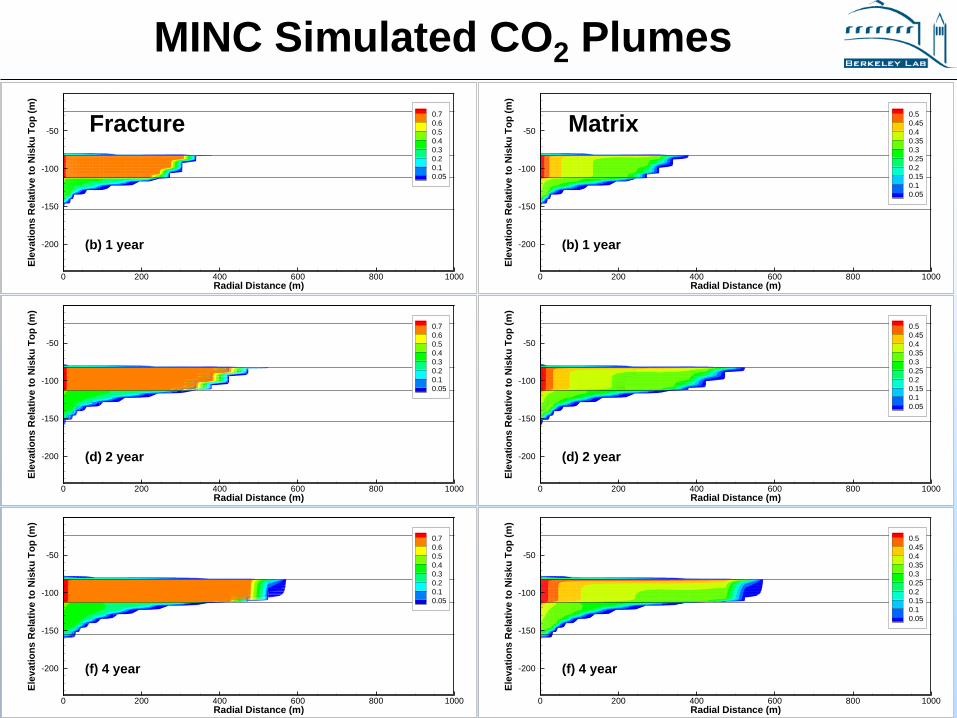
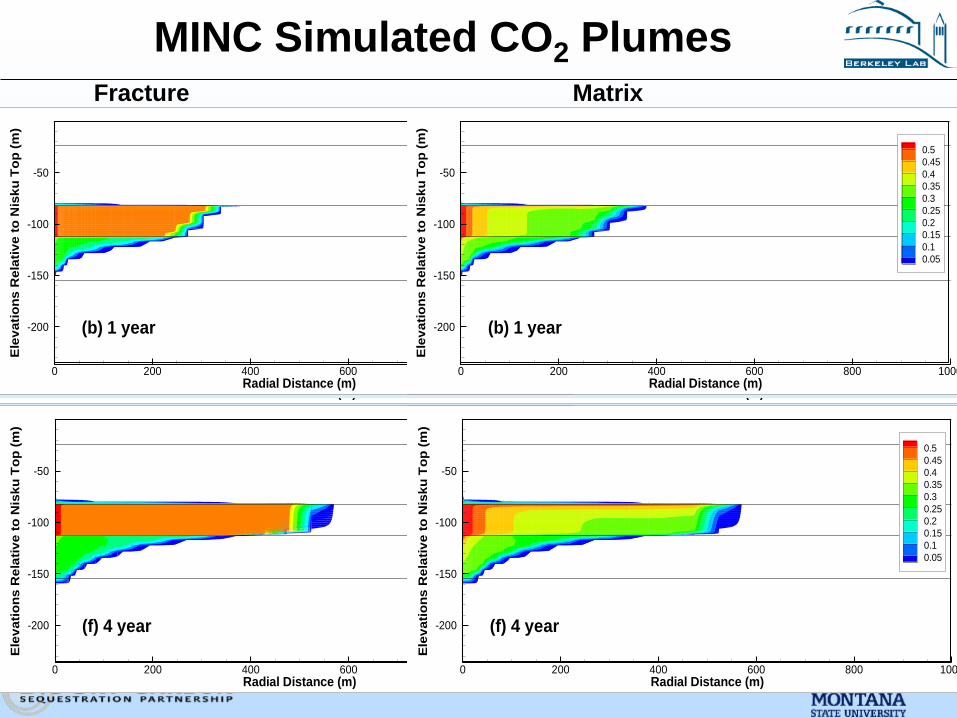
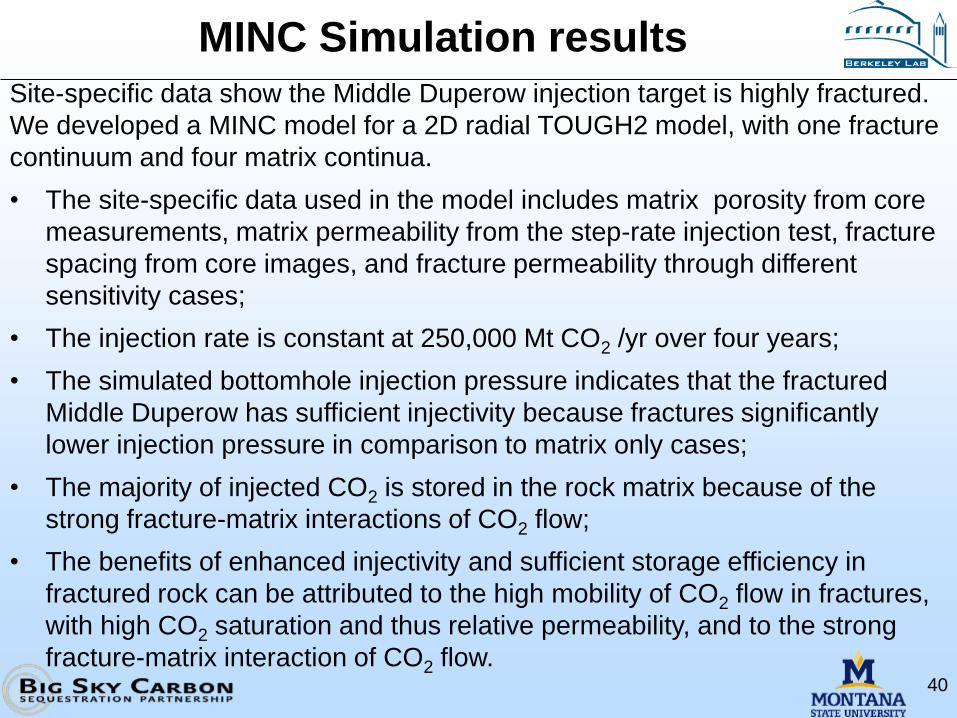
MINC Simulation results
Site-specific data show the Middle Duperow injection target is highly fractured.
We developed a MINC model for a 2D radial TOUGH2 model, with one fracture
continuum and four matrix continua.
• The site-specific data used in the model includes matrix porosity from core
measurements, matrix permeability from the step-rate injection test, fracture
spacing from core images, and fracture permeability through different
sensitivity cases;
• The injection rate is constant at 250,000 Mt CO2 /yr over four years;
• The simulated bottomhole injection pressure indicates that the fractured
Middle Duperow has sufficient injectivity because fractures significantly
lower injection pressure in comparison to matrix only cases;
• The majority of injected CO2 is stored in the rock matrix because of the
strong fracture-matrix interactions of CO2 flow;
• The benefits of enhanced injectivity and sufficient storage efficiency in
fractured rock can be attributed to the high mobility of CO2 flow in fractures,
with high CO2 saturation and thus relative permeability, and to the strong
fracture-matrix interaction of CO2 flow.
41
Key Points
Seismic indicates that structure conforms to the original
mapping and no major faults are present in the injection area.
Modern log suites from the production area and injection area
demonstrate rock units in the reservoir intervals are very
continuous and correlate extremely well over 7 miles.
Core and log data indicate very good reservoir properties
consistent over large regions.
Natural fracturing is present but is bedding constrained and
confined to the reservoir interval.
Core from the Potlatch Anhydrite and the Upper Duperow
caprock demonstrate the mechanical integrity of both
intervals.
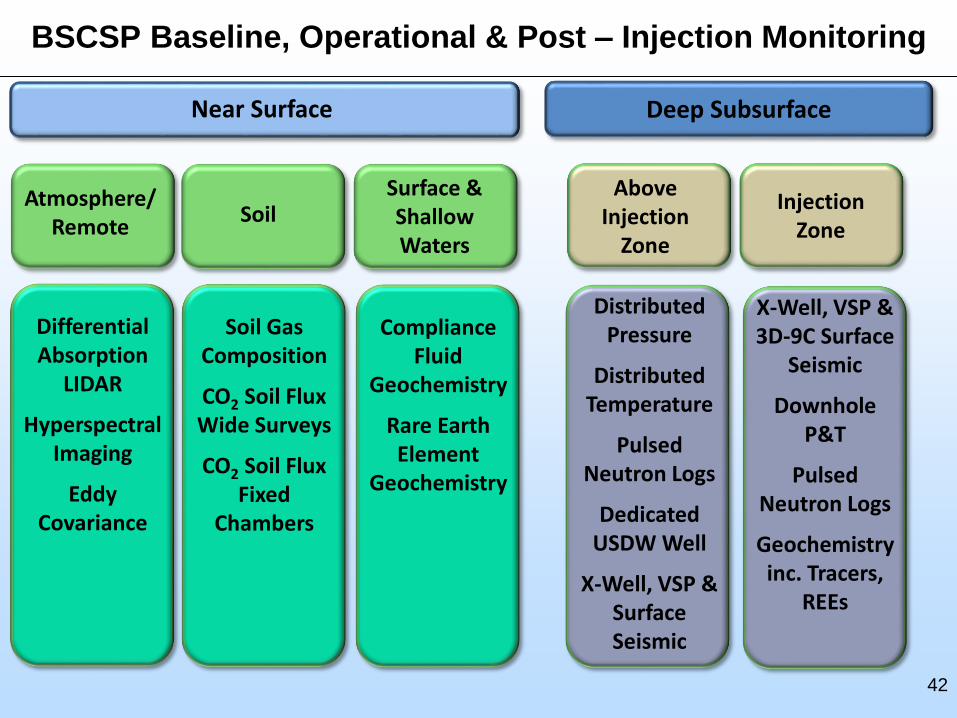
BSCSP Baseline, Operational & Post – Injection Monitoring
42
Near Surface Deep Subsurface
Atmosphere/ Remote
SoilSurface & Shallow Waters
Injection Zone
Above Injection
Zone
Differential Absorption
LIDAR
HyperspectralImaging
Eddy Covariance
Soil Gas Composition
CO2 Soil Flux Wide Surveys
CO2 Soil Flux Fixed
Chambers
Compliance Fluid
Geochemistry
Rare Earth Element
Geochemistry
Distributed Pressure
Distributed Temperature
Pulsed Neutron Logs
Dedicated USDW Well
X-Well, VSP & Surface Seismic
X-Well, VSP & 3D-9C Surface
Seismic
DownholeP&T
Pulsed Neutron Logs
Geochemistry inc. Tracers,
REEs
43
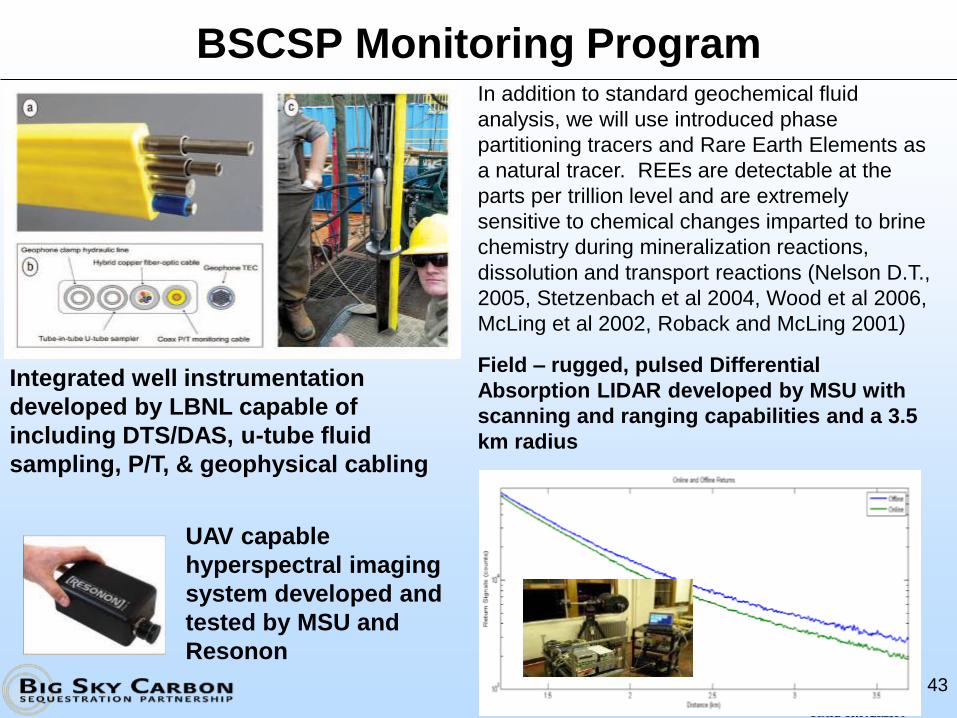
BSCSP Monitoring Program
Integrated well instrumentation
developed by LBNL capable of
including DTS/DAS, u-tube fluid
sampling, P/T, & geophysical cabling
UAV capable
hyperspectral imaging
system developed and
tested by MSU and
Resonon
Field – rugged, pulsed Differential
Absorption LIDAR developed by MSU with
scanning and ranging capabilities and a 3.5
km radius
In addition to standard geochemical fluid
analysis, we will use introduced phase
partitioning tracers and Rare Earth Elements as
a natural tracer. REEs are detectable at the
parts per trillion level and are extremely
sensitive to chemical changes imparted to brine
chemistry during mineralization reactions,
dissolution and transport reactions (Nelson D.T.,
2005, Stetzenbach et al 2004, Wood et al 2006,
McLing et al 2002, Roback and McLing 2001)
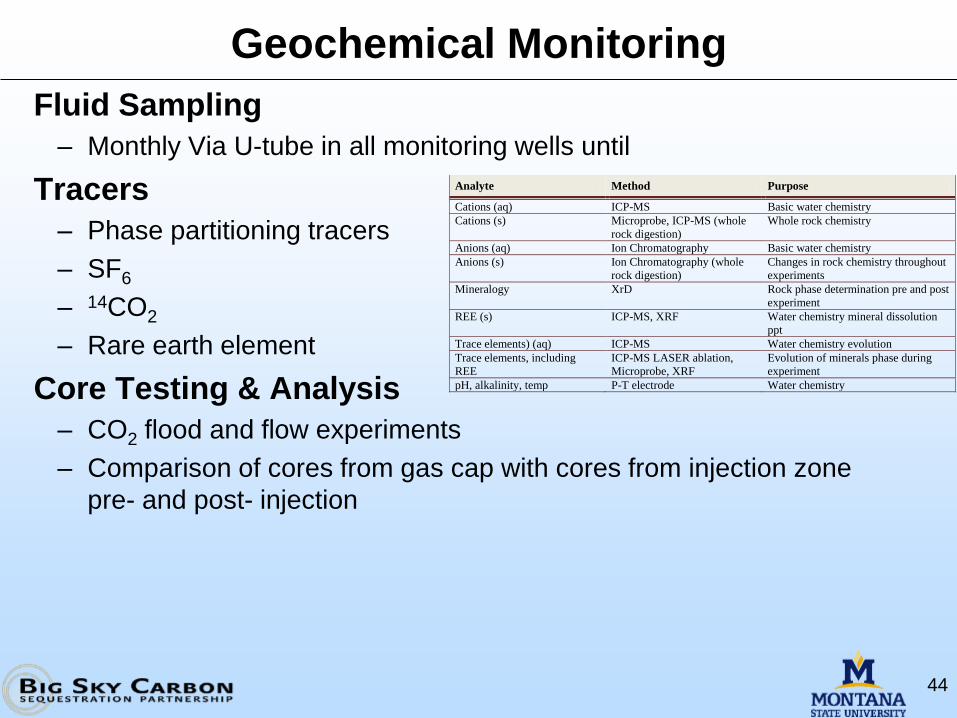
Geochemical Monitoring
44
Fluid Sampling
– Monthly Via U-tube in all monitoring wells until
Tracers
– Phase partitioning tracers
– SF6
– 14CO2
– Rare earth element
Core Testing & Analysis
– CO2 flood and flow experiments
– Comparison of cores from gas cap with cores from injection zone
pre- and post- injection
Table 1. Overview of geochemical analyses.
Analyte Method Purpose
Cations (aq) ICP-MS Basic water chemistry
Cations (s) Microprobe, ICP-MS (whole
rock digestion)
Whole rock chemistry
Anions (aq) Ion Chromatography Basic water chemistry
Anions (s) Ion Chromatography (whole
rock digestion)
Changes in rock chemistry throughout
experiments
Mineralogy XrD Rock phase determination pre and post
experiment
REE (s) ICP-MS, XRF Water chemistry mineral dissolution
ppt
Trace elements) (aq) ICP-MS Water chemistry evolution
Trace elements, including
REE
ICP-MS LASER ablation,
Microprobe, XRF
Evolution of minerals phase during
experiment
pH, alkalinity, temp P-T electrode Water chemistry
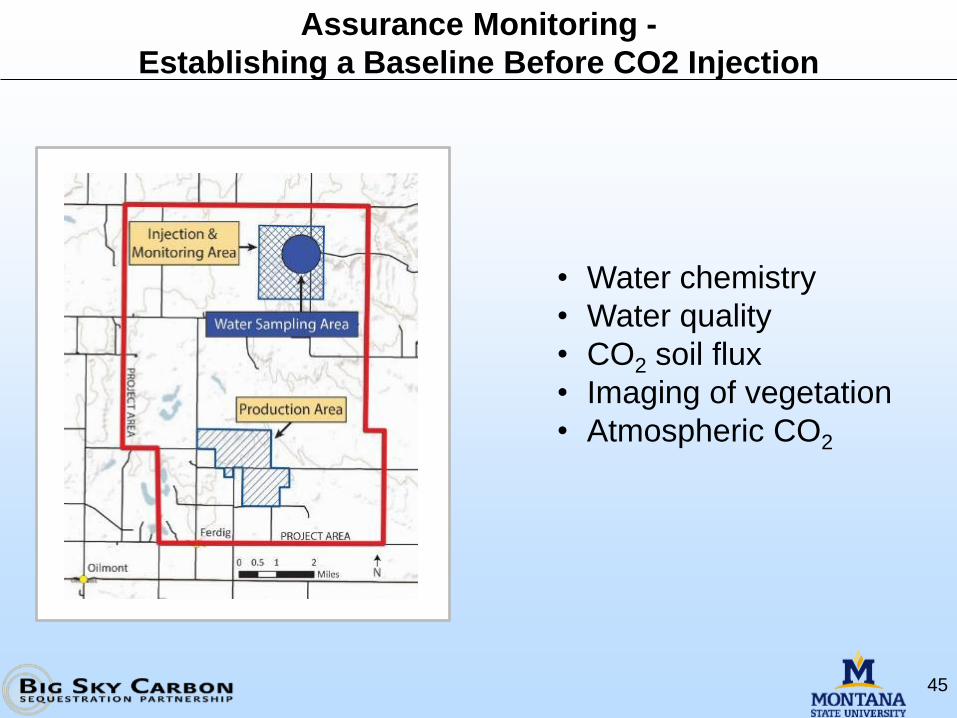
Assurance Monitoring -
Establishing a Baseline Before CO2 Injection
45
• Water chemistry
• Water quality
• CO2 soil flux
• Imaging of vegetation
• Atmospheric CO2
MAP
46
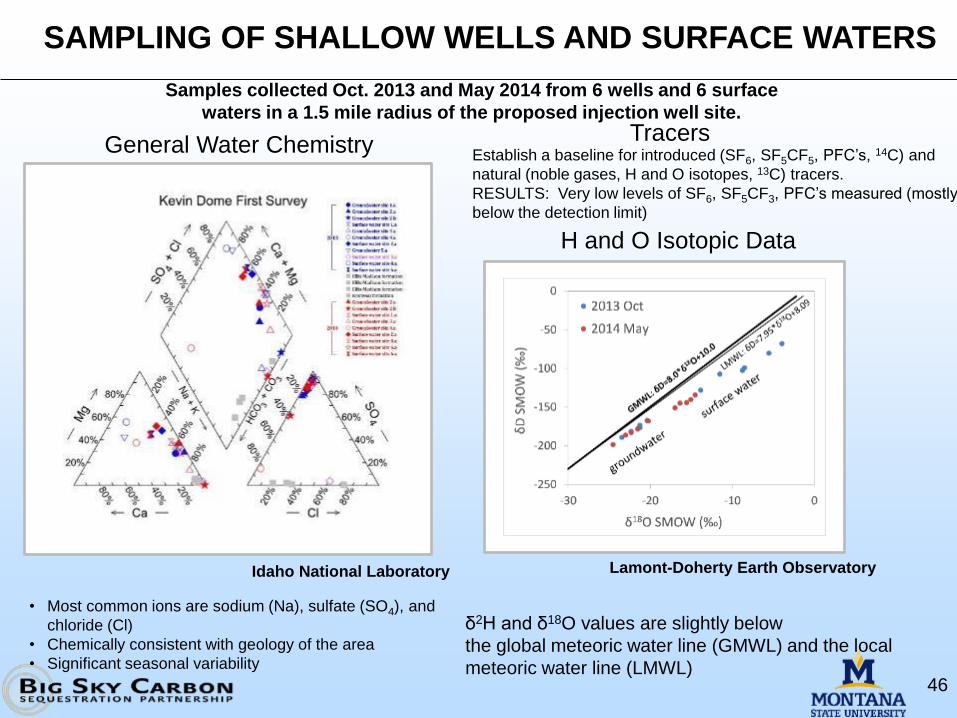
SAMPLING OF SHALLOW WELLS AND SURFACE WATERS
H and O Isotopic Data
Lamont-Doherty Earth Observatory
Establish a baseline for introduced (SF6, SF5CF5, PFC’s, 14C) and
natural (noble gases, H and O isotopes, 13C) tracers.
RESULTS: Very low levels of SF6, SF5CF3, PFC’s measured (mostly
below the detection limit)
Tracers
δ2H and δ18O values are slightly below
the global meteoric water line (GMWL) and the local
meteoric water line (LMWL)
• Most common ions are sodium (Na), sulfate (SO4), and
chloride (Cl)
• Chemically consistent with geology of the area
• Significant seasonal variability
Idaho National Laboratory
General Water Chemistry
Samples collected Oct. 2013 and May 2014 from 6 wells and 6 surface
waters in a 1.5 mile radius of the proposed injection well site.
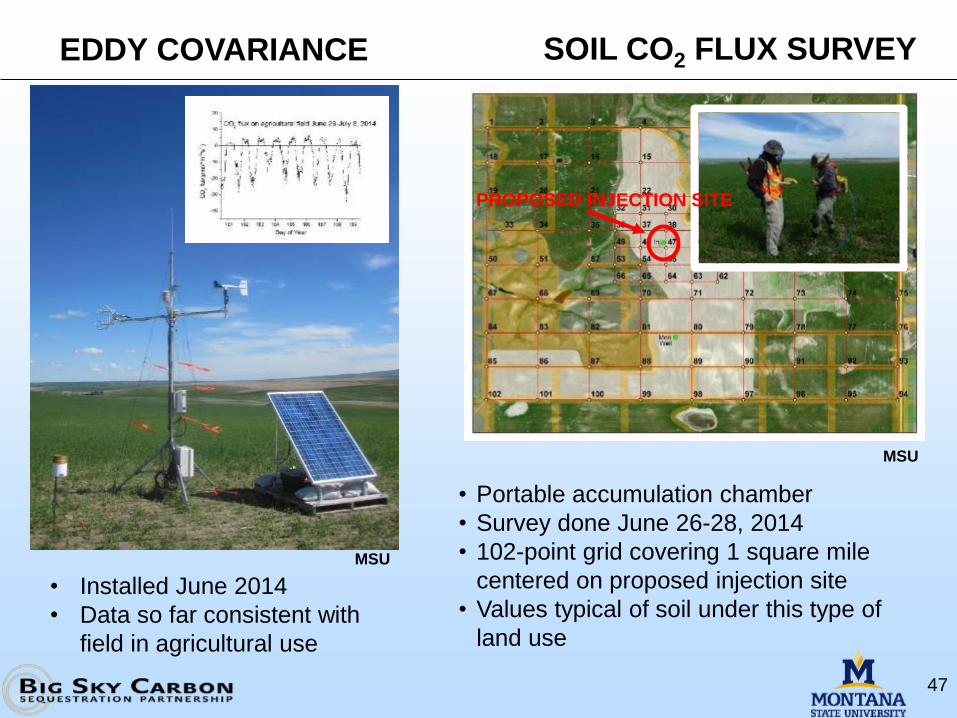
47
• Installed June 2014
• Data so far consistent with
field in agricultural use
EDDY COVARIANCE
• Portable accumulation chamber
• Survey done June 26-28, 2014
• 102-point grid covering 1 square mile
centered on proposed injection site
• Values typical of soil under this type of
land use
PROPOSED INJECTION SITE
SOIL CO2 FLUX SURVEY
MSU
MSU
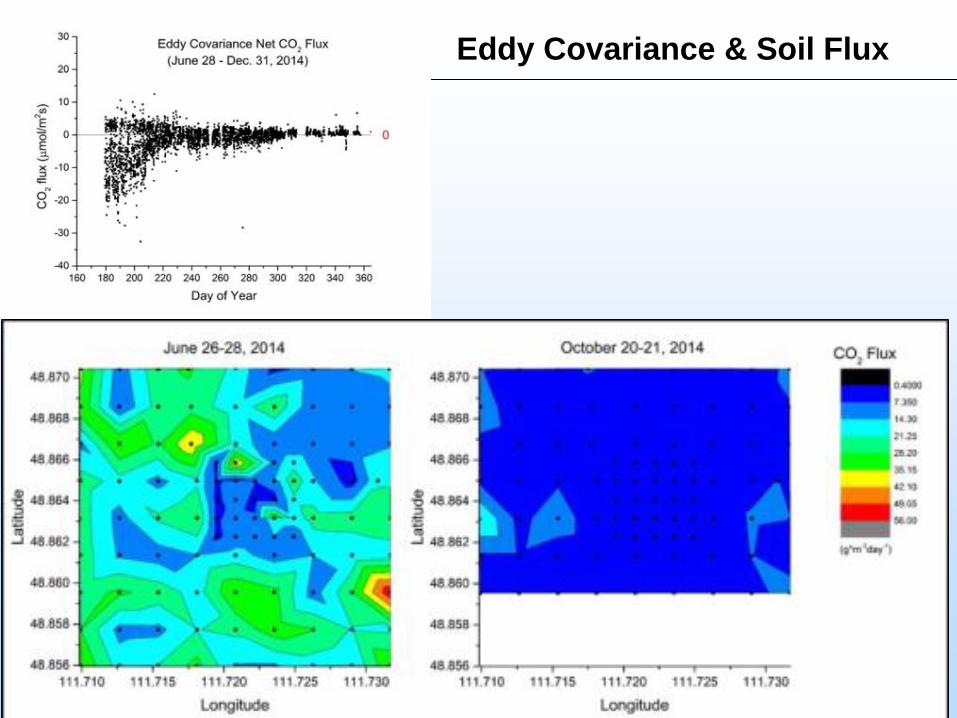
48
Eddy Covariance & Soil Flux
49
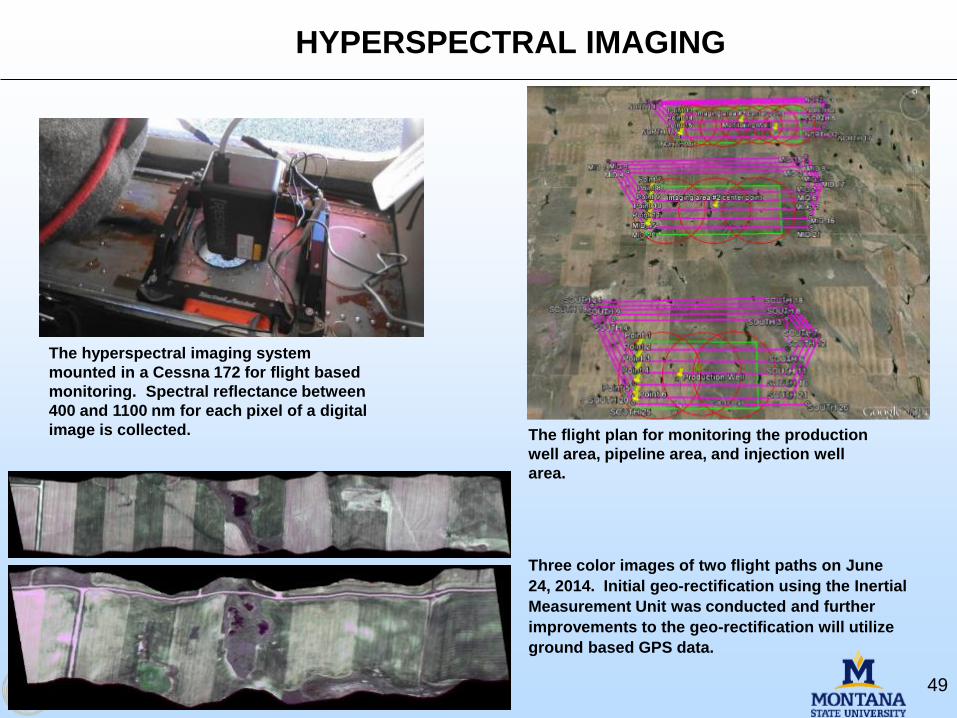
HYPERSPECTRAL IMAGING
The flight plan for monitoring the production
well area, pipeline area, and injection well
area.
Three color images of two flight paths on June
24, 2014. Initial geo-rectification using the Inertial
Measurement Unit was conducted and further
improvements to the geo-rectification will utilize
ground based GPS data.
The hyperspectral imaging system
mounted in a Cessna 172 for flight based
monitoring. Spectral reflectance between
400 and 1100 nm for each pixel of a digital
image is collected.
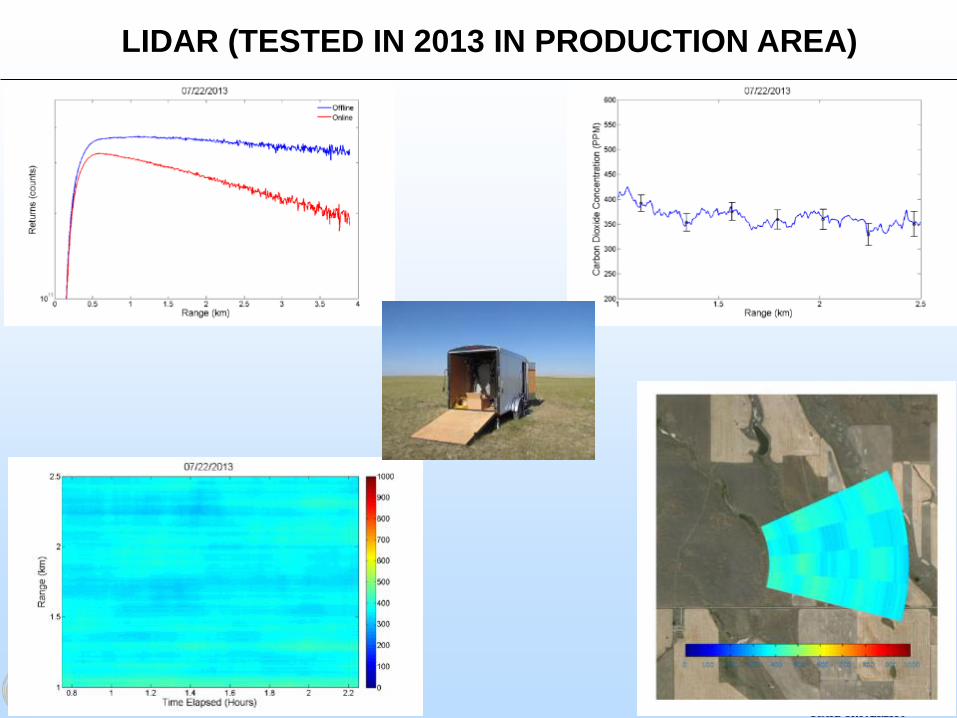
LIDAR (TESTED IN 2013 IN PRODUCTION AREA)
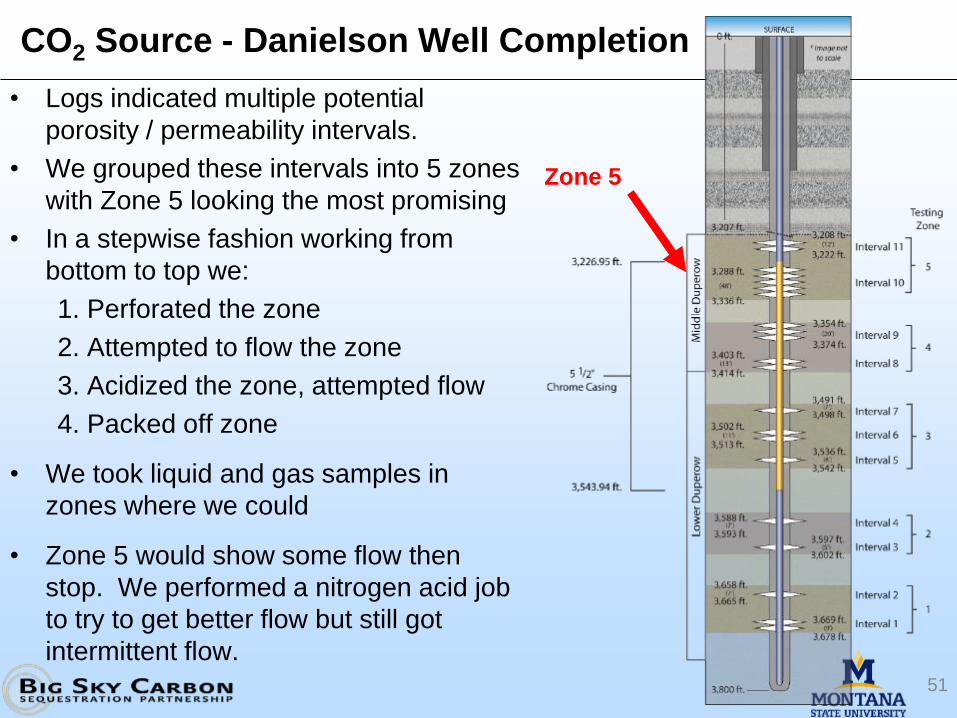
CO2 Source - Danielson Well Completion
• Logs indicated multiple potential
porosity / permeability intervals.
• We grouped these intervals into 5 zones
with Zone 5 looking the most promising
• In a stepwise fashion working from
bottom to top we:
1. Perforated the zone
2. Attempted to flow the zone
3. Acidized the zone, attempted flow
4. Packed off zone
• We took liquid and gas samples in
zones where we could
• Zone 5 would show some flow then
stop. We performed a nitrogen acid job
to try to get better flow but still got
intermittent flow.51
Zone 5
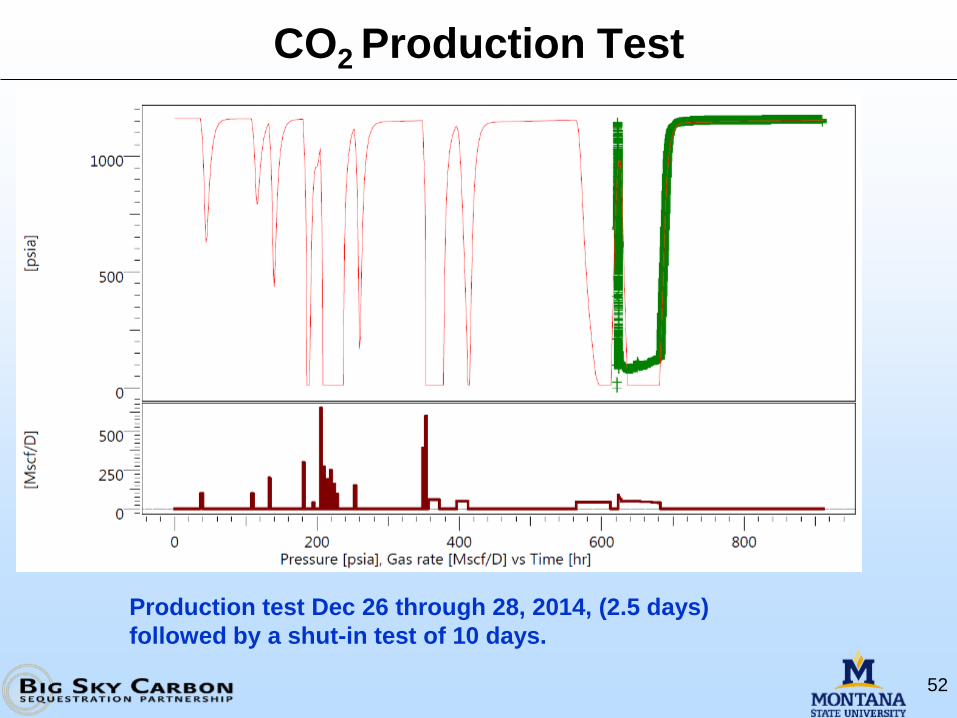
CO2 Production Test
52
Production test Dec 26 through 28, 2014, (2.5 days)
followed by a shut-in test of 10 days.
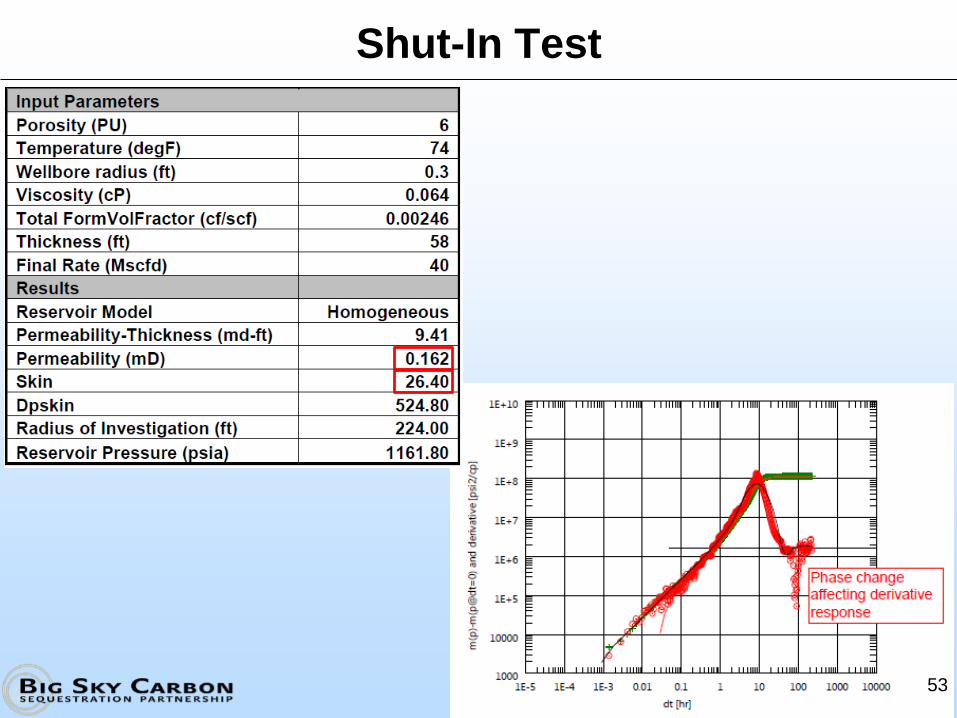
Shut-In Test
53
Shut –In P/T Profiles
54
Pressure (bar)
De
pth
(ft)
50 60 70 80
0
500
1000
1500
2000
2500
3000
Top P/Down
Top P/Up
Phase Interface
0.0688 bar/m
0.016 bar/m
Gas CO2
Liquid CO2
Temperature (degC)0 10 20 30
0
500
1000
1500
2000
2500
3000
Top T/Down
Top T/Up
Phase Interface
Up Gauging
DownGauging
Gas CO2
Liquid CO2
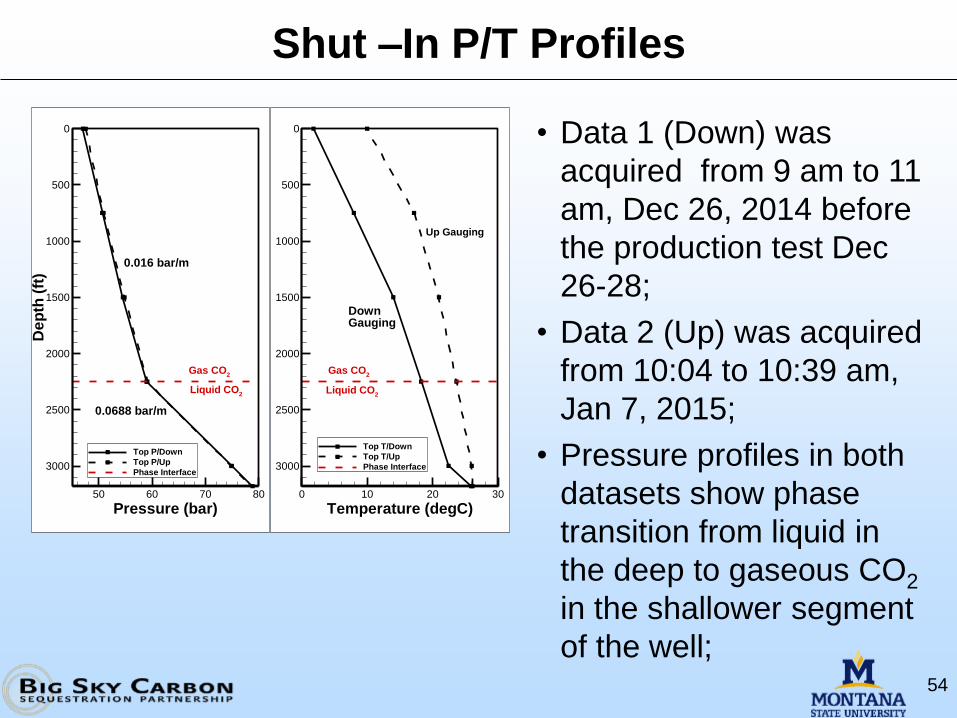
• Data 1 (Down) was
acquired from 9 am to 11
am, Dec 26, 2014 before
the production test Dec
26-28;
• Data 2 (Up) was acquired
from 10:04 to 10:39 am,
Jan 7, 2015;
• Pressure profiles in both
datasets show phase
transition from liquid in
the deep to gaseous CO2
in the shallower segment
of the well;
Danielson Well Test
55
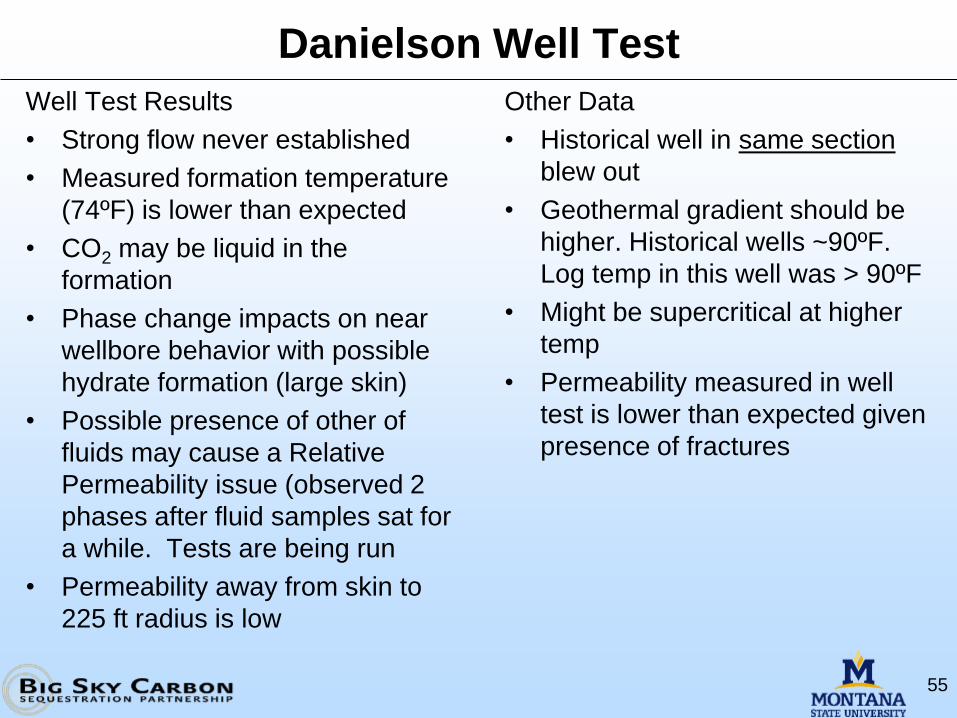
Well Test Results
• Strong flow never established
• Measured formation temperature
(74ºF) is lower than expected
• CO2 may be liquid in the
formation
• Phase change impacts on near
wellbore behavior with possible
hydrate formation (large skin)
• Possible presence of other of
fluids may cause a Relative
Permeability issue (observed 2
phases after fluid samples sat for
a while. Tests are being run
• Permeability away from skin to
225 ft radius is low
Other Data
• Historical well in same section
blew out
• Geothermal gradient should be
higher. Historical wells ~90ºF.
Log temp in this well was > 90ºF
• Might be supercritical at higher
temp
• Permeability measured in well
test is lower than expected given
presence of fractures
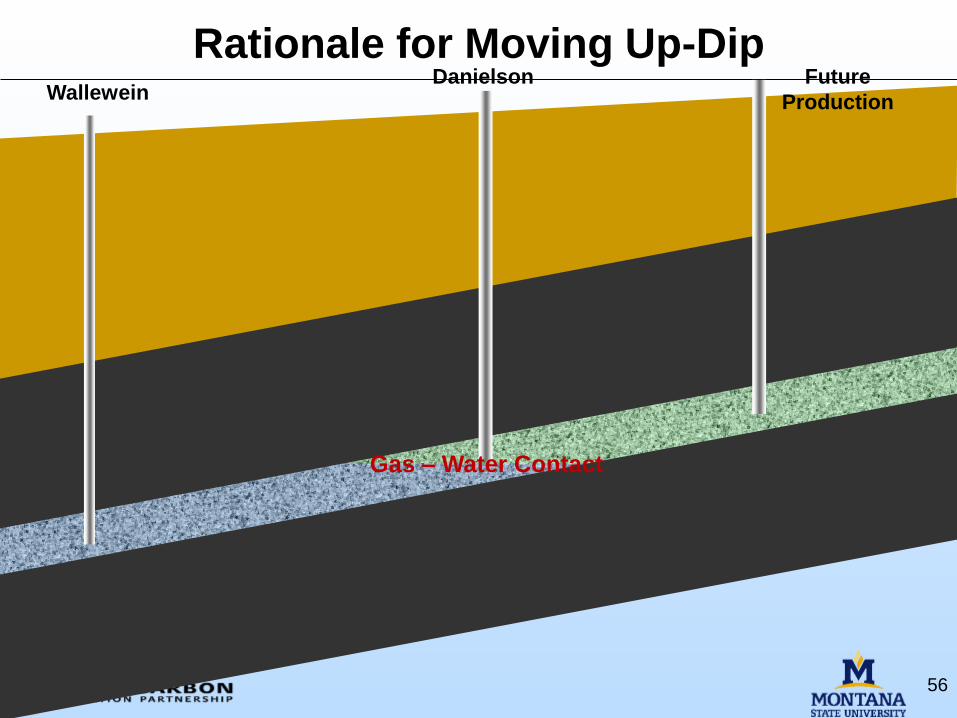
Rationale for Moving Up-Dip
56
WalleweinDanielson Future
Production
Gas – Water Contact
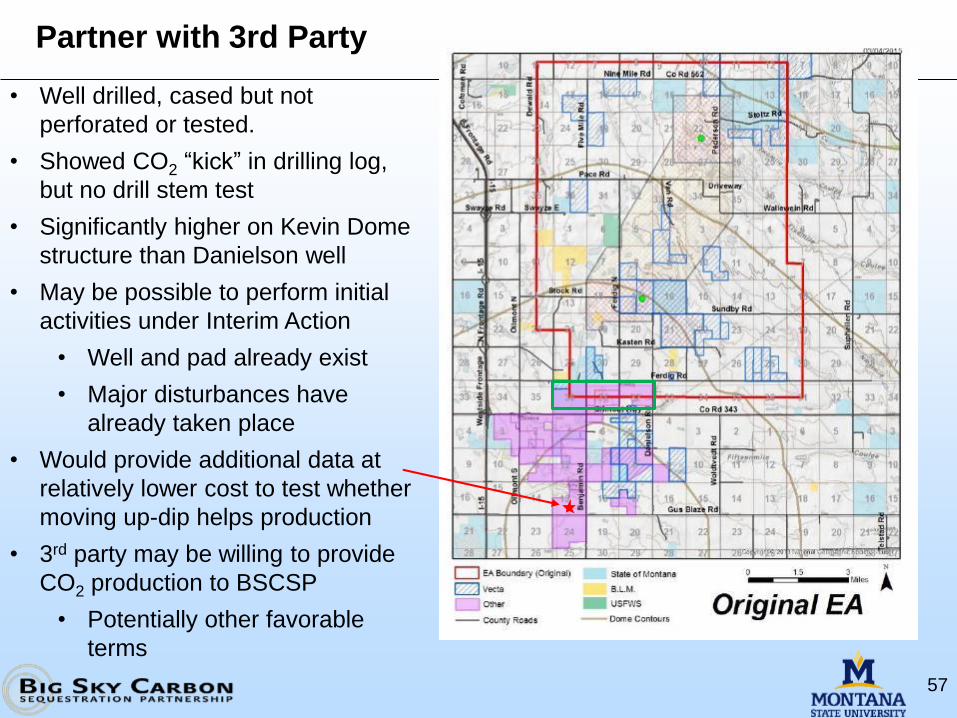
Partner with 3rd Party
57
• Well drilled, cased but not
perforated or tested.
• Showed CO2 “kick” in drilling log,
but no drill stem test
• Significantly higher on Kevin Dome
structure than Danielson well
• May be possible to perform initial
activities under Interim Action
• Well and pad already exist
• Major disturbances have
already taken place
• Would provide additional data at
relatively lower cost to test whether
moving up-dip helps production
• 3rd party may be willing to provide
CO2 production to BSCSP
• Potentially other favorable
terms
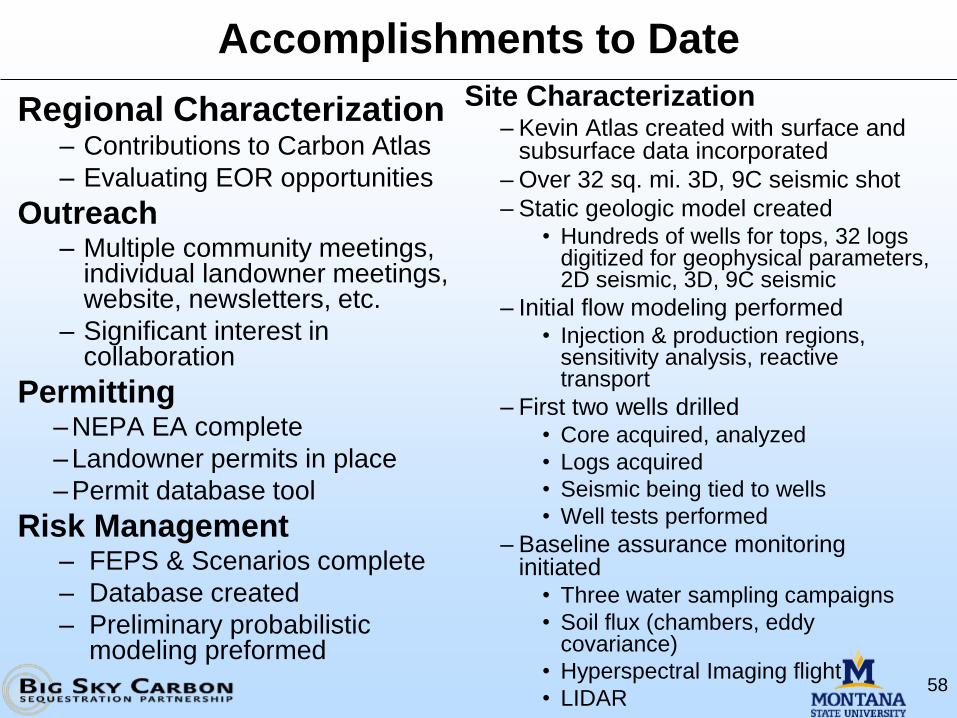
Accomplishments to Date
58
Regional Characterization– Contributions to Carbon Atlas
– Evaluating EOR opportunities
Outreach– Multiple community meetings,
individual landowner meetings, website, newsletters, etc.
– Significant interest in collaboration
Permitting–NEPA EA complete
–Landowner permits in place
–Permit database tool
Risk Management– FEPS & Scenarios complete
– Database created
– Preliminary probabilistic modeling preformed
Site Characterization– Kevin Atlas created with surface and
subsurface data incorporated
– Over 32 sq. mi. 3D, 9C seismic shot
– Static geologic model created• Hundreds of wells for tops, 32 logs
digitized for geophysical parameters, 2D seismic, 3D, 9C seismic
– Initial flow modeling performed• Injection & production regions,
sensitivity analysis, reactive transport
– First two wells drilled• Core acquired, analyzed
• Logs acquired
• Seismic being tied to wells
• Well tests performed
– Baseline assurance monitoring initiated
• Three water sampling campaigns
• Soil flux (chambers, eddy covariance)
• Hyperspectral Imaging flight
• LIDAR
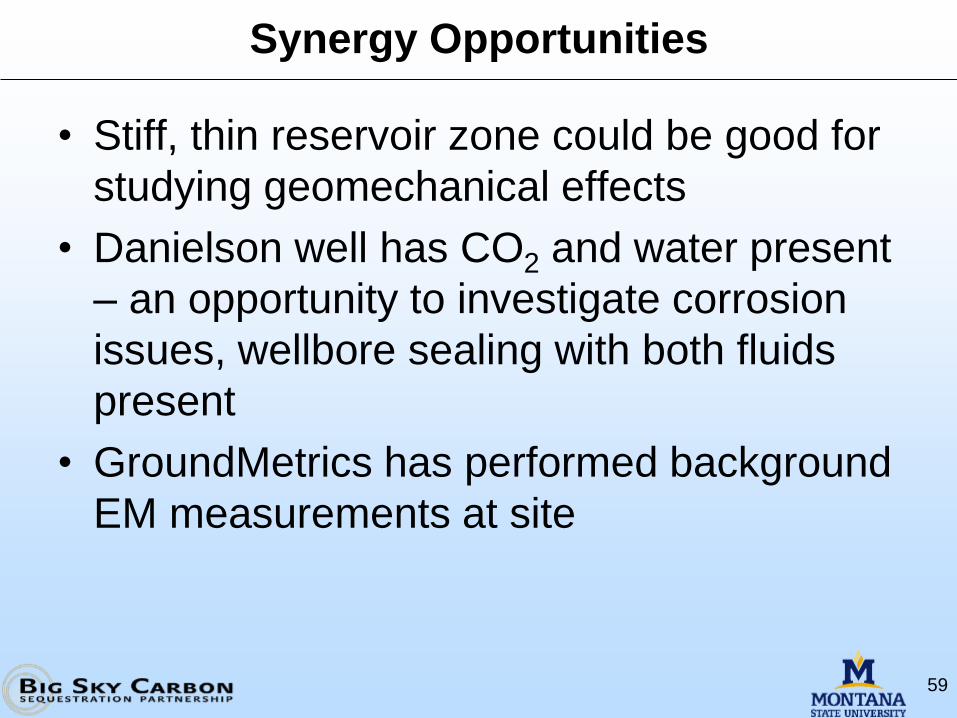
Synergy Opportunities
59
• Stiff, thin reservoir zone could be good for
studying geomechanical effects
• Danielson well has CO2 and water present
– an opportunity to investigate corrosion
issues, wellbore sealing with both fluids
present
• GroundMetrics has performed background
EM measurements at site
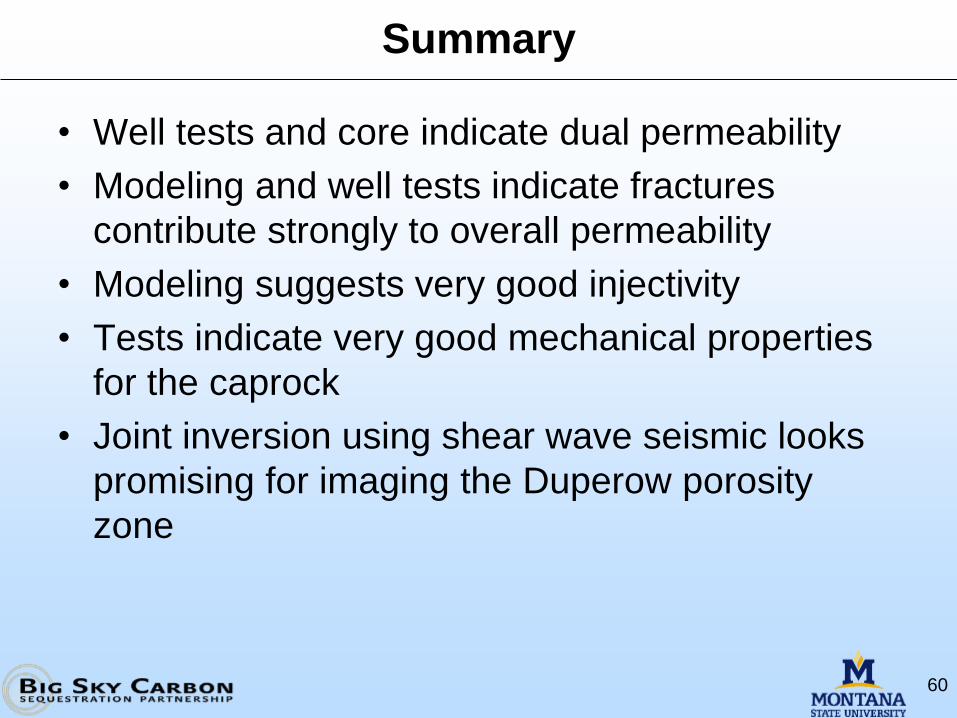
Summary
60
• Well tests and core indicate dual permeability
• Modeling and well tests indicate fractures
contribute strongly to overall permeability
• Modeling suggests very good injectivity
• Tests indicate very good mechanical properties
for the caprock
• Joint inversion using shear wave seismic looks
promising for imaging the Duperow porosity
zone
Acknowledgments
• US Department of Energy
• Altamont Oil & Gas, Inc.
• Columbia University & Barnard College
• Idaho National Laboratory
• Los Alamos National Laboratory
• Lawrence Berkeley National Laboratory
• Schlumberger Carbon Services
• SWCA Environmental Consultants
• Vecta Oil and Gas, Ltd.
• Washington State University
61
Appendix
– These slides will not be discussed during the
presentation, but are mandatory
62
Organization Chart: Management
63
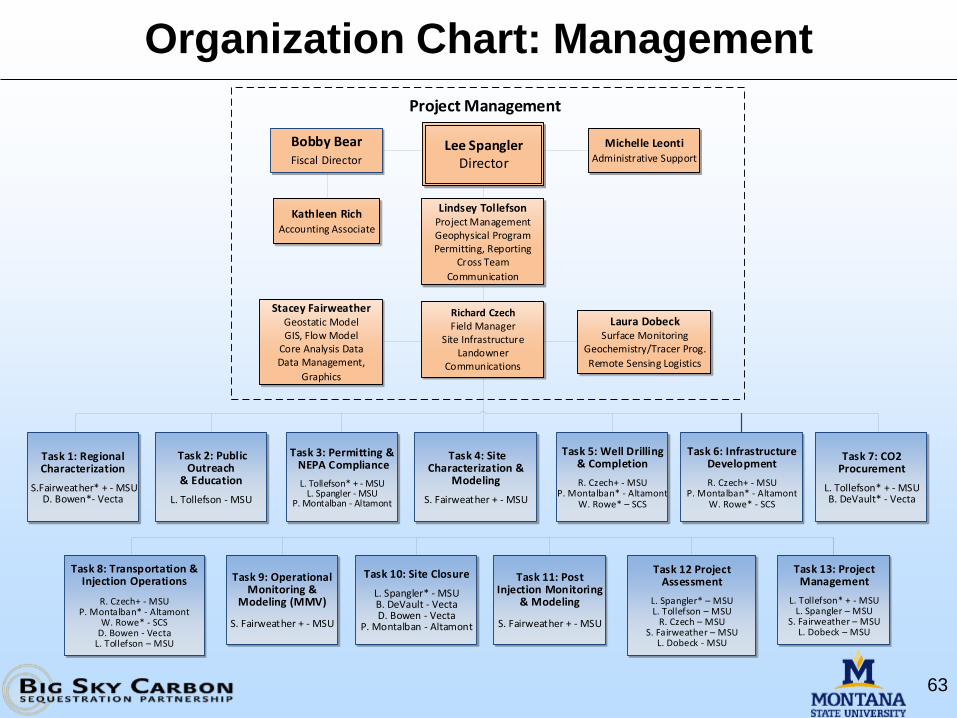
Task 1: Regional Characterization
S.Fairweather* + - MSUD. Bowen*- Vecta
Task 2: Public Outreach
& Education
L. Tollefson - MSU
Task 3: Permitting & NEPA Compliance
L. Tollefson* + - MSUL. Spangler - MSU
P. Montalban - Altamont
Task 4: Site Characterization &
Modeling
S. Fairweather + - MSU
Task 5: Well Drilling & Completion
R. Czech+ - MSUP. Montalban* - Altamont
W. Rowe* – SCS
Task 6: Infrastructure Development
R. Czech+ - MSUP. Montalban* - Altamont
W. Rowe* - SCS
Task 7: CO2 Procurement
L. Tollefson* + - MSUB. DeVault* - Vecta
Task 8: Transportation & Injection Operations
R. Czech+ - MSUP. Montalban* - Altamont
W. Rowe* - SCSD. Bowen - Vecta
L. Tollefson – MSU
Task 9: Operational Monitoring &
Modeling (MMV)
S. Fairweather + - MSU
Task 10: Site Closure
L. Spangler* - MSUB. DeVault - VectaD. Bowen - Vecta
P. Montalban - Altamont
Task 11: Post Injection Monitoring
& Modeling
S. Fairweather + - MSU
Task 13: Project Management
L. Tollefson* + - MSUL. Spangler – MSU
S. Fairweather – MSUL. Dobeck – MSU
Task 12 Project Assessment
L. Spangler* – MSUL. Tollefson – MSU
R. Czech – MSUS. Fairweather – MSU
L. Dobeck - MSU
Michelle LeontiAdministrative Support
Lee SpanglerDirector
Bobby BearFiscal Director
Stacey FairweatherGeostatic ModelGIS, Flow Model
Core Analysis DataData Management,
Graphics
Laura DobeckSurface Monitoring
Geochemistry/Tracer Prog.
Remote Sensing Logistics
Richard CzechField Manager
Site InfrastructureLandowner
Communications
Lindsey TollefsonProject ManagementGeophysical ProgramPermitting, Reporting
Cross Team
Communication
Project Management
Kathleen RichAccounting Associate
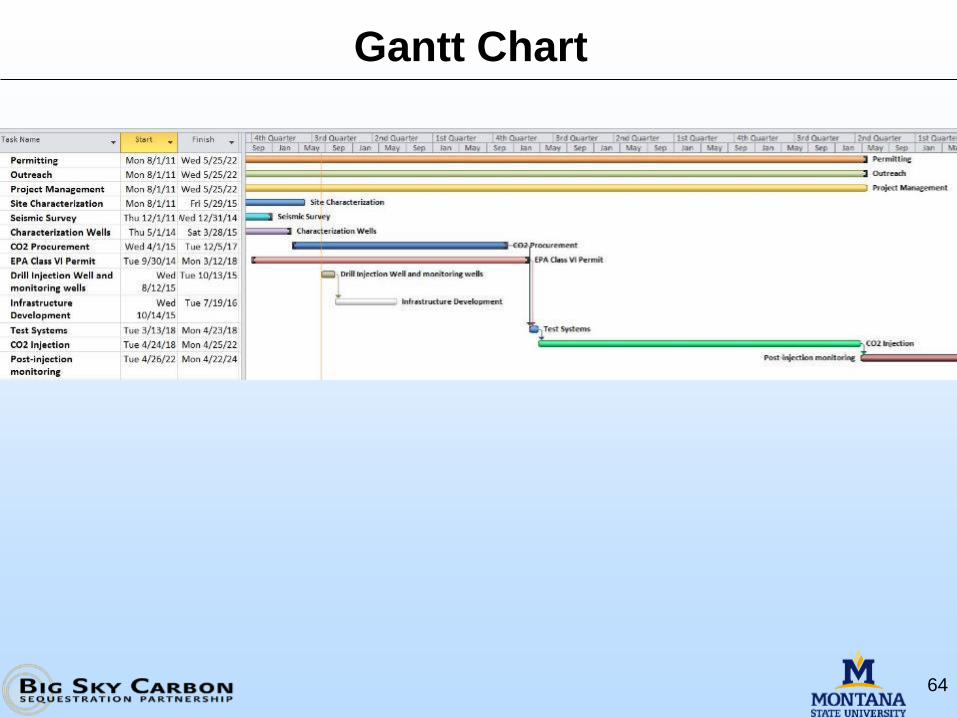
Gantt Chart
64
Bibliography
1. Oldenburg, C. M., Cihan, A., Zhou, Q., Fairweather, S., & Spangler, L. H. 2014.
Delineating Area of Review in a System with Pre-injection Relative
Overpressure. Energy Procedia 63: 3715-3722.
2. Tan, S.R., Huang, L.J. 2014. Reducing the computer memory requirement for
3D reverse-time migration with a boundary-wavefield extrapolation method.
Geophysics 79(5): S185-S194.
3. Barr, J., Humphries, S., Nehrir, A., Repasky, K., Dobeck, L., Carlsten, J., and
Spangler, L. 2014. Laser-Based Carbon Dioxide Monitoring Instrument Testing
During a 30-Day Controlled Underground Carbon Release Field Experiment.
International Journal of Greenhouse Gas Control 5(1): 138-145.
4. Dai, Z., Middleton, R., Viswanathan, H., Fessenden-Rahn, J., Bauman, J.,
Pawar, R., Lee, S-Y., and McPherson, B. 2014. An integrated framework for
optimizing CO2 sequestration and Enhanced Oil Recovery. Environmental
Science & Technology 1(1): 49-54.
65
Bibliography
5. Dai, Z., Stauffer, P., Carey, W., Middleton, R., Lu, Z., Jacobs, J., Hnottavange-
Telleen, K., and Spangler, L. 2014. Pre-Site Characterization Risk Analysis for
Commercial-Scale Carbon Sequestration. Environmental Science &
Technology 48(7): 3908-3915.
6. Long, J., Lawrence, R., Marshall, L. and Miller, P. 2014. Changes in field-level
cropping sequences: Indicators of shifting agricultural practices. Agriculture,
Ecosystems and Environment 189: 11–20.
7. Zhenxue, D., Stauffer, P., Carey, W., Middleton, R., Lu, Z., Jacobs, J.,
Hnottavange-Telleen, K., and Spangler, L. Pre-site characterization risk
analysis for commercial-scale carbon sequestration. Environmental Science &
Technology 48(7): 3908-3915.
8. Bricklemyer, R., Brown, D., Turk, P., and Clegg, S. 2013. Improved Intact Soil-
Core Carbon Determination Applying Regression Shrinkage and Variable
Selection Techniques to Complete Spectrum Laser-Induced Breakdown
Spectroscopy (LIBS). Applied Spectroscopy 67(10): 1185-1199.
66
Bibliography
9. Lewicki, J., Hilley, G., Dobeck, L., McLing, T., Kennedy, B., Bill, M., and
Marino, B. 2013. Geologic CO2 Input into Groundwater and the Atmosphere,
Soda Springs, Id, USA. Chemical Geology 339: 61-70.
10. Long, J., Lawrence, R., Greenwood, M., Marshall, L., and Miller, P. 2013.
Object-Oriented Crop Classification Using Multitemporal ETM+SLC-Off
Imagery and Random Forest. GIScience & Remote Sensing 50(4): 418-436.
11. Zhdanov, M., Endo, M., Black, N., Spangler, L., Fairweather, S., Hibbs, A.,
Eiskamp, G., and Will, R. 2013. Feasibility study of electromagnetic
monitoring of CO2 sequestration in deep reservoirs. SEG Technical Program.
12. Zhdanov, M., Endo, M., Black, N., Spangler, L., Fairweather, S., Hibbs, A.,
Eiskamp, G., and Will, R. 2013. Electromagnetic monitoring of CO2
sequestration in deep reservoirs. First Break 31(2): 85-92.
67