Embed Size (px)
Citation preview
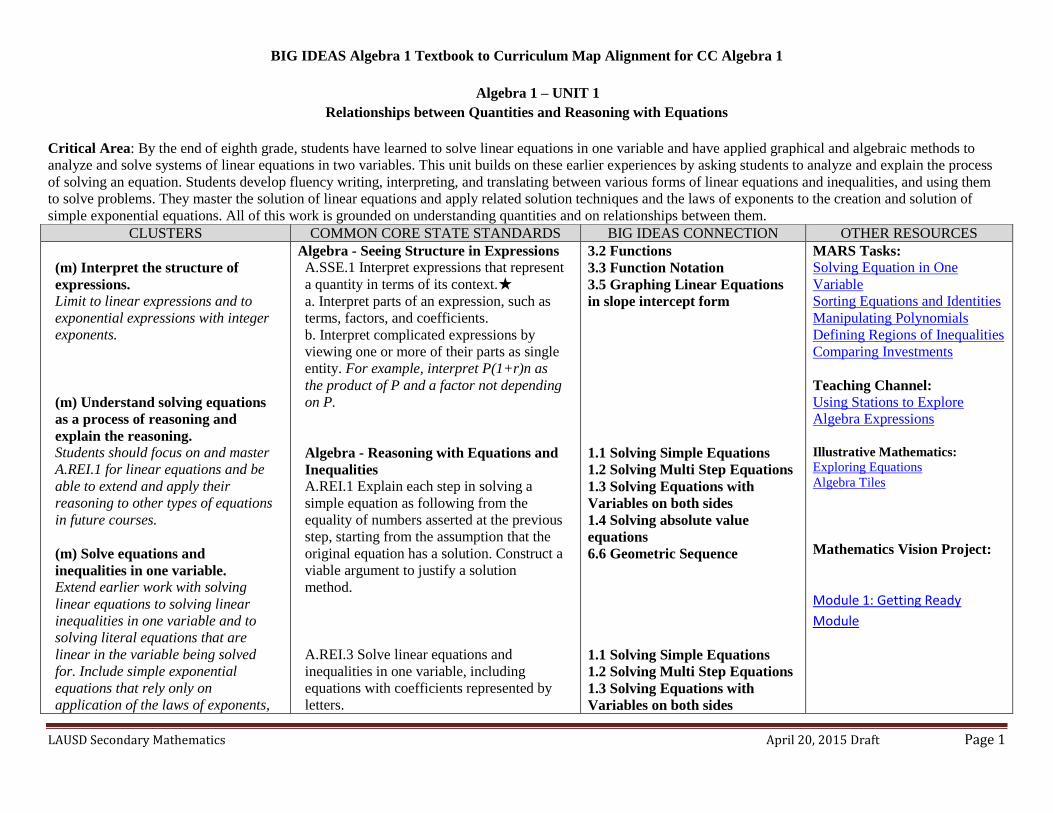
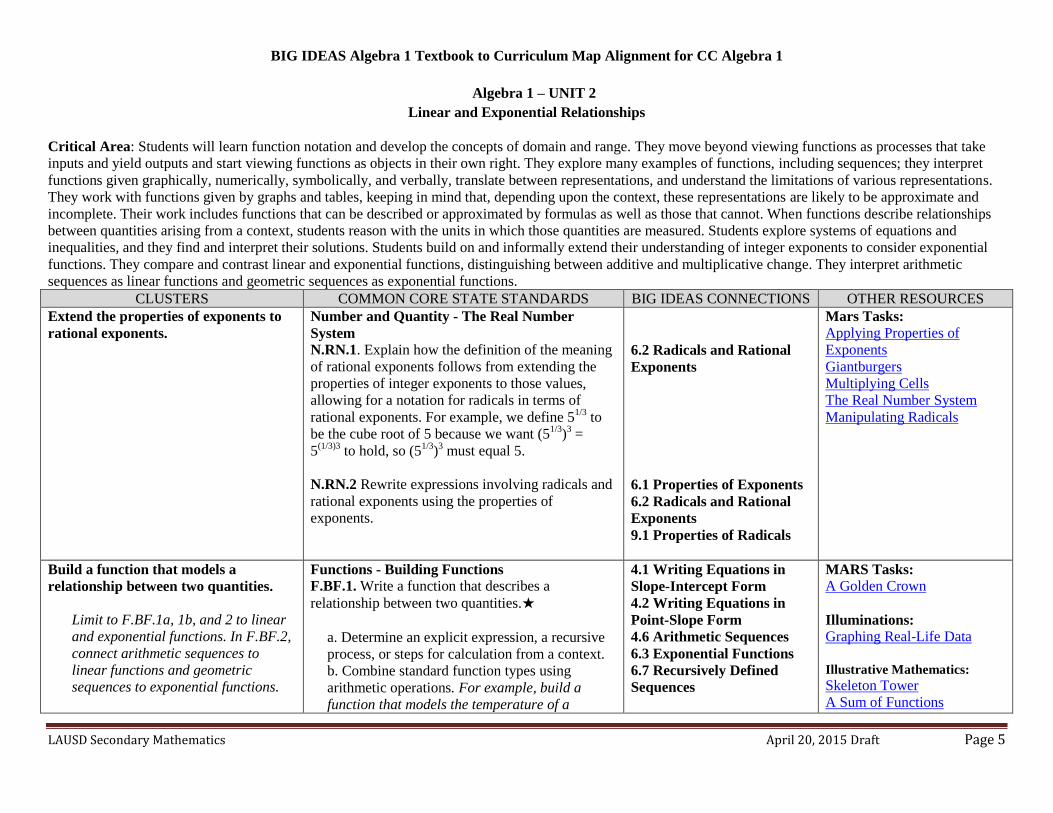
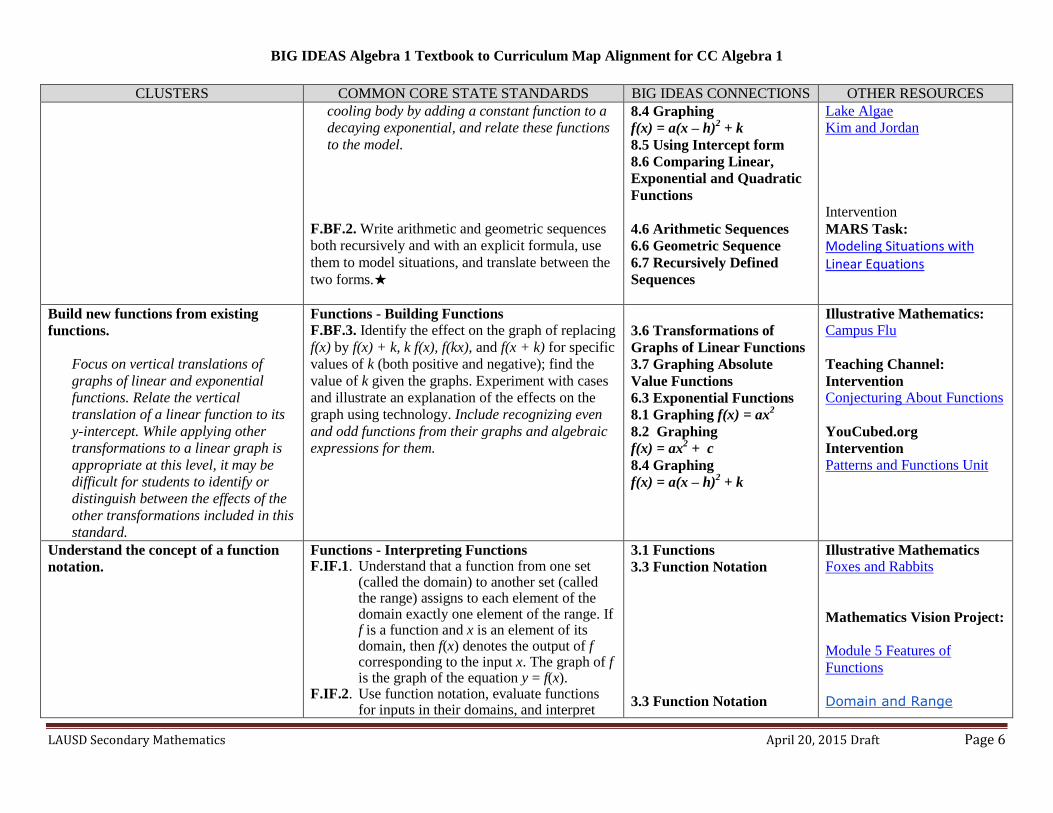
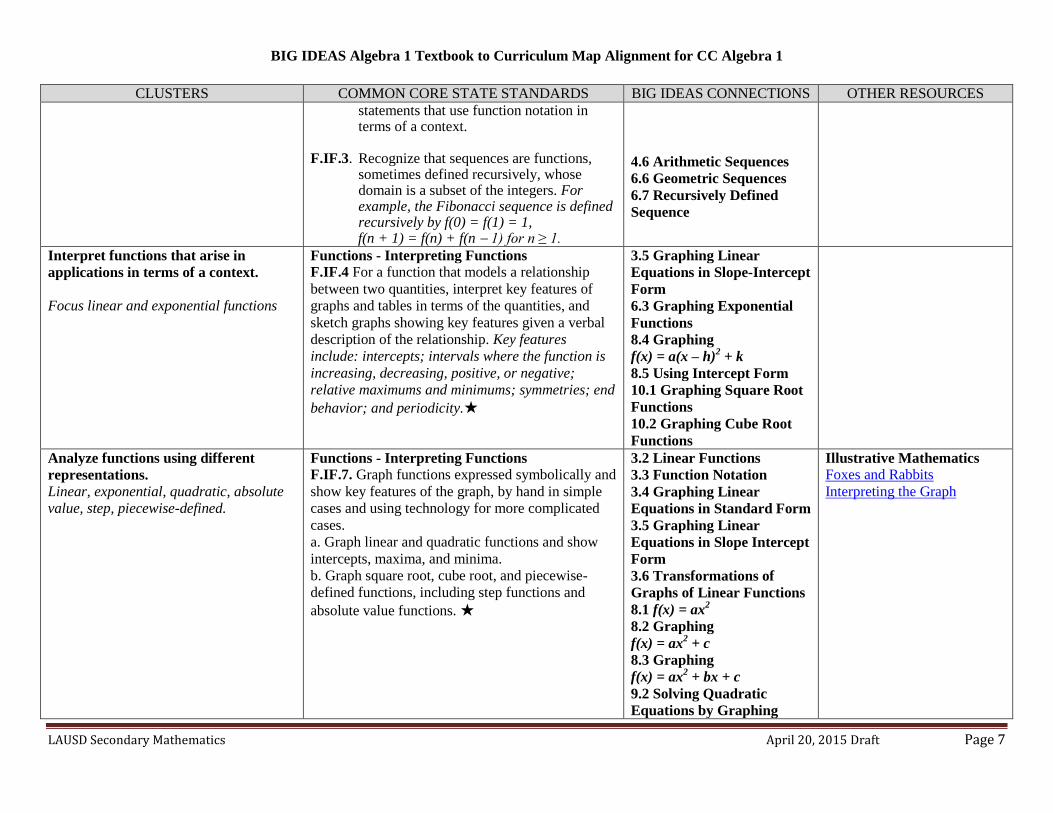
BIG IDEAS Algebra 1 Textbook to Curriculum Map Alignment for CC Algebra 1
LAUSD Secondary Mathematics April 20, 2015 Draft Page 1
Algebra 1 – UNIT 1
Relationships between Quantities and Reasoning with Equations
Critical Area: By the end of eighth grade, students have learned to solve linear equations in one variable and have applied graphical and algebraic methods to
analyze and solve systems of linear equations in two variables. This unit builds on these earlier experiences by asking students to analyze and explain the process
of solving an equation. Students develop fluency writing, interpreting, and translating between various forms of linear equations and inequalities, and using them
to solve problems. They master the solution of linear equations and apply related solution techniques and the laws of exponents to the creation and solution of
simple exponential equations. All of this work is grounded on understanding quantities and on relationships between them.
CLUSTERS COMMON CORE STATE STANDARDS BIG IDEAS CONNECTION OTHER RESOURCES
(m) Interpret the structure of
expressions. Limit to linear expressions and to
exponential expressions with integer
exponents.
(m) Understand solving equations
as a process of reasoning and
explain the reasoning. Students should focus on and master
A.REI.1 for linear equations and be
able to extend and apply their
reasoning to other types of equations
in future courses.
(m) Solve equations and
inequalities in one variable. Extend earlier work with solving
linear equations to solving linear
inequalities in one variable and to
solving literal equations that are
linear in the variable being solved
for. Include simple exponential
equations that rely only on
application of the laws of exponents,
Algebra - Seeing Structure in Expressions
A.SSE.1 Interpret expressions that represent
a quantity in terms of its context.★
a. Interpret parts of an expression, such as
terms, factors, and coefficients.
b. Interpret complicated expressions by
viewing one or more of their parts as single
entity. For example, interpret P(1+r)n as
the product of P and a factor not depending
on P.
Algebra - Reasoning with Equations and
Inequalities
A.REI.1 Explain each step in solving a
simple equation as following from the
equality of numbers asserted at the previous
step, starting from the assumption that the
original equation has a solution. Construct a
viable argument to justify a solution
method.
A.REI.3 Solve linear equations and
inequalities in one variable, including
equations with coefficients represented by
letters.
3.2 Functions
3.3 Function Notation
3.5 Graphing Linear Equations
in slope intercept form
1.1 Solving Simple Equations
1.2 Solving Multi Step Equations
1.3 Solving Equations with
Variables on both sides
1.4 Solving absolute value
equations
6.6 Geometric Sequence
1.1 Solving Simple Equations
1.2 Solving Multi Step Equations
1.3 Solving Equations with
Variables on both sides
MARS Tasks:
Solving Equation in One
Variable
Sorting Equations and Identities
Manipulating Polynomials
Defining Regions of Inequalities
Comparing Investments
Teaching Channel:
Using Stations to Explore
Algebra Expressions
Illustrative Mathematics:
Exploring Equations
Algebra Tiles
Mathematics Vision Project:
Module 1: Getting Ready
Module

BIG IDEAS Algebra 1 Textbook to Curriculum Map Alignment for CC Algebra 1
LAUSD Secondary Mathematics April 20, 2015 Draft Page 2
such as 5𝑥 = 125 or 2𝑥 =1
16.
A.REI.3.1 Solve one-variable equations and
inequalities involving absolute value,
graphing the solutions and interpreting them
in context. CA addition
1.4 Solving absolute value
equations
2.3 Solving inequalities using
addition or subtraction
2.3 Solving inequalities using
multiplication or division
2.4 Solving multi-step inequalities
2.5 Solving compound
inequalities
2.6-Solving absolute value
inequalities
Chapter 1: Solving Linear
Equations
Chapter 2: Solving Linear
Inequalities
Illustrative Mathematics:
Integer Solutions to Inequality Teaching Channel: Collaborate to Solve Compound Inequalities
(s/a) Reason quantitatively and use
units to solve problems. Working with quantities and the
relationships between them provides
grounding for work with expressions,
equations, and functions.
Numbers - Quantities
N.Q.1 Use units as a way to understand
problems and to guide the solution of multi-
step problems; choose and interpret units
consistently in formulas; choose and interpret
the scale and the origin in graphs and data
displays.
N.Q.2 Define appropriate quantities for the
purpose of descriptive modeling.
N.Q.3 Choose a level of accuracy appropriate
to limitations on measurement when reporting
quantities.
1.2- Solving Multi Step Equations
1.5 Rewriting Equations and
Formulas
3.4 Graphing Linear Equations
in Standard Form
4.1- Writing Equations in Slope
Intercept Form
4.5- Analyzing Lines of Best Fit
MARS TASK:
Leaky Faucet
Dan Meyer
Achieve the Core:
Yogurt Packing
Illustrative Mathematics:
How Much is a penny worth
Traffic Jam
Georgia Standards:
Unit 1: Relationships Between
Quantities

BIG IDEAS Algebra 1 Textbook to Curriculum Map Alignment for CC Algebra 1
LAUSD Secondary Mathematics April 20, 2015 Draft Page 3
(m) Create equations that describe
numbers or relationships. Limit A.CED.1 and A.CED.2 to linear
and exponential equations, and, in the
case of exponential equations, limit to
situations requiring evaluation of
exponential functions at integer inputs.
Limit A.CED.3 to linear equations and
inequalities. Limit A.CED.4 to formulas
which are linear in the variable of
interest.
Algebra - Creating Equations
A.CED.1 Create equations and inequalities in
one variable and use them to solve problems.
Include equations arising from linear and
quadratic functions, and simple rational and
exponential functions.
A.CED.2 Create equations in two or more
variables to represent relationships between
quantities; graph equations on coordinate axes
with labels and scales.
A.CED.3 Represent constraints by equations
or inequalities, and by systems of equations
and/or inequalities, and interpret solutions as
viable or non-viable options in a modeling
context. For example, represent inequalities
describing nutritional and cost constraints on
combinations of different foods.
1.1 Solving Simple Equations
1.2 Solving Multi Step Equations
1.3 Solving Equations with
Variables on both sides
1.4 Solving absolute value
equations
2.1 Writing and Graphing
Inequalities
2.2-2.6 as above
3.2 Linear Functions
3.3 Function Notation
3.4 Graphing Linear Equations
in Standard Form
3.5 Graphing Linear Equations
in Slope-Intercept Form
4.1 Writing Equations in Slope-
Intercept Form
4.2 Writing Equations in Point-
Form
5.1 Solving Systems of Linear
Equations by Graphing
5.2 Solving Systems of Linear
Equations by Substitutions
5.3 Solving Systems by Linear
Equations by Elimination
5.4 Solving Special Systems of
Linear Equations
5.5 Solving Equations by
Graphing
5.6 Graphing Linear Inequalities
in Two Variables
5.7 Systems of Linear
Inequalities
MARS Tasks:
Building and Solving Equations
Optimization Problems:
Boomerangs
Intervention Task
Lines and Linear Equations
Illuminations:
Bathtub Water Levels
Inside Mathematics:
On a Balance
Illustrative Mathematics:
Dimes and Quarters
Equations and Formulas
Rewriting Equations
Teaching Channel
Reviewing Linear Equations in
Two Variables

BIG IDEAS Algebra 1 Textbook to Curriculum Map Alignment for CC Algebra 1
LAUSD Secondary Mathematics April 20, 2015 Draft Page 4
A.CED.4 Rearrange formulas to highlight a
quantity of interest, using the same reasoning
as in solving equations. For example,
rearrange Ohm’s law V = IR to highlight
resistance R.
1.5 Rewriting Equations and
Formulas
9.3 Solving Quadratic Equations
by Completing the Square
BIG IDEAS Algebra 1 Textbook to Curriculum Map Alignment for CC Algebra 1
LAUSD Secondary Mathematics April 20, 2015 Draft Page 5
Algebra 1 – UNIT 2
Linear and Exponential Relationships
Critical Area: Students will learn function notation and develop the concepts of domain and range. They move beyond viewing functions as processes that take
inputs and yield outputs and start viewing functions as objects in their own right. They explore many examples of functions, including sequences; they interpret
functions given graphically, numerically, symbolically, and verbally, translate between representations, and understand the limitations of various representations.
They work with functions given by graphs and tables, keeping in mind that, depending upon the context, these representations are likely to be approximate and
incomplete. Their work includes functions that can be described or approximated by formulas as well as those that cannot. When functions describe relationships
between quantities arising from a context, students reason with the units in which those quantities are measured. Students explore systems of equations and
inequalities, and they find and interpret their solutions. Students build on and informally extend their understanding of integer exponents to consider exponential
functions. They compare and contrast linear and exponential functions, distinguishing between additive and multiplicative change. They interpret arithmetic
sequences as linear functions and geometric sequences as exponential functions.
CLUSTERS COMMON CORE STATE STANDARDS BIG IDEAS CONNECTIONS OTHER RESOURCES
Extend the properties of exponents to
rational exponents.
Number and Quantity - The Real Number
System
N.RN.1. Explain how the definition of the meaning
of rational exponents follows from extending the
properties of integer exponents to those values,
allowing for a notation for radicals in terms of
rational exponents. For example, we define 51/3
to
be the cube root of 5 because we want (51/3
)3 =
5(1/3)3
to hold, so (51/3
)3 must equal 5.
N.RN.2 Rewrite expressions involving radicals and
rational exponents using the properties of
exponents.
6.2 Radicals and Rational
Exponents
6.1 Properties of Exponents
6.2 Radicals and Rational
Exponents
9.1 Properties of Radicals
Mars Tasks:
Applying Properties of
Exponents
Giantburgers
Multiplying Cells
The Real Number System
Manipulating Radicals
Build a function that models a
relationship between two quantities.
Limit to F.BF.1a, 1b, and 2 to linear
and exponential functions. In F.BF.2,
connect arithmetic sequences to
linear functions and geometric
sequences to exponential functions.
Functions - Building Functions
F.BF.1. Write a function that describes a
relationship between two quantities.★
a. Determine an explicit expression, a recursive
process, or steps for calculation from a context.
b. Combine standard function types using
arithmetic operations. For example, build a
function that models the temperature of a
4.1 Writing Equations in
Slope-Intercept Form
4.2 Writing Equations in
Point-Slope Form
4.6 Arithmetic Sequences
6.3 Exponential Functions
6.7 Recursively Defined
Sequences
MARS Tasks:
A Golden Crown
Illuminations:
Graphing Real-Life Data
Illustrative Mathematics:
Skeleton Tower
A Sum of Functions
BIG IDEAS Algebra 1 Textbook to Curriculum Map Alignment for CC Algebra 1
LAUSD Secondary Mathematics April 20, 2015 Draft Page 6
CLUSTERS COMMON CORE STATE STANDARDS BIG IDEAS CONNECTIONS OTHER RESOURCES
cooling body by adding a constant function to a
decaying exponential, and relate these functions
to the model.
F.BF.2. Write arithmetic and geometric sequences
both recursively and with an explicit formula, use
them to model situations, and translate between the
two forms.★
8.4 Graphing
f(x) = a(x – h)2 + k
8.5 Using Intercept form
8.6 Comparing Linear,
Exponential and Quadratic
Functions
4.6 Arithmetic Sequences
6.6 Geometric Sequence
6.7 Recursively Defined
Sequences
Lake Algae
Kim and Jordan
Intervention
MARS Task:
Modeling Situations with Linear Equations
Build new functions from existing
functions.
Focus on vertical translations of
graphs of linear and exponential
functions. Relate the vertical
translation of a linear function to its
y-intercept. While applying other
transformations to a linear graph is
appropriate at this level, it may be
difficult for students to identify or
distinguish between the effects of the
other transformations included in this
standard.
Functions - Building Functions
F.BF.3. Identify the effect on the graph of replacing
f(x) by f(x) + k, k f(x), f(kx), and f(x + k) for specific
values of k (both positive and negative); find the
value of k given the graphs. Experiment with cases
and illustrate an explanation of the effects on the
graph using technology. Include recognizing even
and odd functions from their graphs and algebraic
expressions for them.
3.6 Transformations of
Graphs of Linear Functions
3.7 Graphing Absolute
Value Functions
6.3 Exponential Functions
8.1 Graphing f(x) = ax2
8.2 Graphing
f(x) = ax2 + c
8.4 Graphing
f(x) = a(x – h)2 + k
Illustrative Mathematics:
Campus Flu
Teaching Channel:
Intervention
Conjecturing About Functions
YouCubed.org
Intervention Patterns and Functions Unit
Understand the concept of a function
notation.
Functions - Interpreting Functions F.IF.1. Understand that a function from one set
(called the domain) to another set (called the range) assigns to each element of the domain exactly one element of the range. If f is a function and x is an element of its domain, then f(x) denotes the output of f corresponding to the input x. The graph of f is the graph of the equation y = f(x).
F.IF.2. Use function notation, evaluate functions for inputs in their domains, and interpret
3.1 Functions
3.3 Function Notation
3.3 Function Notation
Illustrative Mathematics
Foxes and Rabbits
Mathematics Vision Project:
Module 5 Features of
Functions
Domain and Range
BIG IDEAS Algebra 1 Textbook to Curriculum Map Alignment for CC Algebra 1
LAUSD Secondary Mathematics April 20, 2015 Draft Page 7
CLUSTERS COMMON CORE STATE STANDARDS BIG IDEAS CONNECTIONS OTHER RESOURCES
statements that use function notation in terms of a context.
F.IF.3. Recognize that sequences are functions,
sometimes defined recursively, whose domain is a subset of the integers. For example, the Fibonacci sequence is defined recursively by f(0) = f(1) = 1,
f(n + 1) = f(n) + f(n 1) for n ≥ 1.
4.6 Arithmetic Sequences
6.6 Geometric Sequences
6.7 Recursively Defined
Sequence
Interpret functions that arise in
applications in terms of a context.
Focus linear and exponential functions
Functions - Interpreting Functions
F.IF.4 For a function that models a relationship
between two quantities, interpret key features of
graphs and tables in terms of the quantities, and
sketch graphs showing key features given a verbal
description of the relationship. Key features
include: intercepts; intervals where the function is
increasing, decreasing, positive, or negative;
relative maximums and minimums; symmetries; end
behavior; and periodicity.★
3.5 Graphing Linear
Equations in Slope-Intercept
Form
6.3 Graphing Exponential
Functions
8.4 Graphing
f(x) = a(x – h)2 + k
8.5 Using Intercept Form
10.1 Graphing Square Root
Functions
10.2 Graphing Cube Root
Functions
Analyze functions using different
representations.
Linear, exponential, quadratic, absolute
value, step, piecewise-defined.
Functions - Interpreting Functions
F.IF.7. Graph functions expressed symbolically and
show key features of the graph, by hand in simple
cases and using technology for more complicated
cases.
a. Graph linear and quadratic functions and show
intercepts, maxima, and minima.
b. Graph square root, cube root, and piecewise-
defined functions, including step functions and
absolute value functions. ★
3.2 Linear Functions
3.3 Function Notation
3.4 Graphing Linear
Equations in Standard Form
3.5 Graphing Linear
Equations in Slope Intercept
Form
3.6 Transformations of
Graphs of Linear Functions
8.1 f(x) = ax2
8.2 Graphing
f(x) = ax2 + c
8.3 Graphing
f(x) = ax2 + bx + c
9.2 Solving Quadratic
Equations by Graphing
Illustrative Mathematics
Foxes and Rabbits
Interpreting the Graph
BIG IDEAS Algebra 1 Textbook to Curriculum Map Alignment for CC Algebra 1
LAUSD Secondary Mathematics April 20, 2015 Draft Page 8
CLUSTERS COMMON CORE STATE STANDARDS BIG IDEAS CONNECTIONS OTHER RESOURCES
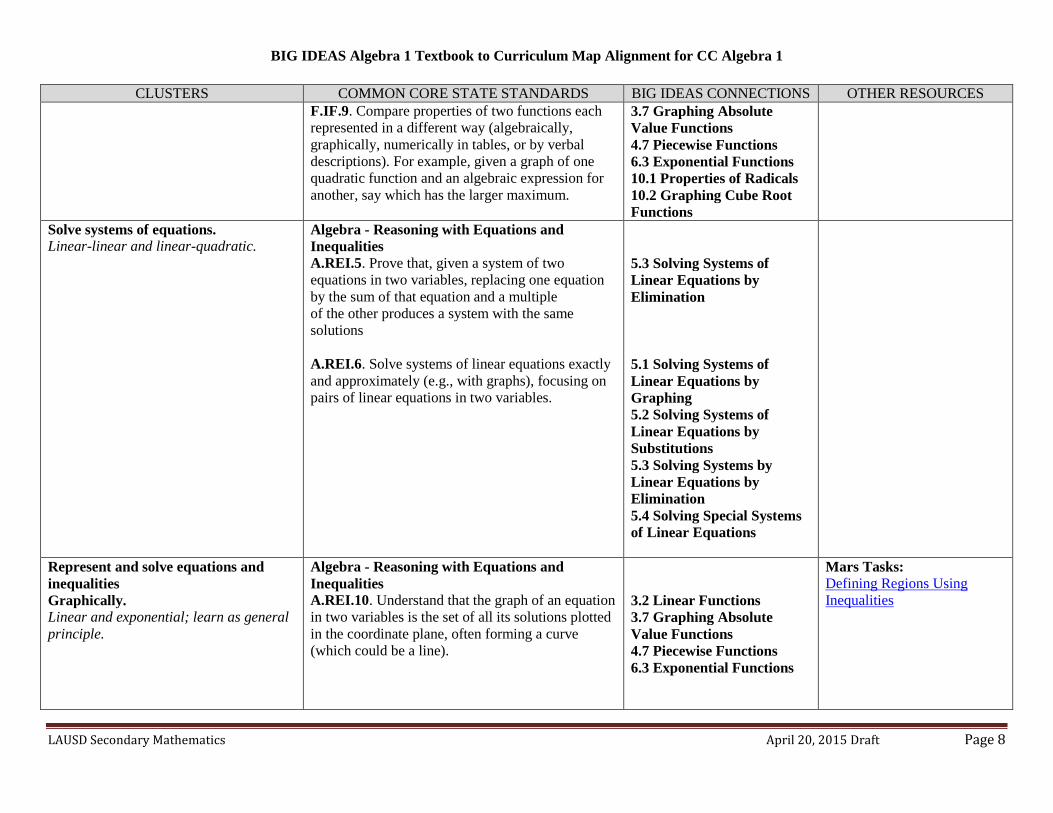
F.IF.9. Compare properties of two functions each
represented in a different way (algebraically,
graphically, numerically in tables, or by verbal
descriptions). For example, given a graph of one
quadratic function and an algebraic expression for
another, say which has the larger maximum.
3.7 Graphing Absolute
Value Functions
4.7 Piecewise Functions
6.3 Exponential Functions
10.1 Properties of Radicals
10.2 Graphing Cube Root
Functions
Solve systems of equations.
Linear-linear and linear-quadratic. Algebra - Reasoning with Equations and
Inequalities
A.REI.5. Prove that, given a system of two
equations in two variables, replacing one equation
by the sum of that equation and a multiple
of the other produces a system with the same
solutions
A.REI.6. Solve systems of linear equations exactly
and approximately (e.g., with graphs), focusing on
pairs of linear equations in two variables.
5.3 Solving Systems of
Linear Equations by
Elimination
5.1 Solving Systems of
Linear Equations by
Graphing
5.2 Solving Systems of
Linear Equations by
Substitutions
5.3 Solving Systems by
Linear Equations by
Elimination
5.4 Solving Special Systems
of Linear Equations
Represent and solve equations and
inequalities
Graphically.
Linear and exponential; learn as general
principle.
Algebra - Reasoning with Equations and
Inequalities
A.REI.10. Understand that the graph of an equation
in two variables is the set of all its solutions plotted
in the coordinate plane, often forming a curve
(which could be a line).
3.2 Linear Functions
3.7 Graphing Absolute
Value Functions
4.7 Piecewise Functions
6.3 Exponential Functions
Mars Tasks:
Defining Regions Using
Inequalities
BIG IDEAS Algebra 1 Textbook to Curriculum Map Alignment for CC Algebra 1
LAUSD Secondary Mathematics April 20, 2015 Draft Page 9
CLUSTERS COMMON CORE STATE STANDARDS BIG IDEAS CONNECTIONS OTHER RESOURCES
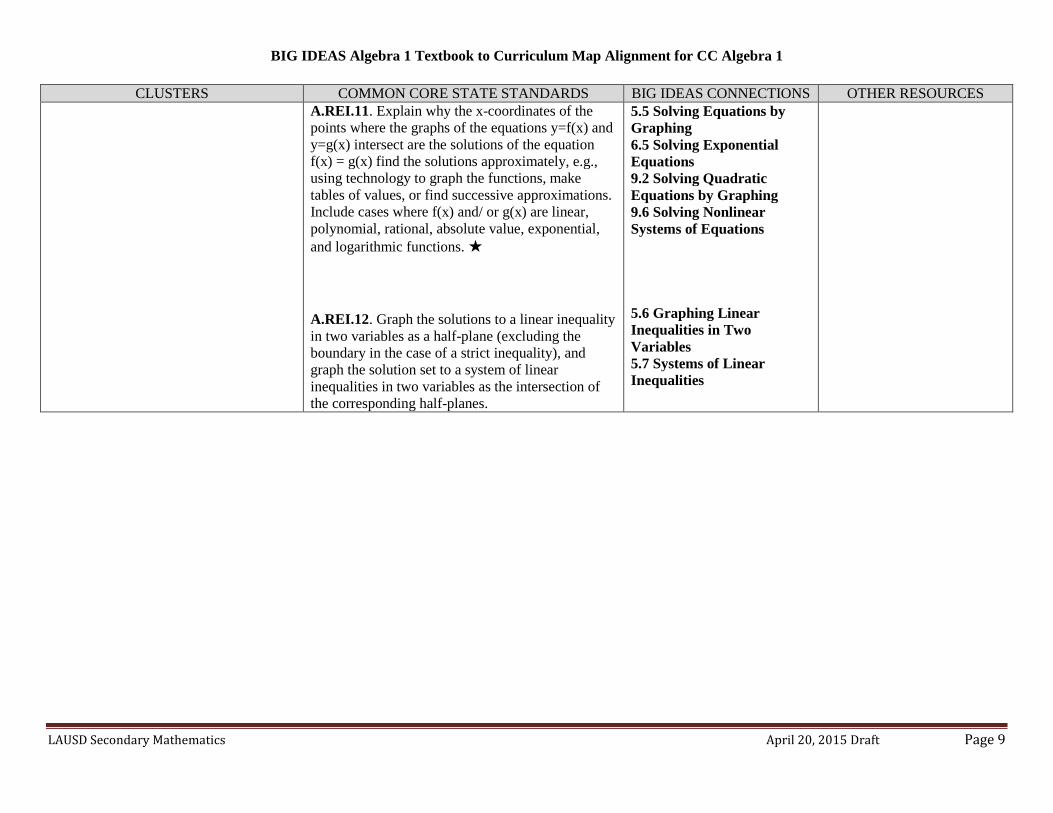
A.REI.11. Explain why the x-coordinates of the
points where the graphs of the equations y=f(x) and
y=g(x) intersect are the solutions of the equation
f(x) = g(x) find the solutions approximately, e.g.,
using technology to graph the functions, make
tables of values, or find successive approximations.
Include cases where f(x) and/ or g(x) are linear,
polynomial, rational, absolute value, exponential,
and logarithmic functions. ★
A.REI.12. Graph the solutions to a linear inequality
in two variables as a half-plane (excluding the
boundary in the case of a strict inequality), and
graph the solution set to a system of linear
inequalities in two variables as the intersection of
the corresponding half-planes.
5.5 Solving Equations by
Graphing
6.5 Solving Exponential
Equations
9.2 Solving Quadratic
Equations by Graphing
9.6 Solving Nonlinear
Systems of Equations
5.6 Graphing Linear
Inequalities in Two
Variables
5.7 Systems of Linear
Inequalities
BIG IDEAS Algebra 1 Textbook to Curriculum Map Alignment for CC Algebra 1
LAUSD Secondary Mathematics April 20, 2015 Draft Page 10
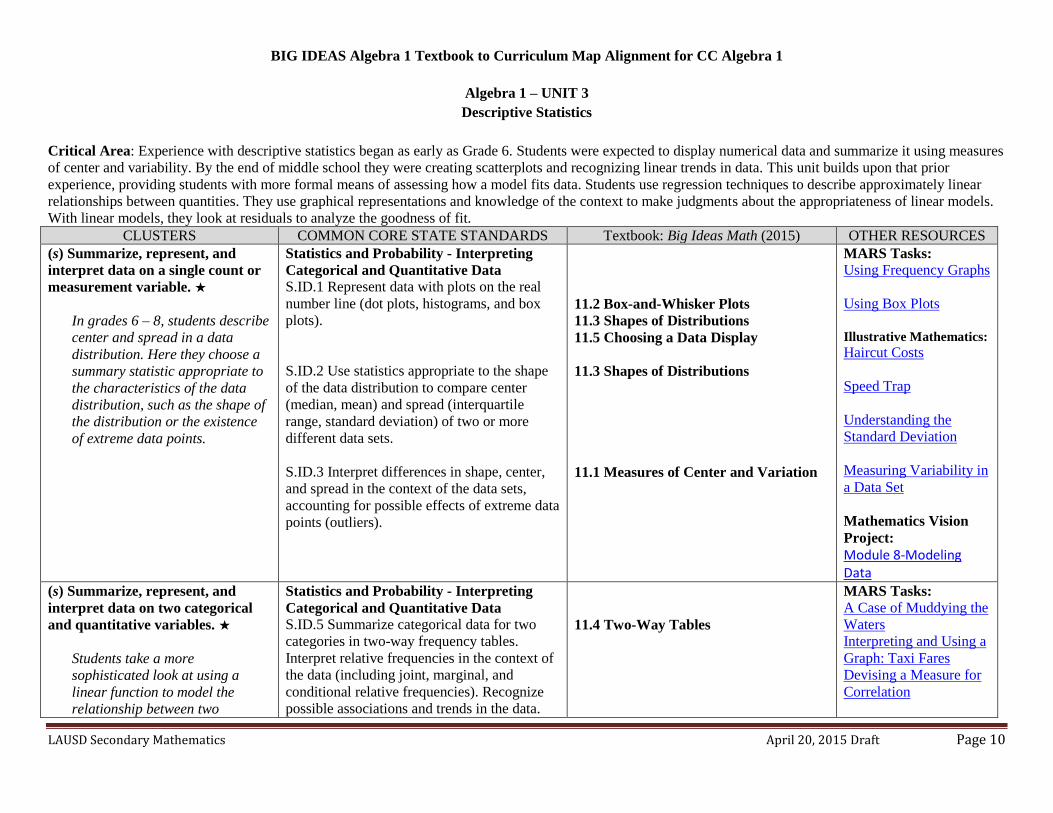
Algebra 1 – UNIT 3
Descriptive Statistics
Critical Area: Experience with descriptive statistics began as early as Grade 6. Students were expected to display numerical data and summarize it using measures
of center and variability. By the end of middle school they were creating scatterplots and recognizing linear trends in data. This unit builds upon that prior
experience, providing students with more formal means of assessing how a model fits data. Students use regression techniques to describe approximately linear
relationships between quantities. They use graphical representations and knowledge of the context to make judgments about the appropriateness of linear models.
With linear models, they look at residuals to analyze the goodness of fit.
CLUSTERS COMMON CORE STATE STANDARDS Textbook: Big Ideas Math (2015) OTHER RESOURCES
(s) Summarize, represent, and
interpret data on a single count or
measurement variable. ★
In grades 6 – 8, students describe
center and spread in a data
distribution. Here they choose a
summary statistic appropriate to
the characteristics of the data
distribution, such as the shape of
the distribution or the existence
of extreme data points.
Statistics and Probability - Interpreting
Categorical and Quantitative Data
S.ID.1 Represent data with plots on the real
number line (dot plots, histograms, and box
plots).
S.ID.2 Use statistics appropriate to the shape
of the data distribution to compare center
(median, mean) and spread (interquartile
range, standard deviation) of two or more
different data sets.
S.ID.3 Interpret differences in shape, center,
and spread in the context of the data sets,
accounting for possible effects of extreme data
points (outliers).
11.2 Box-and-Whisker Plots
11.3 Shapes of Distributions
11.5 Choosing a Data Display
11.3 Shapes of Distributions
11.1 Measures of Center and Variation
MARS Tasks:
Using Frequency Graphs
Using Box Plots
Illustrative Mathematics:
Haircut Costs
Speed Trap
Understanding the
Standard Deviation
Measuring Variability in
a Data Set
Mathematics Vision
Project:
Module 8-Modeling Data
(s) Summarize, represent, and
interpret data on two categorical
and quantitative variables. ★
Students take a more
sophisticated look at using a
linear function to model the
relationship between two
Statistics and Probability - Interpreting
Categorical and Quantitative Data
S.ID.5 Summarize categorical data for two
categories in two-way frequency tables.
Interpret relative frequencies in the context of
the data (including joint, marginal, and
conditional relative frequencies). Recognize
possible associations and trends in the data.
11.4 Two-Way Tables
MARS Tasks:
A Case of Muddying the
Waters
Interpreting and Using a
Graph: Taxi Fares
Devising a Measure for
Correlation
BIG IDEAS Algebra 1 Textbook to Curriculum Map Alignment for CC Algebra 1
LAUSD Secondary Mathematics April 20, 2015 Draft Page 11
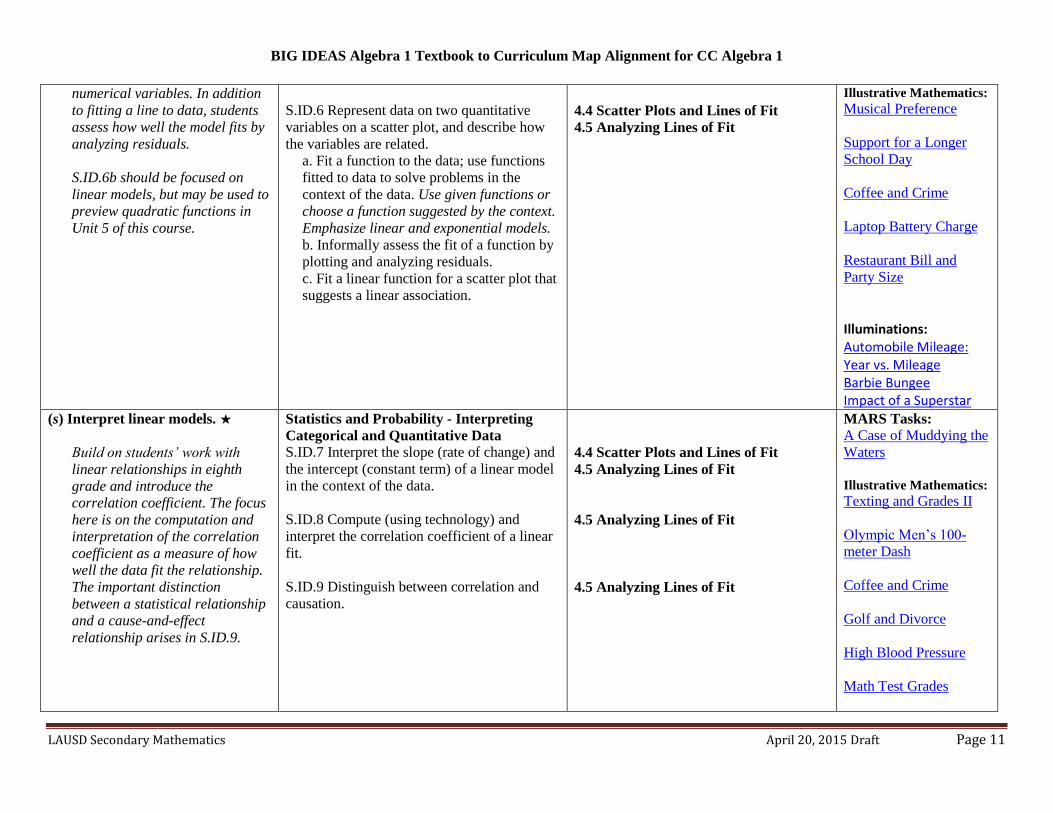
numerical variables. In addition
to fitting a line to data, students
assess how well the model fits by
analyzing residuals.
S.ID.6b should be focused on
linear models, but may be used to
preview quadratic functions in
Unit 5 of this course.
S.ID.6 Represent data on two quantitative
variables on a scatter plot, and describe how
the variables are related.
a. Fit a function to the data; use functions
fitted to data to solve problems in the
context of the data. Use given functions or
choose a function suggested by the context.
Emphasize linear and exponential models.
b. Informally assess the fit of a function by
plotting and analyzing residuals.
c. Fit a linear function for a scatter plot that
suggests a linear association.
4.4 Scatter Plots and Lines of Fit
4.5 Analyzing Lines of Fit
Illustrative Mathematics:
Musical Preference
Support for a Longer
School Day
Coffee and Crime
Laptop Battery Charge
Restaurant Bill and
Party Size
Illuminations: Automobile Mileage: Year vs. Mileage Barbie Bungee Impact of a Superstar
(s) Interpret linear models. ★
Build on students’ work with
linear relationships in eighth
grade and introduce the
correlation coefficient. The focus
here is on the computation and
interpretation of the correlation
coefficient as a measure of how
well the data fit the relationship.
The important distinction
between a statistical relationship
and a cause-and-effect
relationship arises in S.ID.9.
Statistics and Probability - Interpreting
Categorical and Quantitative Data
S.ID.7 Interpret the slope (rate of change) and
the intercept (constant term) of a linear model
in the context of the data.
S.ID.8 Compute (using technology) and
interpret the correlation coefficient of a linear
fit.
S.ID.9 Distinguish between correlation and
causation.
4.4 Scatter Plots and Lines of Fit
4.5 Analyzing Lines of Fit
4.5 Analyzing Lines of Fit
4.5 Analyzing Lines of Fit
MARS Tasks:
A Case of Muddying the
Waters
Illustrative Mathematics:
Texting and Grades II
Olympic Men’s 100-
meter Dash
Coffee and Crime
Golf and Divorce
High Blood Pressure
Math Test Grades
BIG IDEAS Algebra 1 Textbook to Curriculum Map Alignment for CC Algebra 1
LAUSD Secondary Mathematics April 20, 2015 Draft Page 12

BIG IDEAS Algebra 1 Textbook to Curriculum Map Alignment for CC Algebra 1
LAUSD Secondary Mathematics April 20, 2015 Draft Page 13
Algebra 1 - Unit 4 Expressions and Equations
Description of the critical area: In this unit, students build on their knowledge from Unit 2, where they extended the laws of exponents to rational exponents.
Students apply this new understanding of numbers and strengthen their ability to see structure in and create quadratic and exponential expressions. They create and
solve equations, inequalities, and systems of equations involving quadratic expressions and determine the values of the function it defines. Students understand that
polynomials form a system analogous to the integers, they choose and produce equivalent forms of an expression.
CLUSTERS COMMON CORE STATE STANDARDS BIG IDEAS CONNECTIONS OTHER RESOURCES
(m)Interpret the structure of
expressions.
Algebra - Seeing Structure in Expressions
A-SSE.1 Interpret expressions that represent a quantity
in terms of its context.★
a. Interpret parts of an expression, such as terms,
factors, and coefficients.
b. Interpret complicated expressions by viewing one or
more of their parts as a single entity. For example,
interpret P(1+r)n as the product of P and a factor not
depending on P.
A-SSE.2 Use the structure of an expression to identify
ways to rewrite it. For example, see x4 – y4 as (x 2)
2 –
(y 2)
2, thus recognizing it as a difference of squares
that can be factored as (x 2 – y
2)(x
2 + y
2).
6.4 Exponential Growth and
Decay
7.1 Adding and Subtracting
Polynomials
7.4 Solving Polynomials
Equations in Factored Form
7.5 Factoring 𝒙𝟐 + 𝒃𝒙 + 𝒄
7.6 Factoring 𝒂𝒙𝟐 + 𝒃𝒙 + 𝒄
7.7 Factoring Special
Products
7.8 Factoring Polynomials
Completely
Mathematics Vision Project:
Mathematics Vision Project:
Module 2- Structures of
Expressions
Module 1 – Quadratic Functions
(m)Write expressions in
equivalent forms to solve
problems.
Algebra - Seeing Structure in Expressions
A-SSE.3 Choose and produce an equivalent form of an
expression to reveal and explain properties of the
quantity represented by the expression.★
a. Factor a quadratic expression to reveal the zeros of
the function it defines.
b. Complete the square in a quadratic expression to
reveal the maximum or minimum value of the function
it defines.
c. Use the properties of exponents to transform
expressions for exponential functions. For example the
6.4 Exponential Growth and
Decay
7.5 Factoring 𝒙𝟐 + 𝒃𝒙 + 𝒄
7.6 Factoring 𝒂𝒙𝟐 + 𝒃𝒙 + 𝒄
7.7 Factoring Special
Products
7.8 Factoring Polynomials
Completely
8.5 Using Intercept Form
9.4 Solving Quadratic
Equations by Completing the
Mars Tasks:
Interpreting Algebraic
Expressions
Forming Quadratics
BIG IDEAS Algebra 1 Textbook to Curriculum Map Alignment for CC Algebra 1
LAUSD Secondary Mathematics April 20, 2015 Draft Page 14
CLUSTERS COMMON CORE STATE STANDARDS BIG IDEAS CONNECTIONS OTHER RESOURCES
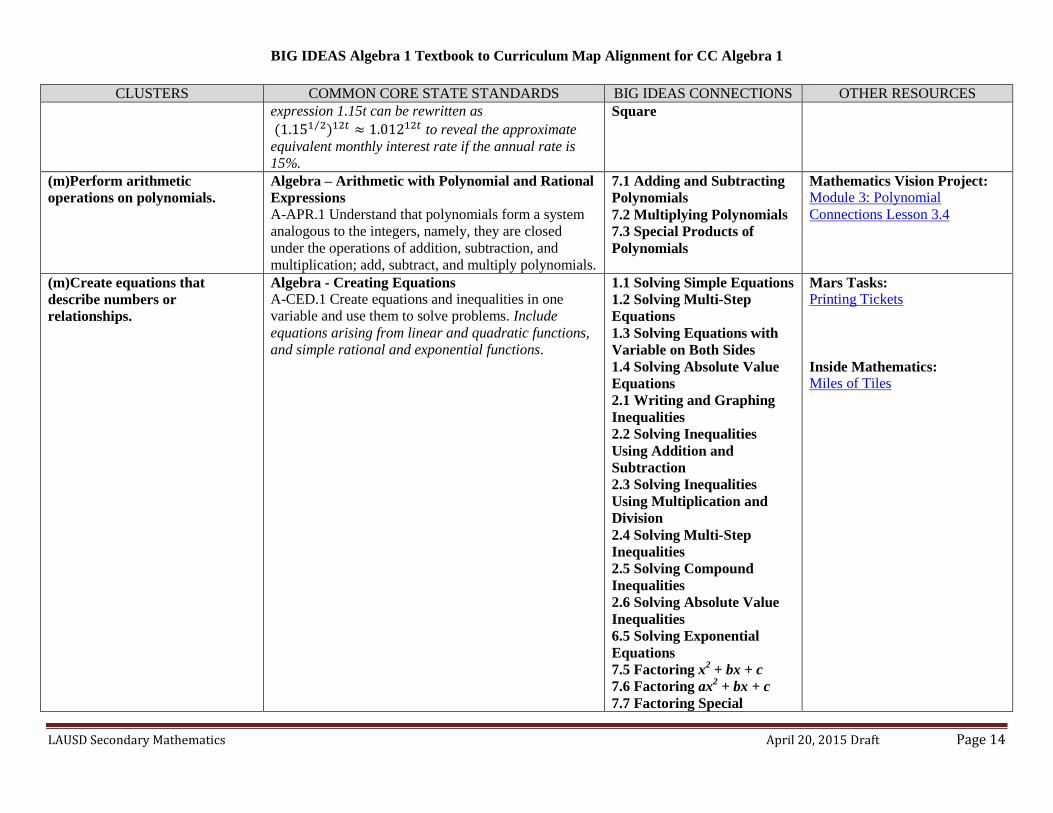
expression 1.15t can be rewritten as
(1.151 2⁄ )12𝑡 ≈ 1.01212𝑡 to reveal the approximate
equivalent monthly interest rate if the annual rate is
15%.
Square
(m)Perform arithmetic
operations on polynomials.
Algebra – Arithmetic with Polynomial and Rational
Expressions
A-APR.1 Understand that polynomials form a system
analogous to the integers, namely, they are closed
under the operations of addition, subtraction, and
multiplication; add, subtract, and multiply polynomials.
7.1 Adding and Subtracting
Polynomials
7.2 Multiplying Polynomials
7.3 Special Products of
Polynomials
Mathematics Vision Project:
Module 3: Polynomial
Connections Lesson 3.4
(m)Create equations that
describe numbers or
relationships.
Algebra - Creating Equations
A-CED.1 Create equations and inequalities in one
variable and use them to solve problems. Include
equations arising from linear and quadratic functions,
and simple rational and exponential functions.
1.1 Solving Simple Equations
1.2 Solving Multi-Step
Equations
1.3 Solving Equations with
Variable on Both Sides
1.4 Solving Absolute Value
Equations
2.1 Writing and Graphing
Inequalities
2.2 Solving Inequalities
Using Addition and
Subtraction
2.3 Solving Inequalities
Using Multiplication and
Division
2.4 Solving Multi-Step
Inequalities
2.5 Solving Compound
Inequalities
2.6 Solving Absolute Value
Inequalities
6.5 Solving Exponential
Equations
7.5 Factoring x2 + bx + c
7.6 Factoring ax2 + bx + c
7.7 Factoring Special
Mars Tasks:
Printing Tickets
Inside Mathematics:
Miles of Tiles

BIG IDEAS Algebra 1 Textbook to Curriculum Map Alignment for CC Algebra 1
LAUSD Secondary Mathematics April 20, 2015 Draft Page 15
CLUSTERS COMMON CORE STATE STANDARDS BIG IDEAS CONNECTIONS OTHER RESOURCES
A-CED.2 Create equations in two or more variables to
represent relationships between quantities; graph
equations on coordinate axes with labels and scales.
Products
7.8 Factoring Polynomials
Completely
9.3 Solving Quadratic
Equations by using Square
Roots
9.4 Solving Quadratic
Equations by using
Completing the Square
9.5 Solving Quadratic
Equations by using
Quadratic Formula
3.2 Linear Functions
3.3 Function Notation
3.4 Graphing Linear
Equations is Standard Form
3.5 Graphing Linear
Equations in Slope-Intercept
Form
3.7 Graphing Absolute Value
Function
4.1 Writing Equations in
Slope-Intercept Form
4.2 Writing Equations in
Point-Slope Form
4.3 Writing Equations of
Parallel and Perpendicular
Lines
4.7 Piecewise Functions
6.3 Exponential Functions
6.4 Exponential Growth and
Decay
8.1 Graphing f(x) = ax2
8.2 Graphing f(x)= ax2 + c
8.3 Graphing
BIG IDEAS Algebra 1 Textbook to Curriculum Map Alignment for CC Algebra 1
LAUSD Secondary Mathematics April 20, 2015 Draft Page 16
CLUSTERS COMMON CORE STATE STANDARDS BIG IDEAS CONNECTIONS OTHER RESOURCES
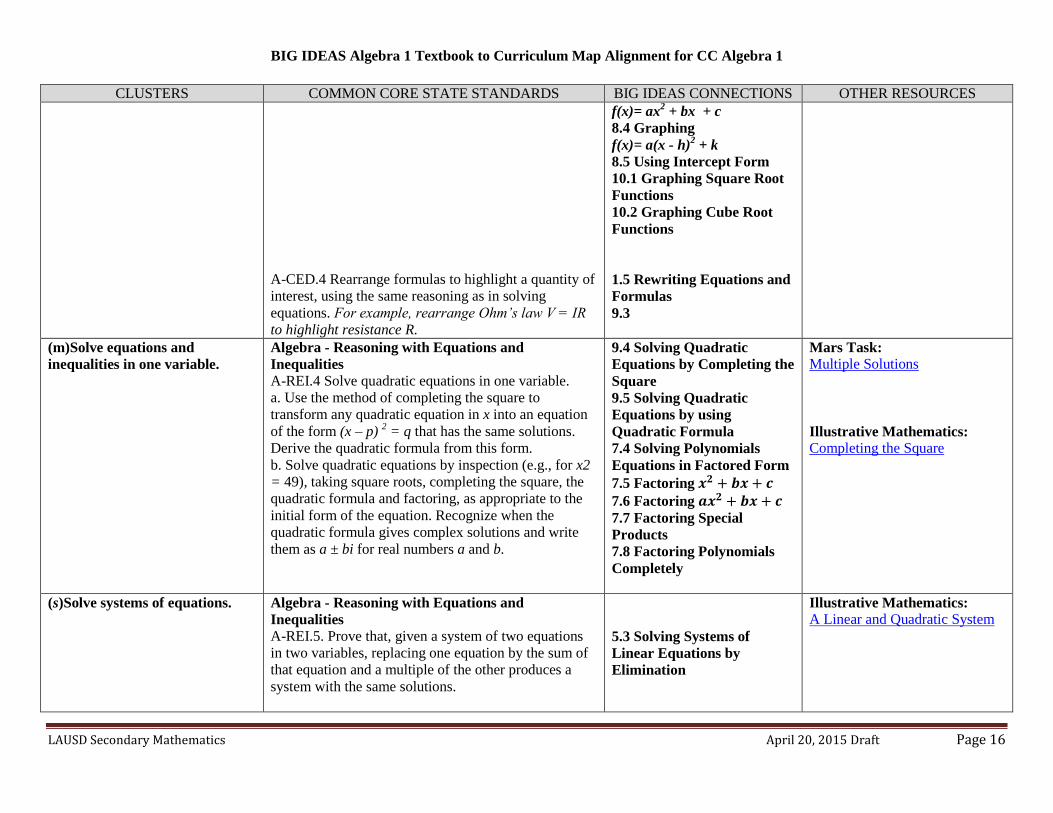
A-CED.4 Rearrange formulas to highlight a quantity of
interest, using the same reasoning as in solving
equations. For example, rearrange Ohm’s law V = IR
to highlight resistance R.
f(x)= ax2 + bx + c
8.4 Graphing
f(x)= a(x - h)2 + k
8.5 Using Intercept Form
10.1 Graphing Square Root
Functions
10.2 Graphing Cube Root
Functions
1.5 Rewriting Equations and
Formulas
9.3
(m)Solve equations and
inequalities in one variable.
Algebra - Reasoning with Equations and
Inequalities
A-REI.4 Solve quadratic equations in one variable.
a. Use the method of completing the square to
transform any quadratic equation in x into an equation
of the form (x – p) 2 = q that has the same solutions.
Derive the quadratic formula from this form.
b. Solve quadratic equations by inspection (e.g., for x2
= 49), taking square roots, completing the square, the
quadratic formula and factoring, as appropriate to the
initial form of the equation. Recognize when the
quadratic formula gives complex solutions and write
them as a ± bi for real numbers a and b.
9.4 Solving Quadratic
Equations by Completing the
Square
9.5 Solving Quadratic
Equations by using
Quadratic Formula
7.4 Solving Polynomials
Equations in Factored Form
7.5 Factoring 𝒙𝟐 + 𝒃𝒙 + 𝒄
7.6 Factoring 𝒂𝒙𝟐 + 𝒃𝒙 + 𝒄
7.7 Factoring Special
Products
7.8 Factoring Polynomials
Completely
Mars Task:
Multiple Solutions
Illustrative Mathematics:
Completing the Square
(s)Solve systems of equations.
Algebra - Reasoning with Equations and
Inequalities
A-REI.5. Prove that, given a system of two equations
in two variables, replacing one equation by the sum of
that equation and a multiple of the other produces a
system with the same solutions.
5.3 Solving Systems of
Linear Equations by
Elimination
Illustrative Mathematics:
A Linear and Quadratic System

BIG IDEAS Algebra 1 Textbook to Curriculum Map Alignment for CC Algebra 1
LAUSD Secondary Mathematics April 20, 2015 Draft Page 17
CLUSTERS COMMON CORE STATE STANDARDS BIG IDEAS CONNECTIONS OTHER RESOURCES
A-REI.6. Solve systems of linear equations exactly and
approximately (e.g., with graphs), focusing on pairs of
linear equations in two variables
A-REI.7 Solve a simple system consisting of a linear
equation and a quadratic equation in two variables
algebraically and graphically. For example, find the
points of intersection between the line y = –3x and the
circle x 2 + y
2 = 3.
5.1 Solving Systems of
Linear Equations by
Graphing
5.2 Solving Systems of
Linear Equations by
Substitution
5.3 Solving Systems of
Linear Equations by
Elimination
5.4 Solving Special Systems
of Linear Equations
9.6 Solving Nonlinear
Systems of Equations

BIG IDEAS Algebra 1 Textbook to Curriculum Map Alignment for CC Algebra 1
LAUSD Secondary Mathematics April 20, 2015 Draft Page 18
Algebra 1– UNIT 5
Quadratic Functions and Modeling
Critical Area: In preparation for work with quadratic relationships students explore distinctions between rational and irrational numbers. They consider quadratic
functions, comparing the key characteristics of quadratic functions to those of linear and exponential functions. They select from among these functions to model
phenomena. Students learn to anticipate the graph of a quadratic function by interpreting various forms of quadratic expressions. In particular, they identify the real
solutions of a quadratic equation as the zeros of a related quadratic function. Students learn that when quadratic equations do not have real solutions the number
system must be extended so that solutions exist, analogous to the way in which extending the whole numbers to the negative numbers allows x+1 = 0 to have a
solution. Formal work with complex numbers comes in Algebra II. Students expand their experience with functions to include more specialized functions—
absolute value, step, and those that are piecewise-defined.
CLUSTER HEADINGS COMMON CORE STATE STANDARDS BIG IDEA CONNECTIONS OTHER RESOURCES
(s)Use properties of rational and
irrational numbers.
Connect N.RN.3 to physical situations,
e.g., finding the perimeter of a square
of area 2.
Number and Quantity - The Real Number
System
N.RN.3 Explain why the sum or product of two
rational numbers is rational; that the sum of a
rational number and an irrational number is
irrational; and that the product of a nonzero
rational number and an irrational number is
irrational.
9.1 Properties of Radicals
(m)Interpret functions that arise in
applications in terms of a context.
Focus on quadratic functions;
compare with linear and
exponential functions studied in
Unit 2.
Functions - Interpreting Functions
F.IF.4 For a function that models a relationship
between two quantities, interpret key features
of graphs and tables in terms of the quantities,
and sketch graphs showing key features given
a verbal description of the relationship. Key
features include: intercepts; intervals where
the function is increasing, decreasing, positive,
or negative; relative maximums and
minimums; symmetries; end behavior; and
periodicity.★
3.5 Graphing Linear Equations
in Slope-Intercept Form
6.3 Exponential Functions
8.4 Graphing
f(x)= a(x - h)2 + k
8.5 Using Intercept Form
9.2 Solving Quadratic Equations
by Graphing
10.1 Graphing Square Root
Functions
10.2 Graphing Cube Root
Functions
Illustrative Mathematics:
Influenza Epidemic
Warming and Cooling
How is the Weather?
Logistic Growth Model, Explicit
Version
The Canoe Trip, Variation 1
The High School Gym
Temperature Change
Average Cost

BIG IDEAS Algebra 1 Textbook to Curriculum Map Alignment for CC Algebra 1
LAUSD Secondary Mathematics April 20, 2015 Draft Page 19
F.IF.5 Relate the domain of a function to its
graph and, where applicable, to the quantitative
relationship it describes. For example, if the
function h(n) gives the number of person-hours
it takes to assemble n engines in a factory, then
the positive integers would be an appropriate
domain for
he function.★
F.IF.6 Calculate and interpret the average rate
of change of a function (presented
symbolically or as a table) over a specified
interval. Estimate the rate of change from a
graph.★
3.2 Linear Functions
8.6 Comparing Linear,
Exponential and Quadratic
Functions
10.1 Graphing Square Root
Functions
10.2 Graphing Cube Root
Functions
(m)Analyze functions using different
representations.
For F.IF.7b, compare and contrast
absolute value, step and piecewise
defined functions with linear,
quadratic, and exponential
functions. Highlight issues of
domain, range, and usefulness
when examining piecewise defined
functions. Note that this unit, and
in particular in F.IF.8b, extends
the work begun in Unit 2 on
exponential functions with integer
exponents. For F.IF.9, focus on
expanding the types of functions
considered to include, linear,
exponential, and quadratic.
Extend work with quadratics to
include the relationship between
Functions - Interpreting Functions
F.IF.7 Graph functions expressed symbolically
and show key features of the graph, by hand in
simple cases and using technology for more
complicated cases.★
a. Graph linear and quadratic functions
and show intercepts, maxima, and
minima.
b. Graph square root, cube root, and
piecewise-defined functions, including
3.2 Linear Functions
3.3 Function Notation
3.4 Graphing Linear Equations
is Standard Form
3.5 Graphing Linear Equations
in Slope-Intercept Form
8.1 Graphing 𝒇(𝒙) = 𝒂𝒙𝟐
8.2 Graphing 𝒇(𝒙) = 𝒂𝒙𝟐 + 𝒄
8.3 Graphing 𝒇(𝒙) = 𝒂𝒙𝟐 +𝒃𝒙 + 𝒄
9.2 Solving Quadratic Equations
by Graphing
3.7 Graphing Absolute Value
Functions
MARS Tasks:
Functions and Everyday
Situations
Illustrative Mathematics:
Identifying Graphs of Functions
Which Function?
Throwing Baseballs

BIG IDEAS Algebra 1 Textbook to Curriculum Map Alignment for CC Algebra 1
LAUSD Secondary Mathematics April 20, 2015 Draft Page 20
coefficients and roots, and that
once roots are known, a quadratic
equation can be factored.
step functions and absolute value
functions.
F.IF.8 Write a function defined by an
expression in different but equivalent forms to
reveal and explain different properties of the
function.
a. Use the process of factoring and
completing the square in a quadratic
function to show zeros, extreme values,
and symmetry of the graph, and interpret
these in terms of a context.
b. Use the properties of exponents to
interpret expressions for exponential
functions. For example, identify percent
rate of change in functions such as y =
(1.02)t, y = (0.97)
t , y = (1.01)
12t, y =
(1.2)t/10
and classify them as representing
exponential growth or decay.
F.IF.9 Compare properties of two functions
each represented in a different way
(algebraically, graphically, numerically in
tables, or by verbal descriptions). For example,
given a graph of one quadratic function and an
algebraic expression for another, say which
has the larger maximum.
4.7 Piecewise Functions
10.1 Graphing Square Root
Functions
10.2 Graphing Cube Root
Functions
8.5 Using Intercept Form
9.4 Solving Quadratic Equations
by Completing the Square
6.4 Exponential Growth and
Decay
3.3 Function Notation
6.3 Exponential Function
8.3 Graphing 𝒇(𝒙) = 𝒂𝒙𝟐 + 𝒄
10.1 Graphing Square Root
Functions
10.2 Graphing Cube Root
Functions
(m)Build a function that models a
relationship between two quantities.
Focus on situations that exhibit a
Functions - Building Functions
F.BF.1 Write a function that describes a
relationship between two quantities.★
a. Determine an explicit expression, a
4.1 Writing Equations in Slope-
Graphing Stories (1-3
stories)
Mars Task:

BIG IDEAS Algebra 1 Textbook to Curriculum Map Alignment for CC Algebra 1
LAUSD Secondary Mathematics April 20, 2015 Draft Page 21
quadratic relationship. recursive process, or steps for calculation
from a context.
b. Combine standard function types using
arithmetic operations. For example, build
a function that models the temperature of
a cooling body by adding a constant
function to a decaying exponential, and
relate these functions to the model.
Intercept Form
4.2 Writing Equations in Point-
Slope Form
4.6 Arithmetic Sequences
6.3 Exponential Function
6.4 Exponential Growth and
Decay
6.7 Recursively Defined
Sequences
8.4 Graphing f(x)= a(x - h)2 + k
8.5 Using Intercept Form
8.6 Comparing Linear,
Exponential, and
Patchwork
Sidewalk Patterns
(s)Build new functions from existing
functions.
For F.BF.3, focus on quadratic
functions, and consider including
absolute value functions. For
F.BF.4a, focus on linear functions
but consider simple situations
where the domain of the function
must be restricted in order for the
inverse to exist, such as f(x) = x2,
x>0.
Functions - Building Functions
F.BF.3 Identify the effect on the graph of
replacing f(x) by f(x) + k, k f(x), f(kx), and f(x +
k) for specific values of k (both positive and
negative); find the value of k given the graphs.
Experiment with cases and illustrate an
explanation of the effects on the graph using
technology. Include recognizing even and odd
functions from their graphs and algebraic
expressions for them.
F.BF.4 Find inverse functions.
a. Solve an equation of the form f(x) = c
for a simple function f that has an inverse
and write an expression for the inverse.
For example, f(x) = 2 x3 or f(x) =
𝒇(𝒙) = 𝒂𝒙𝟐 + 𝒄
𝒇(𝒙) = 𝒂(𝒙 − 𝒉)𝟐 + 𝒌
8.1 Graphing 𝒇(𝒙) = 𝒂𝒙𝟐
8.2 Graphing
8.4 Graphing
10.4 Inverse of a Function
BIG IDEAS Algebra 1 Textbook to Curriculum Map Alignment for CC Algebra 1
LAUSD Secondary Mathematics April 20, 2015 Draft Page 22
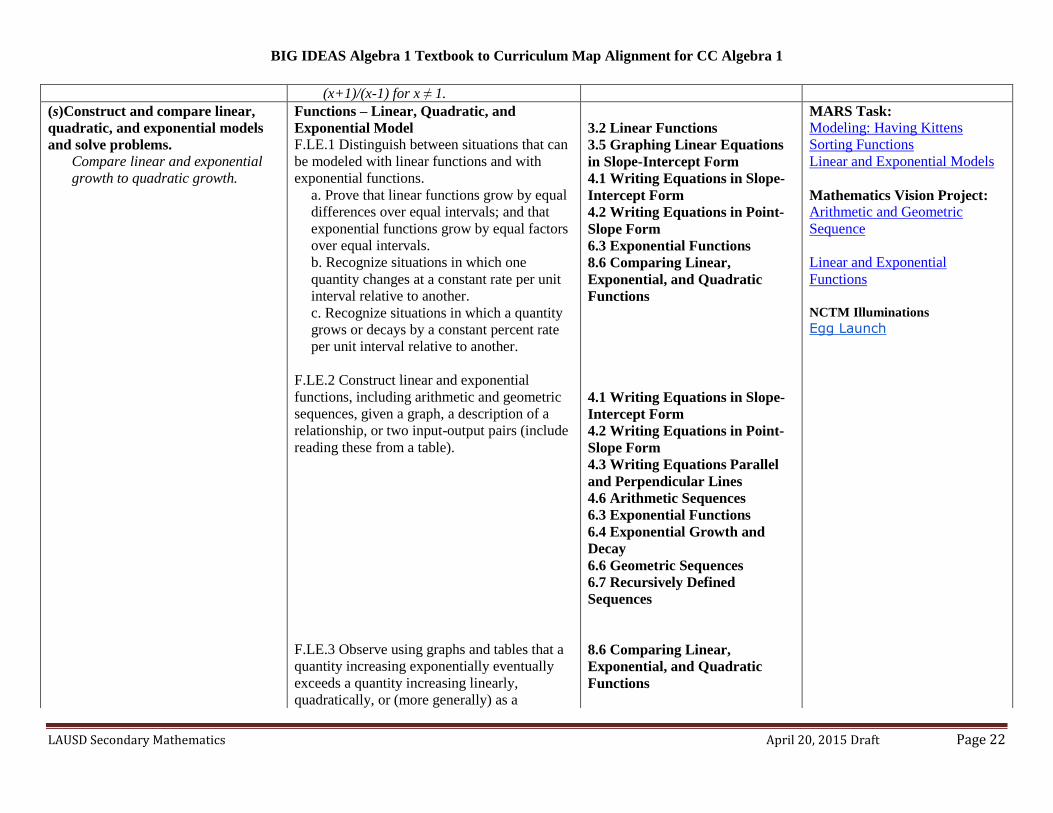
(x+1)/(x-1) for x ≠ 1.
(s)Construct and compare linear,
quadratic, and exponential models
and solve problems.
Compare linear and exponential
growth to quadratic growth.
Functions – Linear, Quadratic, and
Exponential Model
F.LE.1 Distinguish between situations that can
be modeled with linear functions and with
exponential functions.
a. Prove that linear functions grow by equal
differences over equal intervals; and that
exponential functions grow by equal factors
over equal intervals.
b. Recognize situations in which one
quantity changes at a constant rate per unit
interval relative to another.
c. Recognize situations in which a quantity
grows or decays by a constant percent rate
per unit interval relative to another.
F.LE.2 Construct linear and exponential
functions, including arithmetic and geometric
sequences, given a graph, a description of a
relationship, or two input-output pairs (include
reading these from a table).
F.LE.3 Observe using graphs and tables that a
quantity increasing exponentially eventually
exceeds a quantity increasing linearly,
quadratically, or (more generally) as a
3.2 Linear Functions
3.5 Graphing Linear Equations
in Slope-Intercept Form
4.1 Writing Equations in Slope-
Intercept Form
4.2 Writing Equations in Point-
Slope Form
6.3 Exponential Functions
8.6 Comparing Linear,
Exponential, and Quadratic
Functions
4.1 Writing Equations in Slope-
Intercept Form
4.2 Writing Equations in Point-
Slope Form
4.3 Writing Equations Parallel
and Perpendicular Lines
4.6 Arithmetic Sequences
6.3 Exponential Functions
6.4 Exponential Growth and
Decay
6.6 Geometric Sequences
6.7 Recursively Defined
Sequences
8.6 Comparing Linear,
Exponential, and Quadratic
Functions
MARS Task:
Modeling: Having Kittens
Sorting Functions
Linear and Exponential Models
Mathematics Vision Project:
Arithmetic and Geometric
Sequence
Linear and Exponential
Functions
NCTM Illuminations Egg Launch
BIG IDEAS Algebra 1 Textbook to Curriculum Map Alignment for CC Algebra 1
LAUSD Secondary Mathematics April 20, 2015 Draft Page 23
polynomial function.
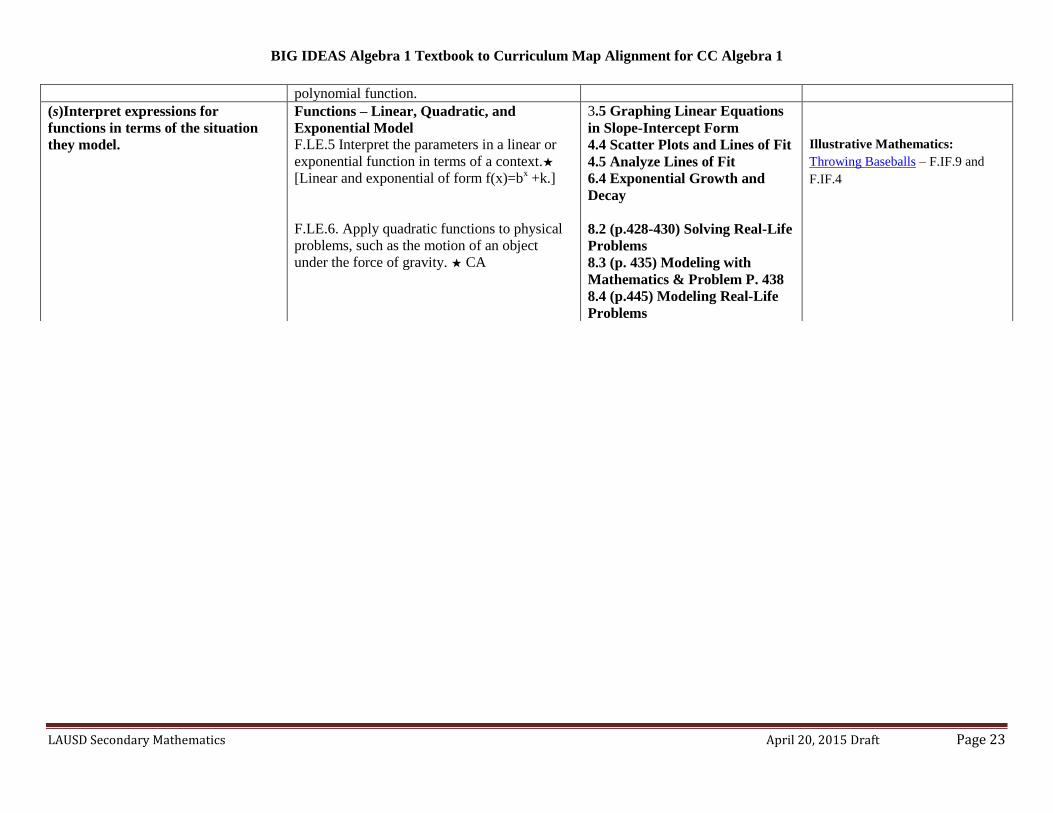
(s)Interpret expressions for
functions in terms of the situation
they model.
Functions – Linear, Quadratic, and
Exponential Model
F.LE.5 Interpret the parameters in a linear or
exponential function in terms of a context.★
[Linear and exponential of form f(x)=bx +k.]
F.LE.6. Apply quadratic functions to physical
problems, such as the motion of an object
under the force of gravity. ★ CA
3.5 Graphing Linear Equations
in Slope-Intercept Form
4.4 Scatter Plots and Lines of Fit
4.5 Analyze Lines of Fit
6.4 Exponential Growth and
Decay
8.2 (p.428-430) Solving Real-Life
Problems
8.3 (p. 435) Modeling with
Mathematics & Problem P. 438
8.4 (p.445) Modeling Real-Life
Problems
Illustrative Mathematics:
Throwing Baseballs – F.IF.9 and
F.IF.4