Embed Size (px)
Citation preview
BUYER’S GUIDEBIG DATA ANALYTICS
01
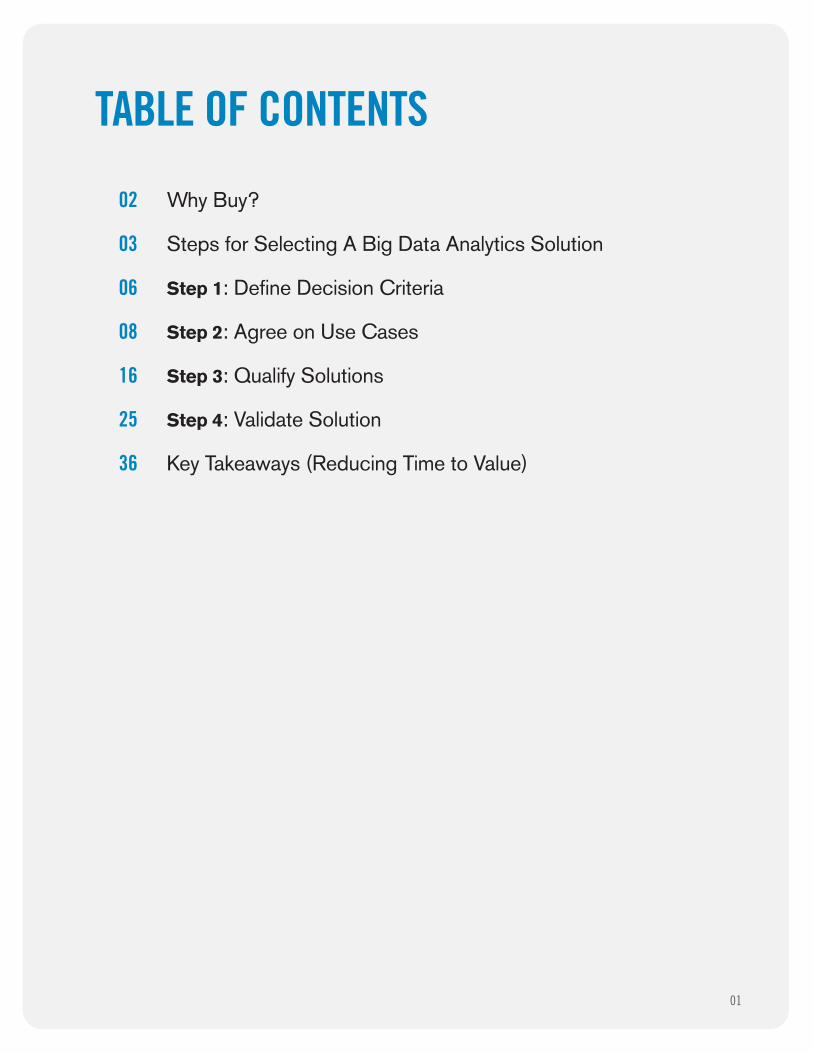
02 Why Buy?
03 Steps for Selecting A Big Data Analytics Solution
06 Step 1: Define Decision Criteria
08 Step 2: Agree on Use Cases
16 Step 3: Qualify Solutions
25 Step 4: Validate Solution
36 Key Takeaways (Reducing Time to Value)
TABLE OF CONTENTS
02Big Data Analytics Buyer’s Guide
Data loading
Data loading
Analyze data Visualize data Export data Secure data MonitoringTransform data andperform data quality
Scheduling anddependencies
Scheduling anddependencies
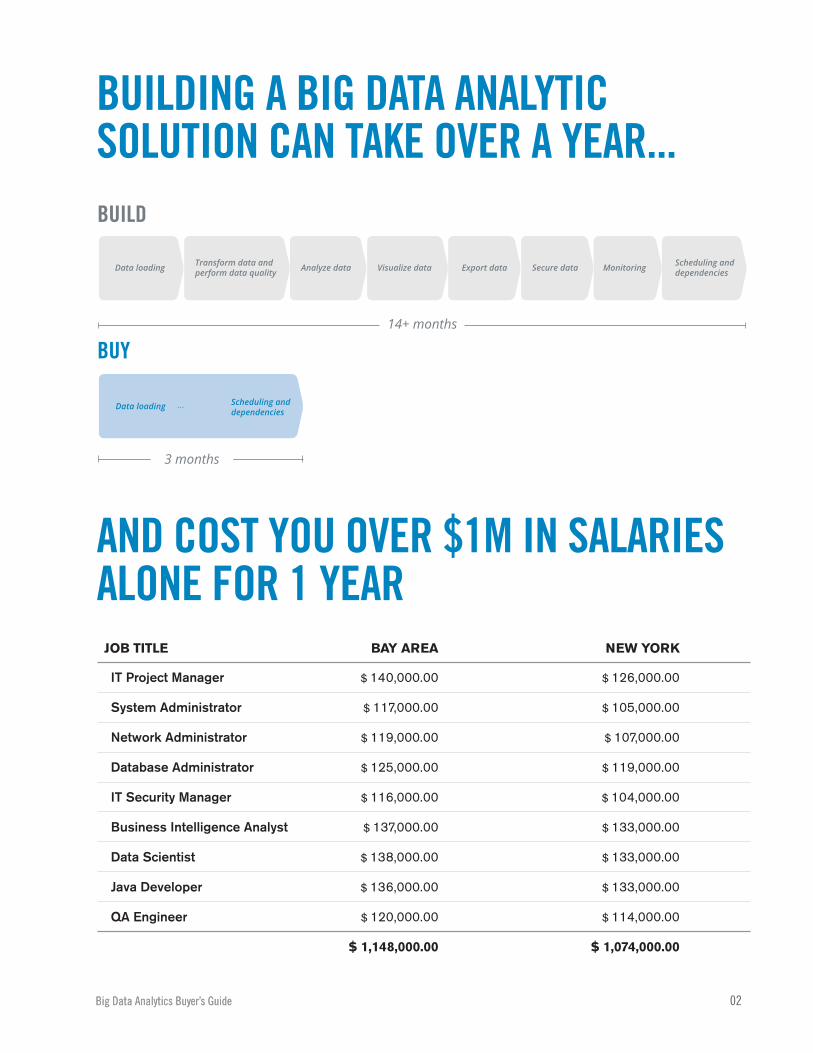
BUILD
BUY14+ months
3 months
BUILDING A BIG DATA ANALYTICSOLUTION CAN TAKE OVER A YEAR...
AND COST YOU OVER $1M IN SALARIESALONE FOR 1 YEAR
JOB TITLE
IT Project Manager
System Administrator
Network Administrator
Database Administrator
IT Security Manager
Business Intelligence Analyst
Data Scientist
Java Developer
QA Engineer
BAY AREA
$ 140,000.00
$ 117,000.00
$ 119,000.00
$ 125,000.00
$ 116,000.00
$ 137,000.00
$ 138,000.00
$ 136,000.00
$ 120,000.00
$ 1,148,000.00
NEW YORK
$ 126,000.00
$ 105,000.00
$ 107,000.00
$ 119,000.00
$ 104,000.00
$ 133,000.00
$ 133,000.00
$ 133,000.00
$ 114,000.00
$ 1,074,000.00
Big Data Analytics Buyer’s Guide
03
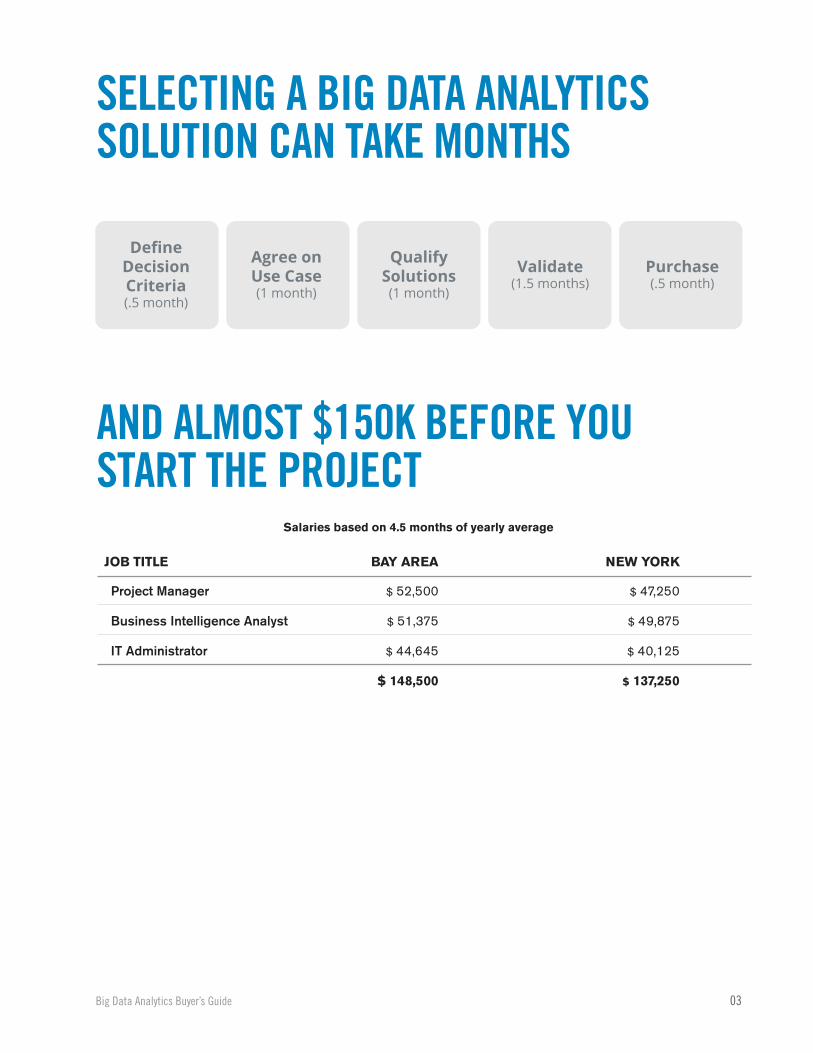
SELECTING A BIG DATA ANALYTICSSOLUTION CAN TAKE MONTHS
DefineDecisionCriteria(.5 month)
Agree onUse Case(1 month)
QualifySolutions(1 month)
Validate(1.5 months)
Purchase(.5 month)
AND ALMOST $150K BEFORE YOUSTART THE PROJECT
JOB TITLE
Project Manager
Business Intelligence Analyst
IT Administrator
BAY AREA
$ 52,500
$ 51,375
$ 44,645
$ 148,500
NEW YORK
$ 47,250
$ 49,875
$ 40,125
$ 137,250
Salaries based on 4.5 months of yearly average
Big Data Analytics Buyer’s Guide

1. Fewer steps in the process
Instead of hiring developers, ramping them up, defining, developing, testing, deploying and then analyzing,
you can go directly to defining and analyzing.
2. One pre-built solution
Instead of manually building capabilities for data loading, data parsing, data analytics, visualization,
scheduling, dependency management, data synchronization, monitoring API, management UI, and security
integration, you can have it in one, purchased platform.
3. Pre-built integration, analytics and visualization functionality
THERE ARE MANY ADVANTAGES TOBUYING A BIG DATA ANALYTICS SOLUTION
Seamless Data Integration
• Structured, semi and unstructured• Pre-built connectors• Connector plug-in API
Powerful Analytics
• Interactive spreadsheet UI• Built-in analytic functions• Macros and function plug-in API
Business Infographics
• Combine anything, WYSIWYG• Infographics and dashboards• Visualization plug-in API
Below are 3 key reasons we wanted to highlight:
In this guide, we’ll discuss how you can expedite the deployment and selection process by:• Providing a template for decision criteria
• Criteria for identifying big data use cases
• Qualification criteria for the solution
• Validating and calculating ROI to compare your options
04Big Data Analytics Buyer’s Guide
STEPS FOR SELECTINGA BIG DATA ANALYTICSSOLUTION

HOW THIS GUIDE WILL HELP YOUSELECT A BIG DATA ANALYTICSSOLUTION FASTER
Define decision criteria:
Before you buy something, you will need to agree on your decision criteria. In this guide, we’ll share a checklist of
the criteria we have seen customers use during their decision making process.
Agree on use case(s):
Often times companies are looking for a place to begin. This part of the guide will help you identify the ideal big
data use cases to go after as well as show you examples of big data use cases companies have implemented.
Qualify solutions:
What is the functionality you need in a big data analytics solutions? What are the capabilities you should look for?
This part of the guide will outline the key capabilities so you can shorten your list of options to evaluate.
Validate:
In this part of the process, you need to consider how you will validate if a solution meets your requirements. Look
for ways to validate that are cost effective. This part of the guide will give you tips on how to expedite the validation
process as well as provide an framework to compare your options.
DefineDecisionCriteria
Agree onUse Case
QualifySolutions Validate
Creating a streamlined buying process is critical. A streamlined buying process paves the way and sets the stage for a streamlined deployment. There are 4 key steps in selecting your big data analytics solution. This guide will go through the things you can
do to expedite that buying process.
06Big Data Analytics Buyer’s Guide

DEFINE DECISIONCRITERIA
STEP 1
1

Ease of use
Does the business need IT to help?
Can a business analyst use the tool to do analysis?
Data Integration
Does system support native connectors to
unstructured and semi-structured data sources (e.g.
log files, social, SaaS, machine data)? Does it support
flexible partitioning of the data so that it is easy to work
with large amounts of data? Does the solution provide
data quality functions so that the data can be quickly
normalized and transformed?
Analytics
Does the solution provide an intuitive environment (e.g.
spreadsheet) that business users can quickly use?
Does the solution include pre-built analytic functions?
Does the system provide a preview to validate analysis
and show data lineage for auditing data flows? Do
data models have to be defined before insights can be
gained? Do analysts need to know what they want to
do before they have had a chance to look at the data?
Can analysts look at the data, iterate, make the
changes they need and analyze without involving IT?
Visualizations
Does the solution support complete freeform
visualization? Or is it just a combination of reports and
dashboards?
Integration with existing IT infrastructure
Does the solution support import from and export into
other BI systems?
Administration
Does the system support flexible security integration
with LDAP or ActiveDirectory?
Extensibility
Does the solution support open API’s for custom data
connections and custom visualizations?
Architecture
Does the solution run natively on Hadoop? Is a
separate cluster required (ideally no separate cluster
should be required)? Is the product limited by the
availability of the memory within the nodes? The ideal
solution should have no memory constraints. Does the
solution provide a job planner and optimizer to ensure
the lowest number of MapReduce jobs is executed?
Vendor requirements
Is the system proven, does it have numerous major
releases? How much is it in enterprise use, has it
analyzed substantial data, (terabytes, petabytes or
exabytes)?
DEFINE DECISION CRITERIA
After working with hundreds of customers, we’ve found the following are the top things to look for in a Big Data Analytics Solution.
DECISION CRITERIA FOR SELECTINGA BIG DATA ANALYTICS SOLUTION
09Big Data Analytics Buyer’s Guide

2
STEP 2
AGREE ONUSE CASES
WHAT DOES A BIG DATA USE CASE HAVE?What does a Big Data Analytics use case look like?
10
This part of the process has taken some companies the longest. First, it is important to understand what a Big Data
Analytics use case is not. Second, it is important to understand the characteristics of a Big Data Analtyics use case.
What is NOT a Big Data Analytics use case?
It’s important to draw the distinction between a Big Data Analytics use case and a Business Intelligence use case.
Business intelligence use cases are about structured data and lead to reports that aggregate or summarize that
data. These use cases require data models that lead to a set of known questions that can be asked of the data. BI
use cases involve moderate volumes of structured data, and therefore BI solutions were not designed to handle the
big data use cases that require larger data volumes and different types of data that change frequently.
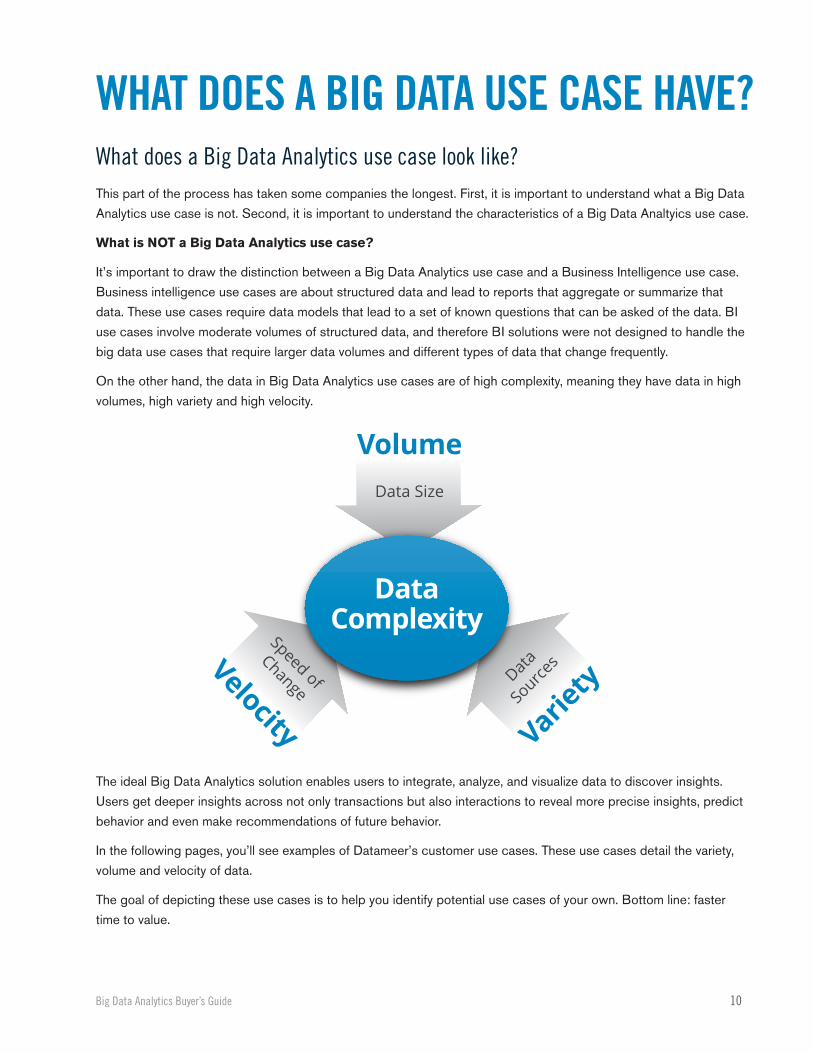
On the other hand, the data in Big Data Analytics use cases are of high complexity, meaning they have data in high
volumes, high variety and high velocity.
The ideal Big Data Analytics solution enables users to integrate, analyze, and visualize data to discover insights.
Users get deeper insights across not only transactions but also interactions to reveal more precise insights, predict
behavior and even make recommendations of future behavior.
In the following pages, you’ll see examples of Datameer’s customer use cases. These use cases detail the variety,
volume and velocity of data.
The goal of depicting these use cases is to help you identify potential use cases of your own. Bottom line: faster
time to value.
Big Data Analytics Buyer’s Guide

WHAT IS AN EXAMPLE OF A USE CASE?
MARKET BASKET ANALYSIS ANDPRICING OPTIMIZATION
Historical
Inventory
Pricing
Transaction
Analyze pricing and historical data to price and advertise effectively
In retail, historical inventory, pricing and transaction data are spread across multiple devices and sources. This data
changes on a daily - often hourly basis. Business users need to pull together this information to understand the
seasonality of products, come up with competitive pricing, determine which platforms to support so that their
online users have optimal performance, and where to target ads.
11
Variety Historical, inventory, pricing, and transaction data
Volume 3000 TB
Velocity 1M+ rows of additional pricing data added daily
Big Data Analytics Buyer’s Guide

WHAT IS AN EXAMPLE OF A USE CASE?
PREDICT SECURITY THREATIdentify where security threats may occur
The security landscape is always changing. So changes in behavior can indicate where the next attack may occur.
For example, this company used Datameer to follow a virus that started in Russia, moved across Asia, to the US,
and forcing Windows upgrades in its path. By seeing where the traffic was generated in particular geographic
areas, they could predict where the next security threats would be.
Feeds
Log Files
Firewall
12
Variety 50+ different feeds, MySQL and JSON data from message queues and flat files, and log files
Volume As their customer base grew, data volumes outstripped the capacity of their existing
RDMBS-based system.
Velocity To maintain SLA’s within hours, the company had to rapidly analyze data across growing
volumes of customer data.
Big Data Analytics Buyer’s Guide
13
WHAT IS AN EXAMPLE OF A USE CASE?
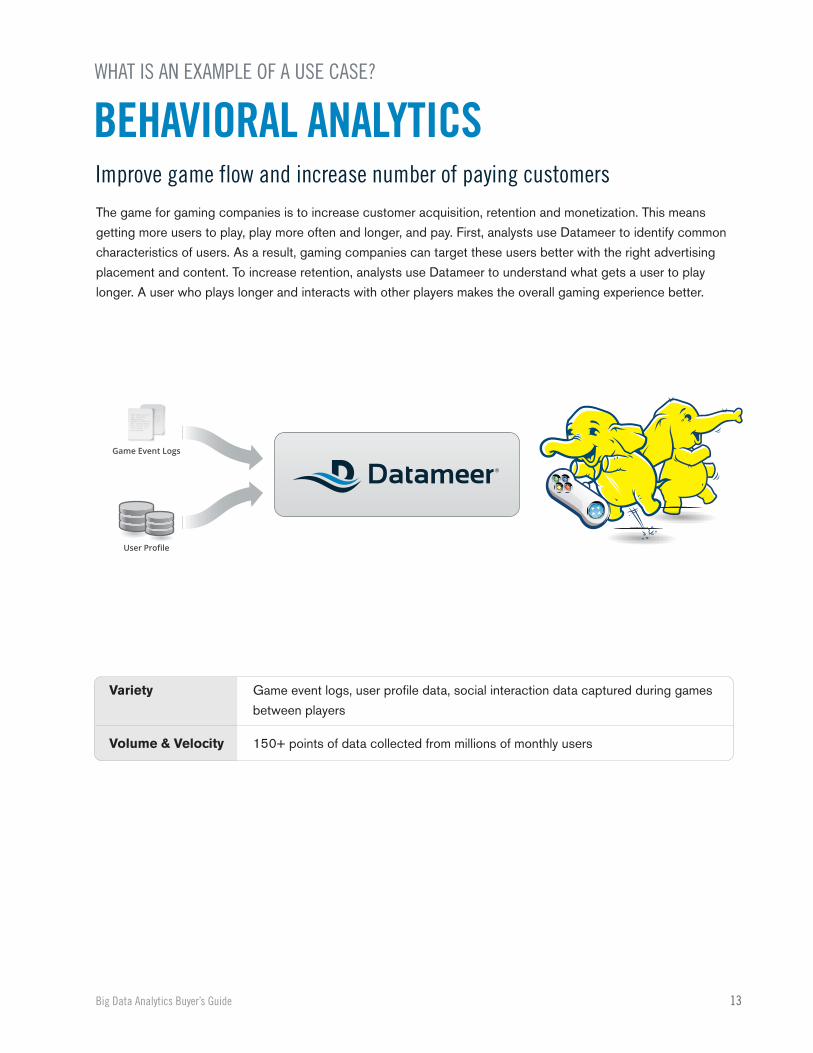
BEHAVIORAL ANALYTICSImprove game flow and increase number of paying customersThe game for gaming companies is to increase customer acquisition, retention and monetization. This means
getting more users to play, play more often and longer, and pay. First, analysts use Datameer to identify common
characteristics of users. As a result, gaming companies can target these users better with the right advertising
placement and content. To increase retention, analysts use Datameer to understand what gets a user to play
longer. A user who plays longer and interacts with other players makes the overall gaming experience better.
User Profile
Game Event Logs
Variety Game event logs, user profile data, social interaction data captured during games
between players
Volume & Velocity 150+ points of data collected from millions of monthly users
Big Data Analytics Buyer’s Guide
14
WHAT IS AN EXAMPLE OF A USE CASE?
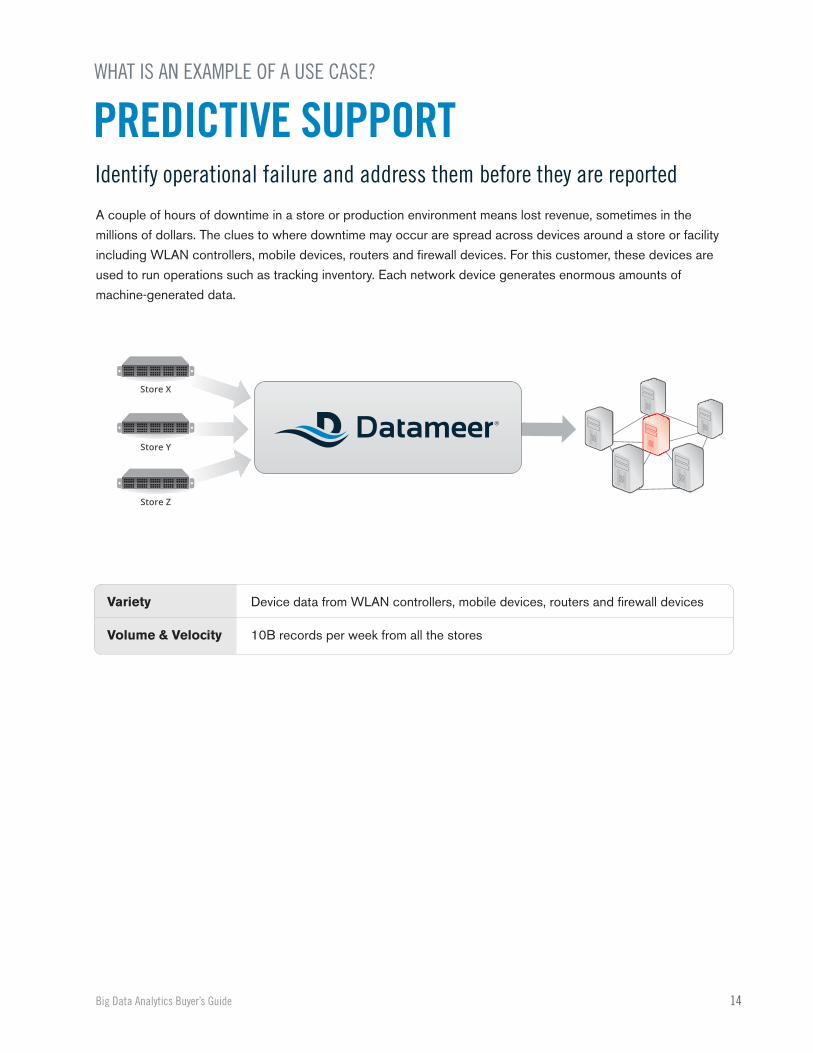
PREDICTIVE SUPPORTIdentify operational failure and address them before they are reported
A couple of hours of downtime in a store or production environment means lost revenue, sometimes in the
millions of dollars. The clues to where downtime may occur are spread across devices around a store or facility
including WLAN controllers, mobile devices, routers and firewall devices. For this customer, these devices are
used to run operations such as tracking inventory. Each network device generates enormous amounts of
machine-generated data.
Store X
Store Y
Store Z
Variety Device data from WLAN controllers, mobile devices, routers and firewall devices
Volume & Velocity 10B records per week from all the stores
Big Data Analytics Buyer’s Guide
WHAT IS AN EXAMPLE OF A USE CASE?
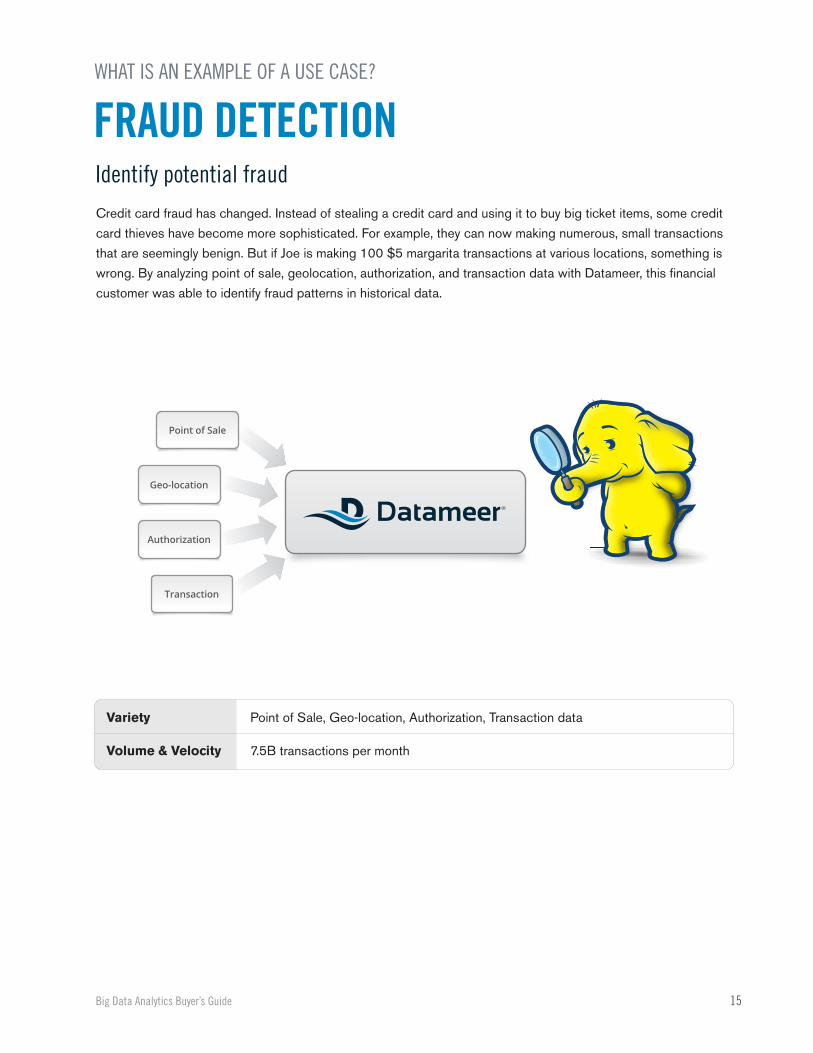
FRAUD DETECTIONIdentify potential fraud
Credit card fraud has changed. Instead of stealing a credit card and using it to buy big ticket items, some credit
card thieves have become more sophisticated. For example, they can now making numerous, small transactions
that are seemingly benign. But if Joe is making 100 $5 margarita transactions at various locations, something is
wrong. By analyzing point of sale, geolocation, authorization, and transaction data with Datameer, this financial
customer was able to identify fraud patterns in historical data.
15
Point of Sale
Geo-location
Authorization
Transaction
Variety Point of Sale, Geo-location, Authorization, Transaction data
Volume & Velocity 7.5B transactions per month
Big Data Analytics Buyer’s Guide

This enterprise hardware company was generating and collecting data that was doubling every 15 months. In
addition to the rapidly growing data volumes, there were hundreds of different semi-structured and unstructured
log formats. Before Datameer, analysts were forced to write ad hoc Perl code to parse a subset of the log files and
store data locally. By using Datameer, the company was able to derive valuable insights that helped virtually every
group — Support, Development, Marketing, and Services. For example, Support was able to send out a
replacement part before the component actually failed. Sales was able to look at usage patterns to improve
forecasting and renewal negotiations.
WHAT IS AN EXAMPLE OF A USE CASE
DEVICE ANALYTICSEnable business analysts or non-technical users through a spreadsheet interface to analyze and do big data discovery
16
Log Files
Data Store
Transaction Data
Variety 100s of files, logs and other data sources
Volume & Velocity Data volume growing 2x every 15 months
Big Data Analytics Buyer’s Guide
3
STEP 3
QUALIFYSOLUTIONS
18
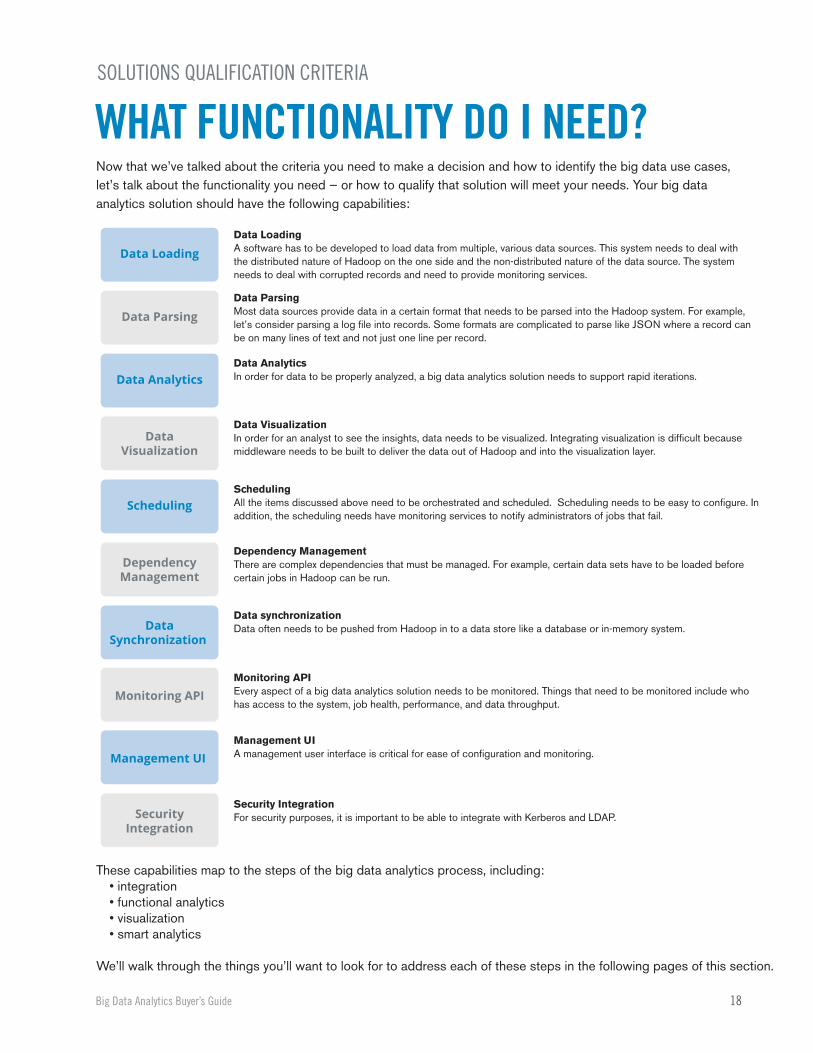
Data LoadingA software has to be developed to load data from multiple, various data sources. This system needs to deal with the distributed nature of Hadoop on the one side and the non-distributed nature of the data source. The system needs to deal with corrupted records and need to provide monitoring services.
Data Loading
Dependency ManagementThere are complex dependencies that must be managed. For example, certain data sets have to be loaded before certain jobs in Hadoop can be run.
DependencyManagement
Data synchronizationData often needs to be pushed from Hadoop in to a data store like a database or in-memory system. Data
Synchronization
Monitoring APIEvery aspect of a big data analytics solution needs to be monitored. Things that need to be monitored include who has access to the system, job health, performance, and data throughput.
Monitoring API
Management UIA management user interface is critical for ease of configuration and monitoring.Management UI
Security Integration For security purposes, it is important to be able to integrate with Kerberos and LDAP.Security
Integration
Data ParsingMost data sources provide data in a certain format that needs to be parsed into the Hadoop system. For example, let’s consider parsing a log file into records. Some formats are complicated to parse like JSON where a record can be on many lines of text and not just one line per record.
Data Parsing
Data AnalyticsIn order for data to be properly analyzed, a big data analytics solution needs to support rapid iterations. Data Analytics
SchedulingAll the items discussed above need to be orchestrated and scheduled. Scheduling needs to be easy to configure. In addition, the scheduling needs have monitoring services to notify administrators of jobs that fail.
Scheduling
Data VisualizationIn order for an analyst to see the insights, data needs to be visualized. Integrating visualization is difficult because middleware needs to be built to deliver the data out of Hadoop and into the visualization layer.
DataVisualization
SOLUTIONS QUALIFICATION CRITERIA
WHAT FUNCTIONALITY DO I NEED?Now that we’ve talked about the criteria you need to make a decision and how to identify the big data use cases, let’s talk about the functionality you need — or how to qualify that solution will meet your needs. Your big data analytics solution should have the following capabilities:
These capabilities map to the steps of the big data analytics process, including:• integration• functional analytics• visualization• smart analytics
We’ll walk through the things you’ll want to look for to address each of these steps in the following pages of this section.
Big Data Analytics Buyer’s Guide
19
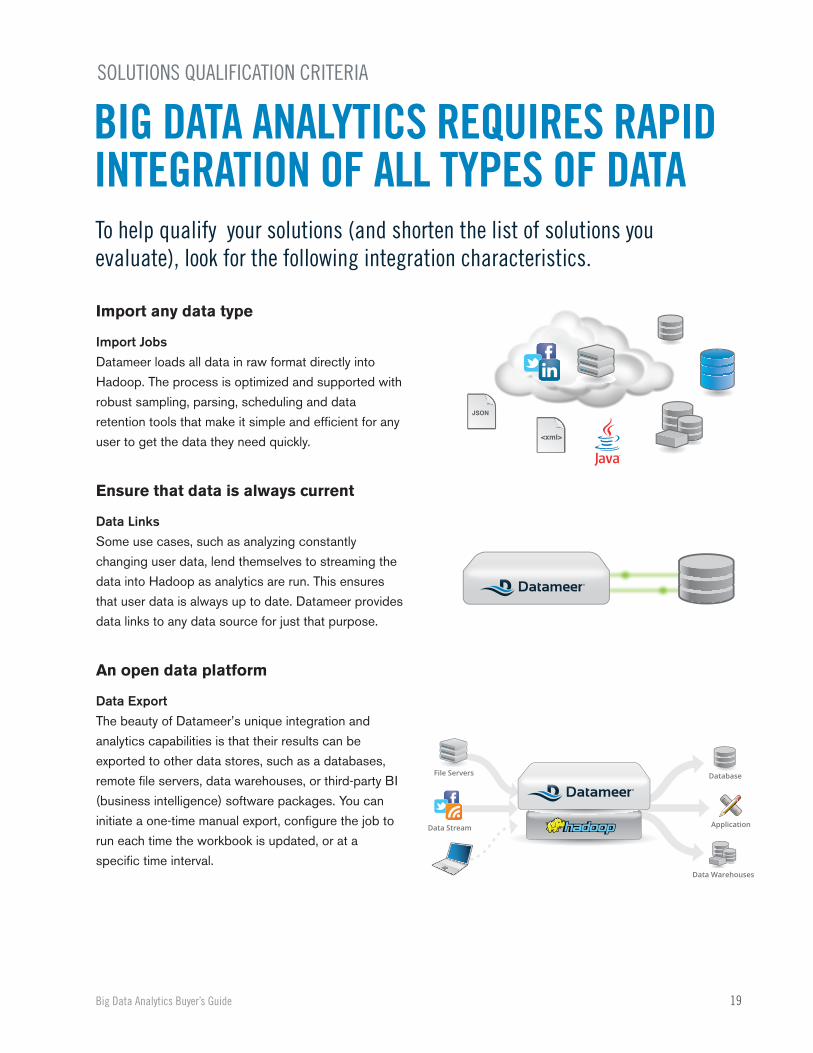
Import any data type
Import JobsDatameer loads all data in raw format directly into
Hadoop. The process is optimized and supported with
robust sampling, parsing, scheduling and data
retention tools that make it simple and efficient for any
user to get the data they need quickly.
Ensure that data is always current
Data LinksSome use cases, such as analyzing constantly
changing user data, lend themselves to streaming the
data into Hadoop as analytics are run. This ensures
that user data is always up to date. Datameer provides
data links to any data source for just that purpose.
An open data platform
Data ExportThe beauty of Datameer’s unique integration and
analytics capabilities is that their results can be
exported to other data stores, such as a databases,
remote file servers, data warehouses, or third-party BI
(business intelligence) software packages. You can
initiate a one-time manual export, configure the job to
run each time the workbook is updated, or at a
specific time interval.
SOLUTIONS QUALIFICATION CRITERIA
BIG DATA ANALYTICS REQUIRES RAPIDINTEGRATION OF ALL TYPES OF DATATo help qualify your solutions (and shorten the list of solutions you evaluate), look for the following integration characteristics.
Big Data Analytics Buyer’s Guide
20
SOLUTIONS QUALIFICATION CRITERIA
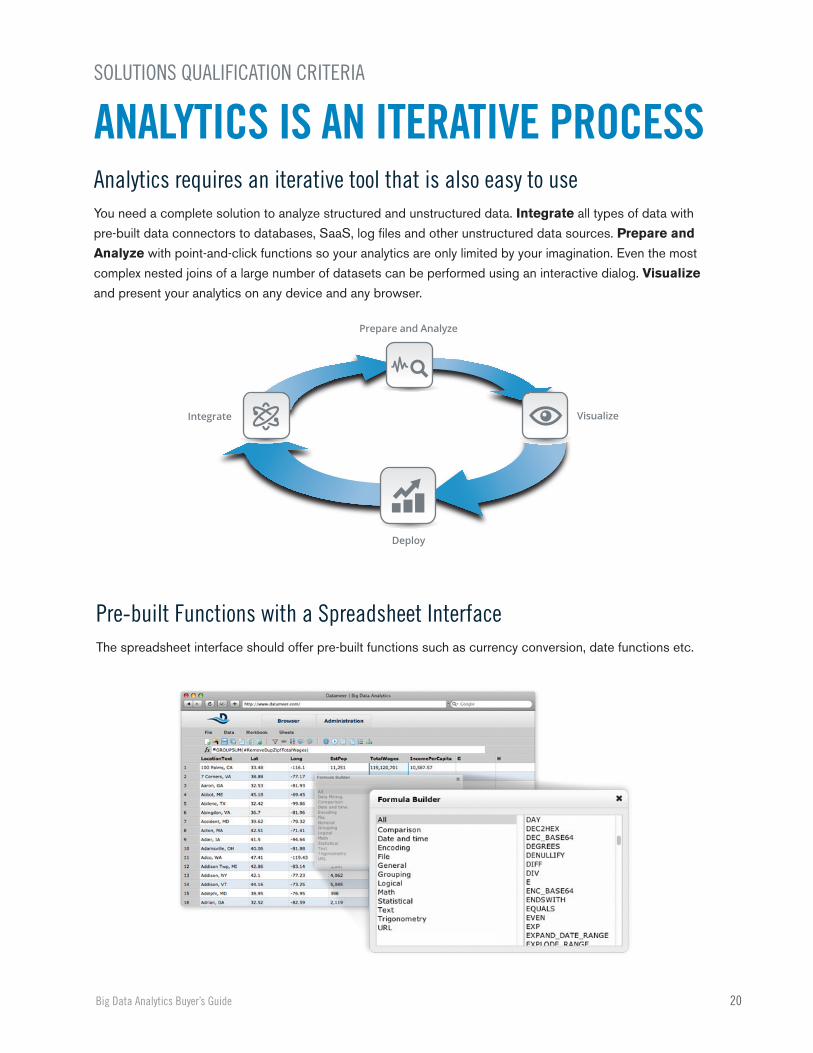
ANALYTICS IS AN ITERATIVE PROCESSAnalytics requires an iterative tool that is also easy to useYou need a complete solution to analyze structured and unstructured data. Integrate all types of data with
pre-built data connectors to databases, SaaS, log files and other unstructured data sources. Prepare and
Analyze with point-and-click functions so your analytics are only limited by your imagination. Even the most
complex nested joins of a large number of datasets can be performed using an interactive dialog. Visualize
and present your analytics on any device and any browser.
Pre-built Functions with a Spreadsheet InterfaceThe spreadsheet interface should offer pre-built functions such as currency conversion, date functions etc.
Prepare and Analyze
Integrate
Deploy
Visualize
Big Data Analytics Buyer’s Guide

21
SOLUTIONS QUALIFICATION CRITERIA
ANALYTICS REQUIRES VISUALIZATIONTHAT END USERS CAN INTERPRETFlexible data visualizationYou need a library of widgets that includes tables, graphs, charts, diagrams, maps, and tag clouds. This enables
users to create simple dashboards or stunning business infographics and visualizations. The end result, data
visualizations that communicate data.
Beyond static dashboards, your data visualizations should have no built-in constraints. Users need to be able to
drag and drop any widget, graphic, text, dashboard or infographic element as needed or desired.
Pageviews
Daily Average Visitors
New vs. Returning Visitors
Click pathsThe most common click paths followed by visitors
The most popular pages, represented in the tag cloud by page views this month...
Our stickiest web pages, measured by dwell time
Our stickiest web pages, measured by dwell time
0 10 20 30 40 50 60 70 80 90 100 110 120 130 140 150 160 170 180 190 200 210 220 230 240 250 260
5.05.56.06.57.07.58.08.59.09.5
10.010.511.0
busi
ness
_new
s
community_forum
community_news
info
tain
men
t_hi
s...
infotainment_new...
external
Big Data Analytics Buyer’s Guide

22
Clustering
With clustering (a K-means algorithm) Datameer automatically finds non-obvious but related groups within your data
by automating the process of identifying and measuring common attributes within the dataset. The obvious benefit
is that if you can segment your data into groups, you can treat the groups differently.
Automatically find groups and relationships hidden in your data
SMART ANALYTICS FUNCTIONALITY
For example, automatically identify groups in:
Customer databases
Text documents
Product libraries
POS data
Weblogs
Health records
Social media
Online gaming logs
Clickpaths
Decision Trees
Datameer’s decision trees (random forest algorithm) help you understand the different combinations of data
attributes that result in a desired outcome. Decision trees are often used when enriching a dataset with additional
data sources to optimize a process for a better outcome. The structure of the decision tree reflects the structure
that is possibly hidden in your data.
For example, find out what common attributes influence:
Disease risk
Fraud risk
Customer churn
Purchases
Online signups
Root-cause
Product conversions
SOLUTIONS QUALIFICATION CRITERIA
Big Data Analytics Buyer’s Guide

23
Column Dependencies
Want to know how strongly a single data attribute like age, location, or gender, relates to other data attributes like
income, college degree, or credit score? The column dependency algorithm automatically compares every possible
data attribute combination and visually ranks the strengths of those relationships so you can instantly see where to
focus further. Those relationships are important themselves and is often used to help target further analysis.
For example, see the relationship between:
Recommendation Engine
Datameer’s recommendation engine automatically predicts interests of a person based on historical observations of
similar people’s interests so you can increase engagement, recommend more relevant choices, increase customer
satisfaction, and more.
For example, predict interest in:
Music
Movies
Content
Services
Products
Documents
Applications
Title and purchase amount
Transaction type and frequency
Location and product selection
Average session length and virtual goods purchase
Age and disease type
Account age and product type
Age and number of SMS messages
...continued SMART ANALYTICS FUNCTIONALITY
Big Data Analytics Buyer’s Guide

24
SOLUTIONS QUALIFICATION CRITERIA
To summarize a comprehensive big data analytic solution consists of an end-to-end, scalable platform that enables any user to integrate, analyze and visualize all types of data.
SUMMARY ON HOW TO QUALIFY ABIG DATA ANALYTIC SOLUTION
1. Ease of Use — Does the Solution:
Provide an intuitive user interface that can be used by anyone?
Have a web based user interface?
Support all popular browsers?
Support HTML5 for usage on desktops, tablet and mobile devices?
Offer an undo capability?
3. Analytics – Does the solution support:
A comprehensive set of analytic and transformation functions?
Special functions for unstructured data?
Instant feedback and preview to validate analysis?
Data lineage to audit data flows?
Grouping of analytics into logical groups?
Analysis of structured and unstructured data?
Sentiment analysis?
4. Visualizations – Does the solution:
Provide an extensive library of graphic widgets including tables, graphs, charts, diagrams, maps, and tag clouds?
Provide a free form canvas layout with no built in placement constraints?
Support for network diagram relationships
Include fonts, color, shapes and clipart?
Support multiple pages of visualizations?
Importing of images for backgrounds?
Support annotations?
Include comparing current and historical data?
Enable content sharing?
2. Data Integration — Does the solution support:
A large set of native connectors for the integration of all types of disparate data (databases, file systems, social media, mainframe, SaaS applications)?
Support for structured and unstructured data
Self service data integration without IT
The ability to work with dirty data?
Parallel loading of data into Hadoop?
No size limitations on data?
Support data retention policies and management
Offer flexible data partitioning?
Data links to data sources that streams the data into Hadoop as analytics are run?
Ingestion of data in raw format directly into Hadoop with robust parsing and sampling?
Offer REST API to start and monitor import orexport of data?
Exception reporting on data?
An API to create custom connectors for proprietary/ custom/legacy applications?
next page...
Big Data Analytics Buyer’s Guide
The following are things to look for when selecting a Big Data analytics solution:

25
...continued HOW TO QUALIFY A BIG DATA ANALYTIC SOLUTION
6. Administration – Does the solution provide:
Role based security?
Authentication through LDAP or Active Directory?
Data retention policy management?
Multi-tenancy within cluster and other apps?
Ad-hoc and scheduling of import jobs?
Web based UI for quick deployment from any browser/desktop?
Centralized management through a web based interface?
Log file viewer to audit logs?
8. System Architecture – Describe how the solution:
Provides linear scalability
Run natively on Hadoop without a separate layer of integration
Support virtualized environments
Allow import and export of data from other Hadoop clusters
Is architected from the ground up for Big Data and not just an add on or connector
9. Vendor Requirements – Is/Does the vendor:
Built upon years of deep Hadoop experience?
Well financed/stable?
Have customer support globally?
Have a strong customer base?
5. Integration with existing IT infrastructure – Does the solution:
Provide integration with HIVE?
Support all major Hadoop distributions?
Provide a REST API for orchestrating integration
7. Extensibility – Does the solution provide:
An SDK to add custom functions?
Support for Java, R, Ruby, Python?
Big Data Analytics Buyer’s Guide

4
STEP 4
VALIDATESOLUTION
27
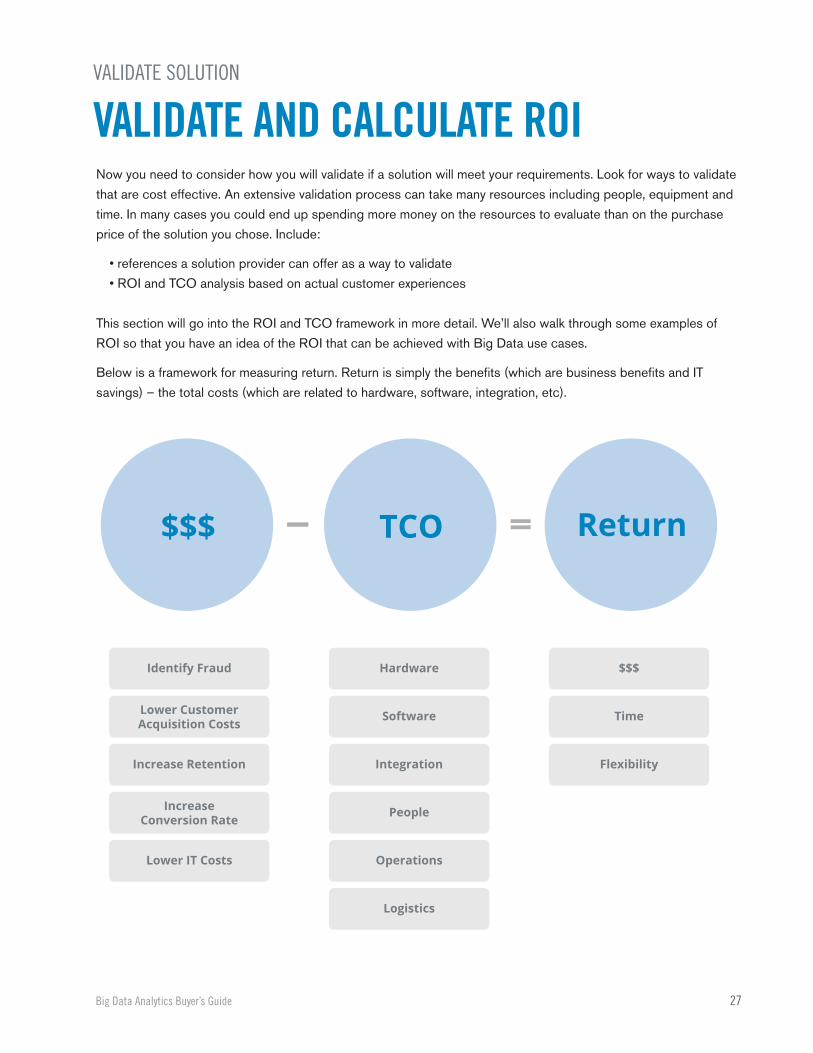
Identify Fraud
Lower CustomerAcquisition Costs
Increase Retention
IncreaseConversion Rate
Lower IT Costs
Hardware
Software
Integration
People
Operations
Logistics
$$$
Time
Flexibility
VALIDATE AND CALCULATE ROIVALIDATE SOLUTION
TCO$$$ Return
Now you need to consider how you will validate if a solution will meet your requirements. Look for ways to validate
that are cost effective. An extensive validation process can take many resources including people, equipment and
time. In many cases you could end up spending more money on the resources to evaluate than on the purchase
price of the solution you chose. Include:
• references a solution provider can offer as a way to validate
• ROI and TCO analysis based on actual customer experiences
This section will go into the ROI and TCO framework in more detail. We’ll also walk through some examples of
ROI so that you have an idea of the ROI that can be achieved with Big Data use cases.
Below is a framework for measuring return. Return is simply the benefits (which are business benefits and IT
savings) – the total costs (which are related to hardware, software, integration, etc).
Big Data Analytics Buyer’s Guide
28
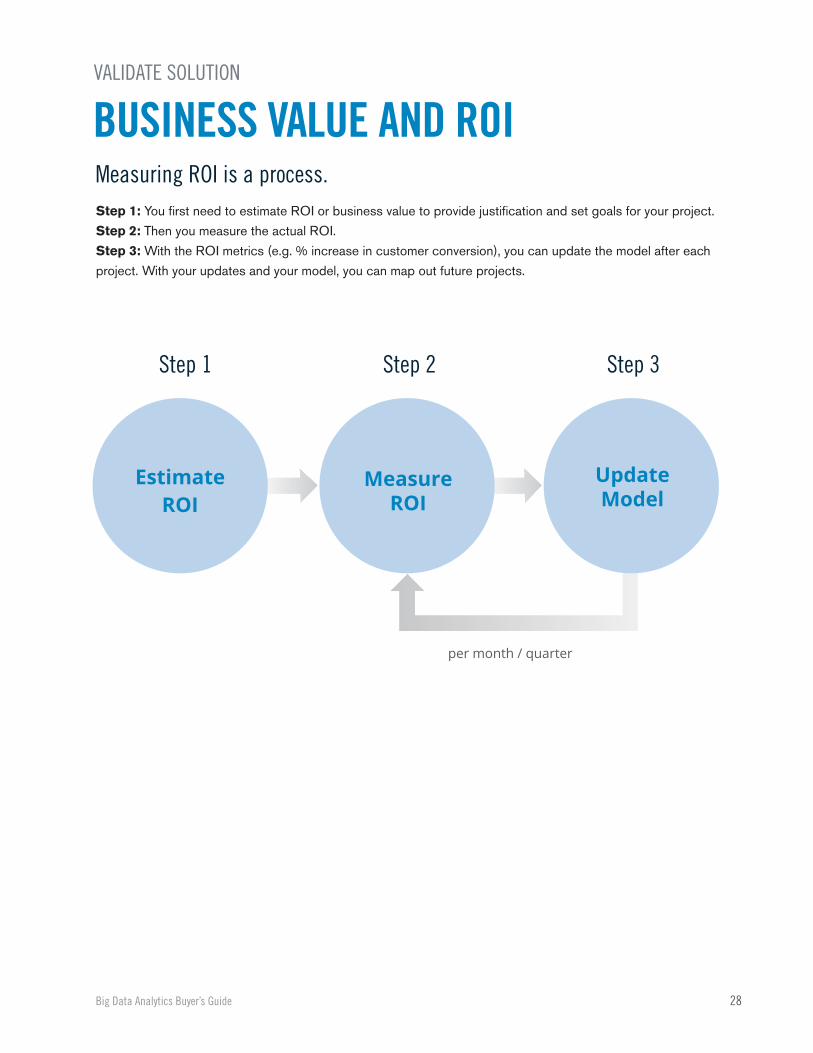
per month / quarter
BUSINESS VALUE AND ROIVALIDATE SOLUTION
Measuring ROI is a process. Step 1: You first need to estimate ROI or business value to provide justification and set goals for your project.
Step 2: Then you measure the actual ROI.
Step 3: With the ROI metrics (e.g. % increase in customer conversion), you can update the model after each
project. With your updates and your model, you can map out future projects.
EstimateROI
MeasureROI
UpdateModel
Step 1 Step 2 Step 3
Big Data Analytics Buyer’s Guide

29
MEASURE ROIVALIDATE SOLUTION
Typical TCO (total cost of ownership) and ROI (return on investment) analyses show hardware savings, software
savings, and productivity gains. In addition, the Datameer analysis provides business benefits such as the increased
customer conversion rate that leads to $20M in new revenue. This business benefit is magnitudes larger than the IT
savings. Take the time to find the business benefits and become the big data hero. IT savings are signifcant, but
business benefits are greater. Datameer can help with this.
Have a big vision. Start small. Iterate. Build on your successes.
Once you’ve measured the ROI for one project you can reuse that ROI metric (e.g. % increase in customer
conversion rate) to estimate ROI gains for other projects within your organization that have similar use cases.
HardwareSavings
SoftwareSavings Productivity Business
Benefit
Project 3
Project 2
Project 1
Big Data Analytics Buyer’s Guide

30
HOW HAS BIG ANALYTICS HELPED?VALIDATE SOLUTION
Optimize Funnel Conversion
Behavioral Analytics
Customer Segmentation
Predictive Support
Market Basket Analysis and
Pricing Optimization
Predict Security Threat
Fraud Detection
Increased customer conversion by 3x
2X Revenue
Decreased customer acquisition costs by 30%
Decreased customer churn
Reduced time to insight from 12 weeks to 3 days
Predict security threats within hours
Prevented $2B in potential fraud
Software Security
Online Gaming
Financial Services
Enterprise Storage
Retail
Software Security
Financial Services
USE CASE INDUSTRY BENEFIT
In this section, you’ll see how Datameer customers have calculated ROI from using Datameer
You can use these returns in your estimation of return from a big data analytics project.
In the following pages you will see examples of our previous use cases and how Datameer customers have
captured ROI.
Big Data Analytics Buyer’s Guide

VALIDATE SOLUTION
OPTIMIZE FUNNEL CONVERSIONIdentify roadblocks in funnel conversion
Generating traffic is good. But generating traffic that leads to sales is better. Datameer has helped companies
identify which Google AdWords lead to sales. By analyzing Google AdWords, Salesforce, and Marketo data, this
company was able to track a lead from AdWord click through to transaction. As a result, this company was able to
improve funnel conversion by 3x, leading to $20M in additional revenue.
Customer conversion increased by 60%
31Big Data Analytics Buyer’s Guide
Conversion60%

VALIDATE SOLUTION
BEHAVIORAL ANALYTICSImprove game flow and increase number of paying customersThe game for gaming companies is to increase customer acquisition, retention and monetization. This means
getting more users to play, play more often and longer, and pay. First, analysts use Datameer to identify common
characteristics of users. As a result, gaming companies can target these users better with the right advertising
placement and content. To increase retention, analysts use Datameer to understand what gets a user to play
longer. A user who plays longer and interacts with other players makes the overall gaming experience better. To
increase monetization, analysts use Datameer to identify the group of users most likely to pay based on common
characteristics. As a result of this analysis the company was able to double their revenue to over $100M.
User Profile
Game Event Logs
32Big Data Analytics Buyer’s Guide
Increase revenue by 2x
Revenue2x
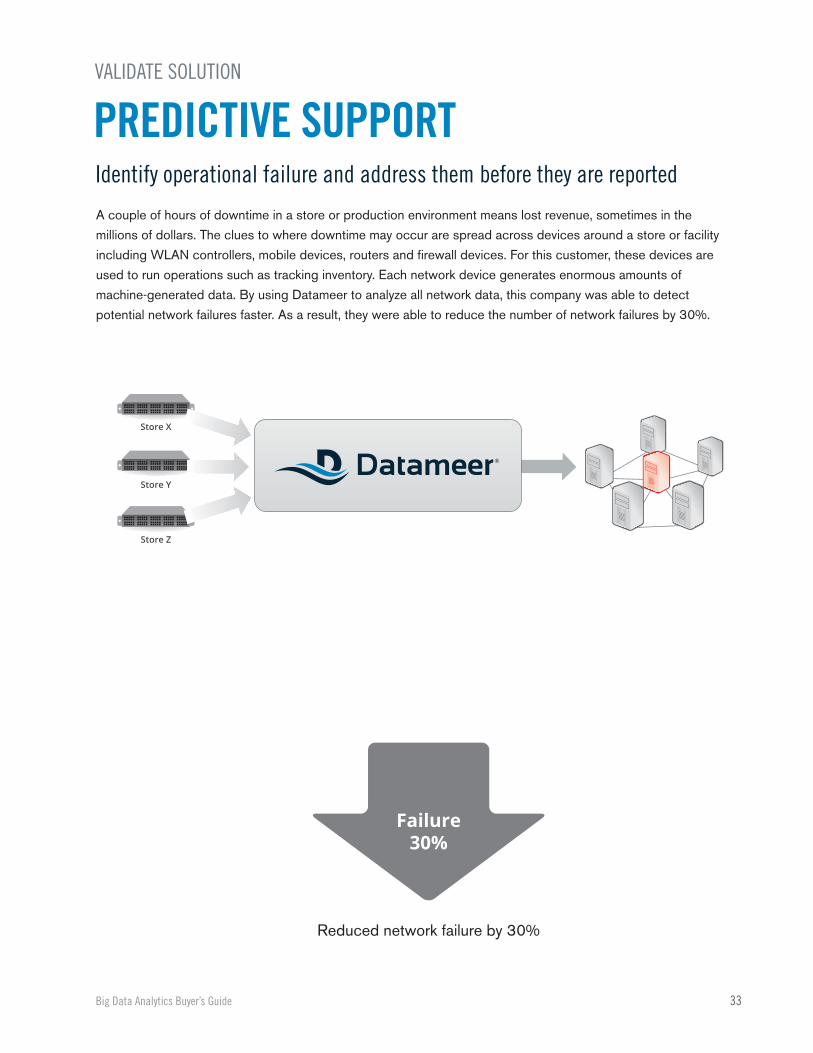
VALIDATE SOLUTION
PREDICTIVE SUPPORTIdentify operational failure and address them before they are reported
A couple of hours of downtime in a store or production environment means lost revenue, sometimes in the
millions of dollars. The clues to where downtime may occur are spread across devices around a store or facility
including WLAN controllers, mobile devices, routers and firewall devices. For this customer, these devices are
used to run operations such as tracking inventory. Each network device generates enormous amounts of
machine-generated data. By using Datameer to analyze all network data, this company was able to detect
potential network failures faster. As a result, they were able to reduce the number of network failures by 30%.
Store X
Store Y
Store Z
33Big Data Analytics Buyer’s Guide
Reduced network failure by 30%
Failure30%

34
VALIDATION CRITERIA
MARKET BASKET ANALYSIS ANDPRICING OPTIMIZATION
Historical
Inventory
Pricing
Transaction
Analyze pricing and historical data to price and advertise effectively
In retail, historical inventory, pricing and transaction data are spread across multiple devices and sources.
Business users need to pull together this information to understand seasonality of products, come up with
competitive pricing, determine which platforms to support so that their online users would have optimal
performance, and where to target ads. With Datameer, these business users could do their analysis in 3 days
instead of 12 weeks with their traditional tools and heavy IT involvement.
Big Data Analytics Buyer’s Guide
Report time from 12 weeks to 3 days
12 weeksto
3 days
35
VALIDATE SOLUTION
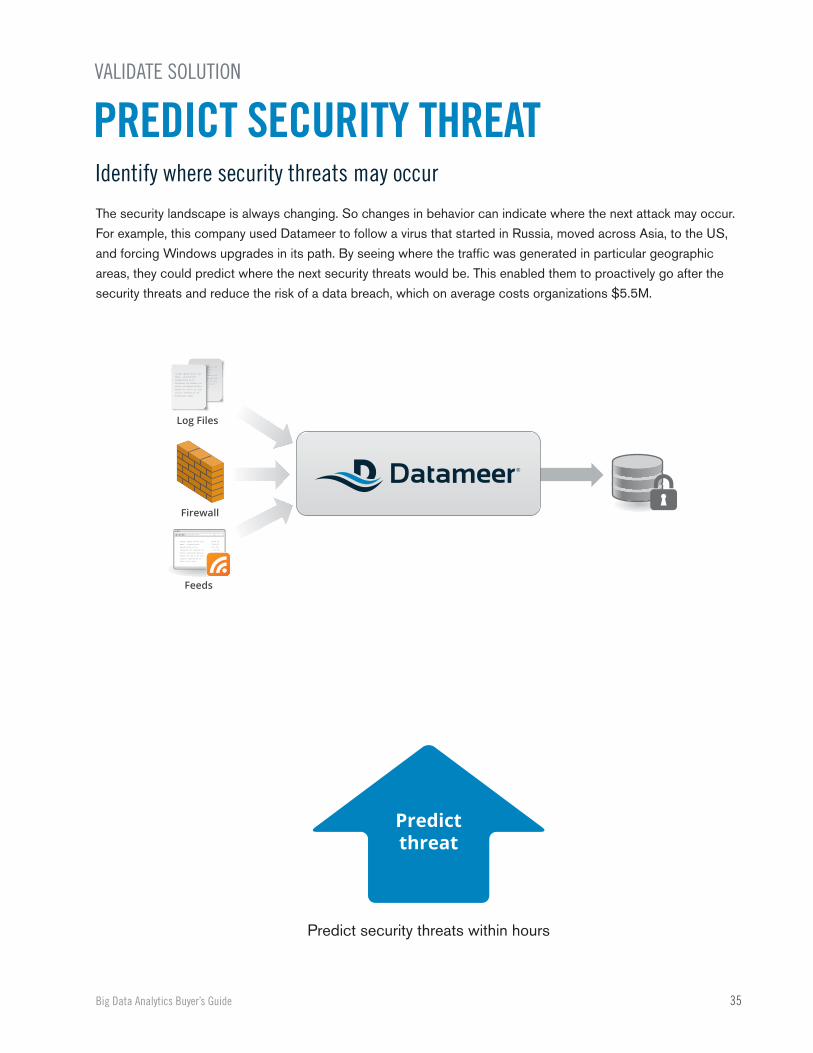
PREDICT SECURITY THREATIdentify where security threats may occur
The security landscape is always changing. So changes in behavior can indicate where the next attack may occur.
For example, this company used Datameer to follow a virus that started in Russia, moved across Asia, to the US,
and forcing Windows upgrades in its path. By seeing where the traffic was generated in particular geographic
areas, they could predict where the next security threats would be. This enabled them to proactively go after the
security threats and reduce the risk of a data breach, which on average costs organizations $5.5M.
Feeds
Log Files
Firewall
Big Data Analytics Buyer’s Guide
Predict security threats within hours
Predictthreat

36
VALIDATE SOLUTION
FRAUD DETECTIONIdentify potential fraud
Credit card fraud has changed. Instead of stealing a credit card and using it to buy big ticket items, some credit
card thieves have become more sophisticated. For example, they can now making numerous, small transactions
that are seemingly benign. But if Joe is making 100 $5 margarita transactions at various locations, something is
wrong. By analyzing point of sale, geolocation, authorization, and transaction data with Datameer, this financial
customer was able to identify fraud patterns in historical data. This analysis helped the firm identify $2B in fraud.
By applying the fraud model to new transactions, the company was able to identify potential fraud and proactively
notify customers.
Point of Sale
Geo-location
Authorization
Transaction
Big Data Analytics Buyer’s Guide
Prevented $2B in fraud
Preventfraud

37
1. Have you defined your decision criteria?
(See Decision Criteria for selecting a big data analytics solution p.6)
2. Have you defined and identified your big data use cases?
(See Decision Criteria for selecting a big data analytics solution p.8)
3. Have qualified the solutions so that you have only one or two solutions to validate?
(See Decision Criteria for selecting a big data analytics solution p.16)
4. Have validated the solution and created the ROI/TCO to compare the solution?
(See Decision Criteria for selecting a big data analytics solution p.8)
KEY TAKEAWAYS
If you have any questions or comments, please contact us at [email protected]
Big Data Analytics Buyer’s Guide


![Data loading and_unloading_in_ibm_netezza[1]](https://img.dokumen.tips/doc/110x75/55c5efc5bb61eb896d8b45a7/data-loading-andunloadinginibmnetezza1.jpg)


