Embed Size (px)
Citation preview

BIG DATA and Opportunities
in the Life Insurance IndustryMarc Sofer BSc FFA FIAA
Head of Strategic Initiatives – North Asia & India
RGA Reinsurance Company

BIG DATA
“ I keep saying the sexy job in the next ten years will
be statisticians. People think I'm joking, but who
would've guessed that computer engineers would've
been the sexy job of the 1990s? “
- Hal Varian, Chief Economist at Google
22

Evolution of Business Intelligence
What Happened
Why Did It Happen?
What Is The Best Outcome?
HIGH
HIGHLOW
Business Intelligence is Evolving
Historically collected business
data to find information primarily
through reporting and monitoring
of current activities using basic
analytical processes.
Now using advanced statistical and quantitative tools for prediction and optimization of business processes.C
OM
PLE
XIT
Y
BUSINESS VALUE
REPORTING
ANALYSIS
MONITORING
PREDICTION
OPTIMIZATION
What is Happening Now?
What Will Be Happening?
3

What is Predictive Modeling?
Put Simply…
Brings the rigor of advanced statistical
algorithms to get the most benefit from
proprietary data assets.
Improve the efficiency of existing business
processes:
o Creates new opportunities to enhance the sales
process for direct and intermediated distribution.
o Claims management can be greatly improved.
o More accurate and granular view of the factors that
affect portfolio experience.
The improvements allowed by predictive
modeling can provide an advantage that
competitors will find difficult to replicate.
Why bother?
Collect large data set(s)
Analyze data, identify meaningful
relationships
Use these relationships to predict
future defined outcomes to drive decisions
4

Life Insurance is Lagging Behind
Lack of management
familiarity.
Product nature (long term & low frequency events).
Ready access to required data.
Implementation challenges:
o Data preparation efforts
o Lack of adequate data
o Lack of skills and training
Insufficient proof of accuracy and case studies.
So many other priorities and
opportunities!
50%50%
Predictive Modelingin Life Insurance
85%
15%
Predictive Modeling in General Insurance
VS
Source:
Tower Watson: Predictive Modeling Providing Its Worth Among P&C Insurers (2012).
Society of Actuaries: Report of the Society of Actuaries Predictive Modeling Survey
Subcommittee (2012)
Key Inhibitors
5

Most Popular Uses of Predictive Modeling
Propensity to Buy Models – use customer information to determine who is most
likely to purchase a product and target them thereby reducing acquisition costs.
RGA Project in Taiwan.
Predictive Underwriting models – find the customers most likely to have a std.
underwriting decision and offer them cover with reduced underwriting. RGA
Projects in US, UK, Australia and South East Asia.
Experience Analysis Models – understand the true drivers of experience using
multivariate analysis. RGA Projects in US, UK, South Africa, Japan, China and Korea.
In Force Retention Models – find out which policies are most likely to lapse and
develop retention strategies for them. RGA Projects in the US and UK.
Fraud Detection Models – use claims data to determine those claims that are most
likely to be fraudulent and focus forensic efforts on them. RGA Project in India.
Agent Quality Assessment Models – use policyholder and claims information to
determine which agents add most value to the companies profitability.
6

Bancassurance Predictive Underwriting
Objectives
Bancassurer wanting to achieve growth in sales via
the bancassurance channel.
Sell bank customers protection products on a
guaranteed issue or simplified issue basis with
minimal impact on product price.
Improve the customer experience by:
o Issue policies faster.
o Reduce the UW process for customers most likely to
be standard.
Easy Identification and targeting of ‘good’
customers.
Make the best use of internal data.
7

Used two different sets of data…
Predictors Response
Demographic (Age,
Gender, Location, Branch)
Asset or Debt Related
(Accounts, AUM, TRB)
Transactional (Bank
Account or Credit
Purchases)
The underwriting decision when normal underwriting applied:
Standard risk Rated Declined
Linked to the same lives
Bancassurance Predictive Underwriting
8

Model using 11 statistically significant variables.
Good differentiation of risks:o For the best 20%, the average non-STD rate was 5x better than the
overall average.
Data
Analytics
Outcome
Generalized Linear Model: easy to understand and gain
acceptance in the business.
De-personalized data provided to RGA.
Limited number of cases: o A total of around 9,000 fully underwritten cases.
o Target variable UW decision, with very low declined/rated cases < 5%.
Each record had around 85 variables:o Many missing values especially for Sub-Standard lives.o Not all information collected at the time of underwriting.
The Model Building Process
Bancassurance Predictive Underwriting
9

Age at entry
Branch
Assets Under
Management
Customer Segment
Nationality
1 2 3 4 5 6 7 8 9 10
No
n-S
td R
ate
Deciles
Lift PlotDeclined
Rated
Average Non-Std Rate
Score 90-100 Most
likely Standard
Score 0-10
Most likely Non-Standard
Model Results
Most Predictive Variables
Simplified Issue
Guaranteed Issue
Bancassurance Predictive Underwriting
10

Multi-line Company Cross-sell Model
A large multi-line company with a very large P&C
customer base.
Low life product penetration.
Background
Objectives
Increase life insurance penetration and leverage
data from their large in-force P&C customer
base.
Offer a simplified underwriting and sales process
with a low decline rate to the best customers.
Reduce acquisition costs, improve experience,
shorten underwriting turn-around time.
Improve persistency of P&C customers as a result
of a deeper relationship with clients.
11

Multi-line Company Cross-sell Model
Predictive Underwriting model built using two sets of data
Predictors Response
P&C customer demographic, financial, underwriting, claims and admin data from both motor and home insurance.
Other information normally collected at the life UW stage e.g. smoker status.
Possible merger with 3rd party data sets.
P&C data greatly increases depth of data and risk differentiation
The underwriting decision when normal underwriting applied:
Standard risk Rated Declined
Linked to the same lives
12

Multi-line Company Cross-sell Model
At least two dozen variables used for each model.
Key variable examples: age, gender, auto violation points, liability limit, automobile type, no. of
vehicles covered etc.
Propensity to buy models were layered in on top of risk model to create a combined list of
customers to target.
Model Results
13

Objectives
Identify which medical claims to
investigate for fraud so as to make
the best use of limited claims
resources.
Modeling Process
Used a very comprehensive claims
data set and
built a GLM.
Key Variable Examples: sum
assured, duration, education,
payment frequency, geography
plus several interaction terms.
Results
Good model: Worst 20% have a
37% fraudulent claims rate and
best 20% has 0.2% fraudulent
claims rate.
Fraudulent Claims Identification Model
0.0%
10.0%
20.0%
30.0%
40.0%
50.0%
60.0%
1 2 3 4 5 6 7 8 9 10 11 12 13 14 15 16 17 18 19 20
Lift Curve of Claim Fraud Model
Average Rate = 12%
Best
groups
Worst
groups
14

Determine optimal non-medical limits that should be used for different customer segments.
Streamline the underwriting process by enforcing more stringent measures for high risks & vice versa.
Identify low risk policyholders for up-sell or cross-sell campaigns.
Understand true drivers of experience to improve decision making.
Incidence Rate vs. Face Amount
Non-Med Limit Risk Segmentation Model
Face Amount
Inci
den
ce
Objectives
GLM Model using only insurance company data e.g. age, gender, marital status, occupation, region, agent rating, claims and many other variables.
Model Building Process Data Source In-force + claims
Study Period 5 years
Product Critical Illness
Total Exposure Around 7m life years
Total Claims Around 10,000
15

Non-Med Limit Risk Segmentation Model
-
5.00
10.00
15.00
20.00
25.00
Impact of Medical Exam
Non Med
Med
Effectiveness of Medical Exams
-
0.50
1.00
1.50
2.00
2.50
3.00
3.50
2008 2009 2010 2011 2012
Non Med
Med
Removing the impact of age helps us
understand what is driving the differences
in claims experience.
Obvious example of how a univariate
analysis doesn’t allow us to understand
the true drivers of experience.
Year 1 Year 2 Year 3 Year 4 Year 5
Incid
en
ce
Incid
en
ce
Age

Variable Type Impact on claim
Age and Gender Main/Interaction age↑, M↑ F↓
Duration Numeric ↓
Face Amount Numeric ↑
Insured Smoking Indicator Binary Y↑
Region Categorical NE ↑ SW↓
Relationship to Policyholder Categorical Self↓
Agent Rating Categorical Tier X ↑ Tier Y↓
RATING_GROUP Categorical Single↑ Married↓
Non-Med Limit Risk Segmentation Model
Most Predictive Variables
17
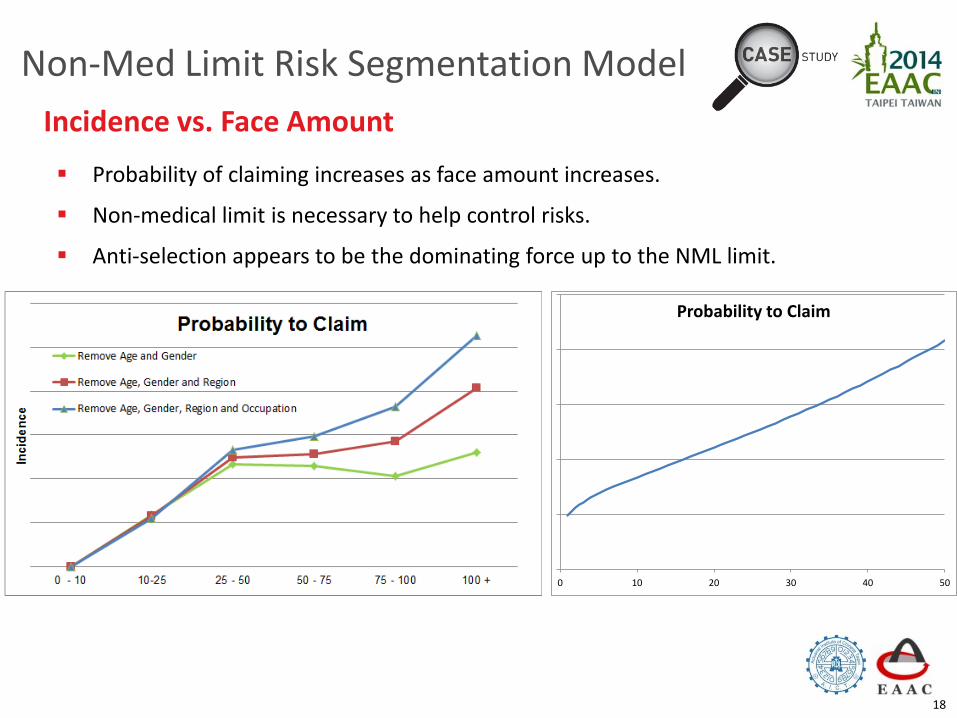
0 10 20 30 40 50
Probability to Claim
Non-Med Limit Risk Segmentation Model
Probability of claiming increases as face amount increases.
Non-medical limit is necessary to help control risks.
Anti-selection appears to be the dominating force up to the NML limit.
Incidence vs. Face Amount
18

By Duration: Incidence rates reduce as policy duration increases which
indicates severe anti-selective behavior.
Agency Rating: The insurers current rating system works well with better experience business coming from higher rated agents.
0.5
0.6
0.7
0.8
0.9
1.0
1.1
1.2
1.3
1.4
- 1 2 3 4 5 6
Duration Factor
Non-Med Limit Risk Segmentation Model
Model Results
19
Incid
en
ce
Incid
en
ce

Segment customers and set the non medical limit at or below the pricing assumption.
Non-Med Limit Risk Segmentation Model
Setting Non Medical Limits
20
0.0%
0.5%
1.0%
1.5%
2.0%
2.5%
100000 180000 260000 340000 420000 500000
Income=100k, Coast1, Agent Rating=Diamond
Income=100k, Coast2, Agent_Rating=Diamond
Income=100k, Middle, Agent_Rating=General
Incid
en
ce
Face Amount
Priced Incidence Rate
Risk Segment 1
Risk Segment 2
Risk Segment 3

TransUnion and RGA Mortality Study
Credit Bureaus in the US have enormous amounts of consumer credit
data on nearly 200 million Americans. This data captures attributes of
individuals related primarily to borrowing and repayment behaviors.
Credit data captured by the credit bureaus results in nearly 1000
different variables that are used in many different credit scoring
predictive models.
RGA has been working closely with TransUnion (one of the 3 major
credit bureaus in the United States), since April 2013 to better
understand the predictive nature of credit data for life insurance.
In early 2014, TransUnion completed work on the Credit Mortality
Index (CMI) and shared the CMI values and 80 other credit variables on
nearly 20 million individuals for RGA to complete an independent 12-
year mortality study of the model.
Background
21

TransUnion and RGA Mortality Study
Target Market:
o Can be used to assist in the market segmentation process.
o Focus on the best risks for new customers or upsell / cross-sell
campaigns.
Conversion near the end of the level-term period:
o Assist in the selection of policies for conversion near end of term.
o Offer favorable conversion terms to less risky policyholders.
Simplified issue programs:
o Used in conjunction with other real-time data (violations, Rx, MIB).
Additional segmentation in full underwriting.
Lapse prediction and related underwriting actions (premium,
face, payment terms, etc.)
Potential Applications
22

① Started with total credit-active population in 1998 – included 90% of adult population
② 92m records gathered, results are credible due to size of data:
44m used to create CMI
30m used to test and validate CMI to avoid over-fitting the model
18m used for mortality study validation
③ Deaths over 12 year observation period (1998-2010) were appended using the Social
Security Master Death File, Oct 2011 version
④ Started with 800 credit variables and the final model consists of 53 variables with the
highest stability, highest predictive power and low correlation amongst variables.
Variable Examples:
Months since oldest account opened
Aggregate balance of all accounts, exc. Mortgage
Payment pattern in last 18 months
⑤ Final CMI score is a single number ranging from 0 – 100 (0 = lowest mortality risk)
TransUnion and RGA Mortality Study
Credit Mortality Index (CMI) Modelling Process
23

① Created a 12-year (1999-2010) traditional actuarial study on 18m lives
② CMI was appended to the 18m records
③ Resulted in 194m exposure years
④ mapped to 1.1m deaths - Actual experience
(using the Social Security Master Death file, Oct 2011 Version)
⑤ Base mortality table – Expected experience:
1999 – 2010 historical US population mortality tables with adjustments:
Under-reported deaths in the Master Death file
Gender mix in the data
⑥ A/E = Actual Experience / Expected Experience
TransUnion and RGA Mortality Study
Combining Mortality Study with CMI
24
0
2
4
6
8
10
12
14
16
18
20
0%
50%
100%
150%
200%
250%
300%
5 10 15 20 25 30 35 40 45 50 55 60 65 70 75 80 85 90 95 100
Exp
osu
re C
ou
nt
in M
illio
ns
AE
(Ad
just
ed
Po
pu
lati
on
)
TU Mortality Index
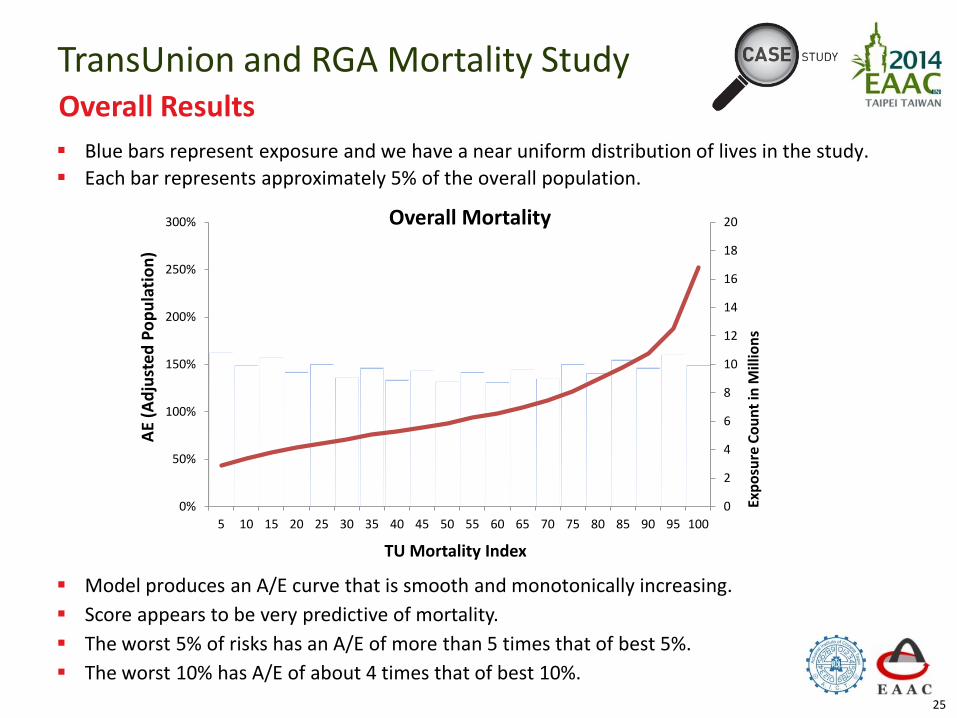
Overall Mortality
Blue bars represent exposure and we have a near uniform distribution of lives in the study.
Each bar represents approximately 5% of the overall population.
Model produces an A/E curve that is smooth and monotonically increasing.
Score appears to be very predictive of mortality.
The worst 5% of risks has an A/E of more than 5 times that of best 5%.
The worst 10% has A/E of about 4 times that of best 10%.
TransUnion and RGA Mortality Study
25
Overall Results

Similar but parallel upward shift as age increases.
Younger individuals with established credit seem to have better mortality (relative to
the general population) than older individuals.
0%
50%
100%
150%
200%
250%
5 10 15 20 25 30 35 40 45 50 55 60 65 70 75 80 85 90 95 100
AE
(Ad
just
ed
Po
pu
lati
on
)
TU Mortality Index
Mortality by Issue Age
60-69
50-59
40-49
30-39
20-29
Study also splits results by gender, duration (since data archive date) and US state. There is no significant difference in results when splitting into these groups (although broader state groupings did yield differences).
TransUnion and RGA Mortality Study
26
Results by Entry Age

Typical Predictive Modeling Process
1. Define Purpose of the Model
2. Collect & Prepare the
Data
3. Develop Models
4. Interpret & Apply Models
5. Monitor Results & Update
Model TypeSelection
Train Model
Test Model
Validate Model
Meets Requirements?
Understand Data
Clean Data
Transform Data?
Split Data into Training Data& Validation Data
Gather Data Interpret Results
Create Rules
Train Staff
Deploy Model
Communicate /Gain Acceptance
Monitor Output & Performance
Test Results Against Objectives
Refresh Data
Refine Model
Identify Goals of the Model
Identify Business Motivations
Identify Constraints
27

Closing ThoughtsWhere do I begin…
Figure out what current process needs to be optimized.
Understand what your competitors are doing.
We don’t have data…
Few companies do but you’ll be amazed by how much can be predicted with the data
you already have.
Speak to your business partners about data sharing.
Start capturing and digitizing data so you’ll have something to work with in the future.
We don’t have the expertize and risk appetite…
Locate and leverage existing resources in your organizations data/analytics teams.
Seek outside resources to help build models and share in potential risks.
Big projects are risky…
Start with a pilot and proof of concept.
Learn, expand and repeat.
I don’t have the budget…
Consider the costs, benefits and risks by building a business case.
Probably not as difficult and as expensive as you think…28