Embed Size (px)
Citation preview

Bicycle and Pedestrian Safety, Education, and Enforcement Program: 2017 Summary
NCDOT Research Project No. RP 2017-41
FINAL REPORT
Submitted to: North Carolina Department of Transportation
Division of Bicycle and Pedestrian Transportation Raleigh, NC
Submitted by:
University of North Carolina at Chapel Hill Highway Safety Research Center
Chapel Hill, NC
UNC-HSRC Report Authors: Kristin Blank
Seth LaJeunesse Laura Sandt
Sarah Johnson Sarah O’Brien
June 2018

i
Table of Contents Background and Project Goals ...................................................................................................................... 1
2017 Partner Communities ........................................................................................................................... 2
2017 Technical Assistance and Partner Training .......................................................................................... 3
Technical Assistance ................................................................................................................................. 3
Law Enforcement Training and Support ................................................................................................... 4
2017 Program Delivery ................................................................................................................................. 5
Program Delivery Metrics ......................................................................................................................... 5
Program Delivery Summary ...................................................................................................................... 6
Purchased Media .................................................................................................................................. 6
Print Materials and Giveaways ............................................................................................................. 8
Earned Media ...................................................................................................................................... 10
Website Usage .................................................................................................................................... 11
Community Engagement Efforts ......................................................................................................... 12
Law Enforcement Operations ............................................................................................................. 14
2017 Program Outcomes ............................................................................................................................ 16
The Central Role of Partnerships in Watch for Me NC Programs ....................................................... 17
Potential Difficulties with Watch for Me NC Program Implementation ............................................. 17
Watch for Me NC as a Tool to Promote Traffic Safety Culture ........................................................... 18
Recommendations for Prospective Partners ...................................................................................... 18
Toward a Narrative Theory of Watch for Me NC Campaign Development ........................................ 18
Conclusions and Recommendations ........................................................................................................... 19
Partner Recruitment and Training/Capacity-Building ............................................................................. 19
Local and Statewide Outreach, Education, and Enforcement ................................................................ 20
Program Evaluation ................................................................................................................................. 21

ii
List of Tables
Table 1. 2017 Partner Communities and Lead Agency. .................................................................. 3 Table 2. Key 2017 Watch for Me NC program delivery measures. ................................................ 5 Table 3. Summary of Purchased Print and Safety Materials. ......................................................... 8 Table 4. Reported Community Outreach Efforts. ......................................................................... 13 Table 5. Material Distribution and Use. ........................................................................................ 13 Table 6. Enforcement Efforts by Partner Agency. ........................................................................ 15 Table 7. Key 2017 Watch for Me NC Program Outcome Measures. ............................................ 16
iii
List of Figures
Figure 1. 2017 Watch for Me NC Partner Communities. ................................................................ 2 Figure 2. Watch for Me NC law enforcement training. .................................................................. 5 Figure 3. Ads were placed on traditional and digital billboards across the state. ......................... 7 Figure 4. Sidewalk Stencils Offered Safety Reminders to Pedestrians. .......................................... 7 Figure 5. Internal Transit Ads Focused on Pedestrian and Bicycle Safety Tips............................... 8 Figure 6. External Transit Ads. ........................................................................................................ 8 Figure 7. Watch for Me NC Project Website Home Page. ............................................................ 11 Figure 8. Web Use Statistics in 2017. ............................................................................................ 12 Figure 9. Examples of Community Engagement. .......................................................................... 14 Figure 10. Pre-Written Warning Notepad. ................................................................................... 16

iv
Executive Summary
Overview The Watch for Me NC program aims to empower communities to address pedestrian and bicycle crashes by supporting: (1) dissemination of safety messages through various outreach and education strategies; and (2) high-visibility enforcement of pedestrian, bicyclist, and motorist laws. The program began as a regional pilot test in 2012 and now has partner-driven efforts across the state. To learn more about the program and its history, visit: http://watchformenc.org/. In 2017, twenty-four prior communities and eight new communities were selected to participate. Many communities included one or more universities implementing the Watch for Me NC program at the campus level. The UNC Highway Safety Research Center (HSRC) supported NCDOT in program development, delivery, and evaluation. HSRC monitored program delivery by participating communities by collecting information through (1) web‐based reporting forms, (2) community status reports, and (3) interviews with program staff.
Technical Assistance and Training Participating communities received support and assistance from HSRC to implement their local programs. Support services included access to a partner listserv and contact list, direct technical assistance, a website of partner-specific resources, and facilitated web meetings to discuss how to effectively deliver educational and enforcement components of the program. Each meeting covered partners and strategies to make an impact, law enforcement roles and strategies for coordination, and successes and challenges to date. Additionally, HSRC offered nine full or half-day training courses to participating law enforcement agencies in summer 2017. Brian Massengill, a sergeant with the Durham Police Department, served as lead course instructor. The courses prepared officers to perform pedestrian and bicycle safety operations as part of the Watch for Me NC program. They involved classroom education on relevant laws and best practices in conducting enforcement, as well as field exercises in conducting targeted operations aimed at improving driver yielding at crosswalks. In total, 150 officers from 48 agencies participated in the trainings.
Program Delivery
Paid Media Media was a key element in distributing pedestrian and bicycle safety messages to the general public. NCDOT spent about $130,000 on media in at least 11 coverage areas across the state via a media purchasing contractor. Purchased media included 65 sidewalk stencils, more than 20 traditional and digital billboards, and external/internal bus ads placed in 6 bus systems across the state. The media contactor estimated that at least 18.9 million people were reached via purchased media. Additional funds were used to purchase print and safety materials, with tens of thousands of rack cards, posters, banners, bumper stickers, bike lights, and reflective bracelets delivered to community partners for dissemination through local events, public engagement, and operations events.
Local Outreach and Earned Media Participating communities performed extensive outreach, including distributing print materials and engaging with students, local businesses, community groups, and the general public at more than 180 local events. These included events such as 1) university and school open houses or student orientations, 2) National Night Out, 3) community meetings, and 4) festivals, fairs, and farmers markets. Partner communities also engaged with the media as a key strategy to help amplify the message to a

v
broader audience. At least eight statewide press releases were distributed by NCDOT, and more than 30 news stories (print, TV, and radio) covered local pedestrian and bicycle safety efforts related to Watch for Me NC.
Law Enforcement Operations From January 2017 to December 2017, 11 municipal police agencies and three university police departments reported conducting at least 110 operations targeting enforcement of pedestrian and/or bicycle‐related laws. These operations resulted in 1,567 warnings, 470 citations, and 518 other types of contacts made with the public. More than 75% of the operations conducted involved no more than three officers, and while many of the same officers participated in more than one operation, the total effort equated to the deployment of 392 officers. These operations total more than 105 hours in duration of enforcement, with 53% of them taking between one to two hours per operations event. This duration did not include time spent doing routine enforcement patrols that incorporated pedestrian and bicycle safety surveillance. In large part, officers focused on issuing warnings to try to engage the public and raise awareness of the laws. Partners reported many positive outcomes, including improved road user awareness and behaviors, positive community response, and traffic citations upheld consistently in court. Similar to 2016, some communities took a “good ticket” approach, partnering with local businesses to deliver “caught being good” tickets that offered local business discounts or free food to serve as positive reinforcement of safe behaviors observed.
Program Outcomes HSRC conducted interviews with a subset of the 32 Watch for Me NC community partners in December 2017. From this interview process, five key lessons learned emerged regarding the communities’ experiences with participating in the Watch for Me NC program: (1) All partners agreed partnerships were key to effectively implementing the Watch for Me NC program in their communities; (2) they reported significant changes in their agencies’ “culture” in response to their communities’ participation in Watch for Me NC; (3) partners shared that Watch for Me NC concepts were being incorporated into plans, programs, and enforcement procedures; (4) program implementation often involved such challenges as devoting sufficient staff time and resources, ensuring partner commitment, and partner’s not fully prioritizing pedestrian and bicycle safety; and (5) partners recommended future Watch for Me NC participants form coalitions involving agencies with overlapping goals, and institutionalizing Watch for Me NC activities through policies.
Conclusion Overall, the 2017 program involved significant participation by partners in diverse communities across NC. The measures used to evaluate the program provided evidence of opportunities and barriers to program delivery. As the program continues to add communities across the state, it may be necessary to continue evolving both the content and the format of the technical assistance delivery and the law enforcement training program. Similarly, the program evaluation approach may need to be adapted to accommodate the “scaling up” of the program across the state. It is recommended that future evaluations make use of a combination of measures—including qualitative data, survey data, field observations, and crash data, if possible—and use sophisticated techniques to account for additional factors in order to provide valid estimates of both short and longer-term program impacts.

1
Background and Project Goals According to the latest data available from the National Highway Traffic Safety Administration,1,2 in 2016, 5,987 pedestrians and 840 bicyclists were killed in motor vehicle crashes in the US. Injury estimates for 2016 were not available at the time of publication due to a change in NHTSA’s sampling system to estimate the number of injuries from a representative sample of police reported traffic crashes. Pedestrian and bicycle safety is an important issue for the health, safety, and mobility of North Carolinians. Statewide, in 2016 approximately 2,200 pedestrians and 590 bicyclists were hit by cars, with a large majority of these people sustaining injuries.3 In North Carolina, pedestrians and bicyclists represent approximately 12% of all motor vehicle crash fatalities, which is very similar to national proportions. These modes are overrepresented in crash data compared to the percentage of walking and cycling trips made in the state, based on the 2009 National Household Travel Survey. Watch for Me NC was developed and subsequently pilot tested in the Triangle area starting in 2012. The program opened up to the entire state in 2014 and has been expanding geographically each year since. In 2017, the goal of this effort was to assist partner communities across North Carolina in successfully implementing the Watch for Me NC program, and to monitor program delivery and measure outcomes to develop recommendations for future program expansion or improvements. To accomplish this goal, the project team from the University of North Carolina (UNC) Highway Safety Research Center (HSRC) sought to:
1. Recruit local partners with interest and ability to participate in the Watch for Me NC program
2. Provide technical assistance and training to support local and statewide program
implementation
3. Coordinate with local agencies and NCDOT to collect, manage, and analyze data related to the
program delivery
4. Evaluate the program delivery and present findings and lessons learned
This report documents methods and results related to the above activities.
1 National Highway Traffic Safety Administration. (2018). Traffic Safety Facts 2016 Data, Pedestrians (Publication No. DOT HS 812493). National Center for Statistics and Analysis, National Highway Traffic Safety Administration, Washington, DC, 2018. Retrieved from https://crashstats.nhtsa.dot.gov/Api/Public/ViewPublication/812493. 2 National Highway Traffic Safety Administration. (2018a). Traffic Safety Facts 2016 Data, Bicyclists and
Other Cyclists (Publication No. DOT HS 812507). National Center for Statistics and Analysis, National Highway Traffic Safety Administration, Washington, DC, 2017. Retrieved from https://crashstats.nhtsa.dot.gov/Api/Public/ViewPublication/812507. 3 Highway Safety Research Center at University of North Carolina at Chapel Hill. (n.d.). North Carolina
Crash Data Query Web Site. Retrieved from http://nccrashdata.hsrc.unc.edu/index.cfm.

2
2017 Partner Communities HSRC coordinated with NCDOT to implement an applicant selection process, which began in early 2017 with a call for applicants and an informational webinar to describe the process, benefits, and requirements of participation. Applicants were screened to ensure they met basic eligibility requirements, and then applications were reviewed by a selection committee made up of representatives from HSRC, and the Watch for Me NC Steering Committee members (NCDOT, GHSP, DHHS, and SHP). Applications were rated based on:
Understanding: Does the agency demonstrate a clear understanding of the Watch for Me NC program, including goals, partner responsibilities, timeline, and expected activities?
Capacity: Does the agency demonstrate the capacity to participate in the program (including supporting both education/outreach and enforcement activities)?
Focus/Approach: Does the agency have a clear focus on reaching the K-8 school population and a realistic and effective approach?
The selection committee also took crash history and geographic representation of applicants into consideration. A total of 32 communities were selected, including eight new communities and 24 returning partners (see Table 1 and Figure 1). Many communities included one or more universities that implemented the Watch for Me NC program at the campus level. Overall, there was considerable variation in community size, region, and lead agency (Table 1).
Figure 1. 2017 Watch for Me NC Partner Communities.

3
Table 1. 2017 Partner Communities and Lead Agency.
Community (County) County Population Primary Point of Contact
Apex (Wake) 974,289 Apex Police Dept
Asheville (Buncombe) 250,539 Asheville Police Dept
Boone (Watauga) 52,372 Boone Police Dept
Burgaw (Pender) 55,166 Burgaw Police Dept
Cape Fear Community College (New Hanover) 213,267
Cape Fear Community College Police Dept
Carrboro (Orange) 140,352 Carrboro Police Dept
Returning Partners
Cary (Wake) 974,289 Cary Police Dept
Chapel Hill (Orange) 140,352 Chapel Hill Police Dept
Charlotte (Mecklenburg) 1,012,539 Charlotte Police Dept
Cornelius (Mecklenburg) 990,228 Cornelius Police Dept
Corolla (Currituck) 24976 Corolla Police Dept
Creedmoor (Granville) 58,500 Creedmoor Police Dept
Durham (Durham) 288,133 Durham Planning Dept
Elizabeth City (Pasquotank) 40,018 Elizabeth City Police Dept
Elon (Alamance) 155,258 Elon University Police Dept
Fuquay-Varina (Wake) 974,289 Fuquay-Varina Police Dept
Garner (Wake) 974,289 Garner Police Dept
Greensboro (Guilford) 506,610 Greensboro Planning Dept
Greenville (Pitt) 174,263 Greenville Police Dept
Kannapolis (Cabarrus) 330,733 Kannapolis Police Dept
Kill Devil Hills (Dare) 35019 Kill Devil Hills Police Dept
Knightdale (Wake) 974,289 Knightdale Police Dept
Morganton (Burke) 89,486 Morganton Public Safety Dept
Morrisville (Wake) 974,289 Morrisville Police Dept
Murphy (Cherokee) 27,444 Murphy Police Dept
Newton (Catawba) 154,610 Newton Police Dept
North Wilkesboro (Wilkes) 68,946 North Wilkesboro Police Dept
Oak Island (Brunswick) 115,926 Oak Island Police Dept
Pine Knoll Shores (Carteret) 68,228 Pine Knoll Shores Police Dept
Raleigh (Wake) 974289 Raleigh Police Dept
Transylvania County 33,045 Transylvania County Planning Dept
UNC-Wilmington (Hanover) 213,267 UNC-Wilmington Campus Police Dept
2017 Technical Assistance and Partner Training
Technical Assistance HSRC provided technical assistance to Watch for Me NC partners and NCDOT. To guide and support the partners’ campaign implementation, HSRC maintained a listserv just for partners, responded to questions from individual agencies, planned and facilitated web/phone meetings, and maintained a web

4
page for partner-specific resources. The intent of the listserv was to foster information sharing among partners and provide an efficient way for HSRC to answer questions and share announcements and information. Much of HSRC’s technical assistance occurred during a kickoff meeting and two conference calls/webinars with Watch for Me NC partners. Each meeting time was structured to include a combination of presentation time about a topic critical to campaign implementation and a time for reports from each partner about current activities, successes, and challenges. Content-rich presentations served as the delivery mechanism to provide the technical assistance resources proposed in the original scope of work. Major topics addressed during the meetings included:
May 8: Watch for Me NC Pedestrian and Bicycle Safety Program 2017 Kickoff
July 18: Using Crash Data to Refine Program Activities
September 15: Share Meeting: Peer Exchange on Watch for Me NC Activities and Advice HSRC also maintained a resource page for partners that included archived recordings and notes of all meetings as well as contact lists, example enforcement operations plans, law enforcement data collection forms, public education resources (with an emphasis on supporting inclusion of K – 8 schools in Watch for Me NC), and a media toolkit.
Law Enforcement Training and Support Training was provided to 150 officers from 48 agencies from May to August 2017 to prepare them for performing pedestrian and bicycle safety operations as part of the Watch for Me NC program. Brian Massengill, a sergeant with the Durham Police Department, was sub‐contracted to lead one‐day and half-day courses. The courses involved classroom education regarding relevant North Carolina laws and best practices in conducting enforcement, as well as field exercises in conducting targeted operations aimed at improving driver yielding at crosswalks. Trainings also included tips on distributing materials, hosting events, making presentations, engaging the media, and working with schools and universities. The half-day refresher course provided a deeper dive for officers already familiar with the program and allowed time for them to share their own experiences conducting pedestrian and bicycle safety-related operations and events. In addition to receiving training, officers received copies of the rack card to hand out during routine or targeted enforcement operations, as well as a template operations plan to help them coordinate and perform consistent and safe operations. Sandwich boards for new partners and warning ticketbooks purchased by NCDOT, similar to previous years, were also provided as a way to support law enforcement operations. Finally, officers received bicycle light sets—headlight and taillight—and reflective bracelets to give to local residents when observed walking or bicycling at night without a light as a means of positive reinforcement or in lieu of a citation (see images in Table 3).
5
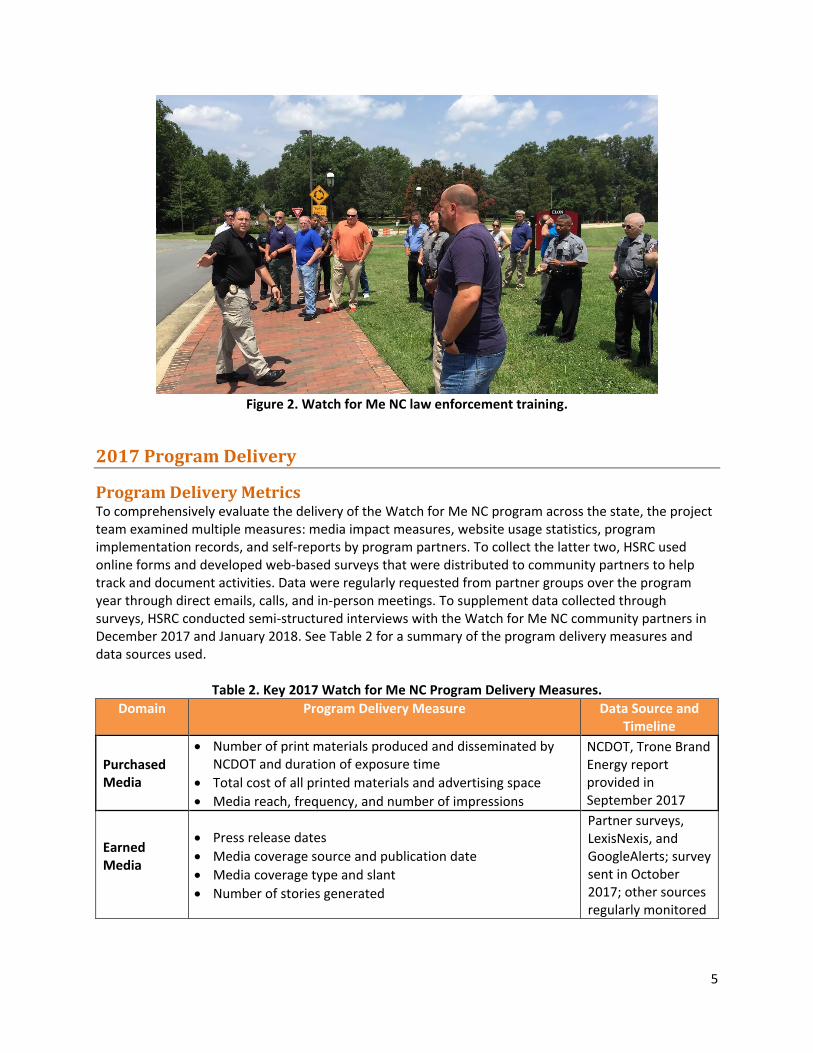
Figure 2. Watch for Me NC law enforcement training.
2017 Program Delivery
Program Delivery Metrics To comprehensively evaluate the delivery of the Watch for Me NC program across the state, the project team examined multiple measures: media impact measures, website usage statistics, program implementation records, and self-reports by program partners. To collect the latter two, HSRC used online forms and developed web-based surveys that were distributed to community partners to help track and document activities. Data were regularly requested from partner groups over the program year through direct emails, calls, and in-person meetings. To supplement data collected through surveys, HSRC conducted semi-structured interviews with the Watch for Me NC community partners in December 2017 and January 2018. See Table 2 for a summary of the program delivery measures and data sources used.
Table 2. Key 2017 Watch for Me NC Program Delivery Measures.
Domain Program Delivery Measure Data Source and Timeline
Purchased Media
Number of print materials produced and disseminated by NCDOT and duration of exposure time
Total cost of all printed materials and advertising space
Media reach, frequency, and number of impressions
NCDOT, Trone Brand Energy report provided in September 2017
Earned Media
Press release dates
Media coverage source and publication date
Media coverage type and slant
Number of stories generated
Partner surveys, LexisNexis, and GoogleAlerts; survey sent in October 2017; other sources regularly monitored

6
Domain Program Delivery Measure Data Source and Timeline
Website Usage
Website visits
Unique website visitors
Page views
% new vs. returning visitors
Visit frequency and duration
Google Analytics; data collected continuously
Law Enforcement Activities
Count and total cost of all safety materials
Count of safety operations run by agency
Count and type of warnings and citations administered per operation
Count of enforcement officer hours spent per operation, by agency
Count of safety materials disseminated, by agency
NCDOT; partner agencies; regular requests made via listserv and calls to share data
Community Engagement Activities
List of partner agencies and key coalition members
Brief description of community engagement strategies used by partner agencies
Count of engagement events by agency, including type of event, population reached, staff involvement, etc.
Partner survey sent in October 2017
The findings regarding the program delivery are presented in the sections below.
Program Delivery Summary
Purchased Media Purchased media includes printed materials and outdoor and indoor advertising space purchased. The purpose of this media was to deliver specific behavioral messages regarding pedestrian and bicycle safety to the general public in order to raise awareness of safety concerns and encourage road users to drive, bike, and walk more safely. Messages were disseminated through a variety of outlets, depending on the format of the media. Ad buys targeted beach communities and city communities to primarily reach adult males aged 30-60 years old, pedestrians, and bicyclists. NCDOT and its media purchasing contractor, Trone Brand Energy, Inc., provided information regarding paid media contracting and printing services used from June 26 to August 28, 2017. A total of $130,350 was spent on purchased media, including outdoor advertising (e.g., transit ads, sidewalk stencils, and mobile and traditional billboards). Additional funds were spent to cover the costs of print and safety materials (see details in Table 3). Trone estimated that at least 9,490,000 people were reached via billboards, sidewalk stencils, and transit advertisements per month. This figure does not include potential impressions from the print materials. A summary of media purchased, including the amounts, locations distributed, and timeframe of the ad placement is provided in the sections below.
It was estimated that Watch for Me NC ads were
seen more than 18.9 million times across the
state in the peak two months of the campaign.

7
Traditional Billboards More than 20 traditional billboard ads ran in partner communities for several weeks (Figure 3). Billboards were installed in Asheville, Boone, Burlington, Durham, Greensboro, Greenville, Hickory, and Raleigh from June 26 to August 28, 2017. A digital billboard was installed in Charlotte. The goal of the billboards was to reach drivers coming into a community, particularly tourists, to send a message that yielding to pedestrians and driving carefully around bicyclists is a normative behavior. The traditional billboards generated over 5.5 million impressions each month, and the digital billboard in Charlotte made over 141,000 impressions per month.
Figure 3. Ads were placed on traditional and digital billboards across the state.
Sidewalk Stencils The program deployed sidewalk stencils (See Figure 4), which use a pressure washer to imprint safety messages onto sidewalks and were first introduced in the 2015 program year. The stencils, which can last up to one year, were strategically placed at key intersections and high traffic areas. A total of 65 stencils were installed in six regions, primarily focusing on beach communities – Brunswick County (Oak Island and Southport), Carteret County (Morehead City, Atlantic Beach, and Emerald Isle), Dare County (Kill Devil Hills), New Hanover County (Wilmington), Burlington, and Hickory. The stencils provided an estimated 10,000 impressions per application site for a total of 650,000 impressions.
Figure 4. Sidewalk stencils offered safety reminders to pedestrians.
Transit Ads Transit ads (see Figures 5 and 6) were placed on the interiors and exteriors of buses in six different transit systems, depending on the space available. Transit advertisements resulted in more than 3.2 million impressions per month. This strategy originated in the pilot program, where a pedestrian crash analysis identified a strong spatial association between high pedestrian crash areas and high-use transit routes. Bus vendors estimate that 90% of its audience is “exposed” to transit advertising each month. Most ads ran in July and August.

8
Figure 5. Internal transit ads focused on pedestrian and bicycle safety tips.
Figure 6. External transit ads.
Print Materials and Giveaways Print materials and other giveaways were provided to partner communities for local distribution (see Table 3). More on how communities distributed Watch for Me NC safety messages and materials is described in the “Community Engagement Efforts” section.
Table 3. Summary of Purchased Print and Safety Materials.
Item Description Distribution Example
Bumper Stickers Two standard-size bumper stickers with pedestrian and bicycle safety messages aimed at drivers.
10,725 of each pedestrian and bicycle bumper sticker were provided to the partner communities.

9
Item Description Distribution Example
Brochure/Rack Card Two-sided 3.75 inch by 8.5 inch document with laws and safety tips aimed at drivers, pedestrians, and bicyclists.
3,900 rack cards in English and 3,475 in Spanish were provided to all partners and law enforcement agencies for distribution through libraries, community centers, local businesses, and direct contact.
Banners 3 ft by 6 ft or 3 ft by 8 ft outdoor banners with messages aimed at drivers.
25 of each pedestrian and bicycle safety banners were distributed to the new community partners.

10
Item Description Distribution Example
Posters 11 by 17 inch posters with a series of four messages aimed at pedestrians and bicyclists.
1,270 English language posters and 875 Spanish language posters were sent to the communities for distribution in businesses, community centers, libraries, campuses, and other public locations throughout participating communities.
Bike Lights Front and tail lights with the Watch for Me NC logo, intended for bicyclists.
2,450 bike light sets were distributed to law enforcement partners to be given to bicyclists observed riding without lights.
Bracelets Bracelets/arm or leg straps with LED lights and the Watch for Me NC logo.
7,280 bracelets were distributed to law enforcement partners to be distributed at operations or community events.
Earned Media Earned media consisted of TV, radio, and print news coverage of the program that was not purchased. The project team began tracking news articles in January 2017 and routinely searched Lexis‐Nexis archives and Google News alerts throughout the year. The team also gathered information on media engagement through partner surveys and interviews. During the time period, NCDOT and program partners released several press releases and safety announcements. The releases ranged from announcing a community’s participation in the campaign, to safety announcements, to warnings about

11
upcoming enforcement efforts. At least nine communities used social media, such as Facebook and Twitter, to share campaign message or event information. Moreover, partners in Carrboro, Chapel Hill, Wilmington, and Morrisville frequently used the hashtag #WatchForMeNC to promote campaign events and messaging. The program saw continued news coverage throughout the year. In 2017, the campaign generated at least 33 stories in media outlets across the state. While several news stories focused on areas that joined the campaign in 2017, the majority of coverage came from returning partner communities. As in previous years, news and editorial coverage remained largely positive toward the effort. Newspaper articles and television reports primarily focused on crash statistics and road fatalities and how the program is working to reduce those figures through better education of drivers, pedestrians, and bicyclists, as well as through enhanced enforcement of existing pedestrian and bicycle safety laws.
Website Usage To distribute information to partner communities, the public, and the media, the team continued to develop and maintain the Watch for Me NC website, http://www.watchformenc.org (see Figure 7). The site serves as a central information point for the program and a repository for campaign materials and media coverage.
Figure 7. Watch for Me NC project website home page. Data regarding the Watch for Me NC website usage during the 2017 program year were extracted from Google Analytics. From January 1, 2017 to December 31, 2017, 6,139 visitors had 8,189 sessions and viewed 18,279 pages. While this suggests a decrease in traffic from last year whene there was a significant jump in activity, the number of unique visitors is still increased from 2015. Further analyses is needed to truly understand trends in this website over the previous program years.
In 2017, the Watch for Me NC campaign generated at
least 33 stories in local news outlets, and its website was viewed nearly 39,000 times.
12
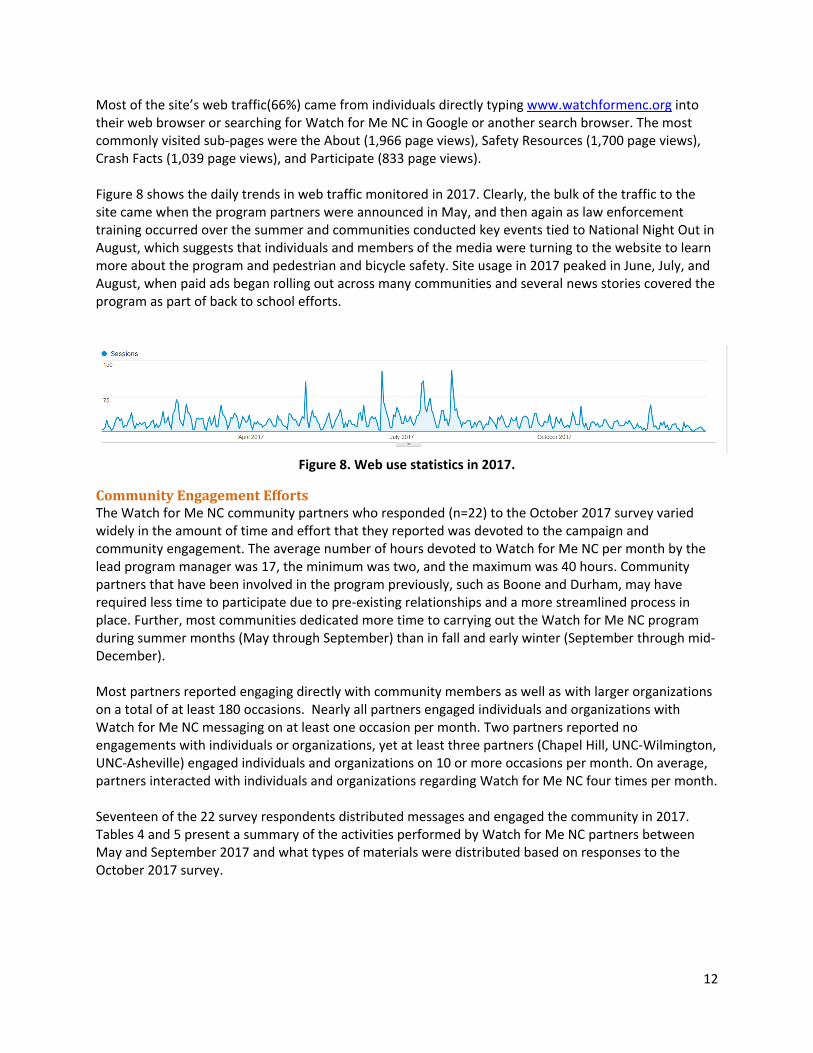
Most of the site’s web traffic(66%) came from individuals directly typing www.watchformenc.org into their web browser or searching for Watch for Me NC in Google or another search browser. The most commonly visited sub‐pages were the About (1,966 page views), Safety Resources (1,700 page views), Crash Facts (1,039 page views), and Participate (833 page views). Figure 8 shows the daily trends in web traffic monitored in 2017. Clearly, the bulk of the traffic to the site came when the program partners were announced in May, and then again as law enforcement training occurred over the summer and communities conducted key events tied to National Night Out in August, which suggests that individuals and members of the media were turning to the website to learn more about the program and pedestrian and bicycle safety. Site usage in 2017 peaked in June, July, and August, when paid ads began rolling out across many communities and several news stories covered the program as part of back to school efforts.
Figure 8. Web use statistics in 2017.
Community Engagement Efforts The Watch for Me NC community partners who responded (n=22) to the October 2017 survey varied widely in the amount of time and effort that they reported was devoted to the campaign and community engagement. The average number of hours devoted to Watch for Me NC per month by the lead program manager was 17, the minimum was two, and the maximum was 40 hours. Community partners that have been involved in the program previously, such as Boone and Durham, may have required less time to participate due to pre-existing relationships and a more streamlined process in place. Further, most communities dedicated more time to carrying out the Watch for Me NC program during summer months (May through September) than in fall and early winter (September through mid-December). Most partners reported engaging directly with community members as well as with larger organizations on a total of at least 180 occasions. Nearly all partners engaged individuals and organizations with Watch for Me NC messaging on at least one occasion per month. Two partners reported no engagements with individuals or organizations, yet at least three partners (Chapel Hill, UNC-Wilmington, UNC-Asheville) engaged individuals and organizations on 10 or more occasions per month. On average, partners interacted with individuals and organizations regarding Watch for Me NC four times per month. Seventeen of the 22 survey respondents distributed messages and engaged the community in 2017. Tables 4 and 5 present a summary of the activities performed by Watch for Me NC partners between May and September 2017 and what types of materials were distributed based on responses to the October 2017 survey.

13
Table 4. Reported Community Outreach Efforts.
Community outreach efforts conducted from May through September 2017 (N = 22 responses)
Percent Count
Directly engaged individuals and organizations with Watch for Me NC messaging
77.3% 17
Used the campaign hashtag #WatchForMeNC to communicate about Watch for Me NC on social media
40.9% 9
Table 5. Material Distribution and Use.
What type of materials did you distribute or use? (N = 22 responses) Percent Count
Bike lights 72.7% 16
Bumper stickers 68.2% 15
Rack Cards/Brochures 63.7% 14
Bracelets 40.9% 9
Banners 36.4% 8
Based on survey responses, at least 180 local events were attended or hosted by Watch for Me NC partners from May through September 2017 in partner communities, which represents an average of eight events per reporting community. Many communities worked to engage the media at these events as well; these efforts are described in the earned media section above. Events that presented opportunities to distribute safety messages typically included:
University open houses or student orientations
New employee orientations
Crossing guard trainings
Coffee with a Cop events
National Night Out
National Family Volunteer Day
Bicycle/Pedestrian Advisory or Advocacy Group meetings
Transportation planning public meetings
School events (“Back to School” nights; Walk or Bike to School Day events)
Bicycle safety clinics
Halloween-themed events
Festivals, fairs, and farmers markets
Distribution of materials at senior citizen centers, churches, YMCAs
Distribution of materials at conventions, including the NC Bike Summit
Neighborhood presentations
Additionally, materials were commonly distributed at city/town hall, local bike shops, bookstores, restaurants, university resident areas, and other campus locations. Materials were also distributed during police enforcement events, through faith-based groups (Figure 9), council meetings, and at Safe Kids/Safe Communities, MPO meetings, and transportation fairs.

14
Figure 9. Examples of Community Engagement
Law Enforcement Operations Law enforcement activities were tracked through an online form completed by law enforcement agency staff (form available at www.watchformenc.org/reporting). From January to December 2017, 11 municipal police agencies and three university police departments reported conducting more than 100 operations targeting enforcement of pedestrian and/ or bicycle‐related laws. These efforts involved the equivalent of more than 350 officers spending more than 105 hours conducting Watch for Me NC enforcement activities, not including time spent doing routine enforcement patrols that incorporated pedestrian and bicycle safety surveillance. All efforts were performed without receiving any additional compensation from the Watch for Me NC program sponsor. The operations resulted in 1,567 warnings, 470 citations, and more than 2,500 direct contacts made with the public (Table 6). Additionally, thousands of Watch for Me NC materials were distributed during these events including rack cards, bumper stickers, bike lights, and other materials. These figures are significantly higher than what was reported in 2016. Unlike previous years, enforcement operations took place not in a singular month but throughout the Fall campaign season, with some communities reporting year-round operations taking place. In large part, officers focused on issuing warnings to try to engage the public and raise awareness of the laws. Partners reported many positive outcomes, including improved road user awareness and behaviors, positive community response, and traffic citations upheld consistently in court. This year, many communities also took a “good ticket” approach, often partnering with local businesses to deliver “caught being good” tickets that held local business discounts/free food to serve as positive reinforcement of safe behaviors observed. Table 6 provides a breakdown of the enforcement warnings and citations by partner agency. The citations and warnings covered a range of violations for all road users, including: failure to yield to
Watch for Me NC communities held more than 180 engagement
events and 110 enforcement operations,
directly reaching thousands of community
members with safety messages in 2017.

15
pedestrians (when turning or going straight through a crossing), failure to abide by signal/stop controls, speeding, unsafe passing, agressive/reckless driving, alcohol-related offenses, failure to use crosswalk, and failure to use lights/reflectors at night. Six of the agencies responding to the community engagement survey indicated that they also used the Governor's Highway Safety Program STEP (Statewide Traffic Enforcement Program) Reporting System to get credit for their Watch for Me NC enforcement activities. It is unclear if the same activities were reported through both the STEP and Watch for Me NC evaluation systems. While most partners were responsive to requests for information, certain communities had multiple police departments working across a region, or multiple units within the same department performing operations, and not all activities were closely coordinated or planned in advance. It is possible that staff may have under-reported the true amount of enforcement activities taking place within their respective jurisdictions. Additionally, several partner groups reported no specific law enforcement operations at all. These communities may have focused more on educational outreach or lacked the staff to collect and provide the report forms to share their enforcement efforts.
Table 6. Enforcement Efforts by Partner Agency.
Agency Number of
Events
Driver Warnings
Driver Citations
Ped Warnings
Ped Citations
Bicyclist Warnings
Bicyclist Citations
Other/ Total
Contacts
Universities
UNC Asheville 28 1 0 41 46 4 0 163
UNC Greensboro
30 144 47 120 0 57 0 1
UNC Wilmington
6 0 0 230 0 395 0 0
Municipalities
Asheville 2 0 11 0 0 0 1 20
Boone 7 4 22 3 0 0 0 0
Carrboro 2 4 3 0 0 35 0 5
Charlotte-Mecklenburg
10 69 272 166 0 0 0 233
Fuquay-Varina 8 42 13 27 0 0 0 0
Greensboro 1 21 0 0 0 0 0 50
Greenville 3 13 19 14 0 0 0 16
Kannapolis 1 0 11 53 0 0 0 0
Knightdale 6 40 19 0 0 0 0 20
Morrisville 5 83 6 1 0 0 0 0
Pine Knoll Shores
1 0 0 0 0 0 0 10
Event Total 110 421 423 655 46 491 1 518
Grand Total 2,555
16
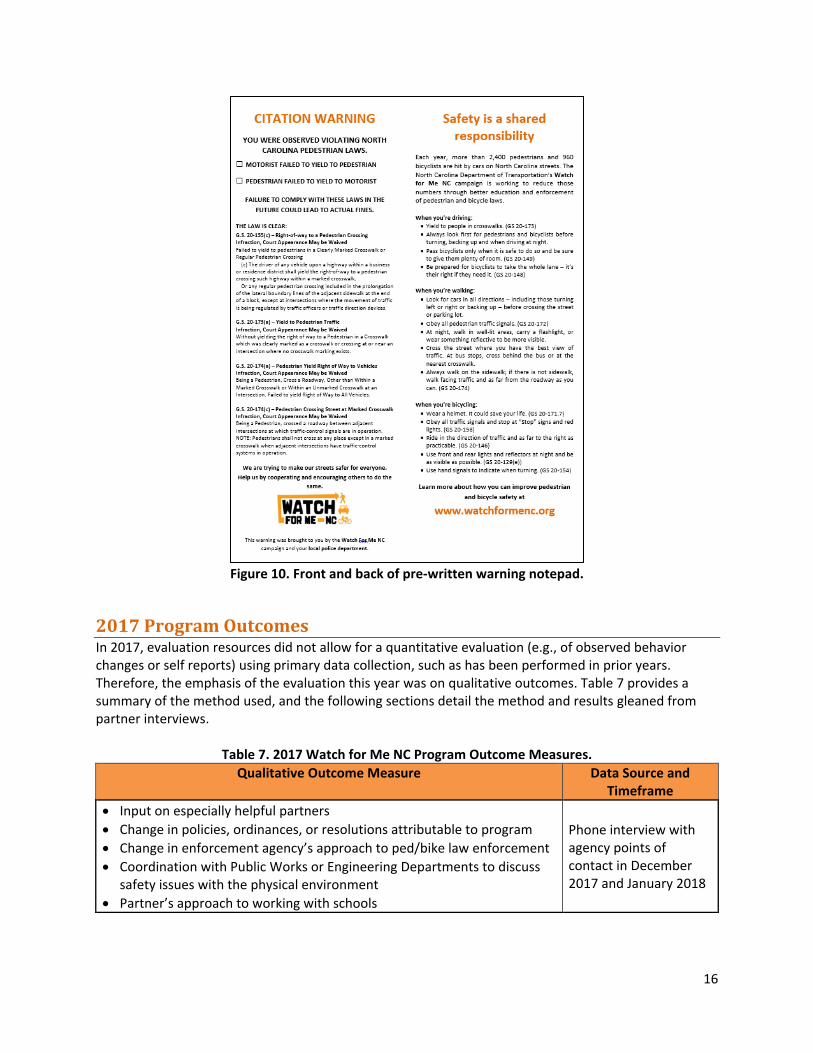
Figure 10. Front and back of pre-written warning notepad.
2017 Program Outcomes In 2017, evaluation resources did not allow for a quantitative evaluation (e.g., of observed behavior changes or self reports) using primary data collection, such as has been performed in prior years. Therefore, the emphasis of the evaluation this year was on qualitative outcomes. Table 7 provides a summary of the method used, and the following sections detail the method and results gleaned from partner interviews.
Table 7. 2017 Watch for Me NC Program Outcome Measures.
Qualitative Outcome Measure Data Source and Timeframe
Input on especially helpful partners
Change in policies, ordinances, or resolutions attributable to program
Change in enforcement agency’s approach to ped/bike law enforcement
Coordination with Public Works or Engineering Departments to discuss safety issues with the physical environment
Partner’s approach to working with schools
Phone interview with agency points of contact in December 2017 and January 2018

17
To gather qualitative outcome data, in December 2017 and January 2018, HSRC conducted interviews with 18 of the 32 Watch for Me NC partners. Three attempts were made to interview each partner within the evaluation period. The interviews were semi-structured, which involved asking all partners the same set of questions, while allowing room to probe partners’ responses to learn more about specific perspectives or Watch for Me NC program elements. Once HSRC staff transcribed interview notes, we carried out a grounded theory analysis to draw out narrative themes in Watch for Me NC partners’ responses and to develop a theory for how Watch for Me NC tends to unfold in diverse NC communities. To see details regarding each individual community, read the 2017 Community Profiles at: http://www.watchformenc.org/about/partner-community-profiles/.
The Central Role of Partnerships in Watch for Me NC Programs Several of the narrative themes that emerged related to various aspects of partnering. Partners within communities’ Watch for Me NC programs worked together to examine safety issues through real-time or video-taped observations and historical crash statistics. In Cornelius, law enforcement officers used videos of road user interactions captured at downtown intersections to observe pedestrian-motor vehicle conflicts. The police department then drew upon video footage to highlight risks to pedestrians’ safety to elected officials and the public. And in Garner, local law enforcement targeted areas to enforce yielding laws based on a combination of crash statistics in areas with relatively high pedestrian volumes. Many of these observations and enforcement activities led to coordinated implementation of safety engineering countermeasures. In Murphy, local law enforcement worked with the NCDOT Division planning engineer to install a crosswalk near an elementary school. In Cornelius and Pine Knoll Shores, law enforcement officers proposed posted speed limit reductions to their respective NCDOT Division staff who implemented variable, season-based speed limit reductions of 10 mph during peak tourist season (i.e., from 35 to 25 mph in Cornelius and from 45 to 35 mph in Pine Knoll Shores). Among the most common Watch for Me NC partners were elementary schools and the groups that support them. Schools tended to serve as places to install engineering countermeasures, conduct safety trainings, diffuse safety messaging, and enforce traffic speeds. Engineers with the city of Charlotte installed a handful of midblock crosswalks in school zones. In Wilmington, city staff and local advocates participated in Walk to School Day to engage school community members around safe driving and pedestrian behaviors. Garner’s law enforcement officers carried out most of their driver yielding and speed enforcement in school zones, performing operations almost daily. On the other end of the age spectrum, Transylvania County staff focused much of their Watch for Me NC outreach on engaging senior citizens, recognizing that older adults were overrepresented in their crash reports.
Potential Difficulties with Watch for Me NC Program Implementation Partner-reported difficulties implementing Watch for Me NC fell into two broad categories. For one, several partners shared that it was difficult to secure sufficient staff capacity to effectively carry out the program. Staff in Transylvania County received Watch for Me NC materials late in the season, which delayed their roll-out of their outreach efforts. In places as diverse as Raleigh, Oak Island, and Cape Fear Community College, partners indicated that law enforcement lacked coverage to conduct crosswalk or speed enforcement due to staff changes, or that city staff were overtaxed with other more pressing programs to devote sufficient energy to implementing Watch for Me NC. A partner in Wilmington thought it would prove helpful to, and in fact, did hire a staff member to coordinate, organize, and lead Watch for Me NC in the community.

18
The other challenge related to consistently carrying out Watch for Me NC activities is reaching and engaging transient audiences. Both Durham and Carrboro with their sizable college-age populations, cited difficulties bringing incoming students up to speed with norms and laws related to yielding and paying attention while walking, cycling, and driving. Similarly, a law enforcement officer in Pine Knoll Shores noted how a recurrent influx of visitors made it difficult foster a common understanding and appreciation for local norms around safe driving and walking. It seems that in areas with large tourism-based economies, a common priority for engineers and town leaders is to mitigate traffic congestion and ensure high degrees of mobility for visitors and residents in periods of surging tourism. Watch for Me NC partners in Wilmington believed that their NCDOT Division engineers were mostly concerned with the movement of cars and not necessarily people.
Watch for Me NC as a Tool to Promote Traffic Safety Culture Despite the difficulties with implementing Watch for Me NC, several partners shared insights into how they are fostering community norms related to road user safety. The mayor of Carrboro leads a bike ride twice a year in coordination with the police department to showcase bicycling as a normal and desirable means of traveling around town. Watch for Me NC partners in Garner, Oak Island, Durham, and Raleigh shared how local Facebook groups, citizen groups, planning staff, and police departments coordinate communications to help spread Watch for Me NC—and in the case of Durham and Raleigh, Vision Zero—messaging. Finally, in Burgaw law enforcement worked with the local media to cover events where Watch for Me NC was featured, finding that, in response, elected officials enhanced their support for the program. As more people in Watch for Me NC communities practice safe traveling behaviors, it appears that a growing contingent of residents express a desire for streets to afford more than moving traffic. Several Watch for Me NC partners shared that community leaders and residents would like to walk, gather, and play in neighborhood streets. That is, they see streets more as places to be in rather than spaces to travel through. Toward this end, residents in Boone and Charlotte have asked the engineering and public works departments to install sidewalks, crosswalks, and to calm traffic in neighborhoods and school zones.
Recommendations for Prospective Partners Considering the evolving nature of Watch for Me NC and the revolving list of campaign partners, existing partners offered two broadly applicable recommendations for prospective partners to design and implement impactful programs. The first recommendation is to align and coordinate Watch for Me NC with complementary programs and planning efforts. For example, Durham partners intend to use the Watch for Me NC approach to community engagement to inform the city’s Vision Zero communications strategy. Additionally, Newton partners shared how Watch for Me NC served as a catalyst for the town’s development of its most recent pedestrian master plan. The second set of recommendations involved identifying and coordinating with partners before launching Watch for Me NC. Partners in Boone recommended working with community stakeholders to design a public engagement program that is geared for the long term. And law enforcement officers at Cape Fear Community College noted how safe driver, cyclist, and pedestrian behaviors will not be realized through one-time events or enforcement operations. Instead, Watch for Me NC partners should train officers and the public on safe and legal behaviors until these become second nature.
Toward a Narrative Theory of Watch for Me NC Campaign Development Throughout their development, Watch for Me NC programs tend to follow a “stages of change” pattern of development. When new communities apply to participate in Watch for Me NC, most of them are situated somewhere between the “contemplation” and “preparation” stages of change. That is, new
19
partners appear to weigh the myriad pros and cons of committing to program expectations, while making commitments to carry out some or all aspects of a normative Watch for Me NC program (i.e., one that includes robust, coordinated community engagement with consistent, high-visibility enforcement that is aligned with known safety issues). As these communities roll out their Watch for Me NC engagement and enforcement tactics, they enter the “action” stage of change. While here, they generally assume an “act and see” approach of experimentation. This tends to involve participating in community events, visiting area schools, and in some cases, conducting enforcement operations. Those who achieve “maintenance”—loosely defined as Watch for Me NC partners who actively participate in the program for two or more consecutive years—typically receive overwhelmingly positive feedback from elected officials and the public and have integrated Watch for Me NC into broader community initiatives, such as transportation plans, Vision Zero programs, and agency procedures.
Conclusions and Recommendations A growing body of literature suggests that multi-pronged education and enforcement initiatives such as Watch for Me NC have potential to improve pedestrian and bicycle safety. Overall, the 2017 program involved significant participation by partners in diverse communities across NC. Participants reported strong collaborations between police, schools, planning, engineering, public works, hospitals, local businesses, and others. They noted that committed partnerships, established action plans, and long-term commitment to the program and pedestrian and bicycle safety in general were keys to effectively implementing the Watch for Me NC program. Following are some key takeaways and recommendations for enhancing the program delivery at the state and local level in future years.
Partner Recruitment and Training/Capacity-Building Consistent with the lessons from prior years, having stable, strong, and committed coalitions are essential for success as the Watch for Me NC program continues to expand to new communities across the state. Municipal partners devoted significant in-kind support in the form of labor hours for project coordination meetings, enforcement operations, and community outreach. Unlike other programs, no funds were used to provide overtime pay or additional enforcement support. Limited resources and staff turnover in the partner communities’ leadership continued to hinder several communities’ progress in 2017. Continuing to use a competitive process to select high-interest partners with a demonstrated capacity to commit to the requirements of the program and a contingency plan for staff turnover may help mitigate this issue in future years. Additionally, the technical assistance, action planning workshops, and resources that will be offered to future partners may help offset the costs of participation and address common concerns, such as developing diverse coalitions to support program delivery, having a timeline to support program management and schedules, coordinating program-related communications and law enforcement efforts, and institutionalizing plans and program resources. At the state level, it is recommended that state program managers continue to form partnerships across state-level agencies and organizations—such as GHSP, DMV, Safe Kids, DPI, and others—that can support the program in various ways, including providing complementary funding or resources (e.g., supporting localized program evaluations, providing bicycles or bicycle helmets) to the local communities and enhance message delivery or enforcement activities. Regular meetings of the steering committee can provide a structure for communications, ensure accountability, and provide continuity to program activities. In interviews, most partners reinforced a desire to meet program colleagues in

20
person. They shared how they were likely to seek the assistance from people they have met in person, and that being in others’ physical company was likely to inspire more creative thinking in terms of Watch for Me NC program design and delivery. In terms of the content or focus of the law enforcement training provided, agencies continue to request information on how to improve partnerships, communications, and long-term program sustainability. To this end, future training emphasis areas could include ways to integrate the Watch for Me NC program with other initiatives, such as SRTS programs, Safe Communities and Safe Kids programs, and broader transportation and/or highway safety programs, activities, or policies. Another continuing topic of interest is in how to equitably deliver Watch for Me NC resources and law enforcement operations as well as engage traditionally underserved communities through program outreach and partnership. A novel consideration in 2017 involved exploring ways of integrating Watch for Me NC into communities’ broader Vision Zero initiatives.
Local and Statewide Outreach, Education, and Enforcement The Watch for Me NC program should continue to employ safety messages consistent with frequently occurring pedestrian and bicycle crash types in step with best practices. Regarding the Watch for Me NC’s outreach and education components in 2017, partners made good use of the print and safety materials supplied to them, and the materials worked in a variety of settings, including campuses and K-8 schools. Of all the materials provided, the bike lights and bumper stickers remained the most popular material items, but partners made use of banners, rack cards, sandwich boards for law enforcement, and the “warning ticket books” as well. To complement the existing messages regarding safe behaviors, future iterations of Watch for Me NC should incorporate norms-based messaging, such as has been done in Gainesville, FL and other locations. Should driver yielding rates continue to improve over the years, and yielding to pedestrians becomes a more normative behavior, HSRC recommends that future Watch for Me NC campaigns feature more perceived social norms-informed interventions. More specifically, such interventions could be delivered through a narrative communication framework, whereby stories feature incidents of positive behavior change (e.g., a driver becoming aware of pedestrian safety after nearly getting hit while walking). Narrative communication approaches would likely enhance the believability of Watch for Me NC’s messages, suppress counter arguing among people receiving the messages, and improve road user behavior.4 Together with pedestrian and bicycle safety education, targeted, high-visibility enforcement can significantly enhance safety. In 2017, officers reported conducting 110 operations targeting enforcement of pedestrian and/or bicycle-related laws, significantly more than in 2016. As in years past, getting all agencies to report activities consistently and in a timely manner remained a challenge and contributed to under-reporting of actual law enforcement efforts. Further, few agencies reported using high-visibility strategies, such as media engagement, in a routine way to supplement enforcement efforts and amplify the message to a broader audience. Thus, while the officer resource investment in conducting enforcement was large, the estimate of total persons impacted by the operations is likely low. In future years, enforcement agencies could be further encouraged or even required to include a
4 See: Moran, M. B., Murphy, S. T., Frank, L., & Baezconde-Garbanati, L. (2013). The Ability of Narrative
Communication to Address Health-related Social Norms. International Review of Social Research, 3(2), 131–149.

21
public information officer/communications staff in their local coalition or invite such staff to the enforcement trainings and share meetings.
Program Evaluation To supplement crash-based studies of Watch for Me NC’s safety-related impacts, we recommend continued monitoring of public knowledge and perceptions through the use of randomized phone surveys. If repeated in the future using the same methodology, the survey data gathered back in 2015 can serve as a baseline from which we can continue measurement of the impact of Watch for Me NC on communities’ knowledge of laws and perceptions of road user behaviors. In isolation, the 2015 results are limited in their ability to estimate the program’s effectiveness and whether it has produced differential effects among Watch for Me-participating communities. Further, as the funds for media purchases, print materials, and safety materials decrease annually while the program continues to stretch those items across wider geographic coverage and more partner communities, it is unclear whether the educational messages and ad buys are sufficiently saturating targeted populations. Ideally, we would use the 2015 survey results as a baseline from which to examine trends both within and between Watch for Me-engaged and non-participating regions over time. Further, if additional resources exist, we recommend estimating mixed effects regression models to predict various outcomes of interest while accounting for other potential factors affecting responses. These mixed effects models would examine so-called “fixed effects,” such as respondents’ age and income, as well as the “random effects” of the towns that respondents live in to control for differences among respondents based upon where they live—e.g., town-based “cultural effects.” Field observations of key behaviors, such as driver yielding, remain an important complement to crash-based and survey-based evaluation measures to see if behaviors are changing. However, as more communities participate year round, the opportunities for before-after study designs diminish and more sophisticated approaches may be needed. Further, as the program grows, HSRC’s central management of the data collection process to monitor driver yielding changes becomes more challenging and resource-intensive. Additional technical support, such as training and the provision of brief surveys that could be used locally, might motivate communities to take a more active role in local program evaluation. Having more data at the local level could also be helpful in evaluating the program statewide and in providing evidence to support decision-making regarding future Watch for Me NC program needs, such as message development or refinement. As more communities incorporate elements of the Watch for Me NC program into their suite of interventions, it would benefit everyone to understand what works, why it works, and under what conditions it is most likely to work. Evaluations like these, which consider people’s travel-related behaviors, attitudes, beliefs, and perceptions will get us closer to such an understanding.