Embed Size (px)
Citation preview

AGENCY FOR INTERNATIONAL DVELOPMENT IOR AID USE ONLY
WASINGTON D C 20318
BIBLIOGRAPHIC INPUT SHEET A PNIMARY
1 SUBJECT Development and economics DA00-0000G800 rLA$SI-
FICATION a $FtalAIRY
General--Southeast Asia 2 TITLE AND SUBTITLEEconomic interdependence inSoutheast Asiafinal report
3 AUTHOR(S)
(101) Wis Univ Deptof Economics
4 DOCUMENT DATE I5 NUMBER OF PAGES I6 ARC NUMBER 1970 1 ApRC
7 REFERENCE ORGANIZATION NAME AND ADDRESSWis
0 SUPPLEMENTARY NOTES (SponseoIng Organlatlons Publiahera A valabilfy)
Research summary)
9 ABSTRACT
0 CONTROL NUMBER 1ItPRICE OF DOCUMENT
12 -DESC RIP TO RS 1 P O E T N M ECooperation II PROJECT NUMBER
Economic developnment 14 CONTRACT NUMBER Re 4onal planning CSD-355 ResSoutheast Asia isTYPE OF DOCUMENT
AID 3390-1 4-741
ECONOMIC INTERDEPENDENCE
IN SOUTHEAST ASIA
FINAL REPORT
The University of Wisconsin
AID Research Program
(Contract csd3565)
March 17 1970
Preface
In the spring of 1963 before Southeast Asia became so conspicuous
a problem of foreign policy as it later became the Agency for International
Development invited a number of US universities to consider the possibility of basic research on economic development in Southeast Asia and on economic
cooperation within the region AID also sought to encourage a rapid inshycrease in the number of American and Asian economists doing research in the field Eleven universities submitted proposals two were invited in final competition to revise and resubmit their proposals A contract was signed with the University of Wisconsin on March 23 1964 With extensions the
contract continued through 1967 and editing and publication work under the
contract has continued into 1970
The University of Wisconsin already had on its stdff a number of economists who had held teaching research or advisory roles in Southeast Asia and whose interest in that region was continued in their research and
teaching in the United States The University accepted the contract because of the promise of its fitting with mutual support into regular programs
of teaching research and exchanges both with respect to economic developshy
ment generally and Southeast Asia in particular
The University was disposed toward a broad framework in definition of the region and conceptually including basic issues of development
regional cooperation and planning within which to place the specific issues
of economic interdependence in Southeast Asia
The operation plan of the Contract was set out in Appendix B A - To ascertain as accurately as possible the nature and extent of
benefits that might accrue to certain South and Southeast Asian countries through increased economic co-operation
B - To stimulate research by qualified researchers both in the United States and in the Asian countries in the field of regional economic co-operation
C - To hold such meetings as necessary including working conferences in the United States and Asia to discuss and criticize research in progress and
D -To appraise AID by written reports of the political aspects of its analysis and to advise AID by written reports on the best way to use its resources to attain alternative policy objectives
2
The Contract projection of the research to be done was more indicative than specific Wisconsin agreed to use its best effort
a - To evaluate the economic advantage to countries of the region from economic co-operation and co-ordination
b - To assess the theory and experience of ecoyiomic growth and of common market and free trade association ventures and other forms of economic co-operation as compared with Southeast Asian possibilities
c -To assess the extent to which national plans have implications or specifications with respect to economic integration in the areaand the extent to which success or failures in implementationhave had any systematic relation to regional economic interest
d - To indicate future AID strategy with respect to regional economic co-operation In this camptegory Contractor shall advise AID what policiesof AID can most effectively encourage the economic co-operation measures that best serve the interests of the region
Most of the research done under this contract has gone into 62 papers
including 5 longer and summary studies The majority have been circulated to
AID or have been incorporated in a book published in 1969 by the University of Wisconsin Press Economic Interdependence in Southeast Asia The material
in this Report does not in general duplicate the basic papers though it often draws on them This Report attempts to meet more narrowly and specishy
fically the questions posed by the Contract summaries and conclusions
depend in part on material not reproduced here
The 42 people listed below have been authors in part or wholly of one or more of the Project papers (For those not now (March 1970)
at the University of Wisconsin we have put down the institution with which
they are connected) Among them Professors Everett D Hawkins Seiji
Naya Nyle Spoelstra K C Sen and Mrs Fag el Nour have been especially
close to the Project Professor Hawkins was in touch with the work from
the beginning contributed throughout and was for a time Director of
Research He has been a most helpful critic of this Report Professor Spoelstra
carried much of the administrative and editing burden during the whole Contract
period
Bernhard Abrahamsson Benjamin Higgins (Univ of Denver) (Univ of Montreal)
3
Dorra Alwan Harley Hinricks (Univ of Maryland) (Univ of Maryland)
Robert E Baldwin Kai-Loo Huang (Moravian College)
AN Bhagat (UN Econ Yune Huntrakoon (Bank of Com for Africa) Thailand)
Angela Bilkey Nurul Islam (Pakistan Inst of
Amado Castro (Univ of the Development Economics) Philippines)
KR Chou (Nan Yang Univ)
HNS Karunatilake (Central Bank of Ceylon)
PT Ellsworth (Univ of Allen C Kelley
California Riverside) Hiroshi Kitamura (UN Econ Com Naval Fag El Nour (American
for Asia and the Far East)
University Cairo) DT Lakdawala (Univ of Bombay)
Everett D Hawkins Robert J Lampman
Lim Chong Yah (Univ of JC Leith (Univ of Western Singapore) Ontario)
Theodore Morgan DV Ramana (Asian Inst for
Hla Myint (London School of Economics)
Econ Devel and Planning)
Stephen E Reynolds (Univ of
Seiji Naya (National Bureau of Utah)
Econ Research Univ of John Richards Hawaii)
Kenichi Odawara KC Sen (Asian Development Bank)
(Sophia University Tokyo) IM Singh (Ohio State University)
J PanglAykim (Australian National Univ)
I-Shuan Sun (Central Bank of China)
Douglas S Paauw (National Planning Association Washington)
Nyle Spoelstra (Nat Inst of Devel Administration Bangkok)
RH Patil (Univ of Bombay) Anthony Tang (Vanderbilt Univ)
4
John Power (Univ of the Kenneth D Thomas (La Trobe Philippines) Univ Melbourne)
Jeffrey G Williamson
Ta-Yeh Wu (UN Econ Devel Board Singapore)
Suparb Yossundara (Bank of Thailand)
The following 44 people have served as consultants to the research program being one or several days at Madison and holding formal and informal meetings with the research group and usually speaking at a Workshop
Herbert Grubel (Univ of Pennsylvania) Gottfried Haberler (Harvard University) Robert Z Aliber (Univ of Chicago) W M Corden (Oxford Univ)Ronald McKinnon (Stanford Univ) Guy Black (Council of Economic Advisers
WashingtonDC)Irma Adelman (Northwestern Univ) Adam Marton (Budapest Hungary) W Arthur Lewis (Princeton Univ) Clair Wilcox (Swarthmore College)Pan A Yotopoulos (Stanford Univ) D A Snider (Miami Univ) Hollis B Chenery (Harvard Univ) Lloyd J Reynolds (Yale Univ) Richard E Caves (Harvard Univ)Arthur T Mosher (Econ Devel Council
New York)Hla Myint (London School of Econ) Frank H Golay (Cornell Univ)Gerhard Tintner (Univ Calif Los Angeles) Kang Chao (Univ of Wisconsin)Nathan Keyfitz (Univ of Chicago)Emile Despres (Stanford Univ) Clifton R Wharton Jr (Michigan State Univ) Gustav F Papanek (Harvard Univ)Lauchlin Currie (National Univ of Columbia) Edward Fei (Agency for Int Devel
Washington D C)Richard Goode (Int Monetary Fund
Washington D C)Benjamin Higgins (Univ of Montreal) G Sicat (Univ of the Philippines)Douglas Fontein (Int Bank for Recon and Devel) J Strasma (Univ of Wisconsin)
5
A Ravenholt (Amer Univ Field Service Manila) Bela Balassa (Johns Hopkins Univ and IBRD) HK Mazumdar (Indian Statistical Institute Calcutta) Robert R Nathan (Nathan Associses Washington DC) Reed Irvine (Federal Rcmerve Board Washington DC) Julian H Singman (Washington DC) Lloyd I Rudolph (Univ of Chicago) George Dalton (Northwestern Univ) CH Thompson (Int Bank for Rec and Devel) Stephen Enke (Dept of Defense Washington DC) John H Power (University of the Philippines) Harry G Johnson (Univ of Chicago and London School
of Economics) I Robert Sinai (New York Univ)
A conference on Economic Interdependence in Southeast Asia was held at
Bangkok at Sala Santithan (ECAFE) in January 1967 Contributors are listed
in the first group above
The views presented here are of course personal ones and do not necesshy
sarily reflect those of the United States Agency for International Development
the University of Wisconsin or the other organizations with which various
contributors are or have been associated
Theodore Morgen Director of Research
University of Wisconsin
March 17 1970
6
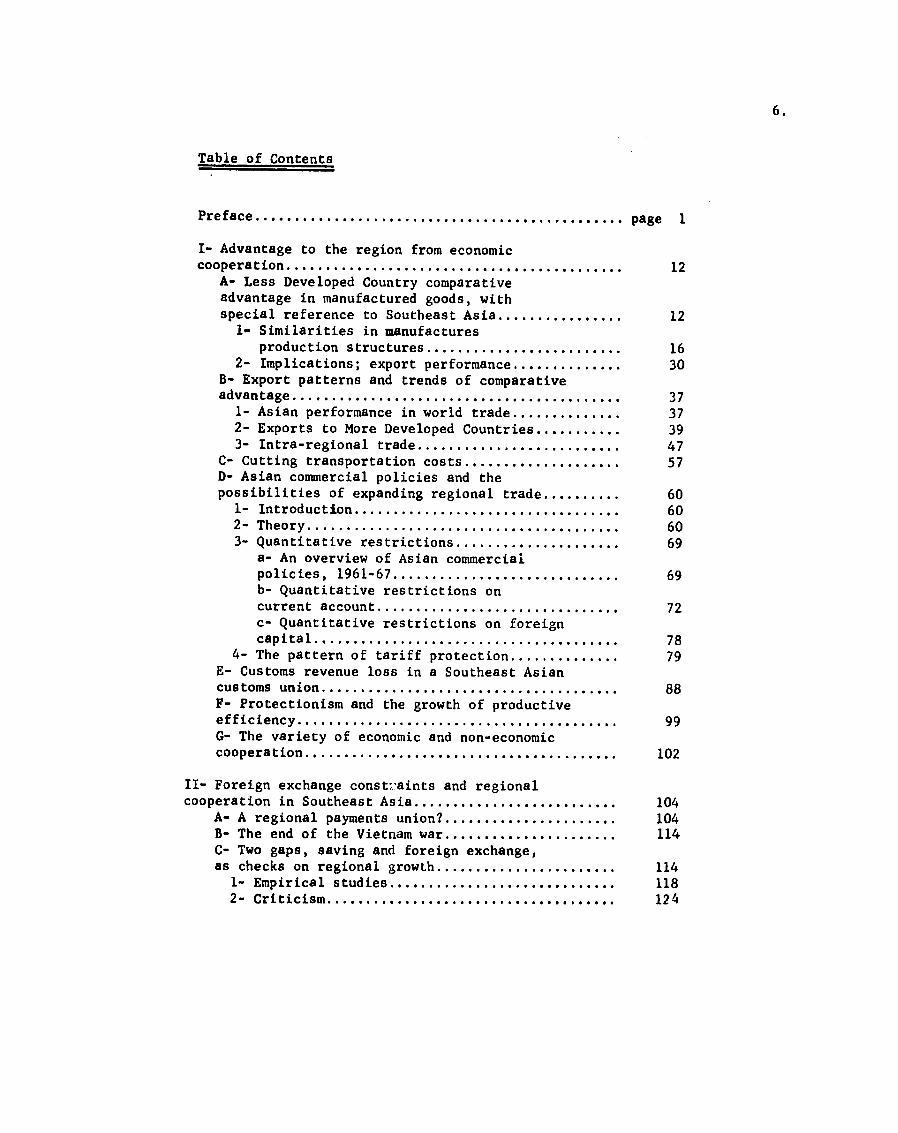
Table of Contents
Preface page 1
I- Advantage to the region from economic cooperation 12
A- Less Developed Country comparative advantage in manufactured goods with special reference to Southeast Asia 12 I- Similarities in manufactures
B- Export patterns and trends of comparative
D- Asian commercial policies and the
a- An overview of Asian commercial
b- Quantitative restrictions on
c- Quantitative restrictions on foreign
E- Customs revenue loss in a Southeast Asian
F- Protectionism and the growth of productive
G- The variety of economic and non-economic
production structures 16 2- Implications export performance 30
advantage 37 1- Asian performance in world trade 37 2- Exports to More Developed Countries 39 3- Intra-regional trade 47
C- Cutting transportation costs 57
possibilities of expanding regional trade 60 1- Introduction 60 2- Theory 60 3- Quantitative restrictions 69
policies 1961-67 69
current account 72
capital 78 4- The pattern of tariff protection 79
customs union 88
efficiency 99
cooperation 102
II- Foreign exchange const7aints and regional cooperation in Southeast Asia 104
A- A regional payments union
C- Two gaps saving and foreign exchange
104 B- The end of the Vietnam war 114
as checks on regional growth 114 1- Empirical studies 118 2- Criticism 124
7
III- Major cautions on the statistics 126
3- Effect of adjusting trade data by the
B- Inaccuracies and misleading concepts in
2- Misleading categories for LDC growth
pageA- Inaccuracies in Southeast Asia trade data 126
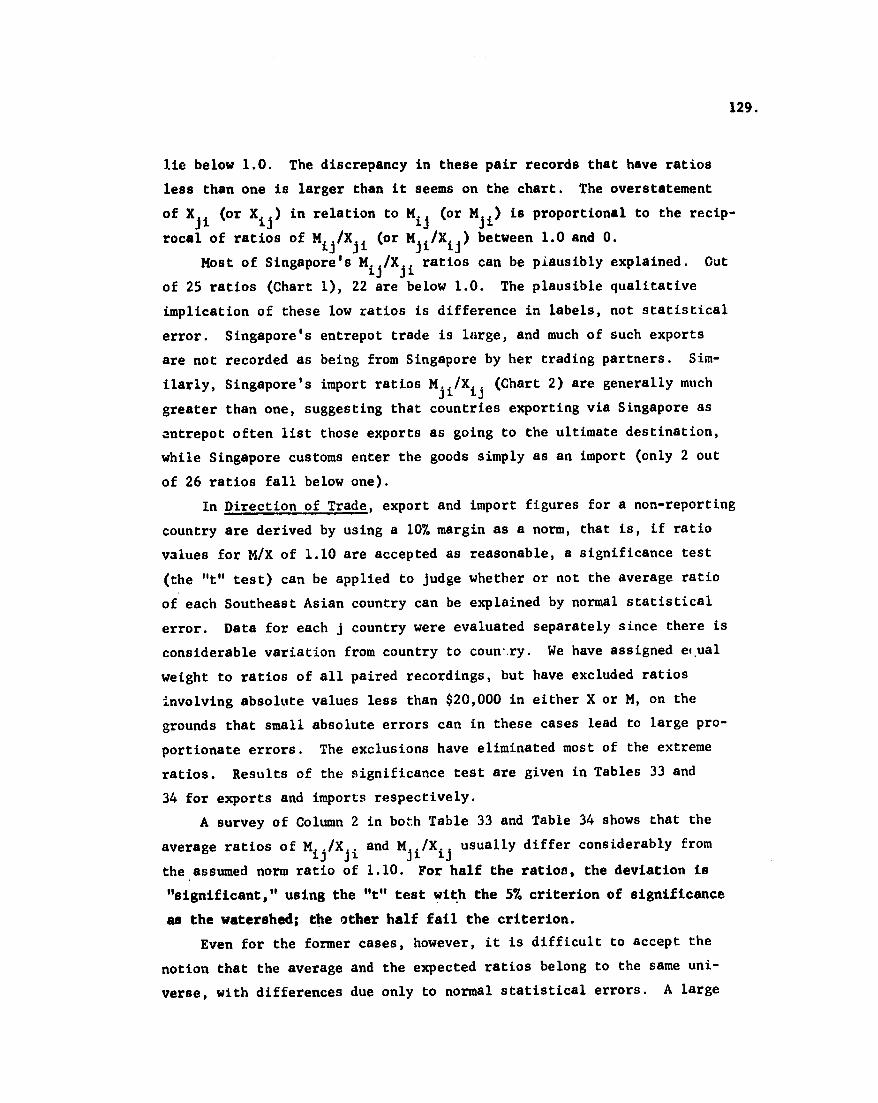
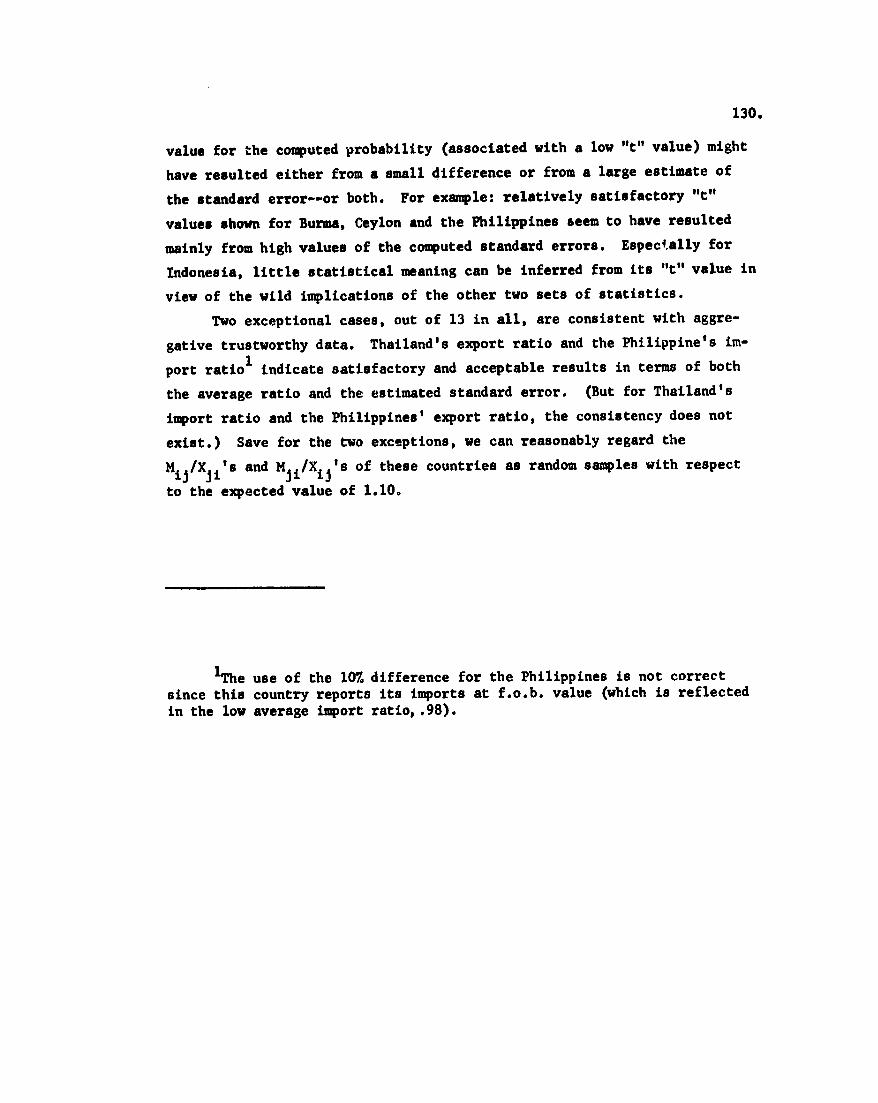
- The problem procedure 126 2- The errors 128
exchange rate 137 4- Commodity trade statistics in detail 140 5- Concluding comment 142
the standard national income statistics 144 1- Errors in LDC social accounts 144
analysis 146
IV- National plans and regional integration in Southeast Asia 150
A- Planning patterns
D- Spill-overs Plan Harmonization and
150 I- Two directions of policy in LDCs 151 2- Two patterns of growth in Southeast Asia 152 3- A recent trend 153
B- Planning in five countries a summary 154 1- Indonesia 155 2- Thailand 156 3- Singapore 158 4- The Philippines 159 5- Malaysia 159
C- Multiple objectives 161 1- Ditficulties as seen by the planners 161 2- The purposes of planning 162
bilateral agreements 164 1- The spill-over effect 164 2- The regional harmonization proposal 165 3 - Bilateral agreements 169
E- Some conclusions 170
V- Regional cooperation in Southeast Asia--forms policy 172
- Degree of formality and government A- Taxonomy 172
commitment 172 2- Cooperation within the region only 175 3- Other categories 175
B- The political hurdles 176 C- Guidlines for policy 177
VI- Summary policy implications 179
Appendix Research papers written in the Project 188
8
Tables
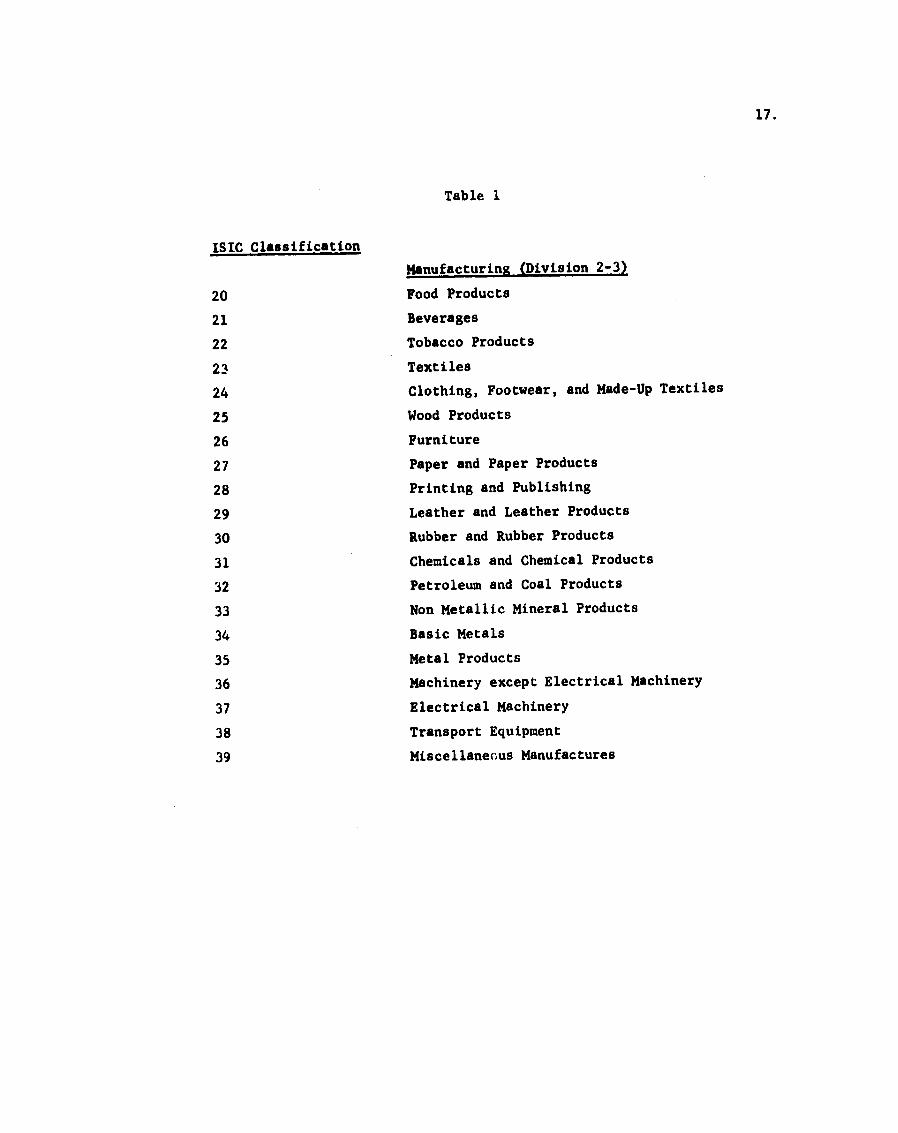
1 - ISIC classification 17
2 - Indices of value-added per employee wages and salaries per employee and non-wage valueshyadded per employee for manufactures in selected Southeast Asian Countries (ISIC 2-3 = 100) 1963 18
3 - Consistency in value-added by industries in Asia 20
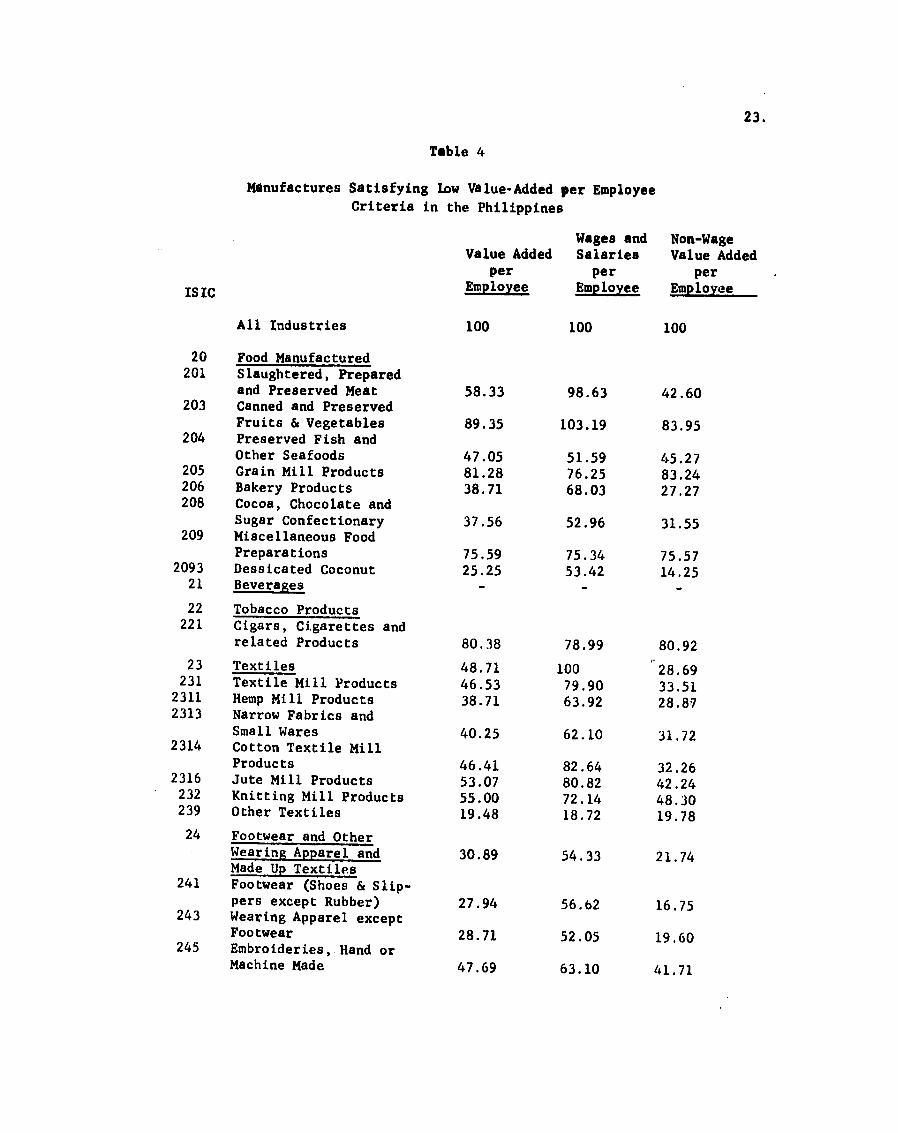
4 - Manufactures satisfying low value added peremployee criteria in the Philippines 23
5 - Manufactures satisfying low value added per employee criteria in the States of Malaysia 27
6 - Export performance of nine Asian Countries 1962-65 32
7 - Manufactured exports of dynamic character for selected Southeast Asian Countries 35
8 - Export directions by regions 38
9 - The compositional and competitive effects of exports to more developed countries by Asian Countries - averages of 1956-57 and 1964-65 41
10 - The composition and competitive effect of exports of Asian Countries by commodity groups averages of 1956-57 (I) and 1964-65 (II) in percentages 44
11 - Export growth and shares of intra-regional exports averages of 1956-57 and 1964-65 48
12 - Commodity composition of total and intra-regional exports of selected Asian Countries 1962 and 1965 50
13 - Commodity composition of total and intra-regional imports of selected Asian Countries 1962 and 1965 51
14 - Competitive and compositional effects of intra-Asian Trade by country 1962-65 53
15 - The compositional and competitive effects of less developed Asias export to more developed areas 1956-57 to 1964-65 56
16 - Asian commercial policies 70
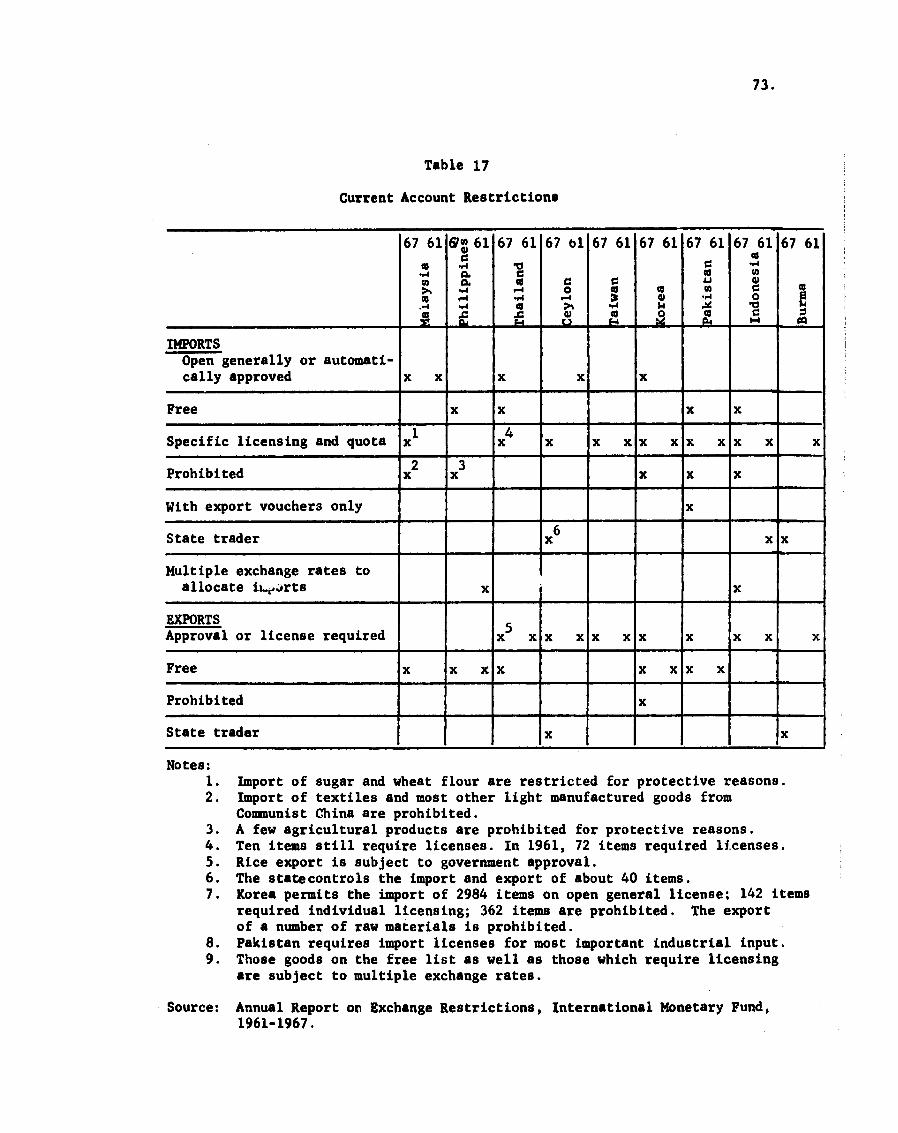
17 - Current account restrictions 73
9
18 - Significant changes in current account policy 74
19 - Restrictions on current account 76
20 shy Tariffs-Major categories 82
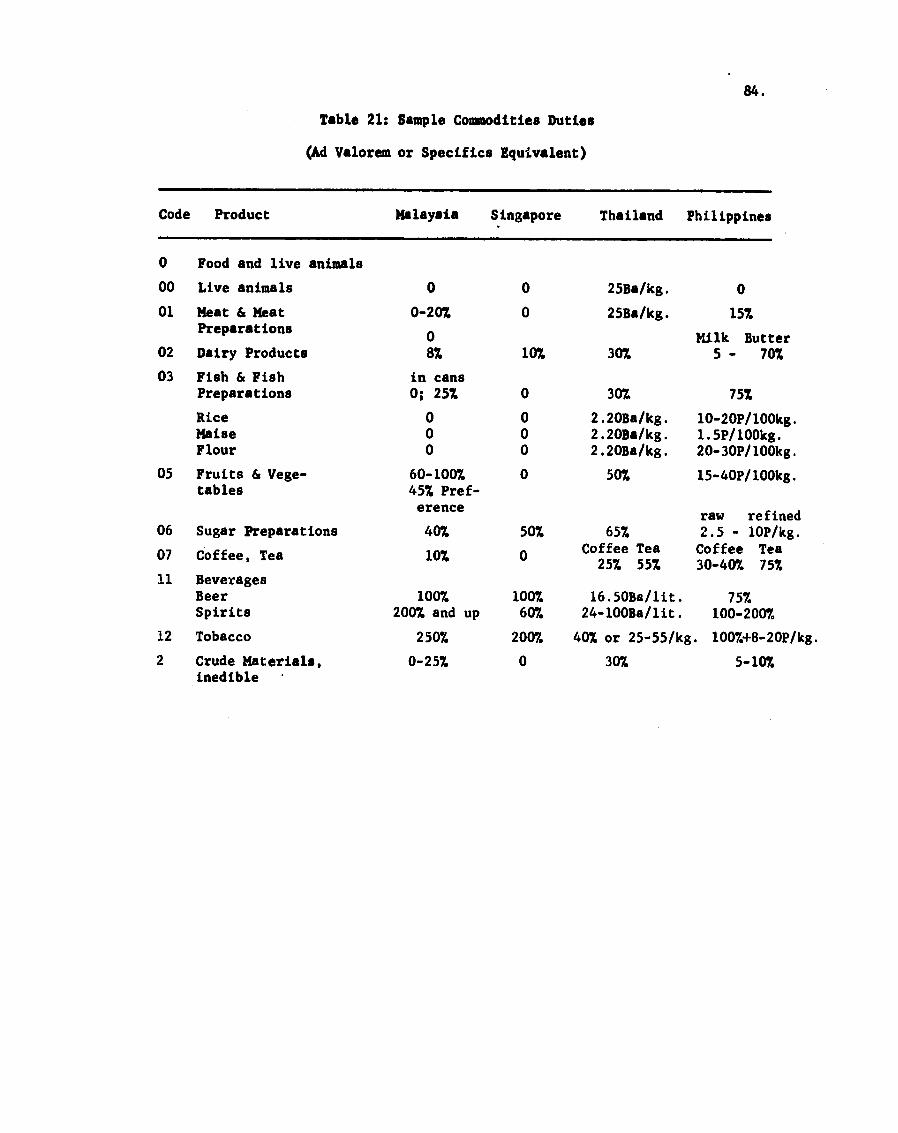
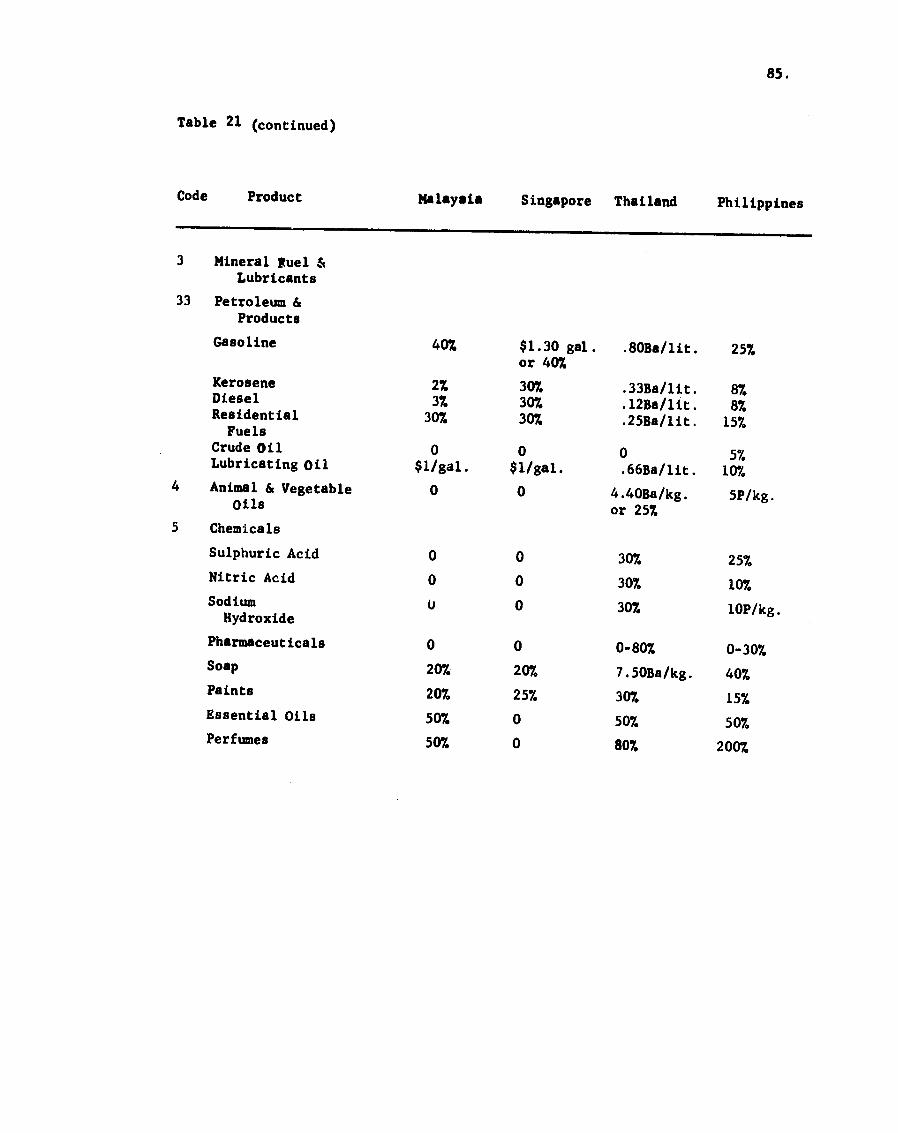
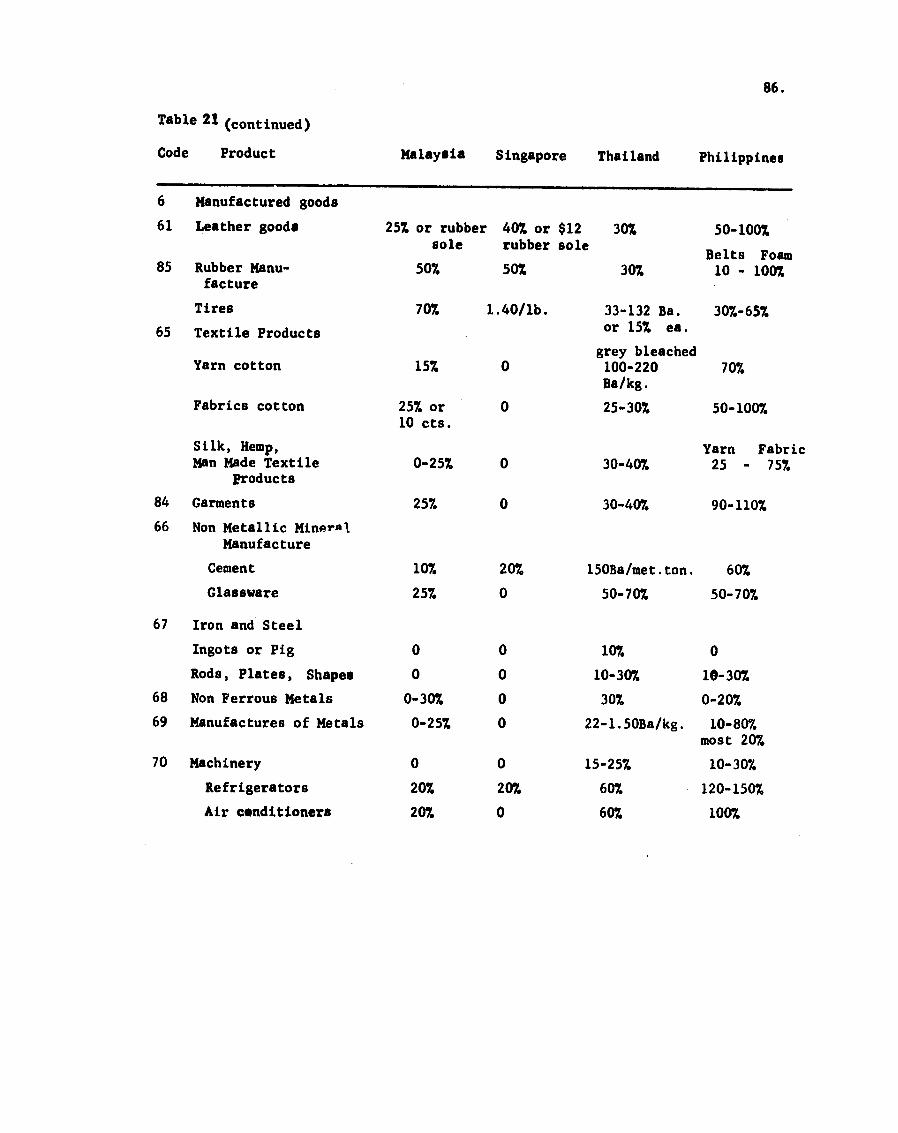
21 - Sample commodities duties (Ad valorem or specifices equivalent) 84
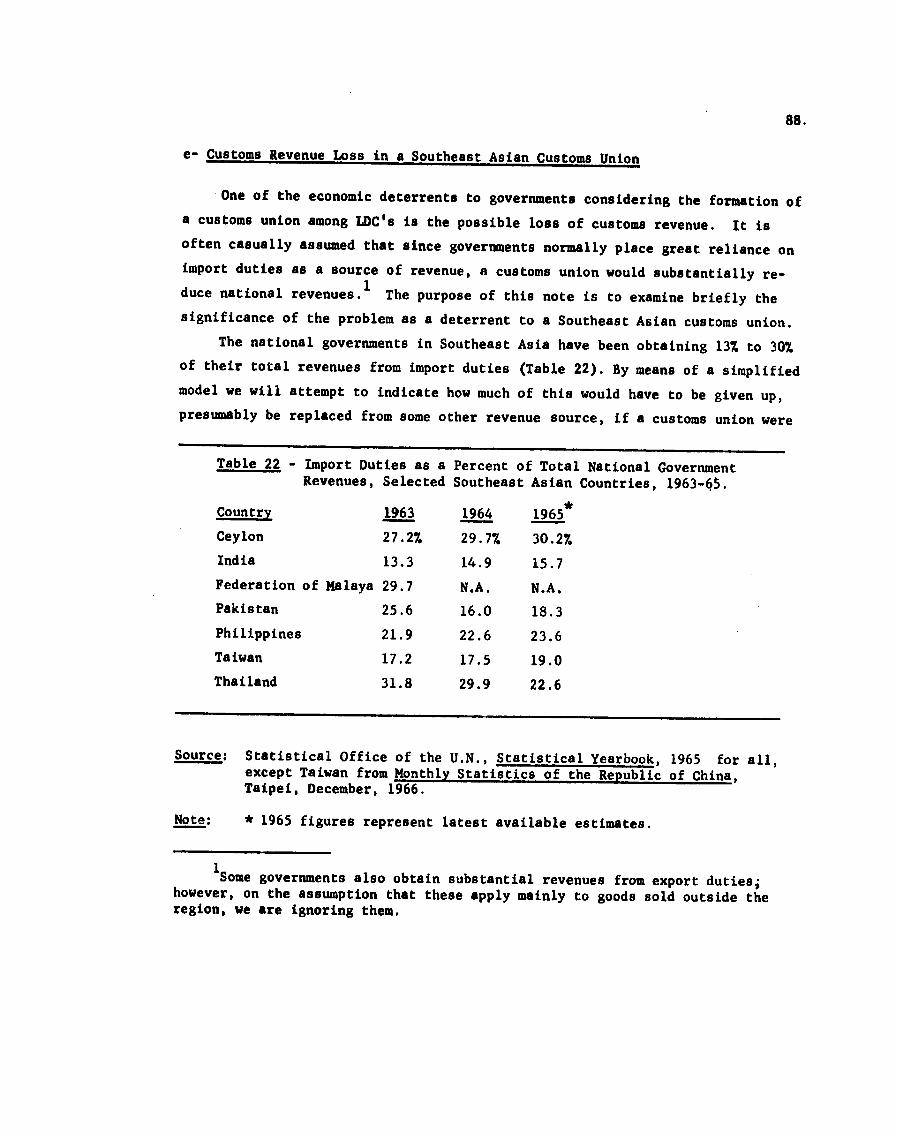
22 - Import duties as a percent of total national government revenues selected Southeast Asian countries 1963-65 88
23 - Hypothetical calculations of revenue losses 93
24 - Federation of Malaysia revenues of Federal and State governments 94
25 - Malaysia revenue collected on imports from Two Partner Countries 1963 96
26 - Potential revenue loss 98
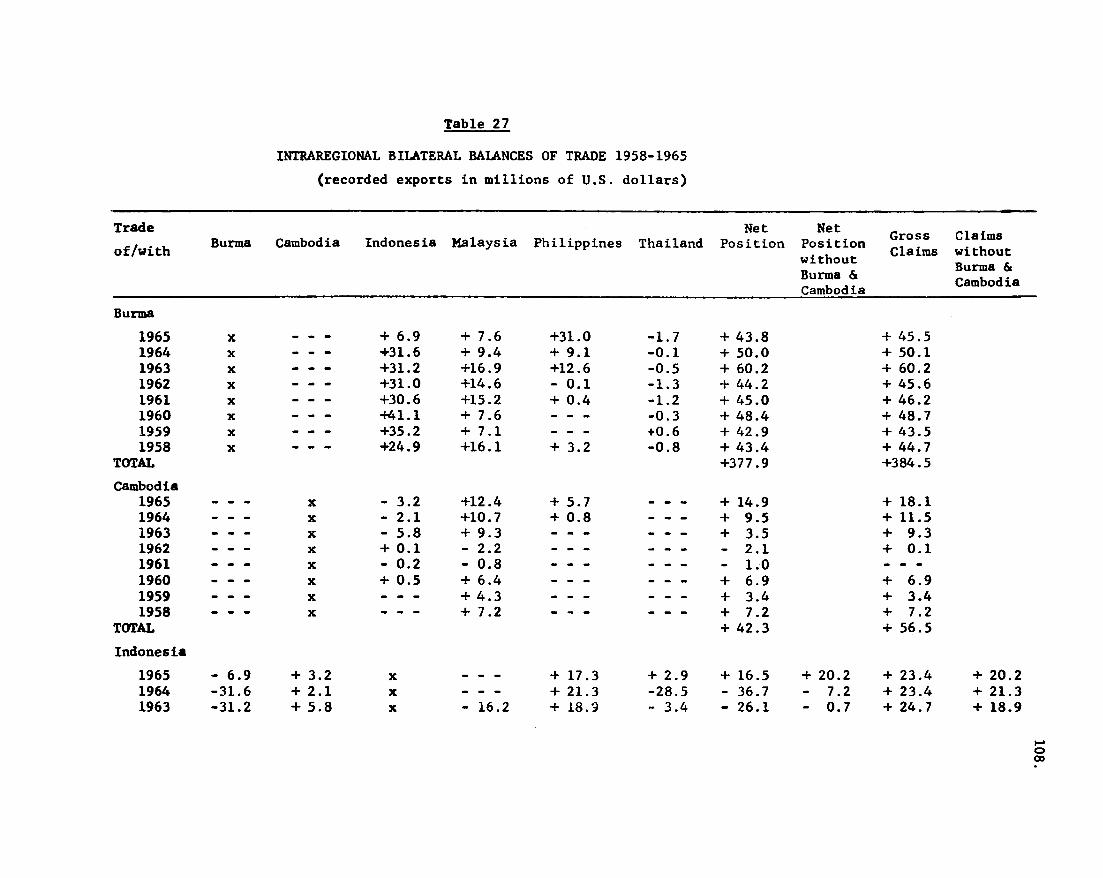
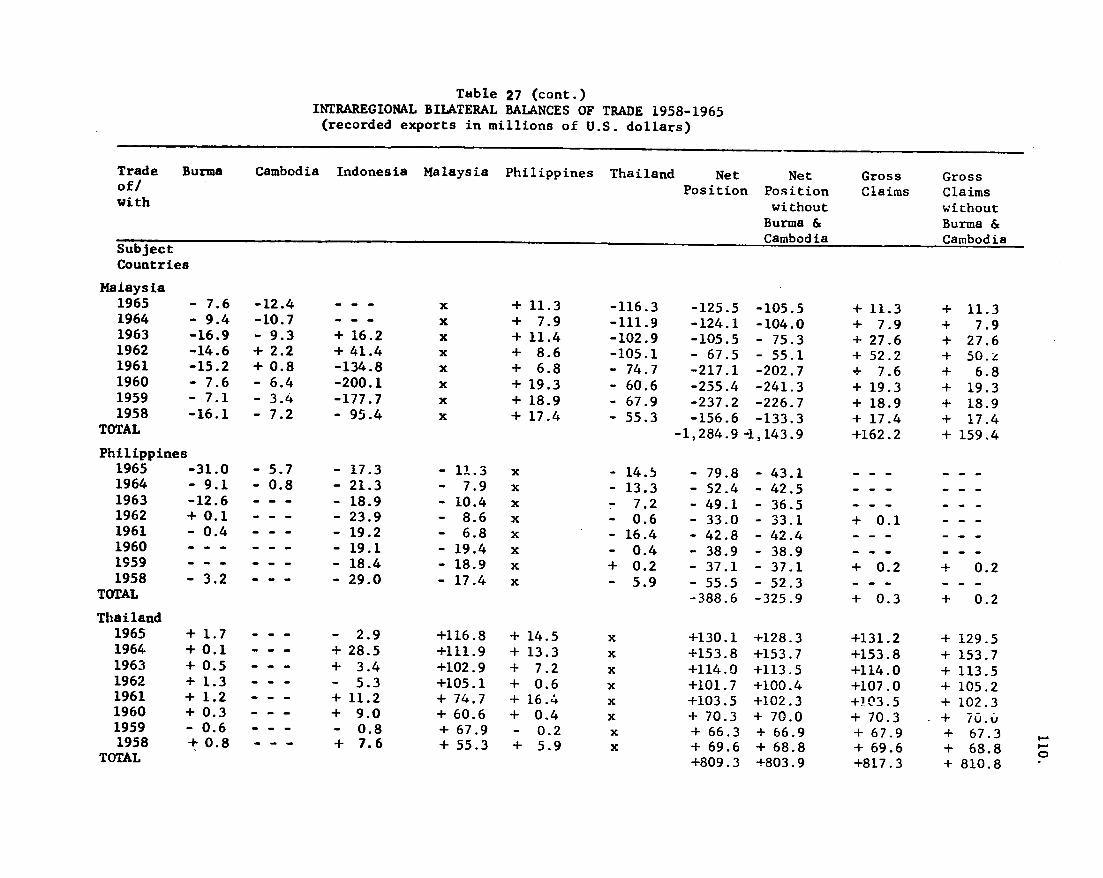
27 - Intraregional bilateral balances of trade 1958-65 108
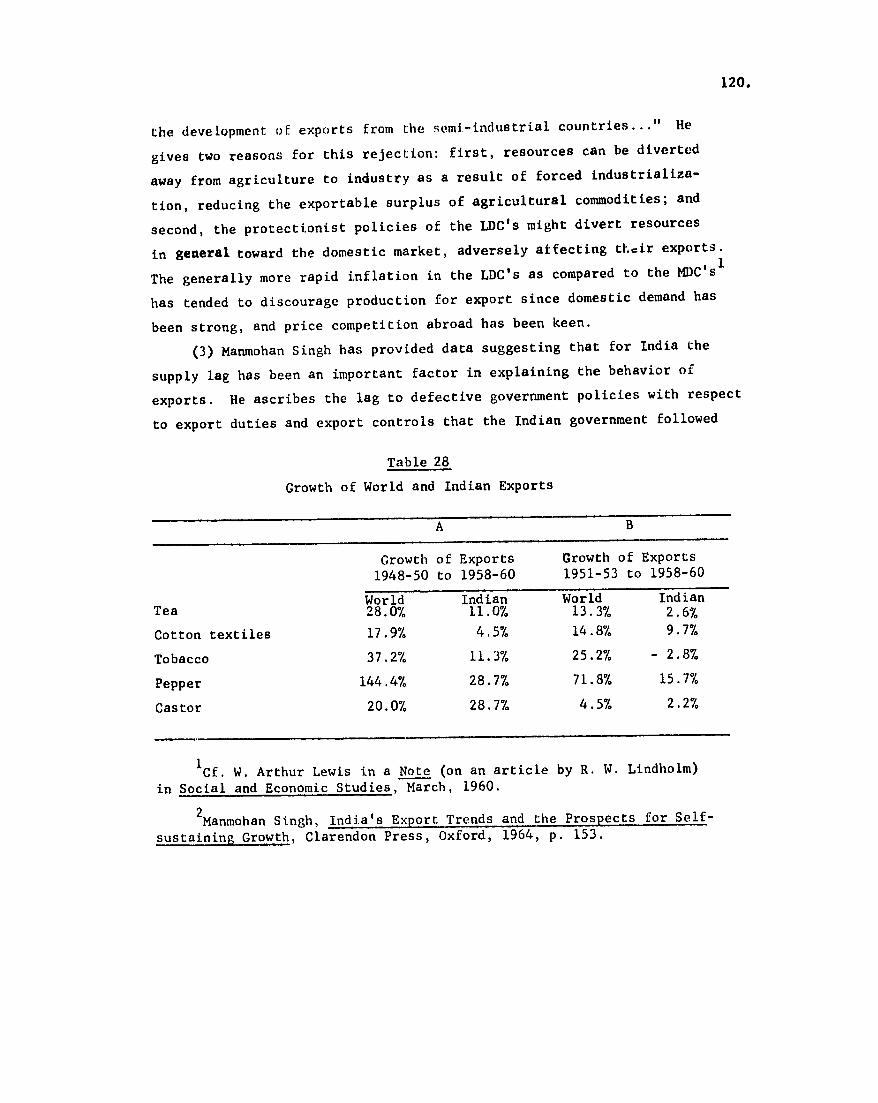
28 - Growth of world and Indian exports 120
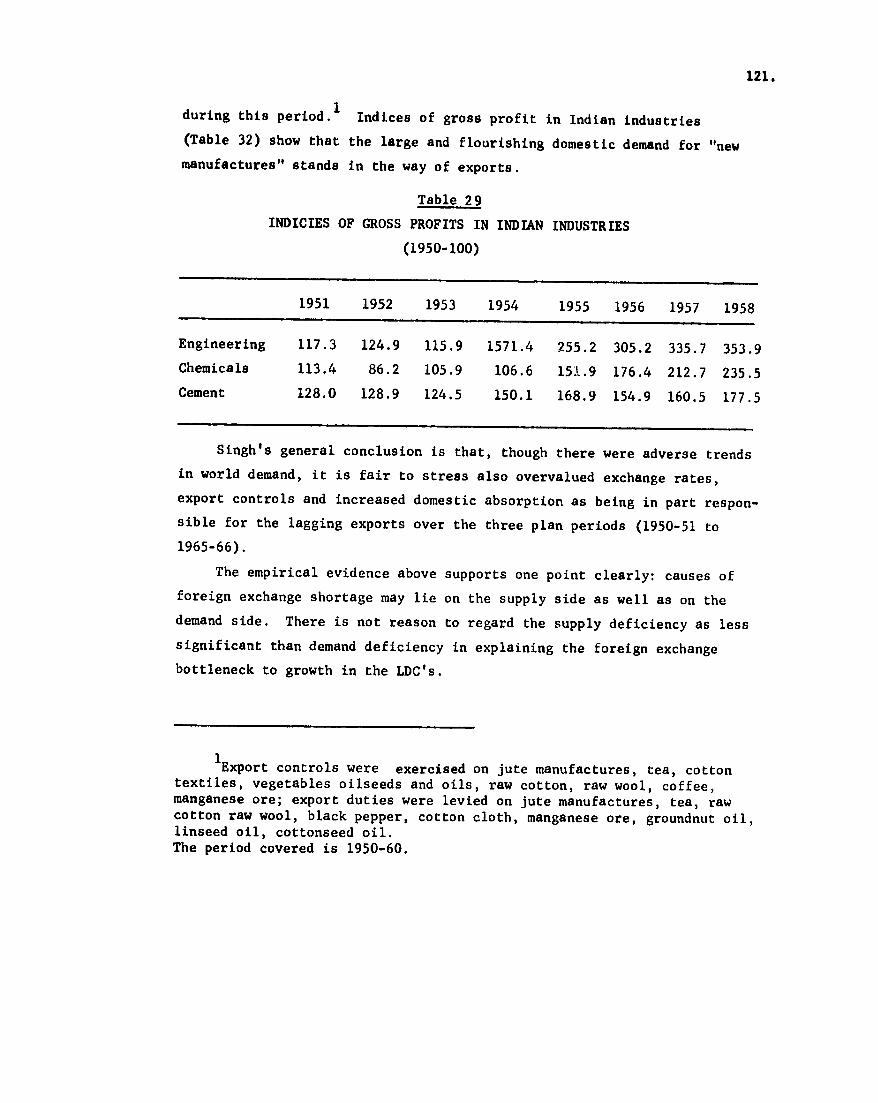
29 - Indicies of gross profits in Indian industries (1950-100) 121
30 - A zest of average export ratios (MiX i) assuming ar expected value of 1 10ij 133
31 - A test of average import ratios (MX) assuming an exrected value of 11031 133
32 - A test on variability of export and import ratios of Southeast Asian countries with Asian and more developed country partners 136
33 - The averages of export and import ratios standard deviations and coefficients of varishyations on the basis of adjusted data 139
34 - Philippine export ratios and import ratios by commodities with the four largest and with all Partner Countries 141
10
Charts
1 - Ratio of trading partners imports from Southeast Asian Countries to corresponding exports of Southeast Asian countries 131
2 - Ratio of Southeast Asian countries imports to corresponding exports of trading partners 132
ECONOMIC INTERDEPENDENCE IN SOUTHEAST ASIA
12
I - Advantage to the Region from Economic Cooperation
One purpose of the Contract was to evaluate the economic advantage
(or disadvantage) to the region from economic cooperation and coordination
(Appendix B pp B 1-2) Our response to this injunction is given below
under seven headings A to G
A - Less Developed Country (LDC) Comparative Advantage in Manufactured
Goods with Special Reference to Southeast Asia
A basic point underlying any discussion of development policies of
LDCs is the fact that although international trade may not be serving as an engine of growth it cannot be disregarded The degree of dependence of
LDCs on international trade has been and still is typically high In
many cases exports of these countries constitute more than 15 percent
of their national income and 50 percent or more of their export earnings
is derived from one or two commodities Recurrent discussions have emanated
from the United Nations and other sources relating to the present and future
prospects of a large trade gap for less developed countries These discusshy
sions run in terms of a growing need for foreign exchange by the LDCs to
meet their economic development programs Such foreign exchange needs are
presumably to be met by exports of their traditional primary commodities
or by expanding their recent venture into trade in manufactured goods
Trade projections of prospects of world demand and potentialities
for expanding exports of traditional primary commodities conducted by the
FAO the ECAFE and others reflect very modest rates of increase over the coming decades It thus becomes of great importance for LDCs to expand
their exports of manufactured goods
To the advantage of LDCls recent trends in international trade
point to a tendency toward convergence in world specialization and exchange
Contrary to the long established dichotomy in world production and trade
between predominantly primary goods production and export by less developed
countries and manufactured goods production and export by developed
countries recent trends indicate more diverse specialization patterns
The export of manufactures by LDCs though still much concentrated in origin and destination has also Xecently exhibited high rates of growth
Despite the difficulties inherent in attempts to generalize on production possibilities for various countries including the LDCs1
various attempts have been made to assess the implications of recent developments in world trade as an indication of the possibility of the LDCs developing a comparative advantage in the production of certain manufactured goods If one is to generalize broadly on the LDC comparashytive advantage area within manufactures one must choose for both logical and empirical reasons the area of relatively low skill-labor intensive2
manufactures This gives rise to the need to apply soue theoretically sound and workable criteria for the delineation of some manufactures potentially successful for LDCs specialization and trade The choice of any such criteria would to a large extent be influenced by the nature of
the data available for LDCs
The analysis of LDCs prospective comparative advantage in the production of certain manufactured commodities thus starts with the basic assumption that the LDCs have relatively little accumulated capital in either conventional or human-skills form Hence any comparative advantage they may have in manufactures apart from the resource oriented ones arises from their abundant labor The implication then is to specialize in the prcduction of those industries with a strong labor orientation defined to incorporate low capital requirements in the forms both of plant
and eqlpment and of education and training (human capital)3
1Particularly the presence of nonmonetized sector and the rigiditiesin the structure of their economies impeding factor mobility
2The importance of the availability of different levels of laborskills as the major factor explaining the patterns of international location and trade is emphasized by Donald B Keesing Labor Skillsand International Trade Evaluating Many Trade Flows with a Single Measurshying Device Review of Economics and Statistics (August 1965) pp 287-293
3Hal B Lary Imports of Manufactures from Less Developed CountriesNational Bureau of Economic Research New York 1968 p 4
14
Criteria satisfying this definition which can be applied to some
Southeast Asian countries data on manufactures were utilized by Professor
Hal B Lary 1 in a study at the National Bureau of Economic Research The
criteria were based on the ranking of industries with respect to the two
major components of value added per employee the wages and salaries per
employee (representing the labor component2) and the non-wage value added
per employee (representing the returns to factors other than labor interest
rentpprofits and depreciation allowances) The criteria thus allow for
the incorporation of human capital into the analysis a matter of first
importance In addition the criteria have the essential merit of feasishy
bility since data on value added employment and wages and salaries are
likely to be available for a large number of countries The difficulty of
incorporating natural resources as a direct factor of production is partly
assumed away since the study focuses on identifying labor intensive manushy
factures and omits primary products from the analysis There are a number
of labor intensive manufactures however which are also highly resource
oriented Their consideration for specialization purposes would thus
vary between individual countries depending upon the degree in which their
production requires specific natural resources versus low skill labor3
It should be noted however that such resource4 oriented products some
of which mainly undergo simple processing operations contribute signifishy
cantly to manufacturing output and are instrumental in explaining the
pattern of exports of LDCs
1lbid pp 21-22
2The validity of using the wages and salaries and the nonwage componshyents of value added per employee as indications of relative skill and capital requirements was supported by finding significant relations across industries between the wages component and other measures of skill mainly occupational and educational indices and between the remaining component and stocks of physical capital
3Ibid p 14
4Ibid pp 48-50
15
The entire analysis rests on the factor proportions theory with its underlying assumption of the comparability of the factor intensities for different countries It aloo assumes the possibility of approximating empirically to the Heckcher-Ohlin version of the theory of comparative advantage and the nonexistence or at least the practical irrelevance
of factor intensity reversal1
Because of the importance of the assumptions underlying the factor proportions theory in the specification of those manufactures potentially profitable for LDCs further research was undertaken in the NBER study on those points Comparison of value added per employee and its components for nine countries2 over the thirteen industry groups appearing in the UN The Growth of World Industry3 indicated a high degree of conformity as measured by Kendalls coefficient of concordance Thus based on the analysis of value added and its components for array of US iniustries the study pointed that the LDCs should have comparative advantage in manufactures which have (1) a low level of value added per employee and (2) low levels of both components of value added wages and salaries per employee and other remaining components These manufactures were found to be textiles and clothing wood products furniture leather products miscellaneous manufactures and a number of special manufactures in other
1Some qualifications result from studies by W Leontief Domestic Production and Foreign Trade The American Capital Position ReexaminedProceedings of the American Philosophical Society Sept 1953 In a secondarticle however Leontief put more emphasis on the skill requirements forthe different industries--a factor which is excluded in analysis based on examination of stocks of physical capital and man hours of labor W Leontief Factor Proportions and the Structure of American Trade Further Theoretical and Empirical Analysis Review of Economics and StatisticsNovember 1956 It should also be noted that in one of the calculations inwhich Leontief excluded natural resource sectors the paradox disappearedthe US was found to export more capital intensive products
BS Minhas The Homohypallagic Production Function Factor IntensityReversal and the H-O Theorem Journal of Political Economy April 1962Hinhas introduces the CES production function which permits the occurrenceof factor intensity reversal and points to the existence of some factor reversals Leontief however conducted more extensive tests and confirmed the empirical irrelevance of factor reversal W Leontief International Factor Costs and Factor Use AER June 1964
2United States Canada Australia Sweden United Kingdom BrazilJapan Mexico and India Lary opcit p 71
3United Nations TheGrowth of World Industry 1936-1961 National Tables (United Nations 1963)
16 1
major groups
1 Similarities in Manufactures Production Structure
Applying the criteria based on analysis of value added per employee to
data on manufactures for selected Southeast Asian countries yields results
generally in agreement with the NBER study findings Detailed analysis of
individual groups of manufactures however indicates somewhat wider possibilshy
ities for specialization
In general as shown in Table 2 there was much similarity in the rankshy
ings of the different manufacturing groups for the countries considered
The Kendall coefficient of concordance2 and the chi square test computed for six Southeast Asian countries over twenty industry groups for 1963 and for
the same countries plus Japan over eighteen industry groups yielded results
significant at the 001 confidence level The results of this test are in
Table 3 below
The major groups of manufactures that satisfied the relatively low
skill labor criteria 3 for practically all of the countries considered were
1Examples of such manufactures are plastic goods footwear glasswearand china jewelry optical goods cutlery aad hardware electrical apparatus and appliances non electrical machinery printed matter and processing and preserving of fish and fruits and vegetables
2The Kendall coefficient of concordance provides a measure of the relashytion among several rankings of N variables ie determines the association among N variables It constitutes an index of the divergence of the actual agreement shown in the data from the maximum possible (perfect) agreement See Sidney Siegel Nonparametric Statistics for the Behavioral Sciences (New York McGraw Hill Book Company Inc 1956) pp 229-239
3The relatively low skill labor manufactures are defined as those manufactures having (1) relatively low value added per employee below the overall average for the manufacturing sector of each country and (2) levels of both wages and salaries per employee and non-wage value added per employee below the overall average
17
ISIC Classification
20
21
22
23
24
25
26
27
28
29
30
31
32
33
34
35
36
37
38
39
Table 1
Manufacturing (Division 2-3)
Food Products
Beverages
Tobacco Products
Textiles
Clothing Footwear and Made-Up Textiles
Wood Products
Furniture
Paper and Paper Products
Printing and Publishing
Leather and Leather Products
Rubber and Rubber Products
Chemicals and Chemical Products
Petroleum and Coal Products
Non Metallic Mineral Products
Basic Metals
Metal Products
Machinery except Electrical Machinery
Electrical Machinery
Transport Equipment
Miscellaneous Manufactures
Table 2 -- Indices of ValueAdded per Employee Wages and Salaries per Employee and Non-WageValue-Added per Employee for Manufactures in Selected Southeast Asian Countries (ISIC 2-3 =_ 100) 1963 (r)
ISIC _(2-3) 20 21 22 23 24 25 26 27 28 29Value Added Per Employee (2)Japan(2) Taiwan India Rep of
10000 10000 10000 10000
9130 11555 9082 10289
12826 40360 14289 23782
---67741 6301
60326
6413 5521 8165 6220
5326 6034 6420 5948
5869 6185 6390
11514
6739 6963 7662 5693
10869 9297 12751 13516
11739 4079 9319
10102
8913 8311 7396 6664
Korea Singapore 10000 Malaysia(5) 10000
6657 9080
16699 11900
21994 13800
3834(3) 6660 7260
6053 8260
9620 6400
5898 10320
9564 8600
6320 7000
(West)Philippines 10000 12850
(6)15812 9878 4990 3480 5027 3613 9900 5856 4839
Wages amp Salaries Per Employee (2)Japan 10000 7575 8484 --- 7272 6363 7575 8484 10606 13333 10303Taiwan 10000 9285 12857 15357 7619 6904 9166 7380 11428 10238 9285India 10000 6354 8125 5208 9843 9270 5833 8958 10312 10989 7291Rep of 10000 8195 11403 17807 8254 8490 11341 8910 10609 14110 10699Korea (3)Singapore 10000 7975 8947 6396 5384 10242 13279 5668 11740 6072
Malaysia (5) (6)(West) 10000 8901 10989 7637 7307 7472 11263 7472 8241 12582 5494Philippines 10000 9185 14253 7466 7828 5610 8099 7918 11538 13212 8325
Non Wage Value Added Per EmployeeJapan 10000 10000 15254 593252) 4745 4915 5762 11016 10847 8135Taiwan 10000 11959 45450 7500 5112 5855 5608 6869 8873 2905 8108India 10000 12671 22397 7739 5958 2671 7123 5958 15958 7123 7534 Rep of
Korea 10000 11034 18185 75451 5496 5044 11576 4549 14550 8676 5229Singapore 10000 5956 t0817 30279 3010(3) 3827 7677 6021 8408 6451 Malaysia(5) (6)
(West) 10000 9182 12421 17327 6289 7138 6540 5786 11509 6320 7661Philippines 10000 14035 16315 10657 4078 2792 4035 2222 9371 3479 3713Source Data calculated from United Nations The Growth of World Industry (United Nations 1968) (1) Figures for the Philippines and India refers to 1962 and figures for Taiwan refer to 1961 (2) Data excludes tobacco manufacturers (ISIC22)(3) figure stands for textiles clothing and footwear (ISIC 23 and 24)
Table 2 ------- continued
ISIC 30 31 32 33 34 35 36 37 38 39Value Added Per Employeejapan(Z) 9239 18804 22826 10217 11304 8804 10217 10434 12934 8260Taiwan 8899 11593 25578 8804 14857 8045 5939 7988India 6660 899423698 23254 55502 8816 10917 10562 11183Rep of 11745 10177 89056029 14707 6743 10706 10366 6341 6395 9121 6430 5561 KoreaSingapore 8820 27247(4) 11179 17556 9873 7668 9522Malaysia(5) 8820 19440 7500 5407
(6) 11000 10280 8400 6820 15660 7500 30400(6)(West)Philippines 14607 15524 17690 11270 8320 8265 11911 9215 10994 5038Wages amp Salaries Per EmployeeJapan 9090 13030 14242 9696 14242 10000 11818 9696 12727Taiwan 90909404 12500 13095 10119 15714 9166 11071 10238 13333India 833316041 13281 27083 7552 12604 10312 11458Rep of 11718 11979 92189274 11974 8825 11847 12308 8476 10540 9801 13196 6943Korea (4)Singapore b23 13157 10688 10121 9757 10890 15870 12550 6356
Malaysia(5)(West) 9010 11648 (6) 10000 11758 9340 10439 11868 11978Philippines 11312 15610 16813 (6)29004 11493 10995 11085 12714 10361 12398 8235Non Wage Value Added Per EmployeeJapan
Taiwan India
9322 8783 33767
22033 11396 36369
27627 27882 92876
10508 8536
10479
9661 8135 9322 14662 7815 4954 8698 10890 10821
10847 13050 7554 5382
11780 7808
7796 9099 8493
Rep of Korea
Singapore 4874 8924
15679 6002 34731(4)
10300 11440
9676 21505
5582 9935
4921 5956
8879 6150
4024 4817
5069 4903
Malaysia(West) 8710
Philippines 15672 23899 (6) 15497 186038
11572 11198
9433 7456
7861 4748 7353 11652
17830 4937 8845 10540
38176(6) 4005
(4) figure stands for chemical and petroleum products (ISIC 31 and 32)(5) Data for Malaysia excludes tailors and dressmakers (part of ISIC 24) in smelting industry(part of ISIC 342) motor vehicles and bicycle repair shops (ISIC 384 and 385) goldsmithing(part of ISIC 394) and processing of agricultural products on estates comprising tea factories(part of ISIC 209) rubber processing on estates (part of ISIC 30) and copra kilns and palm
(6) oil milling (part of ISIC 312)Breweries and manufacturing of malt (ISIC 213) and manufactures of products of petroleumand coal (ISIC 32) are included under miscellaneous manufacturing industries (ISIC 39)
4 ~ ~v-gt 444 420~
~ ~ ~ ~ ~ ~~~~~~ ~
r 1963 data 0203 707244cou
gt 41e 44gt~ 4 ii iltlii ]IIR ii 1 144 4
Tile 44144 os Cocodnc eaursth CefCon onisecy rakfgt4 Of
Ii i ]CoFffice41t itC of h 4gt
(for seven Co 1963=iiL 60 8 7 n ris data)i
44t e nt s- on c lt4444v gt-4c KI19 6 pp 4 lt29-4 )Y~~ 4
~~lt4441~ ~ ~~ K - 1I 44 4 44 44KK
an Concardanccluduare
4it a p i f chanc o e4 (S SL441 e
ab r o f n un r es c nc rn d f r te 11ii th ve sh wn - h l am c CIiLIS111=
d~isa r em n iwoul Chi All e nde lsbe 0iltii~iii 7-~ theii Sq a a i r r
CulatedI )i over Itwenty industrial groupsiifor i i Fo Se ton l~ of the ta le th ab v co ntie Jap IltF ei IIILIS + [+
incude Ther areiover~lI eihte inutilgois rus2
21
similarly those of textiles (23) clothing and apparel (24) wood and wood products (25) furniture (26) leather and leather products (29) and miscellaneous manufactures (39)
In addition other groups of manufactures have alsc exhibited relatively low capital requirements measured by low indices of valueshyadded-per-employee and non-wage-value-added-per-employee These groups were mainly printing and publishing (28) metallic products (35) nonshyelectric machinery (36) and transport equipment (38) Such low indices also appeared for individual countries in groups (37) of electrical
machinery (34) of basic metals (33) of non-metal mineral products and (20) of food products The finding therefore encourages these countries to expand the production and export of some manufactures within the specified groups However wages and salaries were higher for groups 28 35 36 and 38 than for groups 23 24 25 26 and 39 suggesting somewhat high skill requirements The difference might however have reflected heterogeneity in groups 35 36 and 38 or in the other groups Hence a detailed study of two of the countries the Philippines and Malaysia I was
carried out
Our detailed analysis of manufacturing sectors in the Philippines
and Malaysia gives support to favoring disaggregated consideration of LDC specialization in manufacturei production In addition to manufactures in groups 23 24 25 26 and 29 all of which generally satisfy the criteria both of low-value-added-per employee and low wages and salaries and non-wages-added-per-employee there are subgroups here and there in virtually all of the remaining manufacture categories that show the same
characteristics
1Bureau of the Census and Statistics Annual Survey of Manufactures1960 Volume V (Manila Philippines 1962) and
Department of Statistics of Malaysia Census of ManufacturingIndustries in the States of Malaya 1963 (Kuala Lumpur Malaysia 1965)
22
We list below in Tables 4 and 5 those manufactures for the Philippines and Malaysia that qualify by the above criteria and so invite considerations as serious candidates for LDC production It is interesting to note that the manufactures listed below to a very large extent encompass those identified as labor intensive in the study sumnarized in Table 2 It is important to emphashysize however the wider possibilities for specialization that emerge from examination of individual LDC data on manufactures
23
Table 4
Manufactures Satisfying Low Value-Added per Employee Criteria in the Philippines
Wages and Non-Wage Value Added Salaries Value Added
per per per ISIC Employee Employee Employee
All Industries 100 100 100
20 Food Manufactured 201 Slaughtered Prepared
and Preserved Meat 5833 9863 4260 203 Canned and Preserved
Fruits amp Vegetables 8935 10319 8395 204 Preserved Fish and
205 Other Seafoods Grain Mill Products
4705 8128
5159 7625
4527 8324
206 Bakery Products 3871 6803 2727 208 Cocoa Chocolate and
Sugar Confectionary 3756 5296 3155 209 Miscellaneous Food
2093 Preparations Dessicated Coconut
7559 2525
7534 5342
7557 1425
21 Beverages - -
22 Tobacco Products 221 Cigars Cigarettes and
related Products 8038 7899 8092 23 Textiles 4871 100 2869
231 Textile Mill Products 4653 7990 3351 2311 Hemp Mill Products 3871 6392 2887 2313 Narrow Fabrics and
Small Wares 4025 6210 3172 2314 Cotton Textile Mill
2316 Products Jute Mill Products
4641 5307
8264 8082
3226 4224
232 Knitting Mill Products 5500 7214 4830 239 Other Textiles 1948 1872 1978
24 Footwear and Other Wearing Apparel and 3089 5433 2174 Made Up Textiles
241 Footwear (Shoes amp Slipshypers except Rubber) 2794 5662 1675
243 Wearing Apparel except Footwear 2871 5205 1960
245 Embroideries Hand or Machine Made 4769 6310 4171
24 Table 4 (continued)
25 Wood and Cork Products 4525 8127 3119 Except Furniture
251 2521 2551
Sawmill and Planning Mill Veneer and Plywood Sawah Nipa and Bamboo
4641 4576
3051
8127 8584
6712
3279 3012
1622 26
2611 2621
2631
2641
2661
Furniture and Fixtures Rattan Furniture except Wood Furniture except Upholstered Venetian Blinds and Other Screens Metal Furniture except Upholstered Mattresses and Bedshy
4217 2294
3384
4500
4102
7397 4931
7351
8310
8401
2976 1264
1836
3012
2424
Springs 6743 7579 6417
27 Paper and Paper Products 28 Printed and Published
2821 Materials (mainly) Books and Pamphlets 8987 9771 8680
29 Leather Products
2911
2921
except Footwear Leather Tanned or Finished Luggage Handbags and Small Leathergoods
4961
5076
5205
7534
7945
7214
3957
3957
4420
30 3011 309
Rubber Products (mainly)Rubber Shoes and Slippers Miscellaneous Rubber
6384 10000 4973
Products 5987 10365 4278
31 Chemicals and Chemical
3121 Products (mainly)Vegetables Oils 7705 10182 6737
32 Products of Petroleum and Coal (combined with ISIC 39 of Miscellaneous)
33 Non-Metallic Mineral
331
Products (mainly) except Products of Petroshyleum and Coal Strictural Clay Products 5487 8082 4474
339 Other Non-Metallic Mineral Products such as statuary conshycrete lime statuary
8995 6269 5204
25
Table 4 (continued)
art goods and cut stone products
34 3412
Basic Metal Products (mainly) Iron and steel FoundryProducts 6346 9223 5222
35
351
Metal Products Except Machinery and Transport Equipment Tin and Aluminum Ware
352 356
3561
3563
3594
36
(except household and hospital utensils)
Cutlery and Hand Tools Heating Cooking and Plumbing Equipment Heating and Cooking Appashyratus Metal Plumbing Fixtures and Fittings Needles Pins and Fasteners Machinery Except electrishy
6192
4769
5217
3628
6820
6347
9041
9315
8401
9817
6131
3101
3618
1764
5650
364 3641
365
369
cal (mainly)Special Industry Machinery Food Products Machinery and Euipment General Industrial Machinery amp Equipment Other Machinery
5230
4282
3282 5487
9452
9269
7853 10228
3582
2335
1497 3636
37
371
Electrical Machinery Apparatus Appliance and Supplies Electrical Industrial
8474 10410 7718
3711 3712
Apparatus Motors and Generators Electrical Distribution
6269 3461
7808 7260
5668 1978
3722
3741
3749
and Control Apparatus 7641 Household Radios Phonogrpahs amp TV Sets 6769 Household Cooking amp Heating Equipment 3858 Other Household Electrical
8036
9817
7990
7486
5579
2245
Appliances 7346 9908 6345 38
381 3832
3841
3851
Transportation EquipmentShipbuilding and Repairing Motor Vehicle Engines Parts amp Bodies Motor Vehicles Repair shop Products Bicycles
3333
4858
5730 5384
10000
8767
10365 9132
730
3333
3921 3921
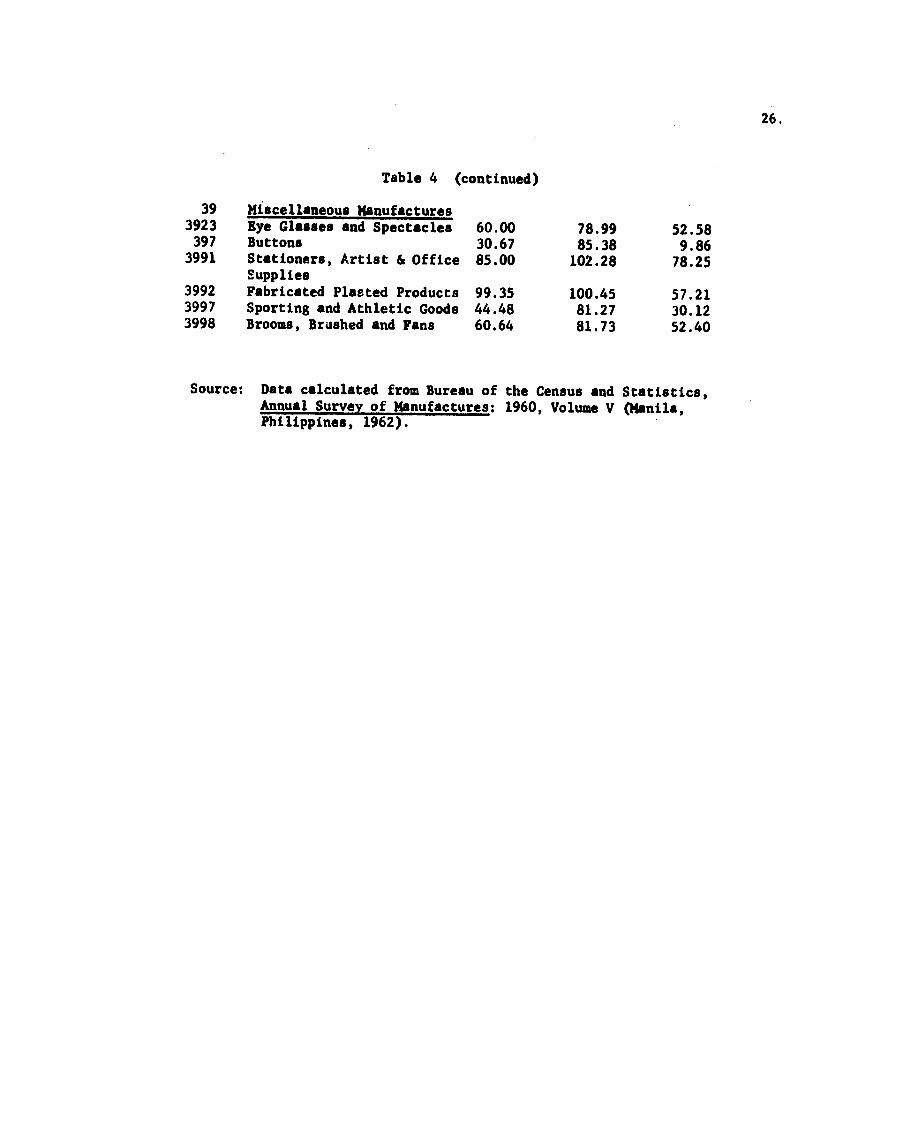
26
Table 4 (continued)
39 Miscellaneous Manufactures 3923 Eye Glasses and Spectacles 6000 7899 5258 397 Buttons 3067 8538 986
3991 Stationers Artist amp Office 8500 10228 7825 Supplies
3992 Fabricated Platted Products 9935 10045 5721 3997 Sporting and Athletic Goods 4448 8127 3012 3998 Brooms Brushed and Fans 6064 8173 5240
Source Data calculated from Bureau of the Census and Statistics Annual Survey of Manufactures 1960 Volume V (Manila Philippines 1962)
27
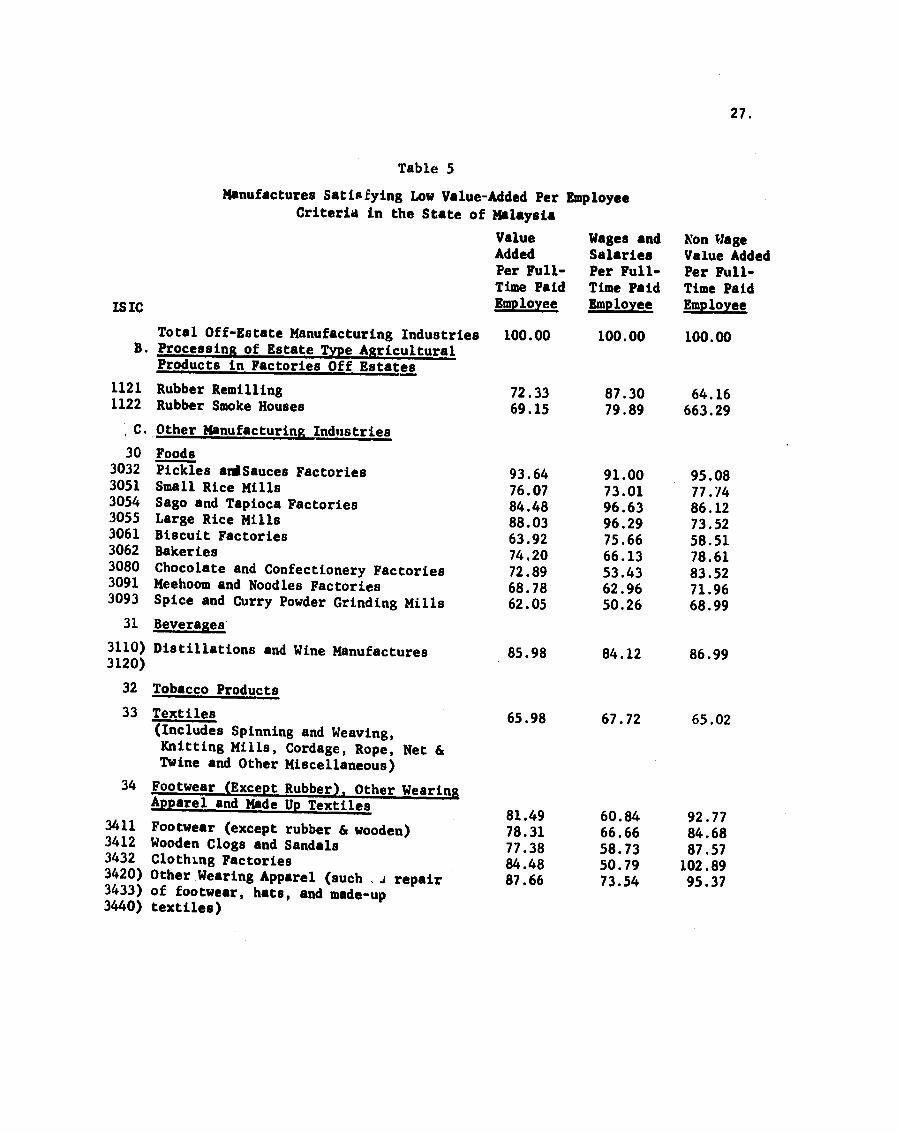
Table 5
Manufactures Satisfying Low Value-Added Per Employee Criteria in the State of Malaysia
Value Wages and Non Wage Added Salaries Value Added Per Full- Per Full- Per Full-Time Paid Time Paid Time Paid
IS IC Employee Employee Employee
Total Off-Estate Manufacturing Industries B Processing of Estate Type Agricultural
10000 10000 10000
Products in Factories Off Estates 1121 Rubber Remilling 7233 8730 6416 1122 Rubber Smoke Houses 6915 7989 66329
C Other Manufacturing Industries
30 Foods 3032 3051 3054 3055 3061 3062 3080 3091 3093
Pickles andSauces Factories Small Rice Mills Sago and Tapioca Factories Large Rice Mills Biscuit Factories Bakeries Chocolate and Confectionery Factories Meehoom and Noodles Factories Spice and Curry Powder Grinding Mills
9364 7607 8448 8803 6392 7420 7289 6878 6205
9100 7301 9663 9629 7566 6613 5343 6296 5026
9508 7774 8612 7352 5851 7861 8352 7196 6899
31 Beverages
3110) Distillations and Wine Manufactures 8598 8412 8699 3120)
32 Tobacco Products
33 Textiles 6598 6772 6502 (Includes Spinning and WeavingKnitting Mills Cordage Rope Net amp Twine and Other Miscellaneous)
34 Footwear (Except Rubber) Other WearingApparel and Made Up Textiles 8149 6084 9277
3411 Footwear (except rubber amp wooden)3412 Wooden Clogs and Sandals 3432 Clothing Factories 3420) Other Wearing Apparel (such _j repair
7831 7738 8448 8766
6666 5873 5079 7354
8468 8757 10289 9537
3433) of footwear hats and made-up 3440) textiles)
28
Table 5 (continued)
Value Added Per Full-
Wages and Salaries Per Full-
Non Wage Value Added Per Full-
ISIC Time Paid Employee
Time Paid Employee
Time Paid Employee
35 Wood Rattan Mena and Cork
Kuang Attap
3531 3591
Wooden Boxes Cases and Crates Carpentary Shops Other Wood Products (such as Wood Preserved Rattan Processing Basketware Attap Products and other wood and Cork Products
5700 8485
7345
7195 5978
9841
4884 9855
5982
36 Furniture and Fixtures includes
6728 7513 6300
361) Household Furniture 362) Office and Connercial Furniture 367) Furniture Finishing and Repairing 364) Mattress Manufacturing 369) Other Miscellaneous Manufacture of
Furniture
37 Paper and Paper Products
38 Printing and Publishing 382 Job Printing Bookbinding amp Printing
Service 7289 8730 6502
39 Leather and Leather Products except Footwear and Wearing Apparel 7570 5291 8815
40 Rubber Products 4010) Rubber Products except Retreading and 4021) Vulcanizing of Tires and Tubes (inshy
cludes 4030) rubber footwear tires and tubes
foam
6485 8095 5606
4090) rubber products amp other Miscellaneous
41 4195
Chemicals and Chemical Products Matches
6093 9084 6300
42 Coal and Petroleum Products (included Under All Other Industries)
29
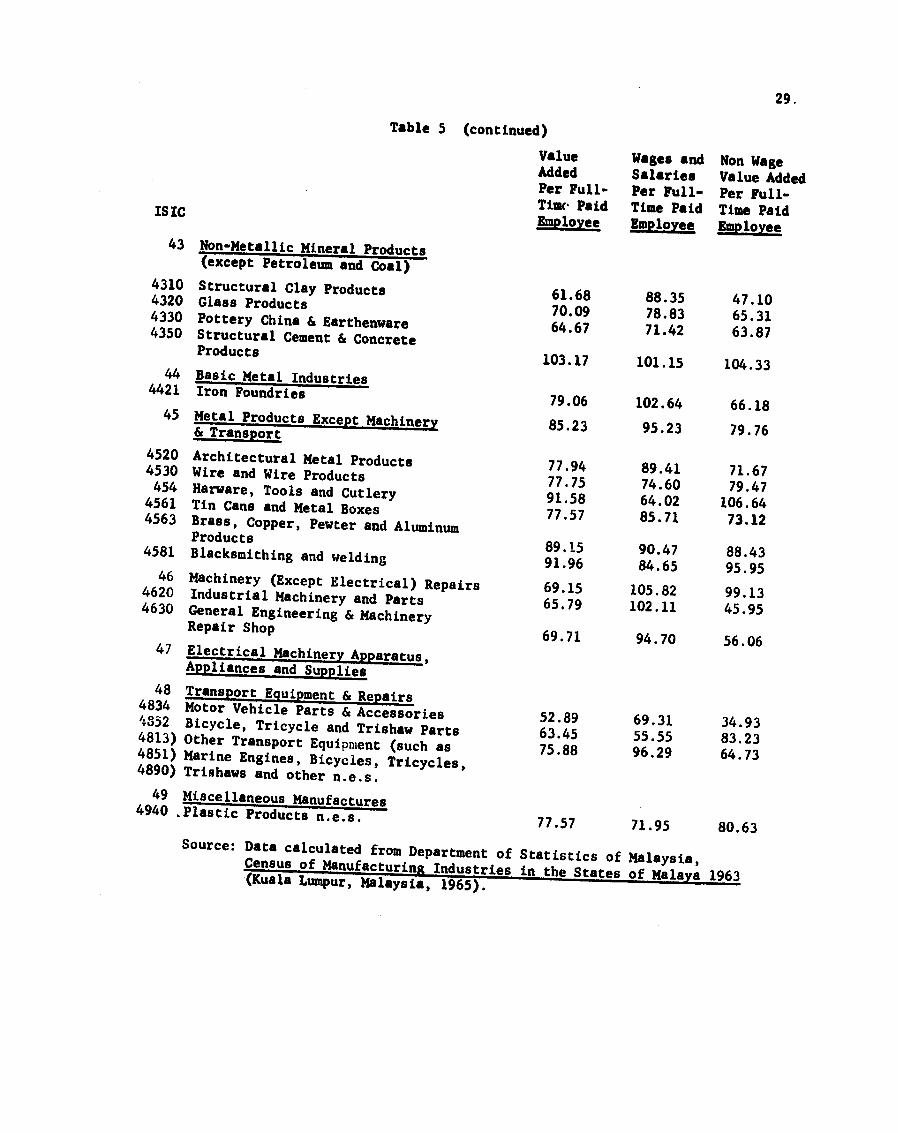
Table 5 (continued)
Value Added Per Full-
Wages and Salaries Per Full-
Non Wage Value Added Per Full-
ISIC Timc Paid Time Paid Time Paid Employee Employee Employee
43 Non-Metallic Mineral Products
4310 4320 4330
4350
(except Petroleum and Coal) Structural Clay Products Glass Products Pottery China amp Earthenware Structural Cement amp ConcreteProducts
6168 7009 6467
8835 7883 7142
4710 6531 6387
10317 10115 10433 44 BasicMetal Industries
4421
45
Iron Foundries
Metal Products Except Machinery amp Transport
7906
8523 10264
9523 6618
7976
4520 Architectural Metal Products 4530 Wire and Wire Products 454 Harware Tools and Cutlery
4561 Tin Cans and Metal Boxes 4563 Brass Copper Pewter and AluminumProducts
7794 7775 9158 7757
8941 7460 6402 8571
7167 7947
10664 7312
4581
46 4620
4630
Blacksmithing and welding Machinery (Except Electrical) RepairsIndustrial Machinery and Parts General Engineering amp MachineryRepair Shop
8915 9196
6915 6579
6971
9047 8465
10582 10211
9470
8843 9595
9913 4595
5606 47 Electrical Machinery Apparatus
Appliances and Supplies 48 Transport Equipment amp Repairs4834 Motor Vehicle Parts amp Accessories
4332 Bicycle Tricycle and Trishaw Parts4813) Other Transport Equipment (such as 4851) Marine Engines Bicycles Tricycles4890) Trishaws and other nes
5289 6345 7588
6931 5555 9629
3493 8323 6473
49 Miscellaneous Manufactures4940 Plastic Products nes 7757 7195 8063 Source Data calculated from Department of Statistics of Malaysia
Census of Manufacturing Industries in the StatesofMalaya1963(Kuala Lumpur Malaysia 1965)
30
2 Implications Export Performance
For the purpose of estimating comparative advantage possibilities available data suffer sharply from their aggregation--that isthey suffer from the heterogeneity of products included under a given classification Guidance is needed for very specific kinds of specialization But aggregated data lead only to rough guidelines and if the rules of behavior and parashymeter shifts of individual segments happen to combine malevolently aggregated data can lead to generalizations inverse to the real facts
The problem we face in trade matters stems from definitions of products that are heterogeneous with respect to factor requirements We should be on guard LDCs in general and Southeast Asian countries in particular may be able to specialize efficLently in the production of a large variety of manushyfactures that are labor intensive and require only modest skills irrespective of the general group within which they fall
Greater awareness of this diversity would free policy in thesecountries toward a wider area of choice and greater degree of adaptability It would also enable them to take advantage of favorable export prospects among the more numerous plausible sub-groups of manufactures
It is a major complaint of LDCs that world demand for their traditional primary exports is unpromising Preoccupation with only a few manufactures which alone are supposed to have export potential risks earning the same disappointment There are valid factor-supply reasons for considering a wide range of industries and sub-industries and of course also on tle demand side their long-run demand prospects
A study of future prospects of world trade in manufactures by Maizels1 has projected a declining share of textiles and clothing2 and other miscellshyaneous manufactures for industrial semi-industrial and non-industrial
IAlfred Maizels Industrial Growth and World Trade (Cambridge CambridgeUniversity Press 1963) pp 402-406
2The share of textile and clothing exports as a percentage of world trade in manufactures declined from 20 in 1937 to 10 in 1959 and is projected todecline further to only 5 by 1970-75
31
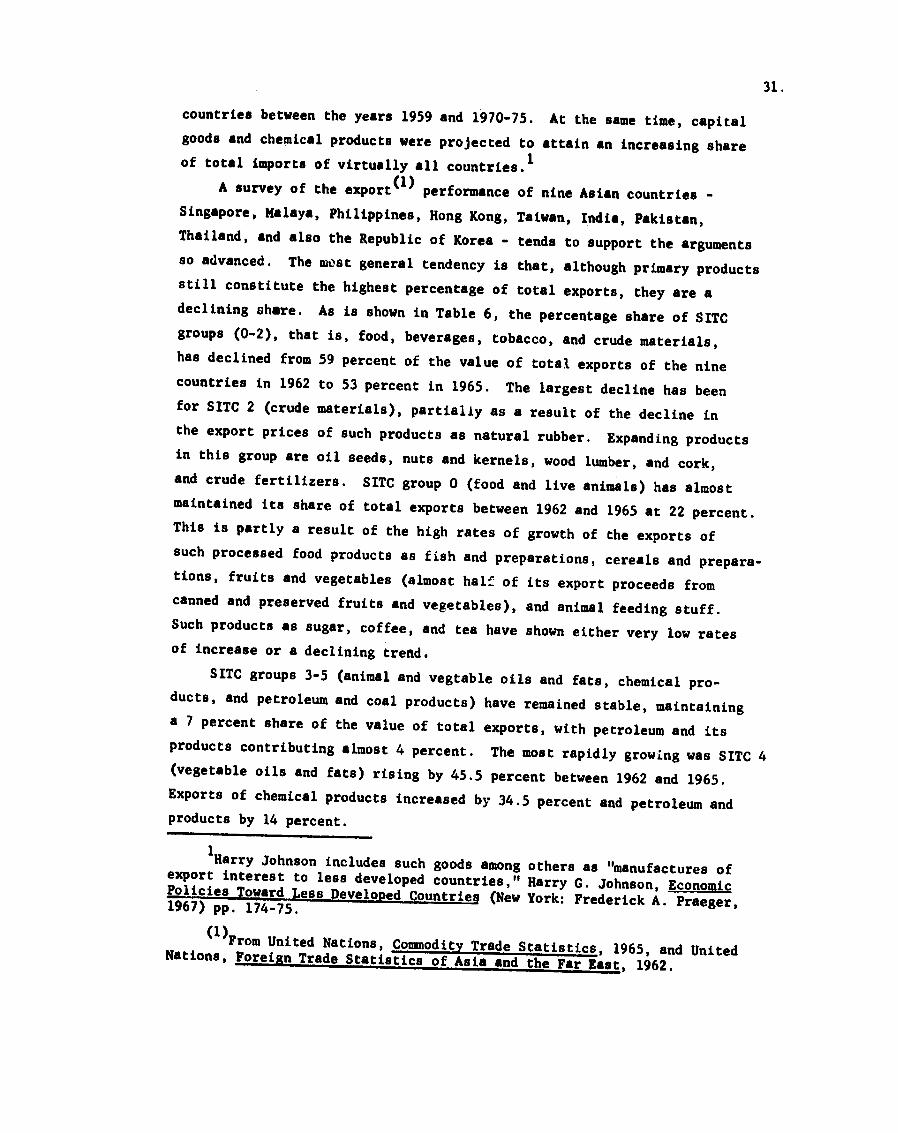
countries between the years 1959 and 1970-75 At the same time capital goods and chemical products were projected to attain an increasing share of total imports of virtually all countriesI
A survey of the export(1) performance of nine Asian countries -Singapore Malaya Philippines Hong Kong Taiwan India Pakistan Thailand and also the Republic of Korea - tends to support the arguments so advanced The ast general tendency is that although primary products still constitute the highest percentage of total exports they are a declining share As is shown in Table 6 the percentage share of SITC groups (0-2) that is food beverages tobacco and crude materials has declined from 59 percent of the value of total exports of the nine countries in 1962 to 53 percent in 1965 The largest decline has been for SITC 2 (crude materials) partially as a result of the decline in the export prices of such products as natural rubber Expanding products in this group are oil seeds nuts and kernels wood lumber and cork and crude fertilizers SITC group 0 (food and live animals) has almost maintained its share of total exports between 1962 and 1965 at 22 percent This is partly a result of the high rates of growth of the exports of such processed food products as fish and preparations cereals and preparashytions fruits and vegetables (almost half of its export proceeds from canned and preserved fruits and vegetables) and animal feeding stuff Such products as sugar coffee and tea have shown either very low rates of increase or a declining trend
SITC groups 3-5 (animal and vegtable oils and fats chemical proshyducts and petroleum and coal products) have remained stable maintaining a 7 percent share of the value of total exports with petroleum and its products contributing almost 4 percent The most rapidly growing was SITC 4 (vegetable oils and fats) rising by 455 percent between 1962 and 1965 Exports of chemical products increased by 345 percent and petroleum and products by 14 percent
1Harry Johnson includes such goods among others as manufactures ofexport interest to less developed countries Harry G Johnson EconomicPoliciesTowardLess Developed Countries (New York Frederick A Praeger1967) pp 174-75
(1)From United Nations Commodity Trade Statistics 1965 and UnitedNations Foreign Trade Statistics of Asia and the Far East 1962
32
Table 6
Export Performance of Nine Asian Countries 1962-65
SITC Composition Z Rate of Growth
1962 1965 1962-1965
(0 1 amp 2) 5900 5336 1421
0 Food and Live Animals 2258 2187 2227
1 Beverages and Tobacco 152 136 1314
2 Crude Materials 3489 3012 905
(3 4 amp 5) 708 707 2605
3 Mineral Fuels 386 349 1415
4 Animal and Vegetable 170 196 4553
5 Chemicals 151 161 3453
(6 7 amp 8) 3287 3778 4517
6 Basic Manufactures 2184 2384 3786
7 Machinery and Transport 304 334 3873
8 Miscellaneous Manufactures 798 1059 6763
33
SITC groups 6 7 and 8 encompassing the bulk of manufactured exports-shybasic manufactures machinery and transport equipment and miscellaneous manufactures have gained an increasing share rising from 33 percent in 1962 to 38 percent in 1965 The largest contribution is made by SITC group 6 (basic manufactures) which accounted for 238 percent of total exports in 1965 The most important product under this group is textile yarn and fabshyrics (14) with India Pakistan and Hong Kong followed by Taiwan and Singashypore supplying the largest proportion of its exports SITC 68 of nonferrous metals is the second in significance (45) with tin mainly originating from Malaysia Other important products are wood manufactures mainly suppliedby Philippines Taiwan Korea and Singapore Ocnmetal mineral manufactures mainly originating from India Singapore Taiwan Hong Kong and Thailand iron and steel products from India Singapore Korea and Taiwan leather products basically from India and Pakistan metal products from Hong KongSingapore India Taiwan and Malaya and rubber manufactures from Malaya India and Singapore
SITC group 7 (machinery and transport equipment) constituted 33 pershycent in 1965 and increased by 387 percent between 1962 and 1965 with exshyports of electrical and nonelectrical machinery rising at a higher rate than exports of transport equipment Exports of SITC 8 (iniscellaneous manushyfactures) exhibited the highest rate of growth 676 percent betweeki the two years and contributed 106 percent of total exports in 1965 The most important product in this group was clothing followed by toys and sportinggoods footwear plumbing heating and lighting equipment furniture printshyed ratter and articles of plastic Most of the exports of this group origshyinated from Hong Kong
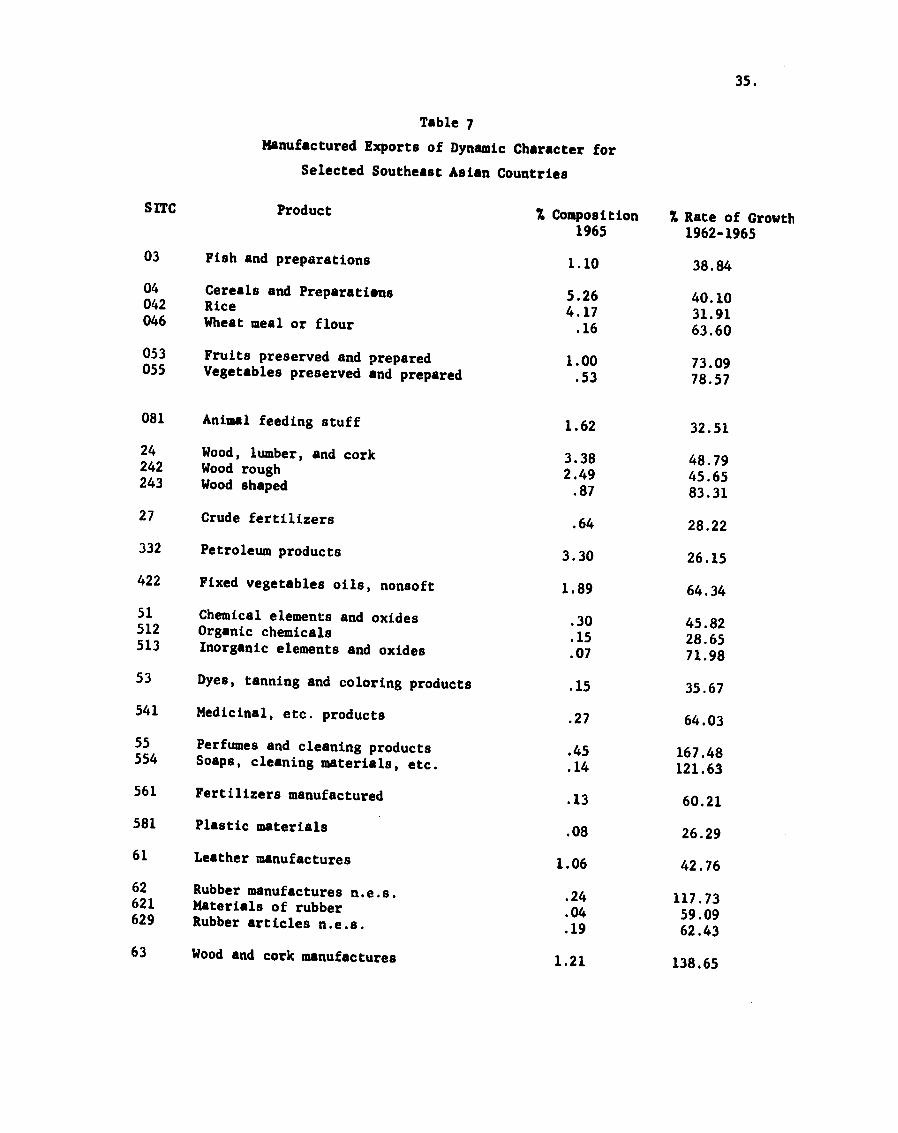
The following table (7) lists goods with rapid export growth It shows rates of growth and percentage composition of the above products and
other manufactured and semi-manufactured goods of dynamic charactertwo and three SITC digit classifications
in
1Indicating rates of increase above that of total exports (26 percent)
--
34
It is interesting to note that the list to a very large extent consists of manufactures that were shown to be labor intensive by examination of these countries data Most worthy of noting is also the fact that rapidshyly growing manufactured exports from Southeast Asian countries though still concentrated in origin are spread over almost all manufactured groups and extend far beyond the traditional products to which analysis of LDCs comshyparative advantage in manufactures has often been restricted
We should emphasize in conclusion that the right choice of potentiallysuccessful manufacturing industries needs to be complemented by a right mix of policies for promoting exports including conspicuously reasonable exchange rates We need to hope also that the HDCs adopt favorable import policies
It is important for LDCs to maintain price competition in the production of the manufactures in which they specialize a matter of the domestic pricelevel exchange rates and of specific policies There are indications that it is basically those LDCs with favorable export policies that are more successful in their general development efforts
Another important implication involves the skill composition of the labor force Skills including organization and administrative capacity are a scarce resource They should be considered soalong with quantity of capital natural resources and foreign exchange in planning for industrial development Skill availability over the course of time has relevance to the appropriate product mix of individual countries It directly influences the levd of current productivity and productivity potentials for the future
As development proceeds successfully the importance of industries low in skill and capital requirements will subside relative to those more demanding in their requirements
A final caution is relevant Experience in the United States indicates that the kind of industry or sub-industry that a business is in a poor guide to its individual success or failure Expanding fields which on the average are doing well have a built-in check the individual business faces increased competition from expansion of others and new entrants Its fortunes dependcrucially on its management which can cause it to sink in calm seas or sail sturdily through rough weather
35
Table 7 Manufactured Exports of Dynamic Character for
Selected Southeast Asian Countries SITC Product Composition Z Rate of Growth
1965 1962-1965 03 Fish and preparations 110 3884
04 Cereals and Preparatiens 526 4010042 Rice 417 3191046 Wheat meal or flour 16 6360
053 Fruits preserved and prepared 100 7309055 Vegetables preserved and prepared 53 7857
081 Animal feeding stuff 162 3251
24 Wood lumber and cork 338 4879242 Wood rough 4565243 Wood shaped
249 87 8331
27 Crude fertilizers 64 2822
332 Petroleum products 330 2615
422 Fixed vegetables oils nonsoft 189 6434
51 Chemical elements and oxides 4582512 Organic chemicals 30 15 2865513 Inorganic elements and oxides 07 7198
53 Dyes tanning and coloring products 15 3567
541 Medicinal etc products 27 6403
55 Perfumes and cleaning products 45 16748554 Soaps cleaning materials etc 14 12163
561 Fertilizers manufactured 13 6021
581 Plastic materials 08 2629
61 Leather manufactures 106 4276
62 Rubber manufactures nes 24 11773621 Materials of rubber 04 5909629 Rubber articles nes 19 6243
63 Wood and cork manufactures 121 13865
36
65 Textile and yarn fabric 1419 3115 651 Textile yarn and thread 141 5297 652 Cotton fabrics woven 438 4881 657 Floorcoverings tapestry etc 041 2986
66 Non metal mineral manufactures 110 8027 664-5 Glass and glassware 010 2682 667 Pearls precious and semi precious stones 063 16681
67 Iron and steel products 107 13889 673 Iron and steel shapes 036 9259 674 Iron and steel universals plates sheets 025 17618 678 Iron and steel tubes pipes etc 018 12802
68 Non ferrous metals 449 4950 684 Aluminum 010 7169 687 Tin 429 4874
69 Metal Products nes 093 2669 695 Tools 004 3038 696 Cutlery 007 20298
71 Machinery non electric 095 2647 711 Power machinery non electric 020 4657 715 Metal working machinery 003 6400
72 Electrical machinery 130 10064 723 Electrical distributing machinery 006 4267 724 Telecommunication equipment 055 24230 729 Electrical machinery nes 045 5440
812 Plumbing heating and lighting equipment 0301 5133
831 Travel goods handbags 0131 3885
841 Clothing 539 7050
851 Footwear 072 5320
861 Instruments and apparatus 0121 4482 89 Miscellaneous manufactured goods nes 354 8052 892 Printed matter 028 3318 893 Articles of plastic 024 11654 894 Toys and sporting goods 108 12341 896 Works of art etc 013 6475 897 Gold silverware and jewelry 015 4686
Source Calculated from United Nations Commodity Trade Statistics 1965 United Nations Foreign Trade Statistics of Asia and the Far East 1962 and United Nations Yearbook of International Trade Statisshytics 1965
1India not included
37
B - Export Patterns and Trends of Comparative Advantage
The need of Asian countries for sustained export expansion has been much emphasized in recent years These countries have in general experienced slow growth compared to their import and servicing-of-loans requirements As means of meeting the need regional cooperation and integration have been proposed as possible courses of action
But although the export growth of the region has been slow differences in performance among the countries are considerable Differences in export performance would affect the outcome of any preferential scheme that might be adopted and also the willingness of the countries to integrate or to move toward economic integration
This section examines the export performance and the trends of comshypetitiveness of individual Southeast Asian countries Problems of transport costs are treated in C Some implications for regional cooperation are drawn in this section a fuller analysis is given later on An analysis of the accuracy of Asian trade and income statistics on which we must rely throughshyout are presented in III below
This section is divided into
1-Asian performance in world trade 2- Trade with more developed countries (MDCs)
3- Intra-regional trade 1-Asian Performance inWorld Trade
Exports of less developed Asia have grown slowly compared to those of most other world regions (Table 8 ) Its exports to within the region have fallen somewhat (from 29 between 1955-56 and 1965-66) at the same time its exports to more developed countries have remained about stable Asias exports to high income countries are a much larger share of its total exports than its exports to any other region But all the other less developed regions export to high income countries a higher proportion of their total exports than does Asia
In two respects less developed Asia is unique among the worlds lower income regions All the other less developed countries export to the more developed countries (MDCs) a higher proportion of their total exports than does Asia (60 recently) Also Asia has a much larger share of its trade flow to within the region (25 recently) than does any other LDC region
TABLE 8
Export Directions by Regions
A-Less Developed
Asia Exports Less Latin Less Less
Developed America Developed Developed Middle
East More
Developed All
The
Exports of less developed Countries Asia Africa Countries World
Asia to the indicated regions (in $s million FOB) 1955-56 $2535 $140 $2020 $190 $143 $4020 $6870
1965-66 3080 116 2345 308 240 5690 9520
Share of total exports from less developed Asia going to the indicated regions (in ) 1955-56 37 2 29 3 2 59 1007
1965-66 32 12 25 3 3 60 100
B-Exports from the Regions Listed
Exports to more developed countries from the indicated 1938 72 80 7(r 84 68 69 region (in of total exports 1955-56 72 79 59 82 68 67 of the region) 1965-66 72 73 60 80 74 75
Exports to within the same 1938 22 6 1 6 14 69 region (as of total exports 1955-56 24 9 6729 10 13 of each region) 1965-66 21 10 25 7 6 75
C-Exports of the indicated 1938 25 7 5 4 2 41 100Region as of total 1955-56 24 8 7 5 3 65World Exports 1965-66 18 6
100 5 4 3 69 100
Definitions and coverage make 1938 figures not strictly comparable with later data Part of the table is notcarried back to 1938 because of lack of comparability All percentages are rounded to the nearest whole percent We estimate that the accuracy of the data does not warrant putting down fractions of a per cent
Sources United Nations Yearbook nf International Trade Statistics 1966 pp 20-31 op cit 1962 various pages
39
The lagging growth of the regions exports slower than that of Africa and the Middle East is usually explained by the extremely high concentrashytion of exports of traditional primary products combined with a progressively smaller export surplus of food and raw materials Primary commodities (SITC 0 through 4) are three-fourths of the regions total exports We will examine data relevant to this usual explanation below
2- Exports to More Developed Countries
The regions share of total world exports has been falling (7 in 1956shy57 and 5 in 1965-66) But the share of its total exports going to MDCs appears not to have changed greatly the share was 60 in 1965-66 and seems to have been only moderately higher before World War II
The share varies widely for individual countries ranging in 1965 from 95 for the Philippines to 46 for Thailand and 31 for Burma
In evaluating the pattern of individual countries we analyze the extent to which export growth has been affected by two interrelated factors
(1) the compositional effect showing the changing proportion ofworld exports consisting of goods exported by a given regional country
and (2) the competitive effect denoting the changing proportion of world exports of a given commodity that the country provides
To find quantitative values for these effects the hypothetical export growth (h) of a given Asian country (J) is first computed This growth is based on the assumption that the country is able to maintain the same share in each commodity for each export market in the second period as in the first In notational form Js hypothetical export growth (HJ) is as follows
c
Hj =
c i xji where X refers to Js exports to another country i and Mi to is total imports Superscript c indicates the commodity and 1 and 2 refer to periods
The competitive effect ismeasured as the actual export growth (A)of the country minus its hypothetical growth (H) The compositional effect isdefined as H minus D which is the weighted average import growth of its trading partshyners The sum of these effects (A - -H + H D) is the difference between growth rate of the countrys exports and its partners imports (A - D)
40
In computing these effects with respect to the MDCs two periods have been selected Period I (1956 and 1957) and Period II (1964 and 1965) In
each period the average of the two years is used to minimize the yearly
fluctuation of trade values The country-by-coumodity trade data on Asian countries are not readily available especially for the earlier period
(except Malaya-Singapore) To overcome the scarcity-of-data problem the export patterns of Asian countries are approximated from the import data of
their trading partners
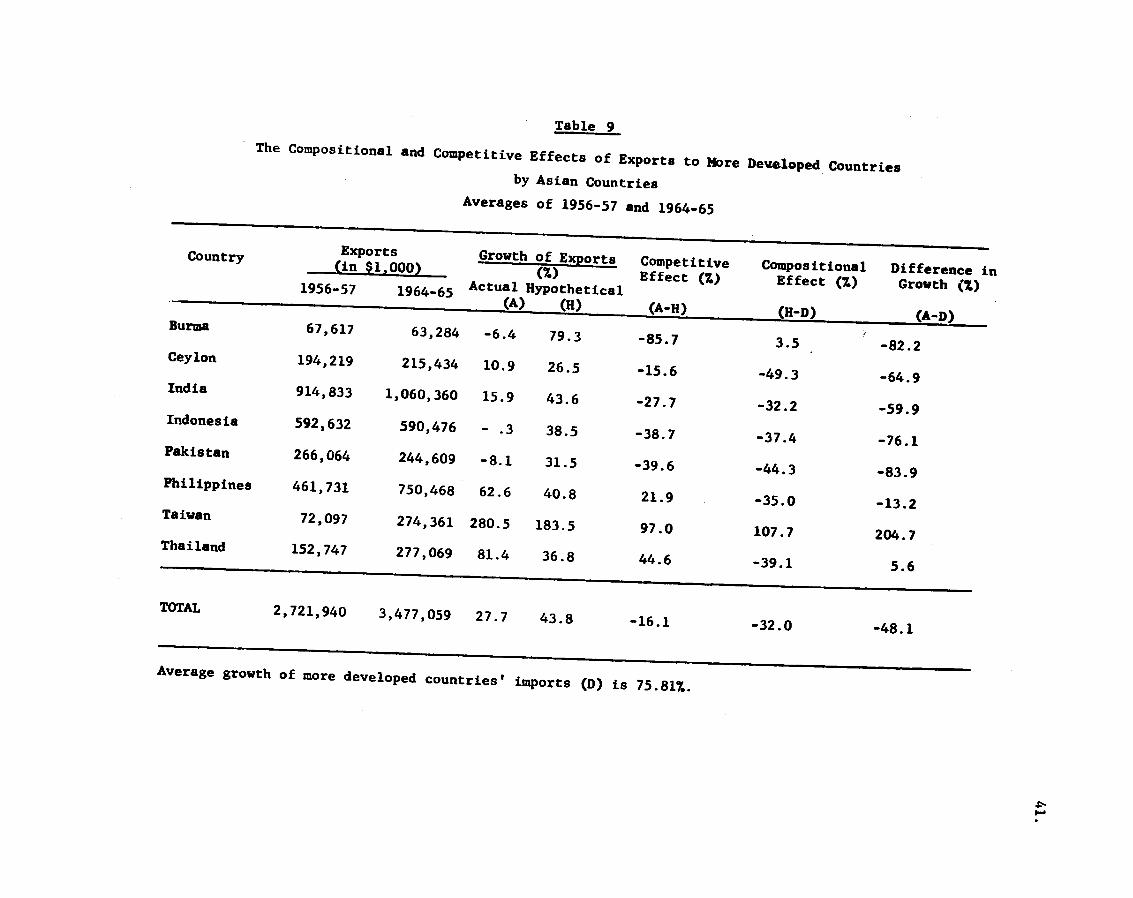
The growth rate of the regions as well as individual countries exports to the selected MDCs in terms of the compositional and competitive effects
is given in Table 91 As shown in the last row the region has labged for both composition ind competitive reasons Exports grew only 28 while
total imports of the MDCs rose by 76 from 1956-57 to 1964-65 -- a lag
of 482
The low growth rate for exports of the region is partly due to regional concentration on primary products that have been expanding slowly in the world market This negative compositional effect is not surprising The emphasis
on and effort in Asian countries toward export diversification and toward industrialization is partly a reaction to slowly growing world markets for
primary products
The remainder of the export lag the (negative) competitive effect of 16 or one-third the total export lag of -48 (A-D) is unexpectedly large Even when the unfavorable compositional effect is taken into account the position of the regions exports in various commodities vis-a-vis other world
exporters has declined
l1n computing these effects SITC Group r (Unclassified Goods) ia
excluded The group makes up an almost neglIgible proportion of total exports
2Also see Seiji Nayas Project Research Paper The Commodity Pattern and Export Performance of Developing Asian Countries to the Developed Areaspublished in Economic Development and Cultural Change (July 1967) in which the regions but not individual countries exports to various developed countries are analyzed employing the same method used here with 1962-63 as the terminal period
Table 9 The Compositional and Competitive Effects of Exports to More Developed Countries
by Asian Countries Averages of 1956-57 and 1964-65
Country Exports(in $1000) Growth of Exports Competitive() CompositionalEffect (Z) Difference inEffect (Z)1956-57 Growth ( )1964-65 Actual(A) Hypothetical(H) (A-H) (H-D) (A-D)Burma 67617 63284 -64 793 -857 35 -822 Ceylon 194219 215434 109 265 -156 -493 -649 India 914833 1060360 159 436 -277 -322 -599 Indonesia 592632 590476 - 3 385 -387 -374 -761 Pakistan 266064 244609 -81 315 -396 -443 -839 Philippines 461731 750468 626 408 219 -350 -132 Taiwan 72097 274361 2805 1835 970 1077 2047 Thailand 152747 277069 814 368 446 -391 56
TOTAL 2721940 3477059 277 438 -161 -320 -481
Average growth of more developed countries imports (D) is 7581
42
Within this over-all picture of the region considerable variation exists
in the performance of individual countries Striking differences are revealed
the increase in exports of Taiwan(281) Thailand (81) and the Philippines
(63) is outstandingly high compared with that of other countries some of
whose export values fell absolutely (Indonesia -028 Burma -6 Pakistan-8)
A negative compositional effect is common to most countries considered
reflecting unfavorable commodity shifts in MDC markets for these countries
goods (Taiwan is the main exception)1
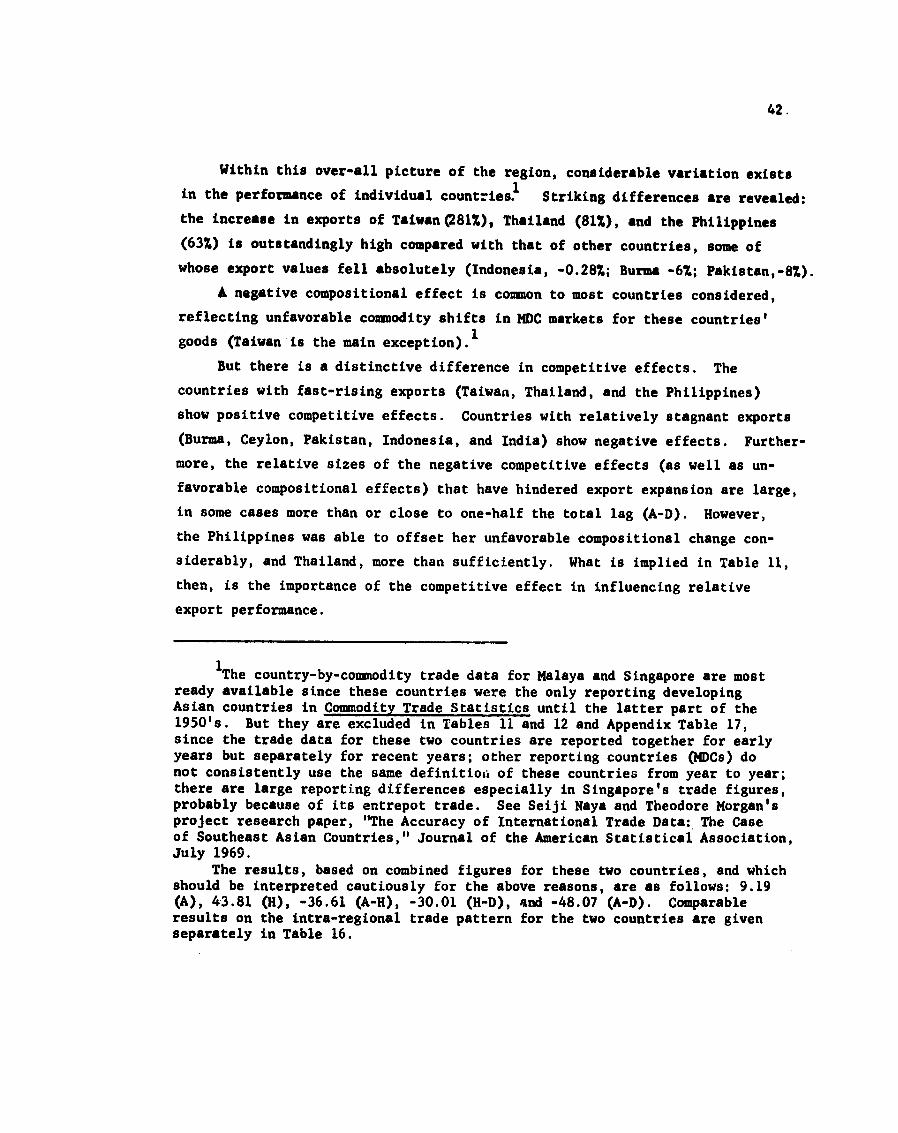
But there is a distinctive difference in competitive effects The
countries with fast-rising exports (Taiwan Thailand and the Philippines)
show positive competitive effects Countries with relatively stagnant exports
(Burma Ceylon Pakistan Indonesia and India) show negative effects Furthershy
more the relative sizes of the negative competitive effects (as well as unshy
favorable compositional effects) that have hindered export expansion are large
in some cases more than or close to one-half the total lag (A-D) However
the Philippines was able to offset her unfavorable compositional change conshy
siderably and Thailand more than sufficiently What is implied in Table 11
then is the importance of the competitive effect in influencing relative
export performance
1The country-by-commodity trade data for Malaya and Singapore are most ready available since these countries were the only reporting developingAsian countries in Commodity Trade Statistics until the latter part of the 1950s But they are excluded in Tables 11 and 12 and Appendix Table 17 since the trade data for these two countries are reported together for early years but separately for recent years other reporting countries (MDCs) do not consistently use the same definitiofi of these countries from year to year there are large reporting differences especially in Singapores trade figures probably because of its entrepot trade See Seiji Naya and Theodore Morgans project research paper The Accuracy of International Trade Data The Case of Southeast Asian Countries Journal of the American Statistical Association July 1969
The results based on combined figures for these two countries and which should be interpreted cautiously for the above reasons are as follows 919 (A) 4381 (H) -3661 (A-H) -3001 (H-D) and -4807 (A-D) Comparable results on the intra-regional trade pattern for the two countries are given separately in Table 16
43
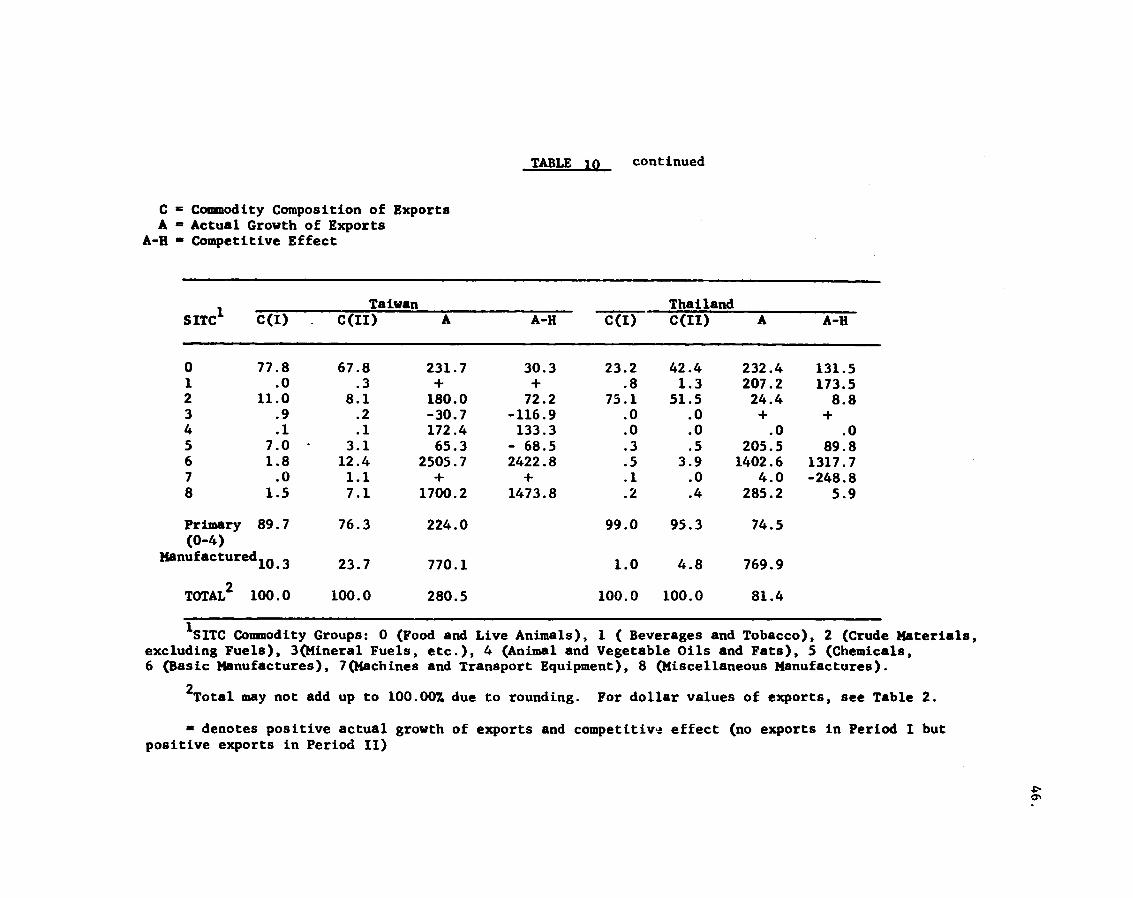
In order to determine which commodity groups are responsible for this effect the same computation was made for each comnodity group The results are given in Table 10 together with the commodity composition of exports1
The differences again are striking For Thailand the Philippines and Taiwan positive competitive effects are shown in a relatively large number of comshymodity groups The reverse is true for the other countries although numershyical values differ from commodity to commodity and country to country Furthershy
more in relating Tables 9 and 10 the negative (or positive) competitive effect of a countrys exports (Table 9 ) is shown to be largely due to the negative (or positive) values in primary products especially those that comprise a relatively large proportion of total exports (SITC Groups 0 and 2) That is given the slow expansion of these products in MDC markets the lag in export growth of many Asian countries can be attributed to their inability to maintain even this low growth rate of primary exports
Changes in commodity compositions and export increases by two broad categories primary and manufactured are shown in Table 10 together with total exports of Thailand the Philippines and Taiwan The experience of these countries stands in clear contrast to stagnation for the other countries The commonly held view that countries with high concentrations in primary exports perform poorly is not supported Thailand and the Philippines have done remarkably well and they have a high degree of specialization in primary
exports
1The hypothetical export growth for a given commodity used for this purpose is computed from the formula (page 39)
2The sluggish expansion of primary products inMDC markets (comparedto manufactured products) is reflected in low hypothetical increases (H) ofthese exports Numerical values of the increases for individual commodity groups are not shown in Table 10 They can be found by subtracting competshyitive effect from actual growth A - (A-H) - H
3Examinations of the three-digit commodity exports reveals that these two countries have been able to diversify within primary commodities therebyoff setting the decline of some traditional primary exports by increases ofothers (eg maize and kenaf in the case of Thailand lumber and minerals in the case of the Philippines)
Table 10
The Composition and Competitive Effect of Exports of Asian Countries by Commodity Groups
Averages of 1956-57 (I) and 1964-65 (I1) In PercentagesC - Commodity Composition of Exports
A = Actual Growth of Exports A-H = Competitive Effect
Burma Ceylon India
SITC1 C(I) C(nI) A A-H C(I) C(II) A A-H C(I) C(II) A A-H
0 673 510 -292 -1324 781 798 132 -155 326- 3081 0 0 99 1300 - 206 0 0 02 295 0 25 25 143 -150416 321 85 164 1513 20 -162 320 259 - 607 -46411 426 32 2 0 0 -402 74 4 -374 -8500 0 0 1 39 37 39 200 39 55 -845 -9060 0 0 -2000 6 6 142 -9586 23 60 8 9 217 -12521469 535 8 216 -758 2647 2 4 1300 911 7 374 646 -1191 1 2045 -215 2 68 1986 -1800 0 0 -2900 1 0 0 -3301 10 10 161 -3006
Primary 975 936 -102 986 985 108 716 602 -26(0-4)Manufactured 25 64 1411 14 15 213 284 398 626
(5-8)
TOTAL2 1000 1000 - 64 1000 1000 109 1000 1000 159
Table 10 continued
C Commodity Composition of Exports A = Actual Growth of Exports
A-H - Competitive Effect
SITC1
C(I) Indonesia
C(II) A A-H C(I) Pakistan C(II) A A-H C(I)
Philippines
C(II) A A-i
0 1 2 3 4 5 6 7
8
127 44
553 207 49
6 14 1
0
150 22
393 378 43
9
5
0
0
174 -486 -291 822
-136 520
-623 -494
387
-581 -602 -555 347
-338 -1194 -1891 -2622
-2877
55 1
890 0 0 2
41 3
9
51 0
699 1 0 2
221 8
19
-147 0
-279 +
0 - 53 3928 1241
2918
-430 -618 -541 +
- 19 -1524 3185 - 701
- 234
294 6
600 0
47 3
11 0
39
273 16
541 0
76 2
49 0
43
510 3351 465
+ 1621 435 6398
0
793
304 2505
81 +
1445 513
5761 -2285
-1604
Primary 980 986 3 945 750 -270 948 906 555 (0-4)
Manufactured 20 15 -292 55 250 3199 53 94 1915 (5-8)
TOTAL2 1000 1000 - 3 1000 1000 - 81 1000 1000 626
CONTINUED
TABLE Io continued
=C Comodity Composition of Exports A = Actual Growth of Exports
A-H - Competitive Effect
Taiwan Thailand SITC C(I) C(II) A A-H C(I) C(II) A A-H
0 778 678 2317 303 232 424 2324 1315 1 0 3 + + 8 13 2072 1735 2 110 81 1800 722 751 515 244 88 3 9 2 -307 -1169 0 0 + + 4 1 1 1724 1333 0 0 0 0 5 70 31 653 - 685 3 5 2055 898 6 18 124 25057 24228 5 39 14026 13177 7 0 11 + + 1 0 40 -2488 8 15 71 17002 14738 2 4 2852 59
Primary 897 763 2240 990 953 745 (0-4)
Manufactured 103 237 7701 10 48 7699
TOTAL2 1000 1000 2805 1000 1000 814
1SITC Commodity Groups 0 (Food and Live Animals) 1 ( Beverages and Tobacco) 2 (Crude Materials excluding Fuels) 3(Mineral Fuels etc) 4 (Animal and Vegetable Oils and Fats) 5 (Chemicals 6 (Basic Manufactures) 7(Machines and Transport Equipment) 8 (Miscellaneous Manufactures)
2Total may not add up to 10000 due to rounding For dollar values of exports see Table 2
- denotes positive actual growth of exports and competitive effect (no exports in Period I but positive exports in Period II)
47
In contrast to the varied performances of primary exports the rapid rise in exports of manufactures common to almost all countries is very encouraging (A notable exception is Indonesia with an absolute decline of 29 which is however understandable in view of the countrys political difficulties during the period covered) Some groups of manufactured goods have grown at rates even higher than the relevant import growth of the MDCs indicating positive competitive effects It is worth noting that those countries with expanding primary products tend to perform better in manufactured exports as well
Examination of commodity detail shows that much of manufactured exports are suitable to the factor endowments of this region Among these are textile products footwear plywood and leather These exports have expanded rapidly despite high import protection (especially high effective rates of protectshyion) generally accorded by MDCs on commodities of this type
3- Intra-Rexional Trade
Intra-regional trade (which is strikingly larger than that of other LDC regions) is analyzed here although the record is handicapped by lack of availability of adequate data
The share of intra-Asian trade of the individual countries varies widely ranging from 79 for Laos to 57 for Singapore and 50 for Burma to 6 for Ceylon and 4 for the Philippines (in 196465 Table 11) Most countries show a decline in this trade evident in the Lowered shares from 1956-57 to 1964-65 The large absolute decline of intra-regional shares for Hon- Kong and Indonesia stands out Deviating from this trend are Pakisttn Korea and the Philippines who have had rapid increases in their intra-regional
trade shares
Of course using intra-regional trade shares alone can be misleading A share may be kept fairly constant simply as a reflection of low growth of both total and regional exports as for Burma Or a share may fall at the same time regional trade rises rapidly ie exports to the rest of the world grow faster than intra-regional trade as for Taiwan Cambodia and Thailand The latter pattern is more encouraging than the former
The close association of the relative expansion of intra-regional exports with the export growth to the HDCs is interesting Intra-regional export growth rates for Burma and Indonesia(India also) are extremely low compared with those for the Philippines Taiwan and Thailand That is the latter
48
Table 11 Export Growth and Shares of Intra-Regional Exports Averages of 1956-57
and 1964-65
Country Total Exports (millions ofdollars)
Intra-Regional Ex-ports as of total
Percent Change in Value of
Total Intra-Regional
1956-57 1964-65 1956-57 1964-65 Exports Exports
Burma 2398 2315 518 505 -35 -60 Cambodia 445 965 358 316 1171 915 Ceylon 3587 4015 55 58 119 179 Hong Kong 5461 10775 510 220 973 -148 India 13252 17155 110 97 295 133 Indonesia 9257 6830 332 105 -262 -766 Korea 234 1470 137 234 5282 10734 Laos 12 12 833 792 0 -50 Pakistan 3493 5105 52 198 411 538 Philippines 4355 7545 26 37 732 1451 Taiwan 1333 4415 332 289 2312 1885 Thailand 3495 6100 542 466 745 501 Vietnam 628 420 134 151 -331 -244 Malaya 7260 9610 na 270 324 na Singapore 11285 9434 na 571 -164 na
Sources Data are taken from Direction of Trade for 1956 and 1957 and Direction of Trade A Supplement to International FinancialStatistics for 1964-65 except data for Malaya and Singaporewhich are taken from Yearbook of International Statistics for 1964-65
Note na means not available
49
countries perform well in export markets of both the MDCs and the regionand consequently in total exports the reverse is true for the former countries
Pakistan offers a contrast intra-regional and total exports have grownfast compared to its sluggish exports to MDCs indicating a directional changetowards intra-regional trade
A pronounced directional change away from intra-regional trade (thereverse of Pakistans) is clear for Hong Kong (Table 11) Its total exportsincreased 97 in contrast to the fall of its intra-regional exports by 15 from 1956-57 to 1964-65
The export and import commodity composition and shares of intra-regionaltrade are given together with the total trade of the region in Tables 12 andfor the years 1962 and 196515 Both tables show a considerable differencebetween the compostion of total trade and that of intra-regional trade
Intra-regional exports lean towards manufactured products more than do totalexports (Table 12) a surprisingly large proportion of total manufacturedproducts about 50 go to other countries of the region ( Of course theintra-regional trade share of manufactured products comprises only a small proportion of total imports of manufactures)
Primary commodities make up the largest share of both intra-regionalexports and intra-regional imports 63 and 73 respectively in 1965 Butrelatively small shares of total exports and imports of these primary productsgo to and come from regional countries (24 and 38 respectively in 1965)1
Although not shown here considerable differences exist in the tradecompositon for individual countries The intra-regicnal exports of CambodiaCeylon the Philippines and Thailand (also Burma Indonesia) are relativelyconcentrated in primary products Exports of Malaya Singapore Pakistanand Taiwan (also India and Hong Kong) are less concentrated2
1The pattern varies from commodity to commoditypattern is food trade One example of thisthere are considerable net imports for the regionsas a whole yet more than one-third of rice exports go outside the region
2The countries given in parentheses are not included in Tables14 and15 For Burma India and Pakistan 1965 trade data are not availableHong Kong is excluded because of its typical export structure (primarygoods are less than one-tenth its total exports in 1965)
50
Table 12
Commodity Composition of Total and Intra-Regional Expors of Selected Asian Countries 1962 and 1965
SITC Comnodity Groups Commodity Composition Intra-regional 2 ExportsCode
Total Intra-regional2 ( of Total) 1962 19653 1962 19653 1962 1965
0 Food amp Live Animals 260 281 280 279 326 287
1 Beverages amp Tobacco 9 8 8 5 279 166
2 Crude Materials excl Fuels 449 391 233 235 157 175
3 Mineral Fuels etc 50 47 92 91 557 568
4 Animals amp Veg Oils amp Fats 24 31 21 20 262 180
5 Chemicals 15 17 38 46 780 783
6 Basic Manufactures 131 159 165 169 381 308
7 Machines amp Transport Equipment 33 31 102 95 921 887
8 Misc Manufactured Goods 17 24 38 39 673 484
9 Unclassified Goods 11 11 23 22 606 571
0- 4 793 758 635 629 242 241
5 - 8 196 231 343 373 528 439
Total in 1000 1000 1000 1000 305 292
in $1000000 4011748249 1213114001
Source United Nations Commodity Trade Statistics various issues of 1962 and 1965
NotesN Countries included are the Philippines Singapore Thailand Taiwan Cambodia Ceylon Malaya and Pakistan
2 Intra-regional trade refers to exports of these above countries to countries listed under Other Asia in Commodity Trade Statistics
3 For the Philippines only 1964 figures are used
51
Table 13 Comuodity Composition of Total and Intra-regional Imports of Selected
Asian Countries 1962 and 1965
Commodity Composition Intra-regional
Code Commodity Groups Imports Total intraregiona 2 s Of tot)
1962 19653 1962 19653 1962 1965 0 Food amp Live Animals 164 165 239 281 4021 Beverages amp Tobacco
332 13 12 8 6 160 1032 Crude Materials excl Fuels 137 99 374 297 757 582
3 Minerals Fuels etc 103 83 163 121 4394 Animal amp Veg Oils amp Fats 284
14 15 14 23 276 2875 Chemicals
78 87 26 31 93 706 Basic Manufactures 204 209 88 131 120 1227 Machines amp Transport Equip 227 265 24 36 29 278 Misc Manufactured Goods 46 46 46 51 272 2169 Unclassified Goods 14 18 19 24 389 241
0 -4 431 374 797 728 522 3795 -8 556 608 184 250 91 80
Total in 1000 1000 1000 1000 287 195 in $1000000 4739 0 57966 13106 11204
Source United Nations Commodity Trade Statistics various issues of1962 and 1965
Notes 1 Countries included are the Philippines Singapore ThailandTaiwan Cambodia Ceylon Malaya and Pakistan2 Intra-regional imports are imports from those countries listedunder Other Asia in Commodity Trade Statistics3 For the Philippines only 1964 figures are used
52
The period from 1962 to 1965 is short Nonetheless the intra-regional
trade pattern points to a trend of declining intra-regional trade and to
relatively fast-rising manufactures and stagnant primary products In order
to better analyze intra-regional trade the export performance of individual
countries is discussed here with respect to the two effects competitive and 1compositional The results are summarized in Table 14 (The computational
method employed for this table is the same as that for Table 9 with the
growth rate of total imports of Asia S corresponding to D in Table 9)
The intra-regional export perforimances of Burma Indonesia India Hong
Kong and Singapore are extremely poor in comparison with those of Pakistan
the Philippines Korea Taiwan and Thailand A few qualifications are
however in order Because of the short period for which we have data the
results shown may be due to random fluctuations rather than to trends though
the results conform very closely to those for the longer period of Table 11
The results are also generally similar to those shown for these countries
traue with MDCs in Table 9
The different competitive effects provide implications for intra-regional
trade The countries performing poorly in intra-regional trade are generally
those with negative competitive effects (eg Burma India Indonesia Hong
Kong but not Singapore) Furthermore the negative competitive effects far
exceed the positive compositional effects In contrast the countries that
have been expanding their regional exports (Taiwan Korea the Philippines
Pakistan Thailand and Malaya) have positive competitive effects For Malaya
Pakistan and Thailand negative compositional effects have been more than
offset by positive competitive effects
The comodity breakdown of individual countries indicates that the positive
(or negative) competitive effects are due in large measure to the relative exshy
pansion (or decline) of intra-regional primary exports Furthermore as indishy
cated in Table 13 the intra-regional imports of primary goods declined absolutely
while total imports of these goods were rising The decline of the intrashy
regional primary trade of a few countries had a large dampening effect on total
intra-regional trade
IAs an example figures given for India are for the actual and hypothetical
growth of exports from India to Asia
53
Table 14
Competitive and Compositional Effects of Intra-Asian Trade by Country 1962-65 (in percentages)
Country Growth Rate of Growth Competi- Compo Differ-C yt es tive sitional ences in Export to Asia hsa EffectEffect Growth Rates
AsnActual Hypothe- Countries (A) tical (H) (S) (A-H) (H-S) (A-S)
Burma -439 58 125 -497 - 67 -564 Hong Kong 5 173 177 -168 - 1 -169 India -101 75 174 -176 98 -274 Indonesia -825 - 55 281 -770 -1106-336
Korea 2204 154 103257 1947 2050
Malaya 257 -163 64 420 -227 193 Singapore 157 52 281 106 -229 -124
Pakistan 1275 29 122 1246 - 93 1153 Philippines 1130 768 205 563362 925
Taiwan 702 125 62187 515 577 Thailand 197 142 -185-44 241 55
Notes Data are taken from United Nations Commodity Trade Statistics various
issues of 1962 and 1965 All figures listed are based on import of Asian countries which include
(1) Ceylon (2) Cambodia (3) Malaya (4) Singapore (5) Pakistan (6)Taiwan and (7)Thailand Asian countries which in some cases do not clearly break down imports from particular countries by SITC one-digit codes are excluded for the listed countries concerned The following gives (inparentheses) those Asian countries considered for each of the listed countries
Burma (1 3 4 5 7 above) Malaya (1 2 4 5 6 7)Hong Kong (1 3 4 5 6 7) Singapore (1 2 3 5 6 7)India (1 through 7) Pakistan (1 2 3 4 5 6 7)Indonesia (1 2 3 5 6 7) Philippines (3 4 5 6 7)Korea (3 4 6 7) Thailand (1 3 4 5 6)
54 The negative compositional effects shown for many countries suggest that
Some intra-regional trade decline is due to the small proportion of manufactured goods exports set against the large import requirements of thosm products by countries of the region This trade-reducing effect is likely to continue in the future at a declining rate since most regional counties have been expandshying their manufactured goods exports rapidly
The trend is significant because it is to these very fields that importsubstitution policies are directed and so high protection is accorded The strength of comparative advantage in manufactured goods for the regional counshytries is much greater than it is generally diagnosed And in time a tendency toward more economic cooperation among the countries of the region may facilishytate the exchange of manufactured goods1
The pattern of Asian country exports to MDCs and to their intra-regional neighbors is similar We have not found any significant association between the high concentration of countries such as the Philippines and Thailand and the stagnant performance of other countries such as Burma Indonesia and India A shift increasing the share of manufactured exports is taking placeand should be encouraged to offset the relative stagnation of primary exports The latter has probably been caused in part by heavy industrialization programspursued by many countries in the region tending to divert resources away from production of primary commodities and to push aside the difficult but necessary problems of improving the agricultural sector
The material above has been mainly based on descriptive trade data Ascertaining why these Asian countries perform as differently as they do is another range of inquiry But it is likely that more favorable export pershyformances are largely due to the relatively outward looking economic and
IA greater exchange of commodities especially manufactured goods isentral to the existing and proposed plans for economic cooperation among Asiancountries although progress in this direction so far seems more apparent thanreal --see Theodore Morgan and Nyle Spoelstra eds Economic Interdependencein Southeast Asia (Madison University of Wisconsin Press)
55
trade policies of certain countries (eg Thailand the Philippines Taiwan)and poorer performances tc_the inward looking policies of other countries (eg Burma Ceylon India) In the former countries economic planning is generally adopted to maintain the framework in which economic activilies arepursued by individuals and private firms with a minimum of government intershyvention in the latter countries economic activities are more directly conshytrolled by government
Import substitution policies have in various forms been common to all these countries But outward-looking countries have been more selective in the application of the policy than inward-looking countries Outwardshylooking countries have also exhibited greater concern for economic efficiencyand a tendency toward de-control (ie away from exchange and import control as in the Philippines and Korea in recent years) In Taiwan for a product to be eligible for the import control list the domestic producer has had to show that his factory cost would not be more than 15 above the cif import priceof a similar product 2 Variations in export performance seem in part to be explained by built-in-bias against exports in large-scale import substitution3 programs
1Cf Hla Myint The Inward and Outward Looking Countries of SoutheastAsia and the Economic Future of the Region Research paper 7 February 1966K C Sen The Inward-Looking and Outward-Looking in Southeast Asia Projectpaper of January 1965 Cf also Barend A DeVries The Export Experience ofDeveloping Countries World Bank Staff Occasional Papers 3 InternationalBank for Reconstruction and Development 1967 esp pp 11-15 60-63 43-47 2IMF Annual Report on Exchange Restrictions 19643It is interesting to note that even some of the strong advocates ofprotection have recently expressed considerable disenchantment with the disshytorting effects of excessive protection Mr Raul Prebisch for examplecautions that customs protection has been indulged in excessively and bylimiting competition from abroad has frequently given rise to internal reshystrictive practices or monopolistic combines that weaken the incentive toobtain satisfactory levels of productivity (Raul Prebisch SurmountingObstacles to a Latin American Common Market pp 141-142 in MS Wiconezeked Latin American Economic Integration Frederick A Praeger Inc 1966)
------------------------------------------------------------------------------------------------
Table 15
THE COMPOSITIONAL AND COMPETITIVE EFFECTS OF LESS DEVELOPED ASIAS EXPORT TO MORE DEVELOPED AREAS 1956-57 to 1964-65
(in percentages)
Growth Rate of Actual Growth Southeast Asias Rate of Developed
Developed Countries
Exports to the Developed Areas
Areas Total Imports
Composi-tional Effects
Compe-titive Effects
Differenre in Growth Rates
Actual Hyposhythetical
(A) (H) (D) (H-D) (A-H) (A-D)
US 2913 2494 5633 -3139 419 -2720 UK 603 1852 4100 -2248 -2455 -4703 EEC 2038 4439 9532 -5093 -2401 -7494 Japan 8672 9344 11427 -2083 - 672 -2755 Australia 3271 7494 8519 -1025 -4223 -5248
TOTAL 2774 4381 7581 -3200 -1607 -4807
--
57
C- Cutting transportation costs
Transportation costs like administrative blocks to the movement of goods reduce the potential gains from regional specialization Goods that are relashytively heavy and bulky compared to their value -- which are most goods moving across national boundaries in Southeast Asia -- move by water Is there much room for reducing the costs of ocean transportation in the region
Water transportation costs can be divided into tjo types The first is the expenditures most governments make in providing for waterway and port facilities These costs are indirect as far as the ship owner is concerned The second type is the costs incurred by the carriers directly This cost category consists of two components the capital costs of acquiring equipment and operating costs Permanently reduced freight rates are primarily dependent
on lower costs of operation
Most of the operating costs are port costs Sixty to seventy percent of the cost of transporting cargo at sea is accounted for by what takes place while the ship is at the dock and not by steaming time 1 From the frequent surcharges imposed on shipments to and from Southeast Asia it seems highly probable that a figure near the upper limit is relevant to that area For example a recent study found that delays that could be controlled or avoided
waiting time for pilots tugs barges berths stores and clearance of customs papers --were responsible for more lost time than unavoidable delays such as those due to adverse weather and tides2 There appears to be much scope for improvement
Insurance for the ship and crew is to some extent affected by the degree of congestion of the ports the ships call at and a country can lower the insurance premium paid by the carriers through port improvements Although this part of cost reduction is small compared to other cost reductions achieveable through port improvements from the shipowners viewpoint there may be implication in vigorous action here of other government action to lower port costF that are likely to have a greater final effect on the carriers
costs structies
1DC MacMillan and TB Westfall Competitive General Cargo Ships
(Society of Naval Architects and Marine Engineers November 1960) p2
2NewYork Times (February 21 1965) reviewing a study by the Socony
Oil Company
58 Measures to lower operating costs can also be taken by ship owners
The scope for government action is wider than that for the carriers But there is close relationship between actions taken by the two parties a change by one will have repercussions on the other For example technoshylogical innovations in shipping equipment that require facilities other than those currently available in ports will encourage installation of such facilshyities or else the innovation will not be generally adopted
There is no unique cause-effect relationship between port improvementand carrier innovation However a good case can be made for the portsbeing the major causal factor Ports require huge long-term investments At the time that investment is made the port facilities are adapted to the existing or immediately foreseeable shipping technology The ships on the other hand while requiring large capital investments and having a life of twenty to thirty years are relative to ports short-term investments A ship owner who builds a new ship adapts his ships design to the expected ports
Another means of reducing operating costs is the introduction of largerand more efficient equipment by shipowners This policy is generally limited at present to tanker operations Possible cost reductions are large a tanker of say 65000 tons can operate profitably at rates that would drive a 20000 ton tanker into bankruptcy But tankers cannot carry dry cargoand a dry-cargo ship requires dock space and depth Unless the major portsof the world undertake dredging and enlarge berths dry-cargo ships as large as the modern tankers will be restricted to a very few ports
Innovation by carriers in the field of cargo stowage appears to be thebest cost reducing action they can take Increased use of pallets and conshytainers has been the most important development in this area
Pallets and containers reduce cargo handling and make possible the useof smaller gangs It has been estimated that the use of containers can cut terminal costs by fifty percent on the average and that US ship operatorsin coastwise trade have reduced this costs to one third of the costs faced in the break-bulk system used previously1 An additional advantage of conshytainers is the protection they give against pilfering and rough handlingSuch losses are greater where labor is unskilled and illiterate The gainsin this respect would be particularly great in LDCs
ISee Times (London) January 3-4 1962 quoted in JL Eyre The UnhappyMarriage paper delivered at the American University School of BusinessAdministration (Washington DC May 22 1963) p 5
59
Despite the advantages of using pallets and containers their rate of adoption has been slow Income is lost by many of the participants in marishytime transportation services stevedores forwarders truckers and the port authority Customs procedures are insufficiently flexible for container shipments since ordinary procedures require inspection at the pier rather than at ultimate destinati n A further problem is the balancing of inward and outward use by individual carriers container pools such as those found in Europ can reduce this potential cost
In addition to institutional blocks and delays the use of containers in Southeast Asia has been hampered by the costs of acquiring containers redesigning stowage space and the heavy port installations required Further internal transportation facilities to move the containers are inadequate in most countries of the region In consequence the region is only in the early stages of considering pallet and container port facilities Increased capashycity of ships and quicker turn-around time in more efficient ports like Singapore and Hong Kong seem to be compensating for the extra some five days required now that Suez is closed to sail around the Cape of Good Hope The sharply competitive tramp-shipping trade is expanding
The issues of containerization are therefore being uncertainly antishycipated and faced Hong Kong is cautious Colombo has already one container berth Singapore has built one wharf for bulk cargo There is general rather rapid expansion in port tonnages handled with sharp decline during the past several years in Burma a sharp exception to the trend1
In summary reduced port congestion and innovation in cargo stowage and handling appear to be promising avenues to lower operating costs and hence lower freight rates The scope for governmental action here is wide Futhermore regional cooperation in developing more efficient ports and providing the facilities for containers and container pools on a common standard could bear considerable fruit In these ways the countries of Southshyeast Asia can benefit from a reduced freight bill on their trade both intrashyregionally and with the rest of the world
1Some data on recent shipping volume policies and problems are givenin Far Eastern Review Oct 31 1968
60
D- Asian commercial policies and the possibilities of expanding regional trade
1 Introduction
Tariffs and quantitative restrictions restrict international tradeand administrative practices can do so This section seeks to ascertain the Asian countries that are most likely to cooperate toward expanding their trade by changing their conercial policies To make such a selection we must have a set of criteria in mind for predicting the most likely candidates for
cooperation
In part 2 we examine some recent theoretical contributions on commercial policy bargaining and customs union formation First to be considered is the orthodox approach developed by Viner and extended by Lipsey Meade and Vanek which focuses on the effects of a customs union on welfare derived from personal consumption A second approach to the problem developed by Johnson Copper and Massel will then be presented It defines welfare more broadly to include a collective preference for industrial production Finally the view of trade expansion problems of the developing countries themselves expressed in the UNCTAD document Trade Expansion and Economic Co-operation among Developing Countries will be presented as evidence for emphasizing the selection criteria implied by the second approach
In part 3 of this section the status of quantitative restrictions in nine Asian countries are examined and recent trends defined Part 3 will
- examine tariff schedules primarily of the countries that make the least use of quantitative restrictions Quantitative restrictions are usually more important in checking and blocking trade flows than are tariffs Hence there is considerable presumption that countries making the least use of quantitashytive checks on trade (the most use of tariffs) are the most likely candidates for regional cooperation to facilitate trade flows
2 Theory
(a) The potential gains from freer trade are well known They are assuming unrealistically no influence on the rate of change of technology
skills and organization
61
i - increased specialization according to (even assuming unchanged averagecosts) comparative efficiency
ii - increased realization of economies of scale andiii shy increased efficiency through more specialization among the resources
used -- labor and other resources
If countries have different factor endowments (which includes the subtleshyties of skill and organization differences) and hence different relative cost structures each country can raise its real income through fuller participation in international trade By specializing in the products that can be produced domestically relatively most cheaply and trading a part of these products for other products produced relatively most cheaply by othercountries each country can transform its given factor endowment into a greater quantity of output than it could otherwise
Economies of scale can be achieved by expanding the size of the market Domestic markets especially in LDCs may not be large enough to permit existshying firms to take advantage of the fact that costs can decline as output inshycreases or to permit the building of new plants whose scale is optimal in the sense that they have the lowest possible unit costs
External economies may also be realized by expansion of the market The expansion of one firm in an expanding market can induce the expansion of others if the expanding firm either produces more cheaply an input for other firms or provides a market for the output of the other firms Other external economies such as increased diffusion of technical knowledge and organizational ability can result from non-market inter-action among industshyries To the extent that commercial policies especially administrative practices are applied arbitrarily or on an ad hoc basis the freeing of trade can produce external economies by reducing the risk and uncertainty of international transactions
Where commercial policies protect inefficient firms an increase in competition brought about by freer trade forces a more efficient allocation of resources in all trading countries Increased efficiency may also result from the increased specialization of labor that freer trade makes possible
62Having briefly described the gains that can result from a reduction intrade barriers we move to a discussion of the methods countries can use to
bring about a reduction in barriers to trade The most obvious method for reducing trade barriers is for a countryunilaterally to remove its restrictions on foreign products Governments
are often reluctant to take such steps because they fear that they will losetheir bargaining power in future attempts to induce other countries to lowertheir barriers Or if restrictive commercial practices were originallyinitiated to improve a countrys terms of trade by exploiting monopoly powerunilateral reductions are unlikely Where commercial policies are used toinfluence the domestic distribution of income and employment so as to favor a particular factor of production or power group uncompensated or unilateralreductions in restrictions are not to be expected A final reason why unishylateral reductions in restrictions are unlikely is the infant industry argushyment which has special appeal to less developed countries
Reductions in trade barriers are therefore more likely to be achievedby negotiation than by unilateral action Negotiations under the rules ofGATT should be based on the principles of non-discrimination and reciprocityThe direction of negotiations under these limitations is likely to be shapedby the advanced internationally competitive countries who can offer access to a large well-protected market in return for concessions granted
International negotiations have therefore tended to focus on productsof particular interest to the relatively advuaced countries indirectly disshycriminating against third parties especially less developed nations Forexample the Kennedy Round negotiations were dominated by the products ofspecial interest to the United States and the EEC countries GATT rulesthrough anti-dumping provisions also prohibit the subsidization of exportsLess developed nations faced with balance of payments problems limiteddomestic markets and infant export industries are likely to find export subsidization particularly attractive
GATT rules do sanction customs unions free trade areas and commonmarkets all of them exceptions to the principles of non-discrimination andreciprocity Regional integration schemes are attractive means for lessdeveloped nations to expand exports and to negotiate trade barrier reductions on products of mutual interest so evading the GATT limitations on exportsubsidization and the general requirements of non-discrimination and reciprocity
63
(b) (i) Much of the discussion of regional integration has been in terms of static effects on the allocation of resources that is of increases in specialization according to comparative advantage Viner Meade Lipseyand Johnson have used the traditional definition of welfare based on the pershysonal consumption of goods and services to analyze the effects of changes in the allocation of resources caused by the formation of a customs union Their analysis reduced to barest essentials concludes that there will be gains in welfare for the countries forming a customs union to the extent that the reduction in protection within the union permits a shift toward lower cost sources of supply ie trade creation There will be losses in welfare for the countries of a customs union to the extent that a high external tariff causes the substitution of a higher cost source of supply for a lower cost source of supply from outside the union ie trade diversion
However Lipsey points out that the possibility of substitution in conshysumption qualifies the claim that a trade-diverting customs union alwayslowers welfare By providing the members of the customs union with a wider choice of consumers goods the union can permit a consumer shift to higher utility goods that is the relevant domestic price ratios may diverge more from the union-wide price ratios than from the previous international price ratios
(ii) To go more in detail From the trade-creation-trade-diversion analysis a number of causes can be identified that shape the size of the gains or losses resulting from a customs union (i) The gains from trade creation are larger th greater the differences in relative cost ratios of the countries considering union This is true because the greater the differences in relative cost ratios the greater the scope for specialization according to comparativeadvantage (ii)the losses from trade diversion to the countries forming a customs union are smaller the more competitive and the more similar the goodsthey produce as compared with non-union economies The more these conshyditions hold true the less likely are substitutions of high cost sources of supplies within the union for supplies previously obtained from outside (iii) A customs union moves prices toward the relative price pattern (rates of transportation) of partners and away from the relative price pattern(rates of transformation) in the world outside We therefore expect gainsfrom customs union formation to be larger the greater the proportion of preshy
64
union trade among the prospective members and the smaller the unions volume
of world trade relative to internal production Pre-union trade is evidence
that potential partners are efficient producers whose costs do not exceed world
costs The smaller the ratio of world trade to domestic production the smallshy
er will be the share of supplies from outside the union whose prices are reshy
latively low
Harry Johnson supplements the above reasoning Among his points A
country is more likely to gain from trade creation the higher the initial
level of its tariffs the more elastic is domestic demand for the partners
goods and the more elastic the supply of goods that the partners export A
country is less likely to lose from trade diversion the less elastic are the partners supplies and the less elastic the worlds supplies the less the subshy
stitutability between goods from partner and foreign sources and the lower the tariff on foreign sources after union is formed relative to the pre-union
level
(iii) The preceding analysis is weak as a guide to policy on two grounds
First LDCs are likely to be concerned with their balance of payments position unemployment repercussions inflation implications redistribution
of domestic income and social and political implications of the structural
changes expected in the economy
Second the static orthodox analysis is too limited It employs a defshy
inition of welfare -- the current utility derived from personal consumption of
goods and services -- that is too narrow Loss from trade diversion is normal
among LDCs (that is they are likely to have higher costs in many products
than the outside-of-union MDCs) But they can often and reasonably hope for
offsetting long-run gains through the dynamic improvements mentioned above
feedbacks toward eventual higher skills better organization and the like
Any losses to HDCs may earn a lower emphasis in the total calculation
The static analysis ignores the possible gains from economies external
to the firms that expand (or losses from external die-economies to the firms that contract) Possible economies of scale within the firms need emphasis
and possible business cumulative (business cycle) effects should be considered
The business cycle effects alone can be more important than all the static
effects
65
Dynamic effects primarily the effects on efficiency over time are crucial Long periods of time are necessary to work out the effects of cuts in trade restrictions (How much gain was there immediately from eliminating tariffs among the fledgllmg colonies that formed the United States) Expectations are shifted for the pattern of trade in the years ahead and the impact of those shifts are eventually fundamental The shaping of trade toward a regional network isa basic change
These long-run dynamic effects in outline to be predicted only unshycertainly and in detail usually impossible to predict can easily comshypletely swamp effects predicted in the static kinds of reasoning The static analysis can be nearly irrelevant and if its predictions are taken as indicating the direction of dynamic change it will often be misleading
The rate and pattern of growth of the LDC economies in a union over 1020 and more years after the union is formed are the crucial questions Clues May be found in the static analyses they may also be found more uncertainly and vaguely and also more relevantly in the wide range of other economic and non-economic considerations
(c) Concern with their mixed objectives in addition to the level of income at a point in time has led less developed nations to view industrishyalization as a very desirable goal They argue that external economies especially those arising from the diffusion of technological knowledge are most likely to be found in the manufacturing sector The fact that manushyfactured goods tend to make up a large proportion of imports in less develshyoped countries makes them likely to believe that import substitution which will also improve their countrys balance of payments position is desirable (cf Chenerys view) The terms of trade of primary products compared to manufactured goods are often asserted to be deteriorating (Prebisch) To the extent that foreign factors are concentrated in the export sectors
ISee R F Mikesell The Theory of Conmnon Markets as applied to RegionalArrangements among Developing Countries in International Trade Theoryina Developing World R Harrod and D Hague eds Macmillan London 1963also Organization for Economic Cooperation and Development InternationalEconomic Integration among Development Countries mimeo Paris May 1968 esp pp 3-28
66
the desire to minimize the leakage abroad of future earnings or to maximize the re-investment of future earnings will cause the industrial sector to be preferred over the traditional section (Levin) Finally the historic experience of most of the advanced countries confirms a pattern of developshyment led by rapid growth of the industrial sections (Kuznets)
Cooper Masseland Harry Johnson have developed approaches to the analysis of commercial policy formation that take explicit account of the existence of a collective preference for industrial production Johnson points out that the orthodox approach which focuses on the gains in personal consumption arising from the trade creating effects and the losses from trade diverting effects of a union always leads to advocacy of free trade which is attainable by unilateral action Cooper and Massel point out that the total effects of a customs union results from two processes a tariff lowering trade and income creating step and a tariff raising trade and income diverting step Since unilateral action can achieve gains from the first effect without suffering losses from the second customs union formation according to the orthodox analysis would always be inferior to a unilateral reduction in barriers to trade
To explain such real world phenomena as conercial policies tariff bargaining and the limited conditions under which countries are likely to begin customs union negotiations these authors employ a broader definition of welfare They recognize an association between welfare and personal conshysumption similar to that of the orthodox analysis but in addition they posit that people enjoy increased welfare derived from the collective consumption of domestic industrial production Trade restrictions provide resources to satisfy collective preferences fcr industrial production by placing a tax on the consumer the proceeds of which are transferred to the industrial proshyducer who is unable to compete in the world market
Protective commercial policies can be thought of as an additional resource which the economy uses efficiently when the marginal collective utility from industrial production is equated to the marginal private cost of protection In such a formulation we can not make judgments about the goodness and the badness of orthodox trade creation and trade diversion Trade creation within a customs union results in gain in consumer welfare since consumers obtain goods at a lower cost however trade creation means a decrease in
67
welfare to the extent that a country loses industrial production Trade
diversion results in a loss in consumer welfare through increased costs of
goods and services but in gains by increasing domestic industrial production
This formulation helps account for the facts of tariff bargaining and of
estimates of advantages of customs unions among less developed nations A
reduction in protection implies a reduction in psychic income (through losses
in industrial production) which can be compensated for by less protection
among partners (allowing a rise in industrial production) Countries with
strong competitive positions would be likely to seek such partner concessions
on a multi-national basis But countries with weak comparative advantage in
industrial production could expect to gain little from increased industrial
exports within the union and would suffer from increased competition from
within the union
Discrimination in the guise of a customs union offers a fairly efficient
country a chance to increase industrial exports without suffering losses in
its own industrial production That is countries find that they can satisfy
their preference for industrial production more cheaply than they could in
isolation Each encourages the others exports through granting preferential
entry within the customs union
We have been stressing the factors affecting gains and losses to welfare
when there are changes in industrial production In so far as industrial
production is a goal the most likely candidates to gain industrial productshy
ion by establishing a customs union are countries
i) with a strong and nearly equal preference for industrial production
ii) with weak comparative advantage in industrial production compared to the world
iii) whose comparative advantage ratios differ so that they will each have a profitable basis on which to exchange industrial production and
iv) whose kinds of products are complementary rather than competitive
68
The Coopfr Hassel and Johnson approach does not replace the orthodox approach They have presented reasoning that only qualifies gains and losses
to personal consumption as ordinarily defined
(d) We conclude our discussion of the theory of comnercial policy
formation by listing problems that were broi ht before the 1968 Delhi meetshy
ing of UNCTAD by the less developed nations (UNCTAD Trade Expansion and
Economic Co-operation among Developing Countries 1968)
The UNCTAD document presents the less-developed economy view of the gains from trade Trade is seen not as an end in itself but as a means to foster development Increased exports are needed to pay for the increased imports that usually Rccompany a development effort A market widened by trade is desirable because it enables economies of scale to be captured Greater speshy
cialization of labor and a certain amount of external competition increases
efficiency in line with the general objective of industrialization and
development
Nowhere in the discussion of the gains from trade is increased specialshyization according to the existing pattern of comparative advantage presented as gain Trade is viewed as means of securing industrial development more
effectively Increases in income from a more efficient allocation of resources in the more traditional sectors of the Pconomy are not a concern
UNCTAD discusses a number of influences on the rate of development which therefore should be considerations in the negotiating process
i) The more severe the balance of payments problems of a countrythe more sensitive it is to a possible greater increase in imports than in exports
ii) The greater the disparity in tariff structure before negotiations the greater the problem of establishing an external tariff
iii) The more the reliance on commercial policies to earn government revenue the greater is the readjustment in fiscal policy necessitated by a customs union
iv) The more rapid a countrys rate of inflation the more difficult are payments adjustments within a union
v) The greater the disparity between levels of development the more sensitive a country is to unequal gains in industrial production resulting from the union and the more importantis the problem of compensation within the union
69
vi) The greater the preference for industrial production ofpotential members the more important will be the need forcompensation to insure equitable distribution of economies of scale and external economies arising from the union
3-Quantitative Restrictions
Below is a subnary of a survey of quantitative restrictions in nine Asian countries from 1961 to 1967 Part a contains an overview of the kinds of comercial policies followed by these nine countries A comshyparison of the two years 1961 and 1967 is made and important trends
noted
Next specific restrictions on current account in 1967 are compared to restrictions in 1961 On the basis of their 1967 position the nine countries are divided into three categories relatively unrestrictive moderately restrictshyive and severely restrictive Next an attempt is made to determine the relative positions of these countries within a particular category A rather detailed schedule of changes in current account restrictions for the nine countries is made On the basis of this schedule the countries are divided into those movshying toward freer trade and those having made changes in both directions
Then the nine countries are surveyed as to their treatment of foreign capital in 1967 Policies toward inflow and outflow are noted
When examining comercial policies one is confronted with maze of specific details pertaining to a myriad of international transaction The form the sumshymary below has taken is dictated by the two aims of this survey to present a survey of commercial policies in developing Asia today and to assess the directshyion of change in these policies over the years covered Numerous details concerning the policies of particular countries are excluded
(a) A Survey of Asian Counercial Policies 1961-1967 In Table 16 an assessment of the 1967 position of Asian countries is made
with respect to particular commercial policies and important trends toward the changes in the use of particular commercial policies are noted Where given restrictions or characteristics exist they are marked by an X
Fixed exchange rates usually based on the par value of a countrys currency as established with the IDW have been maintained by five of the countries
surveyed
Table 16
Asian Commercial Policies
67 61 67 61 67 61 7 61 67 61 67 61 67 61 67 61 67 61
0 to 0 -4 0
94
Exchange Rate Agreed Par Value x x x x x x x Par Value Applied x X x x x xx
Unitary Effective Rate Fixed x x x Free x x x Pegged x x x
Special Rates for Capital Transactions x x x Import Rates diff from Export Rates x x x x x Multiple Import Rates x x x x Multiple Export Rates x x x x x
Trade Restrictions On Current Account x x x x x x x xx x x xx x x On Capital Account x x x x x x x x x x x x x x x x
Preecriptions of Currency x x x x x x x x x x x x x x x x
Bilateral Payment Agreements x x x x x x x
Import Surcharges x xx x Advanced Deposit x x x x x x Surrender of Export Proceeds x x x x x x x x x x x x x x x x xx
Part of a Monetary Area x x x x x x Participates in Economic Cooperation x I -
Source INF Annual Report on Exchange Restrictions 1961 1967
71
In the period 1961 to 1967 there has been a movement toward fixed exshy
change rates and the establishment of par values with the IlF The former
British colonies of Burma Ceylon and Malaysia replaced exchange rates pegged
to the British pound Thailand replaced its freely fluctuating exchange rate
and the Philippines replaced its system of multiple exchange rates Contrary
to this trend Burma and Indonesia have moved from their application of a
fixed rate toward the use of multiple exchange rates Pakistan uses multiple
exchange rates to subsidize some exports and to encourage some capital imports
Korea has freely fluctuating rates
Among these countries restrictions on current account range from extensive
state trading in Burma to the absence of any quantitative restrictions in the
Philippines (A detailed survey of current account restrictions will be made
in the next section below)
All Asian countries except the Philippines have restrictions on capital
movements Most countries especially former colonies discriminate between old and new or approved investments Repatriation of old capital is
considered on an individual basis while new capital is in general treated
much more liberally (A detail survey of capital account restrictions will
be made in sections c below)
All countries except Thailand list prescribed currencies with which intershy
national transactions must be made In the last seven years this list has
been widened considerably usually to include the currencies of European countshy
ries All countries require the surrender of export proceeds
Import surcharges have been increasingly used to counteract balance of
payments problems or to raise revenue for defense purposes They are now in
effect in Indonesia Pakistan Ceylon and Taiwan No trend in the use of
advance deposits is apparent for Asian countries as a whole Three countries
have introduced them two countries have abandoned them
There has been a general trend toward bilateral payments agreements
reflecting increased trade between Asian and Communist Bloc countries Ceylon
Pakistan and Malaysia are members of a larger monetary area the Sterling
Area Pakistan participates with Turkey and Iran in a program of regional
cooperation
72
(b) Quantitative Restrictions on Current Account
With the aid of Table 17 the present level of import restriction in
various Asian countries can be evaluated The Philippines Thailand and
Malaysia are the most free of import restrictions although no country
allows completely unrestricted imports The Philippines prohibits imports
of some agricultural products for protective purposes Thailand had in
1967 quantitative restrictions on ten items and Malaysia has prohibited
certain agricultural and industrial products and has recently imposed a
number of quantitative restrictions pending an increase in tariff rates to
protect pioneer industries
The imports of Korea Pakistan Taiwan and Ceylon face more regulation
than do the imports of the Philippines Thailand and Malaysia In lorea
and Pakistan most imports are free or subject to open general licensing
In Korea 87 of imports are made under open general licensing 142 items
require approval and 362 items are prohibited for protective reasons In
Pakistan most items are on the free list and may be imported without quantishy
tative restrictions Licenses for other items are allocated to industries
on the basis of the industrys importance in the nations development program
An industrys ability to earn foreign exchange is considered when import
licenses are issued Importation of some items is prohibited for protective
reasons
Taiwan requires specific licenses for all imports Import quotas are
allocated to industries on the basis of their importance in the overall
development program and their ability to earn foreign exchange In 1964
Taiwan declared that to be eligible for protection an industry had to show
that its costs were not more than 15 above the products import price
Ceylon requires a specific license for all imports A state monopoly
imports forty items Most luxury imports are prohibited
Indonesia and Burma have the most restrictive import regulations Burma
practices state trading and private importers are generally not permitted
In Indonesia most imports have been subject to quantitative restrictions and
sharply differentiated multiple exchange rates
73
Table 17
Current Account Restrictions
67 61 Go 61 67 61 67 ol67 61 67 61 67 61 67 61 67 61
4 0
-4 00 V-4
0d
IMPORTS Open generally or automatishycally approved x x x x x
Free x x x x
Specific licensing and quota xi x4 x x x x x x x x x x
2 3 Prohibited x x x x x
With export vouchers only x
6 State trader x x x
Multiple exchange rates to allocate iLejrts x x
EXPORTS 5 Approval or license required x xx x x x x x x x x
Free x x x x x x x x
Prohibited x
State trader x x
Notes 1 Import of sugar and wheat flour are restricted for protective reasons 2 Import of textiles and most other light manufactured goods from
Communist China are prohibited 3 A few agricultural products are prohibited for protective reasons 4 Ten items still require licenses In 1961 72 items required licenses 5 Rice export is subject to government approval 6 The statecontrols the import and export of about 40 items 7 Korea permits the import of 2984 items on open general license 142 items
required individual licensing 362 items are prohibited The export of a number of raw materials is prohibited
8 Pakistan requires import licenses for most important industrial input 9 Those goods on the free list as well as those which require licensing
are subject to multiple exchange rates
Source Annual Report or Exchange Restrictions International Monetary Fund 1961-1967
Table 18
SIGNIFICANT CHANGES IN CURRENT ACCOUNT POLICY
1961 1962 1963 1964 1965 1966
Government requir- Quotas establighed ed to purchase for TVs table locally goods fans rice mift
Rice import Licensing of Quota on Thai Central govern- whose imported machines bicy -oa
control scheme Soviet Bloc poultry removed ment places price less than and certain tightened sugar removed quotas on 101 107 below the chemicals
MALAYSIA items domestic price Wheat flour im-Licenses are re- port prohibited quired for the Quota removed for import of iron tires and copper and steel bars wire
Registration fee of 504m per ton for ru~de export
Requirement that
PHILIPPINES
Importers of decontrolleditems permitted
Quantitative restrictionsremoved from None None
20 of export -ceeds be surrendb ed at the offi- Export licensing
to use own en
importsoFree
cial rate removed market rateabolished
by Central Bank abolished
Par value export rate established
Export of eggs Cigarettes gunny Prior approval Export control Duties raised rice require bags and timber for export of Import control over sorghum on 10 items specific licens- subject to import large quantity over nickel amp Import license quantity res~L-1 in license of rice required paper established for rice milling tions on 15 items Import of steel Rice price sta- Import restric- machines enamel Export license drumbs fish bilization plan tion on tires ware amp cotton for rice chemicals and establish and tubes yarn discontinued motor vehicles require specific license
Source Survey of Commnercial Policies International Monetary Fund 1961-1967
75
These countries can be ranked according to the degree of current account
restriction they practice The Philippines is the least restrictive followed by Malaysia and Thailand Then come Korea and Pakistan Taiwan comes next followed by Ceylon which practices a great deal of import restriction
Indonesia and Burma are the most restrictive countries surveyed
The pattern of export control is like the pattern of import control Exshyports are in general free of restriction in Malaysia the Philippines Thailand
Korea and Pakistan Exceptions are government control of rice export in Thailand and prohibitions against the export of a few essential products in Pakistan and
Korea China Ceylon Indonesia and Burma require approval for all exports No approval for private exports has been granted in Burma since 1963
Table 20 illustrates the most important changes affecting the current account position of three countries From this kind of table trends toward
increasing or decreasing control can be ascertained which may forecast a countrys
future position on quantitative restrictions
Burma and the Philippines have undergone the most radical though opposite
changes in the use of quantitative controls Between 1963 and 1964 Burma nationalized all international trade Beginning in 1960 the Philippines in contrast gradually abandoned all quantitative restrictions and multiple exchange rates By 1967 the Philippines had become the least restrictive country in Asia
Pakistan and Korea have gradually moved away from quota restrictions
Thailand Ceylon and Malaysia have moved toward increased restrictions Ceylon made the greatest change moving from the application of open general licensing for most categories of imports in 1961 to quantitative restrictions and state
monopoly in 1967 Malaysia temporarily increased quantitative restrictions to protect pioneer industries while tariff increases were being considered
Indonesia although remaining in the most restrictive category liberalized its position considerably moving from a position of 80 state trading in 1961 to the position of issuing licenses to private importers on a quota basis in 1967
These countries can be classified as to whether or not they have been inshycreasing or decreasing current account controls Burma and Ceylon have inshycreased restrictions the most Malaysia and Thailand have made moderate inshycreases in quantitative restrictions Indonesia Pakistan Korea Taiwan and the Philippines have made substantial reductions in quantitative restrictions
on current account transactions
Table 19 - Restrictions on Current Account
1961 1962
Taiwan China
11Z devaluationof None official exchange rate
Ceylon Imports of 45itans Customs duties placed under quit raised by 20 on license from open all items except license food amp pet Imports of tires and tubes pro-
hibited
Korea Retention of ex- None port earning scheme blocked Specid customs duties imposed on luxury goods
Pakistan The list of auto- None matically imported goods doubled to include 62 items 11 items placedm open gen license Export of cotton garments to UK subject to licens
1963 1964 1965
Exchange certi- Decontrolledaoco- None ficate system nut coffee syn-abolished and fix- thetic fibres ed rate set
Pet subject to import license fish amp most other commodities
Restrictions im-
cement fibres unfinished motor cycles frames Quantitative resshytriction would be limited to 3 year To be eligible fo control a product cost less than 15 import price
All products made Imports of Petr subject to indivi products news-dual import lice- print cotton
1966
Controls reshylaxed for a large number of itelub
_
State control of textiles imports was
nse yarn corn fodder announced caustic soda under needed state trading
_
A number of spe- The number of Imports from ports removed frod cial taxes on im- items imported countries with number of items ports were abol-
ished Most goods brought under automatic approval pro-
cedure Number of items imported only byend user reduced
None Restrictions on trade with India established A defense sur-charge of 25 levied on all imports
was doubled whom Korea had favorable B of r were given preshyference
The number of items autoshymatically apshy
up t 3000__oed
Items of free list Govern conad doubled 31 to 66 over import Number industries iron amp steel allowed to apply shy
for import license finished 128-258 64 import Zed4 euro r of metal from US chemicalsput liberalized between on free list raw materials amp Tariff struL
ture revised
_J 8fr 8fdWUX2
-- 1961
Indonesia Import taxes on certain goods eased
Burma Licenses were in-creased to export-ers 27 raw mater-ials could be imported freely from anywhere
1962
Import Quotas sharply reduced
Tires amp tubes removed from open general license petr products chemicals placed on open general license
1963
Effective exchane rates depreciated sharply State monopolies on number of goods ended private importers lic-ensed
All foreign firms prohibited making imports Govern assumed control over all imports amp most exports
1964 1965
New appreciated ex- Withdrew change rate estab from amp all exchange taxei fund that existed abol-ished
Govern would allow importers to bring in any
product but most use own resourm 5 tax imposed on all imports A levy of 1350 Rps per $US was imposed on all imports()
Govern completed none nationalization of export trade
1966
A surcharge of 50 introshyduced for less essential imports
none
78
(c) Quantitative restrictions on foreign capital
Only the Philippines has no restrictions on foreign capital inflows or
outflows The Philippines does however require that at least sixty percent
of the capital invested in extractive industries be of domestic origin Pakistan allows free inflow of foreign capital Malaysia allows free inflow of foreign
capital into a list of approved industries Thailand Ceylon Korea and Indonesi
have no list of approved industries and negotiate terms of entry of foreign capshy
ital completely
Malaysia Ceylon Pakistan and Indonesia distinguish between old foreign
capital and new or approved foreign capital In all these countries except Indonesia repatriation of approved capital is guaranteed although Ceylon and Pakistan limit repatriation in any one year to prevent disturbance of the balshy
ance of payments Indonesia requires prior approval before any capital can be
repatriated
Malaysia Ceylon Pakistan and Indonesia define foreign capital that was in the country before independence as old capital Its repatriation is subshy
ject to individual approval in Ceylon Pakistan and Indonesia Malaysia permits
free repatriation of old capital within the Sterling Area repatriation outshy
side the Sterling Area requires individual approval
Thailand and Burma generally allow free repatriation but both reserve the right to limit repatriation of capital in any one year for particularly large
transactions Korea requires prior approval for any repatriation
There have been relatively few changes in restrictions on foreign capital
over the last seven years The Philippines has undergone the greatest change moving from a position in 1961 of prohibiting all repatriation and of severely
limiting remittance of dividends to a position of permitting the unrestricted
remittance of both in 1963 Other changes of note in the countries surveyed include the establishment in 1964 of blocked Malayan dollar accounts for firms
desiring to remit outside the Sterling Area a moratorium on all remittances
declared by Ceylon in 1964 and the nationalization of all foreign firms in
Burma during 1963 and 1964
79
4- The pattern of tariff protection In evaluating tariff protection and in making international comparisons
one needs to take account of two qualifications One is the uncertainty varying between countries and the times concerned as to valuation of imports and so the rates of duties actually imposed The evidence summarized below on pervasive error in Asian trade data indicates that this worry is no minor one The second is that effective protection not nominal protection is what is important Effective protection is measured by the percentage change in valueshyadded or alternatively in net earnings of the producer in the protected product Suppose a 10 duty is levied on imports of a good for which the doshymestic producer pays out 80 of the former price for his raw materials so that his value-added is 207of the former price When domestic price is raiseshyed by 10 (a simple result that does not always hold) value-added rises (from 20 to 30) by 50
If net earnings (profits) of the producer were half of value added or 10 of the previous price then effective protection defined in relation to net earnings rises (from 10 to 20) by 100
If the cost of raw materials rises as a result of the complete schedule of protection effective protection will be different and is likely to shift surprisingly even to negative levels (which means that cost of raw materials rises by more than does price of final product)
Effective protection has had high success in theoretical tTade discusshysions in recent years and has come to be actively used in practical trade negotiations Its success is justified It offers a much closer approximashytion to measuring the influences on production decisions than does the nomshyinal protection reported in the tariff code books But effective protection is difficult to calculate it requires data on average industry inputs and costs and sometimes firm costs that we do not have in Asian countries in adequate reliability and detail (We have experimented in such a calculashytion for one of our countries which we do not reproduce here) In most countries effective rates are higher and erraticaily higher than nominal rates and that generalization appears to hold for Southeast Asian countries
Bela Balassa does attempt such estimates for four high income countriesand the Common Market Trade Liberalization among Industrial Countries McGraw-Hill 1967 pp 178-184
80
The following samples briefly tariff rates for the four countries of region that rely on tariffs relatively most and on quantitative controls
least
With few exceptions Philippine duties are higher than those of other three countries Philippine duties also seem more consistently graduated to tax more heavily products with a high degree of fabrication The aim is evishydently to protect domestic processing and assembling Effective protection of processing and assembling must be very much greater than the reported nomshy
inal protection
The contrast between the Philippines and the other countries is espeshycially great for such luxury and semi-luxury things as processed foods pershyfumes consumer durables and such import-substitution candidates as cotton yarn and fabrics cement and glass products processed fertilizer and paper
board
Although lower than those of the Philippines Thailands duties are genshyerally high and show little graduation by degree of processing The pattern reflects a heavy reliance on import duties for revenue purposes rather than the aim of protecting domestic industry or controlling consumption
Halaysiasduties on non-consumer goods are generally much lower than those of Thailand and the Philippines Their pattern is closer to that of the Philippines than that of Thailand indicating the ruling purpose of domestic protection rather than revenue Duties are 0 to 5 on investment goods and low for intermediate goods save some of special interest (lumber rubber and tires glass and textile products) which are relatively highly protected Consumer goods are subject to a uniform rate of 25 suggesting the implicit purpose of revenue
Singapore has in general the lowest level of duties Except for rvenue producers such as alcoholic beverages tobacco processed foods cement and a few consumer durables all other items are free Singapore is constrained against raising duties on consumer products because of its over-riding aim of luring a swelling tourist trade through low prices on a wide range of standard consumer goods When it raises duties as in the budget speech of December 1968 it does so cautiously and modestly
--
81
In conclusion the tariff structures of these four countries differ wideshyly in their heights and considerably in the apparent purposes of the levies to raise revenue to check luxury consumption to protect the balance of payments to stimulate domestic industry or some combination of the four
The quantitative and qualitative differences in these tariff schedules and the different commercial and political purposes that the schedules reshyflect are likely to be stubborn obstacles to lowering tariffs in a regional cooperation scheme Reform mongering is possible especially if the goals are modest but it will be difficult
Table 20 - Tariffs-Major Categories
Consumer Goods
Food products
Cereal amp Preparations
Dairy Products
Meats and Preparations
Fish amp Preparations
Sugar
Non-Durables
Coffee and Tea
Alcoholic Beverages
Tobacco
Soap
Essentials Oils amp Perfumes
Pharmaceuticals
Footwear
Garmets
Durables
Refrigerators
Air Conditions
Appliance amp Uandtools
Automobiles
Bicycles
Radio amp TV
Malaysia
0
89
0-20
0-25
40
10
100-200
250
20
0
25 or $12
25
20
20
15-20
0
$14
25
Singapore
0
10
0
0
50
0
60-100
200
20
0
40
0
207
0
0
10
0
0-25
Thailand Philippinea
220 Bakg 10-30 P100kg
Milk Butter 30 5 - 70
25 Bakg 15
307 75
65 25-10 Pkg
25-55 30-75
25-10OBalit 100-2007
40 100 + 8-200Pkg
75OBakg 40
0-80 0-307
30 50-1007
30-40 90-110
60 120-150
60 100
30-55 10-25
60 40-160 Assem 20-30 Unassem
25 80
35 80-100
83
Table 20 (continued)
Intermediate Products I Malaysia ThailandSingapore Philippines
Crude Oil 0 0 0 5
Crude Material including Wood 0-25 0 30 5-10
Thread and Yarn 15 0 lOOBa-220 Cotton Wool Bakg 707 25
Intermediate Products II
Diesel Gasoline Fuels amp Lubricants 3 40 30-40 12-8OBalit 8-257
Chemicals 0 0 30 10-25
Rubber Manufacture 50 50 30 Bel -1 00 Foam Tires 70 140lb 15 30-60 Cement 10 20 150BaMet 60
ton Glass 25 0 50-70 50-70
Iron amp Steel pig and ingots 0 100 0
Metal Manufacture 0-25 0 22-150 10-80 Bakg
Paper amp Paperboard 15 0 10 40-69
Fabrics 25 25-300 50-100
Investment goods amp agriculture imports
Railroad 0 0 5 10
Trucks 0 0 207 15-20
Electric Equipment motors and generators 0-5 0-5 15 10-20 Other 0-5 0-5 80 10-20 Machinery 0 15-250 10-30 Fertilizer 7 0 0 Guano Potassic
0 20 Tractors 0 0 5 10
84
Table 21 Sample Commodities Duties
(Ad Valorem or Specifics Equivalent)
Code Product Malaysia Singapore Thailand Philippines
0 Food and live animals
00 Live animals 0 0 25Bakg 0
01 Meat amp Heat 0-20 0 25Bakg 15 Preparations 0 Milk Butter
02 Dairy Products 8 10 30 5 - 70
03 Fish amp Fish in cans Preparations 0 25 0 30 75
Rice 0 0 22OBakg lO-20P100kg Maise 0 0 220Bakg 15P100kg Flour 0 0 220Bakg 20-30PlO0kg
05 Fruits amp Vege- 60-100 0 50 15-40PlO0kg tables 45 Prefshy
erence raw refined 06 07
Sugar Preparations Coffee Tea
40 107
50 0
65 Coffee Tea
25 -Coffee
1OPkg Tea
25 55 30-40 75 11 Beverages
Beer 100 100 165OBalit 75 Spirits 200 and up 60 24-10OBalit 100-200
12 Tobacco 250 2007 40 or 25-55kg lO0+8-20Pkg
2 Crude Materials 0-25 0 30 5-107 inedible
85
Table 21 (continued)
Code Product Malaysia Singapore Thailand Philippines
3 Mineral Vuel 4 Lubricants
33 Petroleum amp Products
Gasoline 40 $130 gal 80Balit 25 or 40
Kerosene Diesel Residential
2 3
307
30 30 30
33Balit
12Balit
25Balit
87 8
15 Fuels
Crude Oil Lubricating Oil
0 $1gal
0 $1gal
0 66Balit
5 10r
4 Animal amp Vegetable Oils
0 0 44OBakg
or 25 5Pkg
5 Chemicals Sulphuric Acid 0 0 307 25 Nitric Acid 0 0 307 107 Sodium U 0 307 lOPkg Hydroxide
Pharmaceuticals 0 0 0-80 0-30 Soap 207 207 75OBakg 40 Paints 20 25 30 15 Essential Oils 50 0 50 50 Perfumes 50 0 80 200
86
Table 21 (continued)
Code Product Malaysia Singapore Thailand Philippines
6 Manufactured goods
61 Leather goods 25 or rubber 40 or $12 30 50-100 sole rubber sole Belts Foam
85 Rubber Manu- 50 50 30 10 shy 100 facture
Tires 70 140lb 33-132 Ba 30-65
65 Textile Products or 15 ea
grey bleached Yarn cotton 15 0 100-220 707
Bakg
Fabrics cotton 25 or 0 25-30 50-1007 10 cts
Silk Hemp Yarn Fabric Man Made Textile 0-25 0 30-40 25 - 75
products
84 Garments 25 0 30-407 90-110
66 Non Metallic MinerAX Manufacture
Cement 107 20 150Bametton 60
Glassware 25 0 50-70 50-70
67 Iron and Steel
Ingots or Pig 0 0 107 0
Rods Plates Shapes 0 0 10-30 10-307
68 Non Ferrous Metals 0-30 0 30 0-20
69 Manufactures of Metals 0-25 0 22-15OBakg 10-807 most 20
70 Machinery 0 0 15-25 10-30
Refrigerators 20 20 60 120-150
Air cenditioners 20 0 60 100
87
Table 21 (coatinued)
Code Product Halaysia Singapore Thailand Philippines
72 Electrical Equipment
Motors amp generators 0-5 0-5 15 10-20 Other Elect equipment 0-5 0-5 30 10-207 Bulbs 0 0-200 ea 30 10 Batteries amp Cells 25-30 5cent ea 30 20 Radio amp Television 25 Radio T V
0 2 35 80-100Appliances amp Tools 15-20 0 30-55 10-25
73 Transport Equipment Rail 0 0 5 10 Tractors 0 0 5 10 Buses 0 0 20 15-20 Trucks 0 0 20 15-20 Automobiles 0 10 60 40-160 Assem
20-30 UnassemBicycles $14 ($11 0 25 80 prefer)
Fertilizer 7 Guano Potassic0 0 0 20
Source Recent Tariff Codes of the four countries
88
e- Customs Revenue Loss in a Southeast Asian Customs Union
One of the economic deterrents to governments considering the formation of a customs union among LDCs is the possible loss of customs revenue It is
often casually assumed that since governments normally place great reliance on import duties as a source of revenue a customs union would substantially reshy
1duce national revenues The purpose of this note is to examine briefly the significance of the problem as a deterrent to a Southeast Asian customs union
The national governments in Southeast Asia have been obtaining 13 to 30 of their total revenues from import duties (Table 22) By means of a simplified
model we will attempt to indicate how much of this would have to be given up
presumably be replaced from some other revenue source if a customs union were
Table 22 - Import Duties as a Percent of Total National Government
Revenues Selected Southeast Asian Countries 1963-65
Country 1963 19651964
Ceylon 272 297 302
India 133 149 157
Federation of Malaya 297 NA NA
Pakistan 256 160 183
Philippines 219 226 236
Taiwan 172 175 190
Thailand 318 299 226
Source Statistical Office of the UN Statistical Yearbook 1965 for all except Taiwan from Monthly Statistics of the Republic of China Taipei December 1966
Note 1965 figures represent latest available estimates
1Some governments also obtain substantial revenues from export dutieshowever on the assumption that these apply mainly to goods sold outside the region we are ignoring them
89-90 formed We will then present a case study an estimate of the consequences for the Federation of Malaya of a free trade area with the Philippines and Thailand
(1)The Model Consider a typical country with the following pattern of import duties (a) Competitive and luxury imports subject to extremely high duties
(1) For most the rates are prohibitive and hence not
revenue-producing (2) A few luxuries however continue to enter There
is some revenue
(b) Non-competitive imports (1) Near-zero duties are on imports required as inputs for
domestic production and thus negligible revenue generated (2) Moderate to high duties are on non-competitive imports for
final consumption providing almost the entire import duty
revenue Descriptions of such a pattern can be found in a variety of sources
The Overseas Business Reports of the US Department of Commerce containfrequent references to such tariff structures In Taiwan for example the duties under 20 percent apply to books raw materials certain machinery and fuels those between 20 and 40 to products essential to education and healththose between 40 and 80 to most manufactured articles and those above 80 to luxuries and certain textiles2 This structure of tariffs combined with an import licensing system that grants licenses liberally for raw materials capital equipment and essential consumer goods but sharply limits imports of luxuries and of goods produced domestically3 is the frequent and nearshytypical pattern
IUS Department of Commerce Overseas Business Reports (Washington DC)irregular
20BR 64-89 Foreign Trade Regulations of Taiwan September 1964 p 1 31bid p 6
91
Similarly the Thai customs tariff is being used increasingly to protect new industries Luxury items are dutiable at higher rates imports of manushyfactures which are not produced locally are dutiable at lower rates and essenshy
tial materials are often duty free1
The Malayan import tariff automatically provides many Malayan industries with a measure of protection against competing imports In addition a Tariff Advisory Committee has been set up by the Malayan Government to consider applishy
cations of manufacturers for tariff protection the reduction of import duties on raw materials or any application for other assistance or concesshysions involving tariff policy
2
Finally the ECAFE study of import substitution notes the same pattern A brief examination of the tariff rates shows that there are two broad cateshygories of tariffs which may relate to two basic aims of tariff policy One aim is to influence the pattern of domestic consumption by levying high duties on luxuries and semi-luxuries The other aim is to protect domestic industries Essential goods would normally be expected to carry a low tariff(but) the higher rates of import duty are obviously imposed for protection Thus there seems to be a blending of these two basic aims of tariff policy higher duties on non-essentials and essentiala produced adequately or likely to be produced adequately at home lower duties on essentials which cannot be met by domestic
production at present or in the very near future3
A customs union would alter the typical picture just described by eliminashyting duties on intra-union trade but would probably retain approximately the existing pattern of external duties Customs revenue would thus continue to accrue to our typical national government from luxury imports and from nonshycompetitive imports for final consumption coming from outside the union but not from within the union The crucial question then is what proportion of
10BR_ 66-52 Market Factors in Thailand July 1966 p1
2OBR 65-18 Foreign Trade Regulations of Malaya March 1965 p 2
3ECAFE Economic Survey of Asia and the Far East 1963 pp 46-47
92
the value of existing imports in these two categories would be purchased from within the union The answer depends in part on whether one is speaking of the short-run with the existing industrial structures constantor of the longshyrun with time allowed for the establishment of new industries
In the short-run the high degree of similarity in the productive structures and outputs of the economies of the region suggests the following impact on the
revenue-producing imports of a typical country (a) luxury imports would be obtained from outside the union and thus
continue to provide the same revenue (b) A small proportion say (the probably excessive proportion of) 10
or 15 of the value of existing non-competitive consumption imports would be available from within the union Altogether then let us assume that in the short-run union would place 10 of current revenue-producing imports in the duty-free category
The revenue loss in the short-run would be the tariff rate times the value of those imports that will come duty-free from within the union but now pay
duty Assuming a tariff rate of 50 on affected imports 1 then 50 of 10 that is 5 of current national import tariff revenues would be lost by a cusshytoms union This in turn amounts to a normal maximum of 15 of total govshyernment revenue The preceeding (alternative) and similar calculations are presented in tabular form in Table 23
In the long-run union should accelerate the broadening of import substishytution with the tariff wall to include more and more of currently non-competishytive consumption imports from outside the region This would mean a further reduction of revenue-producing imports for our typical country Although it is difficult to determine exactly how much of such structural changes would be attributable to union let us make the extreme assumption that in total 50 of current revenue-producing imports are either eliminated or are obtained
1The assumption of a 50 rate on non-competitive consumption imports isprobably an overstatement Even import substitution items on the average are subject to nominal rates lower than 50
Table 23 Hypothetical Calculations of Revenue
Losses
Alter- Import duties Percent of non- Non-compet- Percent of Tariff Rate Percent of Percent ofnative as a of competitive im- itive imports revenue- on revenue- current total currentnational re- ports available as of rev- producing producing tariff re- national reshyvenue within union enue-producing imports to imports to venue to be venues to be imports be admitted be admitted lost by lost by union
duty-free duty free union
(1) (2) (3) (2)x(3)=(4) (5) (4)x(5)=(6) (1)x(6)=(7)
A 25 125 80 10 50 5 125 B 25 125 80 10 1007 10 250 C 25 125 80 10 25 25 0625 D 20 125 80 10 50 5 10 E 307 125 80 10 50 5 15
94 from within the union Thus again assuming a tariff rate of 50 and that import duties account for 25 of government revenues the government would have to adjust to a loss of (50 times 50) 25 of current import tariff revenues or a maximum of 75 of government revenues (tariff revenues assumed 30 of total revenues) Alternative calculations can be made in the manner of Table 14 above for other long-run assumptions
(2) Example
To illustrate the foregoing analysis consider the impact on the revenues of the Federation of Mlqnta of a hypothetical free trade arrangement with the Philippines and Thailand
The Federation of MalayWa is highly dependent on import duties for revshyenue and would be hard-pressed to replace them completely in a short period(See Table 24) However we will show that the effect on revenues of the assumed free trade arrangement is very small
Table 24 Federation of Masl~sa Revenues of Federal and State Governments (millions of Malay dollars)
1961 1962 1963 1961-63 Taxes on income and
wealth 2396 2351 1964 2237 Export duties 1920 1784 1524 1743 Import duties 3579 3592 3341 3504 Other direct taxes 1178 1202 1584 1321 Other receipts 2654 2755 2819 2743
Total 11727 11684 11232 11548
Source UN National Accounts Yearbook 1963 New York 1964 Estimates forfor 1962 and 1963
95
The minimum loss to theMOIatian government would be the duty collected
on imports from the partner countries Thus inte figure belw ifthe foreign
supply price is Op and the duty rate is pp then the total revenue is
measured by the rectangle pedp If the partner countries supply the quantity
aamp then the revenue collected on imports from the partner countries amounts
to b h k c We calculate this value by applying the scheduled Mak6sim tariff1
to each commodity imported2 in 1963 from the two assumed partner countries
the Philippines and Thailand The results are given in Table 23
Pf
II
a Q
1The Malayan tariff schedule is contained in Malaysia Trade Classificashytion and Customs Tariff (Kuala Lumpur 1964)
2 mport data were taken from Department of Statistics States of Malaya Annual Statistics of External Trade 1963 Vol I Imports
3These results are in summary form The Ml4sysin tariff schedule is at the six-digit level of detail and the calculations therefore were carried out at the six-digit level In this and the subsequent calulation any item generating lecs than M$100 duty was omitted
96 Table 25 Malaysian Revenue Collected on Imports from Two Partner
Countries 1963
SITC Section Duty (in thousand M$)
0 15765 1 25819 2 9840 3 46 4 17 5 36 6 1240 7 00 8 2373
Total 55439
Note Items do not add exactly to total because of rounding
97
The total duty collected on imports from the two partners amounts to only 158 of the duty collected on imports from all sources in 1963
Free trade however will cause a shift of Mmlaysian imports away from traditional sources and towards the partners The crucial question ishow much of the quantity of a f on page 95 would the partners supply in the shortshyrun As a hypothetical extreme we assumed that for each good the partner countries would replace other suppliers in the M aysan market up the amount of their (the partner countries) total exports of that good 1 This procedure assumes that exports of the partner countries are perfect substitutes for the Masysianimports within each SITC six-digit grouping Further we assume that there would be no substitution between SITC six-digit groupings and hence no loss of revenue on other imports The revenue loss calculated on this basis
bullis summarized inTable 26
1Only those goods currently imported from the partner countries are considerud on the ground that the partner countries products are not subshystitutes for the goods of other suppliers if they do not sell currently in the Malayan market These calculations were also carried out at the sixshydigit level using the Philippine export statistics for 1963 (Bureau of Census and Statistics Foreign Trade Statistics of the Philippines 1963Manila) Thai export statistics were for 1964 (Thailand Department of Customs Foreign Trade of Thailand 1964 Vol IIExports and Re-exports)These figures were used because 1963 was not available to us There were a few difficulties encountered in matching items but such cases all inshyvolved small amounts of trade and therefore any inaccuracies arising from this source should have little effect on the result
2No attempt was made to separate out Commonwealth and non-Commonwealth imports that would be eliminated Consequently the full rate was appliedThis assumption yields an upward bias in the calculated duty loss
98
Table 26 Potential Revenue Loss
SITC Section Loss Th M$
0 78626 1 1111649 2 11916 3 46 4 209 5 1332 6 16582 7 00 8 9189
Total 1229550
Total except 1 11 7901
The total potential revenue loss amounts to 3503 of Malayan customs
revenue in 1963 However this is concentrated in Section 1 beverages and
tobacco If one omits the duty loss on Section 1 which could readily be
recouped by imposing equivalent excise taxes the total revenue loss is only1
336 of Malayan import duty revenue in 1963 or approximately 1 of total
Malayan government revenue
Finally we should add that duties collected on-exports to the two
hypothetical partner countries in 1963 was 0105 and of tin 03012 of
total customs revenue
1Further Section 0 includes an assumed Philippine switch of exports of refined sugar from the US to Malaya which is unlikely in view of the high US price paid If this is omitted along with all of Section 1 the revenue loss amounts to 174 of import duty revenue in 1963
2The variable leviT export duty made it impossible for us to calculate the revenue collected on rubber and tin The ad valorem duties on other exports to the partners yielded revenues of less than M$10000
99
The conclusion is clear Both from general reasoning and from the
case example we conclude that government revenue of a typical Southeast
Asian country entering a regional customs union would be reduced very
little in the short-run Long-run structural changes would cause greater
lossbut since intra-union tariff reductions would occur over a period
of a few years adjustment to the loss of revenues should not prove a
major impediment to union
f- Protectionism and the growth of productive efficiency
Let us suwmarize and extend the above and develop policy implications
Trade barriers within the region and internationally are a major qualificashy
tion on the possibilities of achieving comparative advantage growth and of
expanding in the fields where feed-back effects toward still higher efficiency
are most promising They are higher than they seem modest rates on the custshy
oms books (above Section D4) say 10 or 40$ can in fact mean 80 or 200
change in the returns left to the producer when his local business costs are
paid and even more change in his net profits
Modest quotas also can be surprisingly protective to final processors
In addition protective effects are erratic A modest duty on final
output can be transformed when tariffs on inputs into the production process
are counted into a heavy net tax rather than the subsidy innocently intended
by lawmakers High and erratic protection means that the distortion to world
patterns of specialization and the injury to regional and world efficiency
are much greater than have been traditionally thought
Protection in DCs and LDCs alike is relatively high on manufactures
and specially high on more complex manufactures Hence less developed countshy
ries are especially handicapped in trying to expand sales abroad of manufactshy
ures which they judge have feedback and dynamic advantages to them in trainshy
ing of skills improvement of organization and capital formation
These feedback and dynamic effects justify much attention They are
the mainly important potentialities from a regional preference or freershy
trade arrangement
100
In such an arrangement export markets will expand for the proshy
ducts of the most efficient regional countries Domestic markets for their
products are small often very small As the size of the market and the
volume of production expand average costs in many industries can fall sharply
through a considerable range handicraft and small-scale production is outshy
competed by mechanization use of power equipment specialization in subshy
processes and assembly line fabrication Expansion of the market develops
other economies feedback effects in their broadest sense skills and entreshy
preneuring abilities in one industry that are useful also in others better
communications (a road or railroad developed for one business can be used by
others) simplifications and standarization encouraged through producing for
a large market emergence of new industries out of the specialization encourshy
aged by producing for a large market and from more contacts and growth of
a sense of momentum and confidence in economic possibilities
Industries differ in their extent of feedbacks toward higher efficiency
It is sensible in any regional or broader scheme for increased trade to
stimulate those that have the most
The trend of world trade since 1900 and more recently reinforces the
urgency of the argument that LDCs should aim diligently to up-grade their
skills organization and technology and do so as rapidly as they can In
world trade as a whole commodities with low skill-and-capital requirements
have been making up a falling proportion and those with high skill-andshy
capital requirements a rapidly rising proportion The value of food and raw
materials has been rising recently at less than one-fifth the rate of growth
of manufactures Exports of LDCs to high income countries show this same
pattern foodstuffs and agricultural raw materials exports have been rising
recently at the rates of 20 and 14 a year respectively In contrast
manufactures and base metals have been growing recently (1960 to 1964) at
the surprisin rate of 14 a year faster even than petroleum exports
Among manufactures the highest growth rates among exports have been for
machinery and equipment followed by other manufactures textiles
and chemicals
Low income countries have been gaining new markets within the manushy
factures class in the less complex types of producers goods and machine
parts such as electric generators diesel engines locomotives steel frames
101
for furniture and the like 1 These have a high labor content and require
less elaborate marketing than consumer goods especially consumer durables
Tariffs and other restrictionist measures within the region have thereshy
for three reinforcing injurious aspects (1) they are much more distorting to
the efficient static flow of resource use than the nominal rates imply since
it is the effective (not the nominal) rates that count (2) They bear most
heavily on manufactures and the more technical manufactures in which feedshy
back effects toward higher productivity are often most promising (3) They
limit trade in that segment of international commerce the higher skill-andshy
czpital requirement group which are often manufactures in which market opshy
portunities have been growing specially fast
In addition (4) lowered trade barriers within the region and generally
have a special advantage to the smaller LDCs for a reason not often highlightshy
ed LDC economies are typically thin subject to sporadic scarcities and surshy
pluses of particular products due to crop failure or abundance to transport
breakdown to industrial difficulties or successes where suppliers are few and
to failures of central planning There is therefore especially large gain
to their economic life from opening up freer trade channels for supplies and
markets and for this reason they ought to be devout supporters of freer trade
On the other hand because most low-income countries are hIeavily depenshy
dent on government revenues for customs receipts they are inAined to move
cautiously--probably excessively cautiously (see the analysis above)--in lowershy
ing customs levies even though lower rates need not mean lower receipts2
1United Nations World Economic Survey 1962 vol I pp 14 65 T Morgan Economic Relationships among Nations the Pattern of Comodity Trade ch 5 in B Hoselitz ed Economics and the Idea of Mankind pp 156 174
2The subject matter of this section is discussed more in detail in the research paper of the Project entitled Preferences Revisited
102
g- The variety of economic and non-economic cooperation
This section has been centered on the possibilities of regional tradeshy
increasing cooperation with its implications for increased economic efficiency
This is the usual focus of studies of regional cooperation But there are in
addition many other kinds of economic cooperation and many kinds of cooperashy
tion that are not primarily economic
These will be referred to in various contexts in the later sections We
list below four groups to suggest their range and variety Among them are
--informal and formal consultations on economic and other matters
--agreements to undertake cooperative administrative action on economic and other problems of joint concern (eg health measures)
--agreement among two or more countries to commit resources for joint purposes (eg river valley development cooperative deep sea fishing)
--arrangements with international organizations and with countries outside the region to undertake notions of regional benefit (ECAFE and Asian Development Bank activities the Colombo Plan)
Regional advantage as distinct from advantage to one country can come
through (a)measures that benefitting one country can have their advantages
spread to other countries without added cost (eg research and health measures)
(b) projects where there are economies of scale of substantial amount (eg
a regional market can enable output to rise to a level where average costs
are substantially lower) (c) projects and activities that in addition to
their direct effects can stimulate and catalyze across national boundariesshy
broaden peoples horizons encourage them with evidence of possibilities
extend their perspectives raise their usable skills
Potential gains are large The evaluation of their realized amount turns
on the kinds of projects undertaken the conditions under which they are carried
out and the energy and perception applied to them
The acceptance or rejection of any one project proposal rests on the outshy
come of a specific cost-benefit analysis Priority goes to those projects
that rank highest in such analyses up to the limit of the resources available-shy
which is itself a variable depending on the estimated productivity of the reshy
sources at the margin
103
One general presumption gives a useful rule-of-thumb for policy decisions
Projects that expand production andor productivity have an obvious presumption
in their favor Conversely projects that seek high money returns through
checking production andor productivity are suspect The latter of course
deny the basic nature of economic progress which consists of increasing
production or real income The latter are likely also to involve specially
burdensome administrative problems--and administrative efficiency is a major
LDC bottleneck Finallytheir intent is apt to be frustrated by the obvious
the subtle and the manifold inroads of competition both from the same proshy
duct and from substitutes both in the short run and the long run
104
II -Foreign Exchange Constraints and Regional Cooperation in Southeast Asia
One of the most vivid and persistent contraints on economic development is that of scarcity of foreign exchange The Minister of Finance and the Chairman of the Development Board must in the Lypical LDC ask themselves whenever any attractive growth project is proposed Do we iave or can we obtain enough foreign exchange to meet its external costs
In one sense the concern is no more than the inevitable not enough
money image of the resource scarcity permanently faced by any group and anyindividual In another sense if the LDC economy is composed of private maxishymizing units and of government bodies that behave as if they were it reflects disequilibrium exchange rates the exchange rate overvalues domestic currency But the survival power of disequilibrium exchange rates is very great they
1 are chronically with us
A - A Regional payments union
Hence proposals for that form of regional cooperation called a regional payments union continuouslyinvite attention The basic idea is that among the national members of the union a large part of their payments falling due can be offset and cancelled against claims in the oppositedirection Hence an advantage (1) foreign exchange will be economized and there will be a larger value of trade made possible both within the union and between the union members and the outside world A larger volume of trade means that specialization along the lines of comparative advantage can be carried further with its direct (static) and indirect (static and dynamic) advantages to the rate of growth
A payments union can operate in one of several ways Simply lengthening the period over which international payments are made will conserve foreign exchange ordinarily importers must pay their debts in foreign morey on demand or within a limited specified period Instead member countries can designate central authorities to keep accounts in which importers pay and exporters receive domestic money and in which foreign transactions are offset and the
ISee the reasoning of CP Kindleberger Liberal Policies vs Controlsin the Foreign Trade of Developing Countries AID Discussion Paper 14 April 1967
105
net foreign balance settled at the end of some agreed-on-period -- a week or
month for example The national clearing houses are an easy variation on
the exchange control offices with which most LDCs are familiar The latter
are already in fact extending credit across national boundaries as part of
their functioning They grow to extend credit explicitly if member countries
agree to give each other swing credits for say three or more months
Such swing credits function most effectively if changes in bilateral balances
tend to average out over the settlement period
If a regional clearing office is set up the bookkeeping can be done
more efficiently 1regional clearing house can by joint agreement grow
into a central authority with specified powers among which may be the estabshy
lishment of common unit of account for settling balances Such accounting
units permit still greater foreign exchange economizing the credits of a
persistent creditor can be used to finance negative balances of a persistent
debtor country -- up to agreed-on amountis and time periods
Two additional advantages are sometimes claimed for a payments union
among LDCs (2) Through regional cooperation it may be possible to avoid
some of the ordinary financial charges on international transactions Proshy
ponentsof financial cooperation for Central American have made such of the 1
savings that would result from by-passing New York as a financial center
In the past for example payment for an export from Guatemala to Nicaragua
had to pass through New York banks and thus was subject to a maximum of two
financial charges one when the importers cordobas were converted into dollars
for payment and again when the exporter took payment in quetzales The same
kind of economy -- not large but something -- would be obtained in Asia
through a regional payments union to the extent obligations can be settled
directly in rupiah or baht or pesos rather than indirectly into pounds or 2
dollars and out again
1John Parke Young Central American Monetary Union United States Department of State Agency for International Development RCCAP 1965
2This economy is advocated cautiously by RobertTriffin in a intershy
esting symposium with disbelievers in an Asian Payments Union Japan and the Development of Asia The Oriental Economist Nov 1968 pp 26-38
106
(3)A third claimed advantage stems from the fact I that currencies of
LDCs are usually overvalued and often inconvertible By clearing through the
union member countries avoid paying the premia in local currency that would
otherwise be required to obtain hard currencies needed to finance intrashy
regional trade Some further saving in charges may therefore result
(4)Finally there are the advantages of more home rule Decisions on
credits and other payment terms are made less in London or New York and to a
greater extent within the region Nationalist sentiments are favored and governments grow more into the habit of considering regional incerost and of
cooperating with their neighbors in the joint interest This advantage may be
the most important of all those claimed
One of two conditions must be met in order for a payments union to be successful The totals of existing and incremental intra-regional trade may or may not be fairly evenly offset among countries If persistent creditors
and debtors become conspicuous the union is threatened with breakdown But
it can still survive if the persistent creditors are willing to lend at long term to cover the deficits of the persistent debtors within the region We
illustrate with concrete examples
The most conspicuous payments union of the post-war period is the Euroshy
pean Payments Union (EPU) in operation from 1950 to 1958 The EPU structure provided for a se tlement period of one month with swing credits allowed over a longer period European trade and financial flows tended to be unbalanced
but the EPU was able to function effectively because the nations that became
persistent creditors (especially Germany) were willing ultimately to convert the short term balances of the persistent debtors (Greece and Italy) into long
term loans
The EPU operated under unique historical circumstances the economies
and trade network of Europe had been disrupted by World War II and were afflictshy
ed in the early 1950s by what was called partly misleadingly the dollar
shortage Thus the EPU helped provide liquidity and time for the European
Countries to rebuild already proven industrial structures and reconstruct old patterns of intra-regional trade With the successful recovery of Europe the
basically discriminatory payments arrangements could be abandoned A return
to convertibility was possible by 1958
1Jaroslav Vanek Payments Unions Among the Less Developed Countries and Their Economic Integration Journal of Common Market Studies(Dec 1966)
107
In partial contrast with EPU the Central American experiment began as
a clearing-house with minimal credit provisions progressed through a stage of bilateral credit arrangements and has evolved to a stage where liabilities
and claims within the Union are stated in a common unit of account--the Central
American peso The success of the organization owes much to strong support by the authorities of the countries involved In addition the initially balanced trade pattern of Central American and especially the balanced growth of regional trade must also have contributed And the balanced growth of trade has to be
attributed to factors and policies other than the payments union itself (eg
to the program of integration industries)
The situation in Southeast Asia is different from those just described
in important respects
We have examined the possibilities for a payments union among six counshytries of Southeast Asia proper Burma Cambodia Indonesia Malaysia-Singapore
the Philippines and Thailand The calculation is necessarily based only on
reported trade and is therefore subject to uncertainties surrounding trade data (see below Section III) But the data indicate that the benefits from creation
of a payment union among these six while positive would be small
The main reason for this conclusion is shown in Table 27 which lists bilateral trade balances among the six countries on the right with imports of the country (-) subtracted from exports (+) The bilateral negative balshy
ances are subtracted from the bilateral positive balances to give the net poshysition gross claims have no such subtraction Both totals are given with
and without Burma and Cambodia which are special cases
The pattern of trade so measured has remained very stable and it is
clearly unbalanced Simple debt pooling would promptly lead to the appearance of heavy creditors and heavy debtors both between pairs of trading countries
and between a given country and the region as a whole There is little reason
to expect the regional creditor nations (Thailand Indonesia and Cambodia who are caught up in their own development problems to be willing to advance long term credits to the persistent regional debtors (the Philippines and
Malaysia-Singapore)
But because--as we shall see--this debtor-creditor problem can be overshy
come in various other ways we should inquire as to whether or not at least
savings in foreign exchange would be possible Quarterly trade balances
Table 27
INTRAREGIONAL BILATERAL BALANCES OF TRADE 1958-1965
(recorded exports in millions of US dollars)
Trade Net Net Gross Claims
ofwith Burma Cambodia Indonesia Malaysia Philippines Thailand Position Position ClaimswithoutBurmaampBurmaBurma amp
without ampCambodia
Cambodia
Burma
1965 x - - - + 69 + 76 +310 -17 + 438 + 455 1964 x - - - +316 + 94 + 91 -01 + 500 + 501 1963 x - - shy +312 +169 +126 -05 + 602 + 602 1962 x - - shy +310 +146 - 01 -13 + 442 + 456 1961 x - - - +306 +152 + 04 -12 + 450 + 462 1960 x - - - +411 + 76 - - - -03 + 484 + 487 1959 x - - - +352 + 71 - - - +06 + 429 + 435 1958 x - - - +249 +161 + 32 -08 + 434 + 447
TOTAL +3779 +3845
Cambodia 1965 - - - x - 32 +124 + 57 - - - + 149 + 181 1964 - - - x - 21 +107 + 08 - - - + 95 + 115 1963 - - - x - 58 + 93 - - - - + 35 + 93 1962 - - - x + 01 -22 - -- - - - - 21 + 01 1961 - - - x - 02 -08 - - - - 10 - - -
1960 - - - x + 05 + 64 - - - - - - + 69 + 69 1959 - - - x - - - + 43 - - - - - - + 34 + 34 1958 - - - x - - - + 72 - - - - - - + 72 + 72
TOTAL + 423 + 565
Indonesia
1965 - 69 + 32 x - - - + 173 + 29 + 165 + 202 + 234 + 202 1964 -316 + 21 x - - - + 213 -285 - 367 - 72 + 234 + 213 1963 -312 + 58 x - 162 + 189 - 34 - 261 - 07 + 247 + 189
0-
- - -
- - -
Trade ofwith
Indonesia
1962
1961
1960
1959
1958
TOTAL
Burma
-310
-306
-411
-352
-249
Cambodia
- 01
+ 02
- 05
Table 27 (cont)
INTRAREGIONAL BILATErAL BALANCES OF TRADE 1958-65
(recorded exports in millions of US dollars)
Net NetPosiion Indonesia Malaysia Philippines Thailand Position Position
Without Burma amp Cambodia
x - 414 + 239 + 53 - 433 - 122
x +1348 + 192 -112 +1473 +1777
x +2001 + 191 - 90 +1686 +2102
x +1777 + 184 + 08 +1617 +1969
x + 954 + 290 - 76 + 919 +1168
44849 +7261
Gross Claims
+ 292
+1891
+2192
+1969
+1244
+8303
GrossGrs Claims Without Burma amp Cambodia
+ 292
+1889
+2192
+1969
+1244
+8190
Table 27 (cont)INTRAREGIONAL BILATERAL BALANCES OF TRADE 1958-1965 (recorded exports in millions of US dollars)
Trade of
Burma Cambodia Indonesia Malaysia Philippines Thailand Net Position
Net Position
Gross Claims
Gross Claims
with without without Burma amp Burma amp
Subject Countries
Cambodia Cambodia
Malaysia 1965 - 76 -124 - - shy x + 113 -1163 -1255 -1055 + 113 + 113 1964 - 94 -107 - - shy x + 79 -1119 -1241 -1040 + 79 + 79 1963 -169 - 93 + 162 x + 114 -1029 -1055 - 753 + 276 + 276 1962 1961
-146 -152
+ +
22 08
+ 414 -1348
x x
+ +
86 68
-1051 - 747
- 675 -2171
- 551 -2027
+ 522 + 76
+ +
50z 68
1960 - 76 - 64 -2001 x + 193 - 606 -2554 -2413 + 193 + 193 1959 - 71 - 34 -1777 x + 189 - 679 -2372 -2267 + 189 + 189 1958 -161 - 72 - 954 x + 174 - 553 -1566 -1333 + 174 + 174
TOTAL -12849 -11439 +1622 + 1594
Philippines 1965 -310 - 57 - 173 - 113 x - 145 - 798 - 431 - - - - - -1964 - 91 - 08 - 213 - 79 x - 133 - 524 - 425 - - - - - -1963 -126 - - - - 189 - 104 x - 72 - 491 - 365 - - shy - - -1962 + 01 - - - - 239 - 86 x - 06 - 330 - 331 + 01 - - -1961 - 04 - - - - 192 - 68 x - 164 - 428 - 424 - - - - - -1960 - - - - - - - 191 - 194 x - 04 - 389 - 389 - shy - - - -1959 - - - - - - - 184 - 189 x + 02 - 371 - 371 + 02 + 02 1958 - 32 - - - - 290 - 174 x - 59 - 555 - 523
TOTAL -3886 -3259 + 03 + 02
Thailand 1965 + 17 - - - - 29 +1168 + 145 x +1301 +1283 +1312 + 1295 1964 + 01 - - shy + 285 +1119 + 133 x +1538 +1537 +1538 + 1537 1963 + 05 - - shy + 34 +1029 + 72 x +1140 +1135 +1140 + 1135 1962 + 13 - - - - 53 +1051 + 06 x +1017 +1004 +1070 + 1052 1961 + 12 - - shy + 112 + 747 + 164 x +1035 +1023 +1035 + 1023 1960 + 03 - - - + 90 + 606 + 04 x + 703 + 700 + 703 + 70v 1959 - 06 - - - - 08 + 679 - 02 x + 663 + 669 + 679 + 673 1958 + 08 - - - + 76 + 553 + 59 x + 696 + 688 + 696 + 688
TOTAL +8093 +8039 +8173 + 8108
for these countries for the years 1962-1)65 have been calculated The
quarterly pattern indicates that a payments union based on quarterly
swing credits would not save appreciable (added) amounts of foreign exshy
there are very few swings in quarterly bilateral balanceschange
Nevertheless a simple clearing union would lead to some saving of
foreign exchange simply because weekly r longer clearing periods would
We have been unable to determineallow some transaction to be offset
substantial savings in the administrative costs of makingwhether net
Partly for his reason we have made no attempttransactions would result
the actual monetary costs of operating a to determine whether or not
regional payments union in Southeast Asia would exceed the monetary beneshy
fits (measured in foreign exchange)
Although the detailed study was made for six countries might there
be some other group of countries in the region that could form a viable
payments union Professor Nurul Islam I has suggested that Pakistan and
India might benefit considerably from a payments union with other countries
But from the data we have available we conclude there isin the region
that otherlittle in the pattern of bilateral trade balances Lo indicate
groups of the region larger or smaller could form a viable payments union
There would still be persistent and extreme creditors and debtors for whatshy
ever plausible set of countries one selects
re-The above analysis is based on the existirg pattern of trade and
Let us approachgretably but necessarily on an uncertain statistical base
the problem in a different way
A relevant question is whether or not the existing low levels of inshy
the lack of bilatoral or multilateral balancetraregional trade as well as
a result of a past histury ofin the region may nut to some z be
1Nurul Islem Comment in T Morgan and N Spoelstra eds
in Southeast Asia University of Wisconsin PressEconomic Interdependence
Madison 1969
112
regional payments problems For example the regions Sterling bloc
countries (Ceylon Burma and Malaysia-Singapore) adjusted the direction
and composition of their foreign trade during the 1950s to cooperate
with the requirements of the entire Sterling bloc 1 But the Asian case
on the whole does not seem to be one of regaining a past pattern of
regional trade Froe the evidence on trade and economic structure preshy
sented earlier we judge that the present pattern of regional trade is
primarily due to fundamental structural economic characteristics of the
region Analogies between Europe in the 1950s and Southeast Asia at
present are not appropriate
There are it is true incipient changes in the structure of Asian
production and trade that may prove to be a basic for meaningful cooperashy
tion in the future And an Asian payments union may have indirect effects
of the type that apparently were important for Central America facilishy
tating and accelerating other forces for change But a payments union for
Asia (as for Central America) is more likely to be a permissive or passive
factor than an initiating or active force We find little evidence that a
payments union will by itself do much to increase the volume of Asian
regional trade
In addition to these considerations we should report a minus that
stems from a fundamental reality of the region In recent years several
countries -- notably Thailand Malaysia Singapore and the Philippines shy
have enjoyed absence of pressure on their exchange rates as well as a
favorable basic international reserve position Other countries -- Pakistan
India Burma Indonesia and Ceylon -- have operated under often extreme
foreign exchange pressures with the familiar accompanying features of
overvalued rates complicated systems of exchange control and bilateral
trading arrangements
Professor Islams point about the potential benefit of a payments
union to deficit countries like Pakistan is well taken But it is not
clear that countries in the first (surplus) group have much incentive to
enter into payments arrangements with the second (deficit) group The
countries with comfortable reserve positions and reasonable exchange rates
1American Trade with Asia and the Far East Robert J Barr ed
Marquette University Press 1959
113
have maintained satisfactory export performance and they have been free
to import the commodities they choose from any source they choose
Because their participation in a regional arrangement with the deficit
group might require purchases of less-desirable products from within
the region and because there might be some planned or unplanned poolshy
ing of regional foreign exchange reserves countries in the first group
would probably suffer a clear loss from being cooperators They would
do better by acting alone
If in anticipation of economic benefits or for other policy reasons
a payments union should be established in Southeast Asia there are cershy
tain policies that might be adopted to maximize short run and long run
benefits Nurul Islam suggests one possibility1
The credit facilities would be extended to
the deficits and surpluses arising not out of total trade but from incremental trade among the member countries Thevolume of trade taken as the base for estimating increments could be a moving base which can
be taken to increase by a given percentage per year
Instead of an incremental trade or payments union suggested by Islam
a complete payments union would be possible despite the presence of exshy
treme creditors and debtors if the problem of extending regional long
term credits could be solved One possible solution would be to use
external foreign aid to support the net positions of debtor countries
with the rest of region Of course adequate safeguards would have to
be employed so that debtor countries would not be able to run up excesshy
sive obligations A general infusion of long term capital into the
region through the payments union is preferable to bilateral aid to the
extent that a payments union (1) allows more scope for the price mechanshy
ism to operate to fix the patterns of intraregional trade and of regional
location of industry and (2) introduces useful regional disciplines
against low-efficiency uses of foreign aid
1 Nurul Islam Comment in T Morgan and N Spoelstra op cit
114
In view of the above arguments an obvious institutional arrangeshyment for regional cooperation might be a regional payments union combined in some way with a regional development bank One of the functions of the development bank would be to finance by long term investment the net
regional trade deficits of slow growing countries
B - The end of the Vietnam War
The hoped-for and prospective easing off and perhaps ending of the Vietnam war offers an obvious opportunity for useful regional cooperation The present payments flows within the Region are influenced by direct and indirect spending for the War Continuing studies of these payments flows by countries kinds and amounts can be helpful in envisaging what is likely once the War ends and what compensating policies on a regional basis are most feasible AID can be helpfu in such studies the Asian Development Bank at Manila will naturally carry them on other organizashy
tions may assist
C - Two gaps saving and foreign exchange
as checks on regional growth
In the growth literature of the past several years attention has often been directed to the concept of a double gap -- a domestic savshyings gap and a foreign exchange gap -- that checks economic growth The argument is that LDCs are generally deficient in the ability to finance domestic capital formation (the domestic savings gap) and that this capishytal deficiency can be met only through kinds of goods and skills that must be imported in excess of what can be paid for by prospective exports (the foreign exchange gap)
This approach assumes a division of income between consumption which does not contribute to real income growth and nationai -- accounts-shydefinition savings (identical in total to investment) which does A target rate of growth of GNP is accepted and a constant incremental capitalshyoutput ratio assumed (dKdO equals a fixed value) Hence a minimum sufshyficient rate of savings (investment) is implied Part of those investment goods may have to be imported because of domestic production lacks
115
If resources can be shifted readily between domestic investment use
and exports abroad then no distinction need be drawn between the savshy
ings gap and the foreign exchange gap The question of the two gaps
arises in this model when resources cannot be so shifted
The two-gap approach has the inconvenience of diverting attention
from the accounting fact that a savings-investment relation is not someshy
thing separate but is implicit in the balance of payments A surplus
of imports over exports is necessarily equal to the surplus of products
utilized by the economy over products created by it or the excess of
investment over saving1
More savings that is less consumption if income and domestic conshy
sumption are constant is a condition for closing the foreign exchange 2
gap
1Harry Johnson Economic Policies toward Less Developed Countries Allen amp Unwin London 1967 pp 53-54
2This is the Absorption Approach to the balance of payments which
states that an improvement in a countrys balance of payments implies an increase in savings a decline in domestic investment or some combination of the two In this approach the balance of payments is generally deshyfined in terms of B-Y-E where Y is total income from home production and E is total domestic expenditure This can be derived from the usual foreign trade definition as follows
Let M be total imports X the total production of exportables of which Xh is consumed at home and Xf exported so that
X = Xh + Xf
Y be total income derived from production of exportshyables X and of goods sold at home only H so that
Y - X + H
E be total domestic expenditure both for consumption C and investment I so that
E - C + I H + M + Xh
116
Foreign exchange earnings are a constraint on the process of 1
economic growth if (a) the elesticity of demand for the countrys
exports is close to unity or is less than unity so that a rise in the
quantity of exports cannot (much or at all) raise foreign exchange
earnings or if additional resources cannot be freed to flow into export
uses and if (b) the growth of the economy is dependent on the import of
strategic goods and services including capital goods intermediate inshy
puts and raw materials and also goods conventionally classed as conshy
sumer goods that are nonetheless necessary for growth Foreign exshy
change is assumed not to be significantly available through external
assistance
(continued from page 115)
Then the balance of payments (surplus or deficit)
B X - M
X-Xh-M
(Y-H)- (E - H) Y- E
But also total income is (conventially) defined as distributed between savings S and consumption C so that
Y = S + C and E I + C
So that B (S + C) - (I + C) or
B S - I
1Ronald I McKinnon Foreign Exchange Constraints in Economic Devshylopment and Efficient Aid Allocation The Economic Journal June 1964 pp 388-409 JoiFei and Douglas Paauw Foreign Assistance and Self-Help A Reappraisal of Development Finance The Review of Economics and Statistics August 1965 pp 251-267 Hollis B Chenery and AM Strout Foreign Assistance and Economic Development American Economic Review September 1966 pp 679-733
117
Domestic savings are said to be a constraint on the process of
growth if required (national-accounts-definition) investments are not
created by the economy in adequate quantity (Savings are not of
course a cowtaint on growth to the extent specific kinds of consumpshy
tion needed for growth are bottlenecks or institutional or other blocks
limit the usefulness of more capital goods These are major qualifications)1
There is no unique sequence of the two constraints nor is there any
a prior reason why either of the two constraints must have a finite termshy
ination data It may be that for some countries only one constraint is
binding then the other is never relevant
Limits on the availability of foreign exchange are (1) demand
oriented if the elasticity or position of the foreign demand curve for
the LDC countrys exports is the block The elasticity of demand for
the countrys exports may be near one or be less than one so that no
amount of output increase will increase foreign exchange earnings There
may be a problem of secular stagnant demand Price instability may be
the problem the prices of a countrys exports can fall for a number of
crucial years Technological change abroad sometimes threateas the sales
of LDC exports There may also be institutional barriers to trade -shy
tariff or non-tariff restrictions that prevent the LDCs from exploiting
fully their comparative advantage
A frequent cause of sluggish foreign demand is simply that exports
are priced too high in foreign markets The problem is a combination
of the exchange rate and of domestic price trends -- so that eventually
given the current domestic price level the exchange rate ove(-alues the
currency The policies involved may be forced by political considerations
or they may be unintentional or the result of inaction We assume what
is usually the case that demand for the exports of the given country is
reasonably elastic Then a rise in price to foreign buyers will decrease
foreign exchange earnings
1See our Research Paper 11 Investment Versus Growth summarized in part below in III-B
118
Alternately limits on the availability of foreign exchange are
(2) supply oriented if (a) the supply of exports cannot be readily exshy
panded or if (b) the supply of exports is so erratic or the quality so
poor that foreign markets find them unattractive
1 - Empirical Studies
All the specific causes of export earnings lag listed above are
relevant to Southeast Asian experience Three of the papers of this
Project relate to the over-pricing of exports I -- which appears to be a
thoroughly important possible error of policy or of omission of policy
We have surveyed above (Section I-B) the study in the Project2 of the
export lag of Southeast Asian countries in terms of compositional
effect and competitive effect We summarize briefly
We saw in Section I-B that the compositional effect is a measure
of demand deficiency the competitive effect is a measure of supply
deficiency or maladaptation The compositional effect is defined statisshy
tically as the difference between the growth rate for the Southeast Asia
kind of mix of exports into the More Developed Areas and the growth rate
of total imports into those areas The compositional effect therefore
indicates the extent to which Southeast Asia exports to MDCs are helped
or injured because they are like or unlike what the MDCs are importing
1Hla Myint The Inward and Outward Looking Countries of Southeast Asia and the Economic Future of the Region Research Paper 7 Feb 1966 KC Sen The Inward-Looking and the Outward-Looking in Southeast Asia Jan 1965 KC Sen Economic Growth and the Price Level -- an Analysis of Some Asian Data Research Paper 13 Mar 1966
2Seiji Naya The Commodity Pattern and Performance of Southeast Asias Exports to the Developed AreasResearch Paper 10 May 1966 The Southeast Asian countries include Burma Ceylon India Malaysia Singashypore Laos the Republic of Vietnam Cambodia the Philippines Thailand China (Taiwan) Hong Kong and the Republic of South Korea The developed countries consist of 20 countries in seven areas the US Canada Japan Australia the EEC the UK and other Europe Cf also the findings of Barend A DeVries The Export Experience of Developing Countries World Bank Staff Occasional Papers 3 1967
119
The competitive effect is the difference between the actual growth rate
of Southeast Asia exports to the MDCs (A below) and the growth rate of the
Southeast Asia kind of mix of exports to the NDCs (H below) The competitive
effect so defined is due to one or more of price quality and supply disshy
advantages or advantages as compared to MDC imports of the same kinds
The evidence is that Southeast Asia has been lagging behind in export
growth to the MDCs because of both effects Between 1956-57 and 1964-65
exports of the eight Southeast Asian countries covered fell behind the average
import growth of the more developed countries by 48 The competitive effect
contributed 16 to this lag the compositional effect 32
Exports of the Southeast Asian countries lagged partly because the
region was not on the average able to maintain its base year export share
of the various commodity groups even when the unfavorable commodity composishy
tion of its exports--mainly primary goods particularly foodstuffs and other
agricultural products--is allowed for Some countries did very well with
traditional primary commodity exports
The above study therefore denies the importance of demand deficiency
as a unique explanation of the regions relatively slow export growth
(2)Doubt has been cast on the hypothesis of demand deficiency to che
exclusion of supply considerations by other writers
Commenting on Haizels attempt 1 to demonstrate the demand deficiency
hypothesis Bieda maintains that the actual world trade figures reflect the
Supply effect and the Demand effect together and the two are inextricably
fused in the amount traded 2 He rejects Maizels thesis that the
process of industrialization per se did not have a retarding effect on
1A Maizels The Effect of Industrialization on Exports of Primary Producing Countries KYKLOS Vol xiv 1961 Fasc 1
2K Bieda The Causes of the Export Lag of the Industrializing
Countries A comment KY1OS Vol xv 1962 Fasc 2 pp 485-95
120
the development of exports from the semi-industrial countries He
gives two reasons for this rejection first resources can be diverted
industry as a result of forced industrializashyaway from agriculture to
tion reducing the exportable surplus of agricultural commodities and
second the protectionist policies of the LDCs might divert resources
in general toward the domestic market adversely affecting thcir exports
The generally more rapid inflation in the LDCs as compared to the MDCs
has tended to discourage production for export since domestic demand has
been strong and price competition abroad has been keen
(3) Manmohan Singh has provided data suggesting that for India the
important factor in explaining the behavior ofsupply lag has been an
He ascribes the lag to defective government policies with respectexports
to export duties and export controls that the Indian government followed
Table 28
Growth of World and Indian Exports
A B
Growth of Exports Growth of Exports
1948-50 to 1958-60 1951-53 to 1958-60
Tea World280
Indian110
World133
Indian26
Cotton textiles 179 45 148 97
Tobacco 372 113 252 - 28
Pepper 1444 287 718 157
Castor 200 287 45 22
iCf W Arthur Lewis in a Note (on an article by R W Lindholm)
in Social and Economic Studies March 1960
2Manmohan Singh Indias Export Trends and the Prospects for Selfshy
sustaining Growth Clarendon Press Oxford 1964 p 153
121
during this period Indices of gross profit in Indian industries
(Table 32) show that the large and flourishing domestic demand for new
manufactures stands in the way of exports
Table 29
INDICIES OF GROSS PROFITS IN INDIAN INDUSTRIES
(1950-100)
1951 1952 1953 1954 1955 1956 1957 1958
Engineering 1173 1249 1159 15714 2552 3052 3357 3539
Chemicals 1134 1059862 1066 1519 1764 2127 2355
Cement 1280 1289 1245 1501 1689 1549 1605 1775
Singhs general conclusion is that though there were adverse trends
in world demand it is fair to stress also overvalued exchange rates
export controls and increased domestic absorption as being in part responshy
sible for the lagging exports over the three plan periods (1950-51 to
1965-66)
The empirical evidence above supports one point clearly causes of
foreign exchange shortage may lie on the supply side as well as on the
demand side There is not reason to regard the supply deficiency as less
significant than demand deficiency in explaining the foreign exchange
bottleneck to growth in the LDCs
1Export controls were exercised on jute manufactures tea cotton textiles vegetables oilseeds and oils raw cotton raw wool coffee manganese ore export duties were levied on jute manufactures tea raw cotton raw wool black pepper cotton cloth manganese ore groundnut oil linseed oil cottonseed oil The period covered is 1950-60
122
(4) In a recent study Hollis Chenery and A M Strout examine the performance of 31 LDCs between 1957 and 1962 in terms of three
criteria investment saving and trade They define these criteria
as follows
Investment criterion Initially the rate of growth of investment must be greater than the target growth rate of GNP Thereafter the investment rate must be adequate to sustain the target GNP growth rate
Saving criterion The marginal savings rate must be greater than the target investment rate unless the average rate of saving is alreadyabove this level
Trade criterion Either export growth must exceed the growth tarshyget for GNP or the marginal import ratio must be substantially less than the initial average ratio 2
Of 31 countries studies 12 meet both and 10 meet neither of the Saving and Trade criteria for approaching self-sustaining growth (at a rate of 5 a year in GNP) Failure on the trade side seems to be at least as important as deficiencies in domestic saving and investment A
number of these countries --India Greece Turkey Chile Columbia
Costa Rica Boliva Guatemala and Honduras -- have been characterized by import shortages substantial excess capacity and in some even falling
saving rates
In the 12 countries that satisfy both the savings and trade critshyeria exports play a predominant role Of these 10 have export rates of 5 or more Conversely one of the most significant aspects of the
unsatisfactory performance of countries meeting neither of the two critshyeria is the stagnation of their exports Finally there is almost no example of a country that has for a long period sustained a growth rate
1Over this period Indias share of world exports has declined from 21 in 1950 to 12 in 1960 to 10 in 1966 The export-import ratio was 834 during the first five year plan 562 in the second and 580 in the third See Fourth Five year Plan of India (A Draft Outline)Government of India Planning Commission New Delhi 1966 pp 92-105
2Hollis B Chenery and AM Strout Forign Assistance and Economic Development American Economic Review September 1966 pp 679-733
123
substantially higher than its growth rate of exports through continuing
import substitution In the past Brazil Colombia Turkey and India
have done so for considerable periods but each has run into severe balance
of payments difficulties in recent years1
(5)There is no necessary reason why either the Savings gap or the
Exchange gap should have a termination date though that is of course
desirable for both Fei and Paauw analyze this problem at length
Fei-Paauw model of Foreign assistance and self-help consists of 2 3
five primary parameters and two scale factors They estimate these
values for 31 countries that received over 70 of United States developshy
ment assistance in recent years They observe that the termination date
for foreign assistance (as a proof of foreign exchange gap) is finite for
only 8 out of 31 countries The absence of a finite termination date for
foreign assistance is in most cases associated with a low per capita
marginal savings ratio Their final conclusion is as follows relatively
high values of the per capita marginal savings ratio are associated with
a finite termination date for foreign assistance In other wordr the
inductive evidence seems to indicate that with reasonable realistic values
of other parameters domestic austerity efforts involving a per capita
marginal savings ratio of about 35 are essential for fulfilling the selfshy
help criteria 4
1Ibid p 710
2Primary parameters (1) the initial average saving rate -- so) (2) the per capita marginal savings ratio -- (u) (3) the capital rate of population growth -- (r)
3Scale Factors (1) initial population and (2) initial gross national product
John Fei and Douglas Paauw Foreign Assistance and Self-Help A Reappraisal of Development Finance The Review of Economics and Statistics August 1965 Also Douglas Paauw and Forrest E Cookson Planning Capital Flows for Southeast Asia National Planning Association 1966 esp pp 38 follows Application to Southeast Asia
4 Ibid p 263
124
From the above it follows that first even if the per capita marshyginal savings ratio is high it will not help in narrowing the domestic savings gap if the values of other parameters are not realistic and
second that adequate domestic savings are a prerequisite to reducing
the foreign exchange gap
(6) In another study1 Paauw and Cookson find that of the six countshyries studied by them (Burma Indonesia Malaya the Philippines Thailand and Taiwan) the first two have no termination date for either the domestic savings gap or the foreign exchange gap the next two have a termination date for the domestic savings gap only while the last two have termination dates for both The period of projection covered by them is 1965-1975 and
beyond
In summary the studies above suggest that foreign exchange can be a binding constraint on economic growth In actual practice factors behind emergence of the foreign exchange constraint might lie in the overshyall absorptioi of the economy that is in its capacity to save The implication is that it would be of interest to study the effects of specific
growth-promoting policies of the LDCs on the domestic savings and foreign exchange gaps Regional cooperation in such studies can be useful
2 - Criticism
These savings-gap exchange-gap studies are valiant and commendable efforts to attach numerical tags to conditions for growth But the studies
have sharp deficiencies
Specifically (la) Some of the data are influenced by post-War II and by other war and crisis phenomena affecting prices and production The hope is that these aberrations will average out even though they certainly
Douglas S Paauw and Forrest E Cookson Planning Foreign CapitalRequirements in Southeast Asia The Savings and the Foreign Exchange GapCentre for Development Planning National Planning Association May 1965 (mimeographed)
125
misrepresent the secular trends for individual countries Earlier studies based on data from the first years of the 50s clearly had distortion
built in
(lb) Statistical errors in trade data are large (We discuss this matter in III A below) Errors in trade data for other LDCs must be also
substantial and errors where data have as partial basis financial flows
across borders are likely to be very large Errors in the estimates for
GNP are likely to be larger than those for trade flows and variations of GNP can be substantial for the most of the LDCs where agriculture is a major sector and can be affected for a year or several years by climate
pests and disease Unreliable data are used they are aggregated invalidly
(2) Even if the social accounts data were precisely accurate they measure variables that are related only partially to the causes and conshy
comitants of growth Part of investment as measured in national income accounts does not contribute to economic growth or does not contribute
within the time period under consideration parts of consumption are or
can be critical determinants of growth some growth does not require inputs
of economic resources at all (Our Research Paper 11 Investment vershysus Growth discusses these issues Some of its material is given in
Section III - B below)
In summary these studies use data that have d wide margin of error and whose concepts are only partially adapted to their purpose They anshyalyze only a modest part of the total determinants of growth and so require
implausible assumptions of other things being equal and other things
changing appropriately When the necessary qualifications are added the
significance of these diligent studies becomes very uncertain
126
III - Major Cautions on the Statistics
A - Inaccuracies in Southeast Asian Trade Data
1 The problem procedure
For a number of reasons trade statistics are considered to be among various LDC economic data the most reliable Foreign trade is a well-defined area in which goods move under the noses of customs offishycers Goods are supposed to be counted andor measured systematically for such purposes as the imposition of tariffs subsidies and other regulations In LDCs where foreign exchange is scarce particular attention is focused to the trade rector the single largest source of
demand and supply of foreign exchange
A check on accuracy is presented in the records kept by both trading partners which can be compared side by side Comparable double accounts are not usually available for domestic economic transactions
One countrys exports to another country should be roughly equal in values and identical in typesywith the imports of the receiving country In practice modest differences will result due to transport and other service charges timing lags differences and inconsistencies of classishyfication and transit trading The amounts of these divergence are rarely measured quantitatively Instead any differences in two records are usually assumed away or considered to be caused by the obvious factors especially the transport margin (cif imports and fob exports) For example M Michaely assumes away the discrepancy between two recordings in computing a given countrys geographically-weighted share in world exports The likely discrpoancy is recognized but dismissed
from casual observation one gets the impression that the element of error introduced by differences between the records of the exporting and impoitshying country is not very large2
IM Michaely Concentation of International Trade (Amsterdam North Holland Publishing Co 1962) p 135
21bid
127
For our region in a trade projection study made by ECAFE adjustshy
ment is made for the differences between values of intra-regional exports
and imports by attributing the difference to shipping and insurance 1
charges between the region and outside The freight and insurance acshy
counts in the balance of payments of a given country are often derived
simply by taking some percentage margin of its imports eg Malaya
used 89 and 65 of the cif imports from sterling and non-sterling
areas respectively2
For a study of the accuracy of the regions trade statistics we
selected data from Burma Ceylon Indonesia Malaysia the Philippines
Singapore and Thailand For each of these countries two ratios were
computed
1) Mij (is imports from J) to Xji (Js exports to i)
and 2) Mji (Js imports from i) to Xij (is exports to J)
where j is a given Southeast Asian country and i is js trading partner
The trading partner countries include both Asian and Developed Western
countries (approximately 30 in all) 1 and 2 are defined respectively
as the export and the import ratios of j country For most of these bishy
lateral or pairwise comparisons the average value of 1962 and 1963 trade
figures is used in order to minimize differences that can result from time
lags in the reports of any two trading countries3 For Indonesias exports
(import figures not available) and some minor cases of other Southeast
Asian countries only 1962 figures are used due to the lack of suitable
figures and comparable data for 1963
1United Nations Review of Long Term Economic Projections for Countries
in the ECAFE Region 1964 p 199
2Department of Statistics States of Malaya States of Malaya Statistics
of External Trade 1963 Vol 1 p 11
3The trade data are taken primarily from 1962 and 1963 issues of the
United Nations Commodity Trade Statistics and partly from the United
Nations Yearbook(s) of International Trade Statistics Data for some
minor cases are from the International Monetary Fund and International Bank
for Reconstruction and Development Direction of Trade a Supplement to
International Financial Statistics Annual 1961-1965
128
Standard deviations and t statistics were computed (Section 2
below) to assess the probability of a systematic bias in each of js
ratios Then F statistics measure whether or not there exists a
significant difference between the variance of js intra-regional trade
ratios and Js trade ratios with more developed countries In section
3 below the discrepancy in trade data is observed again after trade
values of each country are adjusted by the difference between official
exchange rate and the free or black market exchange rate Examshy
ination of the pattern of individual commodity trade statistics follows
in section 4
2 The Errors
The ratios of all pairs of recordings for every Southeast Asian
countrys exports (JjXji) and imports (MjiXij) are plotted in Charts 1
and 2 respectively Each ratio is marked by a lower case letter which is
the initial of J the Southeast Asian country Corresponding trading
partners are given on the horizontal axis (Absolute values of each
paired recording and the ratios for individual Southeast Asian countries
are given in Table 33) A dotted horizontal line is drawn on
each chart to indicate indentical values (the ratios = 10) of paired
recordings If bilateral pairs of recordings are accurate then the
ratios should be slightly above this line (perhaps usually 106 to 114)
since imports are typically valued at cif The diversion of the ratios
from the line measures the influences of obvious causes such as transshy
portation and other charges and of uncertain factors such as errors and
deliberate falsification
Conspicuous in both charts (and especially Chart 1) are the wide
dispersion and variation of the ratios Transport margins do not adeshy
quately explain the discrepancies Many ratios demonstrate flagrant
discrepancy with the higher figure of a pair 100 or more above the
lower figure Ratios for Indonesia reach as high as 4800 A surprising
number of ratios fall well below the dotted line in both charts--a
deviation in the reverse direction from what the transport cost margin
could explain for the region as a whole almost one-third of the total ratios
129
lie below 10 The discrepancy in these pair records that have ratios
less than one is larger than it seems on the chart The overstatement of Xji (or Xij) in relation to Mij (or Mj ) is proportional to the recipshy
rocal of ratios of MijXj (or MjiXij) between 10 and 0
Most of Singapores MijXj ratios can be piausibly explained Out
of 25 ratios (Chart 1) 22 are below 10 The plausible qualitative
implication of these low ratios is difference in labels not statistical
error Singapores entrepot trade is large and much of such exports
are not recorded as being from Singapore by her trading partners Simshy
ilarly Singapores import ratios MjiXij (Chart 2) are generally much
greater than one suggesting that countries exporting via Singapore as
antrepot often list those exports as going to the ultimate destination
while Singapore customs enter the goods simply as an import (only 2 out
of 26 ratios fall below one)
In Direction of Trade export and import figures for a non-reporting
country are derived by using a 10 margin as a norm that is if ratio
values for MX of 110 are accepted as reasonable a significance test
(the t test) can be applied to judge whether or not the average ratio
of each Southeast Asian country can be explained by normal statistical
error Data for each j country were evaluated separately since there is
considerable variation from country to counry We have assigned et~ual
weight to ratios of all paired recordings but have excluded ratios
involving absolute values less than $20000 in either X or M on the
grounds that small absolute errors can in these cases lead to large proshy
portionate errors The exclusions have eliminated most of the extreme
ratios Results of the significance test are given in Tables 33 and
34 for exports and imports respectively
A survey of Column 2 in both Table 33 and Table 34 shows that the
average ratios of HijIXji and MjiXij usually differ considerably from
the assumed norm ratio of 110 For half the ratios the deviation is
significant using the t test with the 5 criterion of significance
as the watershed the other half fail the criterion
Even for the former cases however it is difficult to accept the
notion that the average and the expected ratios belong to the same unishy
verse with differences due only to normal statistical errors A large
130
value for the computed probability (associated with a low t value) might
have resulted either from a small difference or from a large estimate of
the standard error--or both For example relatively satisfactory t
values shown for Burma Ceylon and the Philippines seem to have resulted
mainly from high values of the computed standard errors Espectally for
Indonesia little statistical meaning can be inferred from its t value in
view of the wild implications of the other two sets of statistics
Two exceptional cases out of 13 in all are consistent with aggreshy
gative trustworthy data Thailands export ratio and the Philippines imshy
port ratio I indicate satisfactory and acceptable results in terms of both
the average ratio and the estimated standard error (But for Thailands
import ratio and the Philippines export ratio the consistency does not
exist) Save for the two exceptions we can reasonably regard the
MijXjis and MjiXijs of these countries as random samples with respect
to the expected value of 110
1The use of the 10difference for the Philippines is not correct
since this country reports its imports at fob value (which is reflected in the low average import ratio 98)
i(4bO) CHART 1U568-7)16 (10 i9) patio of Trading Partners
(69) (9- 3) -(5-9) a- (68) Imports from Southeast Asia36) A 0 ) i36) i(4) Countries(I-) to Corresshy32)( 5
pond ing Exports of Southshy(-4 east Asian Countries(Xji+)a( -(3o0) p 3L(29) 1962-1963 Averages
b
iXj forp = biupb m
b Ceylon = t2bullo t pFed of
i halaya =M
= iIndonesia m Philippines = p
Thailand tm p tn tSingapore =s in~ t rb
0+ p t tb0n deg tPb
00 t --- ---------
--------------Op PC b
b pt t t
t
t____ tao __p___ r e1 )0
Countries(i)E D
c(661O)CHAIRT 2
2
t(36)
0(6o)
s(2L2)
b(60)t64l M(4) t-
os(22)Countries
) (28) m(30)
(7) b(27)
Ratio of Southeast AsianImports (M )
to Corresponding Expors of Trading Partners (Xi)1962-63 Averages
m(28)
2
On
at
b
P
9p
m
s
14s am
p
s
et
S
0
sPhilippin6s
8 b t
as
c mso8
MjiXij for
Burma CeylonFed of
laya
Thailand Singapore
= =
= = = =
b c
M
pt s
0
o 8P tb bullt 0
so S
P ~
b S
-f 8
a
go OP bba t i a t a t n t I
OC b t b brnb M- - 9
am OP R
Op Op
0
vi W
r
0 ca9 1A
+ ID 4shy
0 6
Trading Partner Countries~i)
133
A Test of Average Export Ratios (MijXji)Table 30
Assumming an Expected Value of 110
Average Ratio Computed Computed Value ofNo of
StandardTrading Part- (MXji) Standard
ners (i) Compared 1 Deviation Error
(5)(3) (4)Country (1) (2)
2081 Burma 20 1433 716 160
283 121221 1443 1295Ceylon 25 1143 405 081 531
Thailand 417 43082105 2165Malaya 27 085 -752942625 460Singapore 125 188861324 1336Philippines 5635 16952768110470Indonesia 24
Assumming an ExpectedTable 31 A Test of Average Import Ratios (MjiXij)
Value of 110
No of Trading Average Computed Computed Value of tStandardStandardRatioPartners (i)
Compared (MijXji) Deviation Error
(4) (5)(1) (2) (3)
254 1083121723 1375Burma 232 86622 1301 1086Ceylon 237326 1463 778 153
Thailand 150 2725 Malaya 28 1509 796
105 366752425 1485Singapore -110124 991 485 099
Philippines
134
The assumption of the 10 margin used above though plausible is
arbitry Transport and other service costs vary according to such inshy
fluences as value volume and type of goods traded and distance Accurate
information on these costs is not available But these costs even if
available and accurate could not explain the violence and directions of
the deviations shown in Charts 1 and 2 and the results of Tables 30 and 31
Our tests of trade data of Southeast Asian countries indicate frequent
and large errors But conclusions are less gloomy if we divide the MX
ratios into two groups
(a) their trade with other countries in the region and
(b) their trade with more developed countries (MDCs) including Japan
A statistical measure of the dispersion in terms of variance and F ratio
for individual Southeast Asian countries is given in Table 32
The import ratios for Table 32 show variances for intra-regional trade
(Column 1) uniformly higher than those with the MDCs (Column 2) Also
the import ratio values of F indicate that the probability of obtaining
values of F as large as those observed fails at the 5 criterion of
significance We conclude that the variances of import ratios for the two
groups of countries differ significantly
For the export ratios the result is slightly different Values of
variance and F for the intra-regional trade of Indonesia Burma Malaya
and Singapore are larger than those values for their trade with MDCs But
for Ceylon Thailand and the Philippines the variance with developed
countries is larger than that with Asian countries The F ratio for the
two latter countries is small enough however so that we can judge no
significant difference exists between the variances of the two sets of data
Ceylons F value indicates that the variance of its MDC trade is signifishy
cantly larger than that of its intra-regional trade But this high varishy
ance with the MDCs is to a great extent illusory since it is largely the
result of one untypically high MijXj ratio 6810 with Sweden When
Sweden is excluded Ceylons variance with the MDCs is 048 and is signishy
ficantly smaller than that with Asian countries
135
We conclude that data on Southeast Asian countries intra-regional
trade suffers from much more of discrepancies than data for their trade 1
with developed countries This finding encourages the use of MDCs trade
data to measure Southeast Asias trade with them especially whenever
data from Southeast Asian countries are not directly available
There has in recent years been rising interest in regional coopershy
ation among ECAFE countries The analysis presented so far implies that
studies of the benefits and costs of any integration scheme for the region
must rest on the shaky foundation of conspicuously wrong trade data The
shares of intra-regional trade surprisingly high for these countries save
for the Philippines vary substantially depending on which trade data are
used For example the percentage figure for Indonesias exports to less
developed Asian countries is 4142 according to the countrys data and
5436 according to that of its trading partners Similarly intrashy
regional import shares of Malaysia are 43807 according to Malaysia data
and 6432 according to partners data There also are many vexing cases
where a trade surplus (or deficit) in one recording reverses itself and
becomes a trade deficit (or surplus) in the other recording
1That MDC trade data show smaller discrepancies is evident in a frequency distribution we have made of bilateral ratios of exports and imports of the US Canada the UK the Common Market countriep and Japan with 14 MDC trading partners For almost all countries in our sample period 75 or more of export and import ratios for pairs of countries fall within the 90 to 129 range Most of the remaining ratios do not diverge much from that range Some error is suggested most clearly in the range below about 106 but not the wide errors of our LDCs
136
Table 32 A Test on Variability of Export and Import Ratios of Southeast
Asian Countries with Asian and More Developed Country partners
ImportRatio (M Xi) Export Ratio (Mi1X i)
Variance F Ratio Variance F Ratio
Asian Developed 1 2
12 Asian Developed 3 4
34 or 43
Burma 2798 295 9471 907 154 5874
(11) (12) (10) (10)
Ceylon 2581 (10)
033 (12)
78147 252 (9)
2861 (12)
13385
Thailand 1031 053 19505 148 160 1080
(14) (12) (13) (12)
Malaya 931 (16)
265 12)
3507 7722 (15)
379 (12)
20367
Singapore 417 (14)
076 (11)
5465 250 (15)
052 (10)
4801
Philippines 483 (12)
008 (12)
57003 284 (12)
484 (12)
1706
Indonesia - - - 1353010 2878 470136
(13) (11)
Note Computations are based on data given in Table 33 Ratios inshy
volving absolute values less than $20000 in either X or M are excluded
The numbers in parentheses denote the number of trading partners (i) considered
Each F ratio is computed by placing the larger variance in the numerator
137
3 Effect of Adjusting Trade Data by the Exchange Rate
The trade data of Asian countries (except Korea and the Philippines)
initially reported to world institutions such as the UN and IMF in domshy
estic currencies are converted by these institutions into dollar equishy
valents according to each countrys official exchange rate The conversion
though convenient may be a source of discrepancy since the official exshy
change rates of many Asian countries are over-valued The rates are mainshy
tained by exchange controls and trade regulations that encourage individual
exporters and importers to overstate or understate their reporting The
controls also encourage black market transactions
In order to observe how discrepancies are modified by the use of
more realistic exchange rates the trade figures of each country have
been adjusted by using the free or black market exchange rate of the
particular country Selection of the free or black market rate has
been determined by data availability -- this and the official rate genershy
ally are the only exchange rate information available Since the proshy
portions of free and official rates in which reported trade is initially
transacted are not known using the free or black market rate does
not by itself eliminate the arbitrariness in the exchange rate adjustshy
ment made here In the adjustment the conversion factor of the country
or the ratio of its official exchange rate to its free or black
market rate (average of monthly figures) has been multiplied by the dollar 1
value of the countrys trade Application of this adjustment is made to
all Southeast Asian countries and their trading partners (except the US)
1The monthly exchange rates as well as official rates have been
taken from 1966 Picks Currency Yearbook (New York Pick Publishing Co 1965) A 24-month average (1962-63) is used for the free or black market rate and a 12-month average where trade figures are available for only one year
138
The conversion factor that measures the extent of over-valuation of a countrys exchange rate varies--estimated as the ratio of the official rate to the free or black market rate--substantially in 1962-63 among Asian counshytries ranging from nearly I for Hong Kong Malaysia the Philippines and Thailand to low values for India (670) Ceylon (503) Burma (434) and Indonesia (118) for 1962 and 1963 For all MDCs there is some deviation from one the range being from 1090 to 915 (to 996 if Japan is excluded) 1
In general the ratios of bilateral recordings derived from the adjusted trade figures reveal a deviation from one greater than that of the unadjusted ratios Little difference from unadjusted figures is shown for the bilateral ratios of Malaysia the Philippines Singapore and Thailand with MDCs The results reflect the likeness of conversion ratios of the two groups of counshytries Greater discrepancies from the unadjusted ratios are observed in the ratios of Burmas Ceylons and Indonesias trade with developed countries For intra-regional trade deviation is greater compared to unadjusted results for every Southeast Asian country
Table 33 presents averages standard deviations and coefficients of variation for both export and import ratios using the adjusted data On the whole both averages and standard deviations are considerably greater than those given earlier in Tables 30 and 31 And all import and export ratios of the adjusted data (except with Singapores exports) are more widely dispersed around the average ratios than are those of unadjusted data as shown by the coshyefficients of variation This result holds especially for the import ratios (The unadjusted data coefficients are given in parentheses in Table 33)
1US data are not adjusted because the exchange rate of other countries is given as the price of dollars in terms of their currencies
Table 33 Averages of Export and Import Ratios Standard Deviations and Coefficients of Variation on the Basis of Adjusted Data
Export Ratio Import Ratio M X Xij
Country j Average Ratio
Computed Std Deviation
Coefficient of Variation
Average Ratio
Computed Std Deviation
Coefficient of Variation
1 2 3 (21) 4 5 6 (54)
Burma 3288 2189 666 (500) 1568 4758 3034 ( 885) Ceylon 2722 2632 967 (897) 756 661 874 ( 835) Thailand 1027 457 445 (354) 2939 6383 22172 ( 532) Malaya 1908 2090 1095 (1029) 2320 2500 1076 ( 528) Singapore 371 296 798 (926) 2401 2851 1187 ( 353) Philippines 1218 664 545 (459) 1860 3664 1970 ( 489) Indonesia 175195 221050 2940 (2664)
Notes The dumber of trading partners (i) is the same as that given in Tables 33 and 34 for each j countryCoefficients of variation given in parentheses are those based on unadjusted trade data and derived from average ratios and standard deviations given here and in Table 34
Ishy
140
4 Commodity Trade Statistics in Detail
The analysis so far has dealt only with totals for exports and imports
of given countries not with individual commodities One can expect the
discrepancies in data to be larger and more dispersed on a finer scale than
when we deal with totals Large differences in totals eg Xji and Mij
prove marked discrepancies in individual commodity items that make up the
totals But small differences in paired recordings do not necessarily reshy
flect similarity they may be due to the cancelling out of opposing errors
in the data for individual commodities
The Philippines is selected for two reasons to illustrate the discrepshy
ancies in commodity data For one reason this country is the only Asian
country that reports fob values of its imports in US dollars (theoreticshy
alli Mji should be equal toor very close to Xij) thus eliminating the proshy
blem of transport costs Also discrepancies in the countrys total exports
and imports are small compared with those of other Southeast Asian countries
(except Thailand) --- thus presenting a limiting case of only modest error
The commodities considered are nine groups of the one-digit Standard
International Trade Classification (SITC) excluding Goods Not Classified by
Kind Bilateral ratios of the countrys exports and imports with the four
largest trading partners are given by commodity groups in Table 34 Also
shown in Table 34 are the weighted ratios (SMjiSXij) and (SMijSXji) with
all trading partners (the four largest plus all others)
In bilateral comparisons of ratios for all totals that of the grand
total as well as of the major trading partners ratios are usually not far
from 1 (last column of Table 34) The individual commodity ratioshowever
exhibit wide variation The Philippines-US export ratios by commodities
for example vary from 1524 for SITC-8 to 0 for SITC-3 and SITC-7 (no values
recorded by the US positive values by the Philippines) whereas total
MijXji is a plausible 106 And when SMijSXji is 111 the commodity ratios
range from 1445 to 43 Similar dispersions hold for import ratios
Out of 178 bilateral export ratios of country-commodity recordings
(not shown here) 78 are less than 5 and 35 are greater than 20---uiider or
overstatement of XJi by more than 100 compared to Mij Similarly for import
ratios 70 out of 191 total are less than 50 and 26 are greater than 20
Philippine Export Ratios and Import Ratios by commodities withTable 34 I
the Four Largest and with all Partner Countries
6 7 8 0 R Countryi 3 SITC 2 0 1 2 3 4 5
Ratio Conr
93 98 105 0 1524 106109 126 85 0Export US
99 127 13957 181 125(MijXji) Japan 126 422 124 52 151
0 4009 - 030 122 41 0
49 0 0 126 Netherland
W Germany 139 1311 125 0 73
66 101 69 9698 500 204 114 125 100
Import US 71 82(MjiXij) Japan 97 26 101 121 91 82 74 87
93 W Germany 261 167 174 100 92 92 58
76 103667 125 120 105 101 102UK 107 72
43 90 128 106 426 1445 111110 148 108Export
(M ij5Xji)
All Partner 4
Countries
98 15 157 209 133 101 74 97 72 94 Import
(IMji AXij)
Computed from trade data for 1962 and 1963 given in United Nations ECAFE Foreign Trade Statistics of Asia and
the Far East Vol I No 1 and Vol II No 1 1965 and 1966 for the ECAFE countries and various issues of United
Nations Commodity Trade Statistics for other countries
2SITC commodities are Food and Live Animals (0) Beverages and Tobacco (1) crude materials excluding Fuels
(3) Animal Oils and Fats (4) Chemicals (5) Basic Manufactures (6) Machines and (2) Mineral Fuels etc Transport Equipment (7) and Miscellaneous Manufactures (8) 3For both ratios the countries are listed in descending order of Xji and Mji
4Twenty-six countries are included
142
5 Concluding Comment
There are a number of possible reasons for errors in trade data
1) Transport costs will as we have seen create a discrepancy between fob
export and cif import values 2) Different recording definitions are 1
used by different countries The entrepot trade of Singapore with other
countries of the region is as we have also seen not treated congruently
in their respective records And for specific trade commodities sub-items
may be differently defined and so be entered under different aggregated
headings Customs officers may have considerable discretion as where among
several plausible categories a given item should be listed
But the discrepancies are often so large that these innocent explanashy
tions plainly fail 3) There may be simple error in counting and recording
4) Countries with considerable tariffs and other trade barriers and with
poorly policed boundaries on land or extensive shorelines on the ocean
invite attempts to smuggle Smuggling enterprises in the Philippines are
said to be notably successful and Indonesia was like England made by
heaven for free trade 5) Customs officers may be encouraged by suitable
tokens of friendship to understate quantity and quality of imports where
these are taxed similarly for exports where these are taxed 6) The
major channel for illegal transfer of wealth between countries is undershy
invoicing of exports and over-invoicing of imports
The purposes of capital flight may be (a) avoiding taxation and legal
seizure of ill-gotten gains (b) avoiding the risk of taxation or confiscashy
tion of legally-gotten property (as of the Chinese in Indonesia in 1959-61
and later) (c) avoiding property destruction from domestic disorder or
from war (d) avoiding loss of value of liquid assets through inflation
(e) transferring funds for the care of relatives abroad or to meet debts
accruing abroad or to provide for ones retirement abroad These transfers
may be illegal under exchange control laws or difficult or likely to
lead to unpleasant questions about the source of the funds and whether all
taxes had been paid or simply to uncomfortable knowledge by the authorities
about ones asiets
1See R G D Allen and J Edward Ely eds International Trade Statistics (New York John Wiley and Sons Inc 1963) for detailed appraisal of international trade statistics and definitions
143
Much can be done by energetic customs administrations to correct the
causes of discrepancies numbered 2 and 3 above But 4 5 and 6 are
more resistant They will be less serious sources of error if tariffs and
other trade restrictions are lowered if exchange controls wane and a
economic development in general progresses and so probity and efficiency
improve 6 is a major source of error though the error will not be
visible in the statistics unless different documents are entered in the
exporting and importing countries It is said that in some countries a
10 to 20 percent misrepresentation of the quantity andor quality of traded
goods is normal In one case that has come to our attention a large export
from a Southeast Asian country was under-invoiced by 90
Errors in trade data are substantial and plainly can be overwhelmingly
large Of our original MX ratios imports and exports taken together
62 per cent well over half are in a range that is prima facie evidence 1
of error
For countries with high tariffs or equivalent bars to the international
movement of goods and with legal or other bars to the export or import of
capital substantial errors in trade data are likely to continue For some
countries -- those with inviting boundaries high hurdles to the movements
of goods or of capital and lakadaisical administration--the best guess
of an informed and conscientious outside student can be more trustworthy 2
than the official figures
1Taking 130 and 90 as tolerable limits to discrepancies 198 out
of 318 observations fall outside the range Difference in origin-classshy
ification is the only other significant explanation as not due to error
and may well explain descrepancies for Singapore
2Detailed statistics relevant to much of the discussion of the abive
pages are available in our full study
144
B Inaccuracies and misleading concepts in the standard national income statistics
We have been very concerned that in these pages conventional and misshy
leading interpretations of national social accounts and their sub-categories
should not creep in as they can so easily do to distort analysis and
conclusions
1-Errors in LDC social accounts
It is a truism that the social accounts of LDCs are less accurate
than those of MDCs The reasons partly lie in scarcities of skills and of
time a measure of the pressure of economic realities on the statistics
offices of the various countries governments give higher priority to other
uses of their funds and training resources (In one country of our region
the basic social accounts reported to the UN were developed in two weeks
by an available non-specialist) The methods of estimation and the diffishy
culties of estimation of macro-totals vary widely The accuracy of results
therefore varies considerably A general rule is that where there is inshy
centive to misrepresent the figures will be biased and where difficulties
of estimation are great random errors will be large
In most countries government reported tax and expenditure data are
quite accurate In other sectors errors increase Simon Kuznets a long
time research worker in the US on national income data some years ago
with his fellow workers once put down estimates of the estimated -ange
of error in three classes With an estimated error of under 15 basic
manufacturing and public utilities -- With estimated errors above 15
but below 30 agriculture mining manufactured gas pipelines trade
banking insurance and government -- With errors of 30 or more construcshy
tion water transport real estate direct service industries and miscelshy
laneous
What is the implication of Kuznets estimates of error for the range
of-error to be expected in LDC income data
Kuznets found the least error in manufacturing and public utilities
The first produces normally a small segment of total production in LDCs
and usually the second also Relatively large segments of productive
activity in lower income countries are in agriculture construction and
service industries All these lie in the 15 or more error clas3es
145
Where data are not written down accuracy suffers because respondents
genuinely do not know what the facts are Often accuracy suffers because
respondents are uncertain of the meaning of inquiries or because of the
demands of courtesy The average farmer knows only roughly what the yield
has been of crops not grown for sale His uncertainty may have a bias
added by suspicion that his answer will in some way influence the taxes
he must pay
It is difficult also to value output that is not sold in the market
In the LDCs much of what is produced especially in agriculture goes into
home consumption and not the market At the market place part of the goods
brought in may be bartered not sold for money
-- givenBut improvements in the accuracy of the national accounts
their concepts and detailed definitions -- have been proceeding steadily
And to some extent one can diminish the inevitable errorsin recent years
by averaging (as Kuznets does) using the average of 2 years or 5 to 10
One should avoid using as base periods years that are clearly abnormal
like the late 1940s and the early 1950s when adjustments to the ending
of World War II were incomplete or the early 1950s again when the Korean
War was causing sharp rises in primary product prices Studies of Southshy
east Asia trade and incomes are becoming more significant as these years
recede into perspective
the LDCs and specific-The application of the national accounts to
ally those of Southeast Asia involves special problems of interpretation
There is in LDCs more fusing of economics and social activities than in
the higher income countries for which the accounts were primarily designed
Separating out economics from the blur requires rule-of-thumb decisions
arbitrary at the margin
Also averages and aggregates in the social accounts can move mis-
They may for example rise because of higher production inleadingly
a few export industries while nearly all the population live as before
back in the bush away from port cities mines and plantations Still
worse as in Africa the indexca may rise as male workers migrate into
mining employment while back in the villages farming deteriorates -shy
-- and wives and children find family lifeunmeasured in the indexes
disrupted Some of this disruptive movement to employment and away from
families exists also in Southeast Asia
146
2 - Misleading categories for LDC growth analysis
But a further and more important worry inhibits our use of the national
accounts in Southeast Asia and in other LDCs as a measure and guide
for social policy and so as a guide to the economic effects of regional
integration
The basic concepts of the social accounts are astray from the purposes
of growth analysis The accounts were formulated and defined in the 1930s
and 1940s and are still dominated by the interests of those two decades
The over-riding interests of the times were the desire to interpret and
to shape policy on business cycles (the Great Depression and the World War II
and postwar inflations were concerns) and to classify production
(especially during the war years)
The particular special-purpose of social accounts is due in surprising
measure to Keynes and other economists with interest in cycle analysis in
the late 30s and in the 40s1 Keynes was unworried about the division
in the national accounts between consumption and investment because he
was concerned with the motives of groups of spenders Any reasonable
definition of the line between consumer-purchasers and investor purchasers 2
will serve us equally well provided it is consistently applied His
purpose was the analysis of unemployment and the business cycle
His light-hearted view on the social accouns is inappropriate if
ones aim is instead to understand the process of economic growth The
standard accounts were not focussed on and turn out to be ill adapted co
interpreting the growth problems of less developed countries The basic
categories of consumption and investment are misleading and partial when
applied to growth problems It is more usual than not for reasoning and
policy to go astray through assuming that one can analyse growth issues
in terms of the conventional national income categories
1General Theory Macmillan London 1960 p 61
2Edward F Denison Report on Tripartite Discussions of National Income Measurement Studies in Income and Wealth vol 10 Conference on Research in Income and Wealth National Bureau of Economic Research
New York 1947 Referred to in John W Kendrick Restructuring the
National Income Accounts for Investment and Growth Analysis Statististisk Tidskrift No 5 1966 p 354
147
For example the central problem of growth is conventionally portrayed
as extracting more (national income concept) savings out of an economy in
order that there can be more (national income concept) investment The
majority of academic and official discussions take this framework for
granted But in all economies this is sharply imperfect reasoning and
in LDCs it can be flagrantly wrong In low income societies a very large
proportion of the population possibly the great majority live at consumpshy
tion levels that closely determine the health and energy that in turn detershy
mine productivity Carl Shoup concludes there is a range of consumption
where the ratio of marginal products to increased consumption reaches the 1
order of 20-to-i to 80-to-l Increased food supplies -- calories and
protective elements both -- can be the critical requisite for increased
production More consumption can also offer necessary incentives
To the extent this effect is important cutting consumption in an
LDC economy (for example by higher taxes) in order to have more savings
for conventional investment can have the effect of reducing production
not increasing it
The crucial matters of the general health energy skills and incenshy
tives of the working population are completely neglected in the traditional
analyses focussing on national income consumption versus investment that
is they neglect human capital and various forms of social capital
nourished by consumption outlays
Nor is national income investment either locally or empirically
necessarily to be closely associated with growth Conventional capital
includes public buildings and luxury housing and prestige-orientated public
buildings Capital may stand idle or be used only one shift a day due to
lack of demand and effective organization There may be frequent holidays
and long weekends and frequent absences from work due to debility sickshy
ness and lack of incentives Scarcity of conventional capital need not
be an important bottleneck at allAnd sometimes a high priority route
to higher production does not draw on real resources at all for example
leisure time can be used productively
Where absenteeism from illness is due to too little consumption
and where childrens low consumption forces down their future productivity Carl S Shoup Production from Consumption Public Finance vol xx no 1-21965 pp 173-202
148
Our concern in this research project to avoid the conventional and
misleading uses of the standard national accounts in reasoning on economic
growth and its relation to regional cooperation suggests the possibility
of useful future research to improve the regional accounts so that they
can be more useful
A model that could be productively followed in improving the national
accounts of the region is offered in the work of John Kendrick of the Natshy
ional Bureau of Economic Research in New York Using US data Kendrick
has been experimenting with redefining social accounts categories so that
they interpret growth more effectively He does not go so far as to
estimate non-economic inputs that raise production He does add to
convenlional investment other uses of resources that increase productive
capacity
Parts of these are purchases of durable goods plus inventory change
of consumers and of government The rest consists of intangible outlays
(1) education and training
(2) medical and health outlays
(3) research and development
(4) mobility costs and perhaps--an optional item-shy
(5) costs of rearing children to working age
Much under these headings is usually classified as consumption
Kendricks total investment turns out to diverge widely from official
investment estimates This total investment is much larger its share of
GNP has grown as GNP has grown and it is more stable cyclically In 1965 1
his total investment is $422 billions or 380 of higher than the official
(gross) investment figure of $111 billions
1Excluding rearing costs If they are included total investment is $476 billions In the present official estimates gross investment is 16 of GNP Kendricks total investment is 47 or 53 of adjusted GNP dependshying on whether rearing costs are excluded or included
149
Kendricks work is a major advance toward shaping national accounts
so that they interpret better the process of economic growth Similar
work in LDCs specifically in Southeast Asia should be very fruitful
toward better reasoning on growth and so toward better policy Such efforts
could well be supported by international or national aid programs
To our knowledge it has not been attempted in LDCs save for a small
study in Singapore
Continued from page 148
Total investment as a share of adjusted GNP has risen from 38 in 1929 to 47 in 1965 The contrast suggests reasonably enough that the share of income a society devotes to future growth rises when income rises
A summary of this experiment-in-progress is given in John W Kendrick Studies in the National Income Accounts Forty-seventh Annual Report National Bureau of Economic Research June 1967 pp 9-15 An earlier fulshyler report is his Restructuring the National Income Accounts for Investshyment and Growth Analysis in Statistisk Tidskrift No 5 1966 pp 353shy365
See also our fuller analysis of this basic problem Research Paper 11 shyInvestment vs Growth published in Economic Development and Cultural Change April 1969
150
IV - NATIONAL PLANS AND REGIONAL INTEGRATION IN SOUTHEAST ASIA
To what extent have national plans had implications for economic inshytegration in Southeast Asia And to what extent have successes and failshyures in plan implementation had systematic relation to regional economic interest We seek to shed light on these questions in this summary section
A - Planning Patterns
Planning as a means accelerating economic growth has become a catchshyword and an orthodoxy 1 Whether a national plan is formal or eclectic its inevitable characteristic is multiplicity of goals all associated in
2some sense with nation building In those countries where formal
1At the national level the most striking event of the early nineshyteen sixties has been the widespread adoption of planning as a tool ofeconomic and social policy In the nineteen fifties relatively few deshyveloping countries had national plans for economic and social developmentthough numerous countries had elaborate medium term programmes for specificsectors or regions of the economy Since the turn of the decade howeveralmost all of the developing countries--often with the encouragement of national multi-lateral agencies concerned with international developmentassistance--have undertaken the formulation of medium-term or long-termplans as a means of guiding their current policy decisions Two majorevents occasioning this upsurge in planning activity were the achievementof independence by many African countries and the launching of the Alliance for Progress in Latin America A more fundamental and general cause howshyever was the widespread realization that the acceleration of economic andsocial development requires a more long-sighted approach to policy formushylation it has come to be understood that current policy decisions can nolonger be made simply in response to the circumstances of the moment buthave to contribute actively to bringing about the structural and institushytional changes which underlie economic development United Nations World Economic Survey 1964 pp 3-4
2As one strong instance of this we may quote the following We are neglecting our wealth purposefully because we are concentrating on nationshybuilding said Dr Subandrio ex-Foreign Minister and Deputy Prime Minister of Indonesia Straits Times December 7 1963 Quoted in Clair WilcoxThe Planning Straits and Execution of Economic Development in SoutheastAsia Harvard University Center for International Affairs Occasional Papers 10 January 1965 Economic development has not been the central concern of any government in Southast Asia ibid p 43
151
plans have been instituted--countries like India Pakistan and Malaysia-shy
the measurable role of the public sector in direct economic decision making
has been increasing over time1 In other countries where no formal plans
have been instituted the State systematically assumes responsibility for
promoting private enterprise In both cases the role of the State in the
economic life of the people has been increasing
1 Two Directions of Policy in LDCs
The two over-riding popular aims of economic policy making in the
LDCs are (a) diversification of exports and (b) import substitution2
Diversification of exports has seemed necessary to LDC policy makers
(in part wrongly - see Section I) because of alleged inelastic demands
for primary products in the world markets Import substitution has been
partly the result of foreign exchange difficulties and partly--this is
crucial--it is the expression of the urge to nation-building itself In
short planning for economic development has meant in the LDCs in large 3
part planning for industrialization
1For instance The share of the public sector (ie the government sector) has steadily grown in the Fourth Plan about three-fifths of all investments will be in the public sector Fourth Five Year Plan of India 1966-1971 Planning Commission Government of India p22
2R id development cannot be achieved in the future simply by conshy
tinuing the traditional pattern of economic growth The twin pillars of the Malayan economy rubber and tin will remain important for some time to come but they cannot be expected to contribute significantly to income growth First Malaysian Plan 1966-1970 Juala Lumpur 1965 p 6 The most important of the long term objectives (in Malaysia) is the need for economic diversification and industrialization Ibid p 15 although attempts will be made wherever possible to promote the growth of exports efforts to solve the problem (of foreign exchange) will probshyably have to rely mainly on import substitution Ibid p 16 If industrialization and diversification of the economy are to be rapid enough the country must aim at developing basic industries and industries which make the machines needed for further development Third Five Year Plan of India Chapter 2 p 27
3Both countries (India and Pakistan) tended to identify economic development with industrialization achieved principally through import substitution and without significant regard for considerations of comparashytive advantage Edward Mason Economic Development in India and Pakistan
152 2 Two Patterns of Growth in Southeast Asia
Two distinct patterns of growth are observable in Southeast Asia the Inward Looking and the Outward Looking The Inward Looking pattern--that ofBurma Ceylon India Pakistan Indonesia--has been generally characterized by() strict control of resource allocation through formal planning (ii)strict trade and capital flow controls and (iii) some disposition to nationalize foreign enterprises Recently Ceylon to some extent and Indonesia more emphatshyically have retreated from this pattern The Outward Looking pattern--that ofthe Philippines Malaysia Thailand Taiwan--has these characteristics in milddegree or not at all The Outward Looking group has followed relatively liberal trade policies and their exchange rates have been adjusted where needed to achieve equilibrium1
continued from page 151 (Center for International Affairs1966) p 12
Harvard University Press SeptemberReporting in 1960 the Food Agricultural Commission of Pakistannoted It is essential to appreciate how very recent is the sense of anyurgency for increased agricultural production Report of The Food andAgriculture Commission (Karachi Pakistan 1960) p 150
IPT Ellsworth has observed In the Philippines the price levelshowed no net upward movement until after 1959 from then to 1963 it advancedat an annual rate of about 4 percent A 60 percent devaluation in 1962 seemsto have been effective in overcoming any currency overvaluation that may havepersisted from World War II for exports responded vigorously in the followingyear Thailands inflation rate was approximately 5 percent per annum sinceexports increased at 64 percent a year (at about the same rate as GNP)there would appear to be little reason to believe the haht was overvaluedeven with a virtually stable exchange rate In Taiwan where inflation wasat an average rate of some 9 percen- a year exports were buoyant partlybecause any tendency for overvaluatin to appear was quickly offset by recurshyrent and substantial devaluation (1951 1953 1954 1957 and 1958) andpartly because import substitution or industrialization succeeded in openshying up lines of production that expanded from import substitution into exportmarkets Import Substitution Growth and the Balance of Payments SomeComparisons June 1967 Madison Wisconsin mimeographed
153
The Outward Looking group of countries have in the 1950s and 1960s
shown a better record than the Inward Looking Group with respect to rates
of growth of GNP productivity increases increase in import capacity (ie
income terms of trade) price level stability import substitution1
3 A Recent Trend
Recently there has been a growing awareness among the countries of
Southeast Asia--particularly the Inward Looking group--of t - importance of
the market mechanism in efficient resource allocation 2 Increasing reliance
is being placed on the following
1) Exchange rates not too far from equilibrium
2) Moderation of tariff rates and equivalent bars to imports
3) Selective encouragement of import competing industries and
4) Encouragement of exports
IHly Myint The Inward and Outward Looking Countrics of Southeast Asia and the Economic Future of the Region Research Paper 7 February 1966 K C Sen The Inward and Outward-Looking in Southeast Asia working paper January 1965
2The Plan places greater reliance on the mrket mechanism and fiscal and monetary policies instead of on direct consumption and discourage production so that over the longer run economic development is adversely affected Where it is necessary to retain controls their rationalization and simplification will be necessary Controls which restrict imports must be continued but the form of controls may be modified and heavier reliance placed on market forces The Second Five Year Plan of Pakistan 1960-1965 Planning Commission Government of Pakistan It must be remembered that excessive (exchange) rates could provoke undervaluation of imports dumping and smuggling defeating the very purpose of developshyment and growth Socio-Economic Development Program for FY 1966-67 to FY 1969-70 of the Philippines Manila Philippines May 1966 Indeed in the long run import substitution and export promotion will become harmshyonizing policies since new industries which spring up in response to local demand can later expand if they are efficient (our underlining) into export markets First Malaysia Plan 1966-1970 p 16 Similarly the Third Plan of Pakistan calls for a revision of the present tariff policy (which is highly protective and discriminatory) reexamination of the current interest rate structure and use of shadow prices for Lhe appraisal of at least the major projects in the Plan p 135
154
Several reasons may be given for this evolution in thinking overshy
valued currencies have discouraged exports while subsidizing imports
leading to adverse balance of payments restrictive import policies-shy
through tariff and non-tariff protection--have encouraged indiscriminate
import substitution preoccupation with foreign exchange saving as against1
foreign exchange earning has resulted in the neglect of exports excess
capacity in export industries has been a comnmon phenomenon
the attempt to save foreign exchange at any cost has led to a wasteful
use of domestic resources in the import-competing industries the total
real resource cost of every unit of foreign exchange saved is extremely
high the protectionist environment in which import substitution policy
is followed has contributed to inflation
This list of reasons for change implies disillusionment with past
policy but not a clear reversal The policy objectives in the LDCs remain
the same but there seems to have been a perceptible shift toward policy
instruments that depend less on bureaucratic discretion and more on the
market
It is being realized that import policy invariably affects the export
sector that the net effect on balance of payments is the result of import
savings and export earnings not just the former The importance of the
opportunity cost of resources is now being emphasized more than before
These changes of emphasis improve the prospects for regional cooperation
B- Planning in Five Countries A Summary
The following material summarizes briefly trends in planning as
indicated mainly in the published plans--which means there is a publicity
and political aspect--of five countries in Southeast Asia2
IThe Indian Third Five Year Plan document somewhat ruefully observed in 1961 that one of the main drawbacks in the past has been that the proshygram for exports has not been regarded as an integral part of the countrys development effort under the Five Year Plans Quoted in Mason opcit p 31
2Among the compact evaluations of planning in this area attention should be drawn to Clair Wilcoxs perceptive The Planning and Execution of Economic Development in Southeast Asia referred to above and also to the series of empirical reports in late 1968 and early 1969 by Hermann Hatzfeldt and mimeographed by the Ford Foundation regional office Thai Farmers Bank Building Bangkok See also our own Research Paper 5 Economic Planning--poiits of Success and Failure
155
1 Indonesia
Indonesia was not able during the early 1950s and emphatically during
the Sukarno regime to formulate and implement an effective development
plan In 1951 the government adopted an Economic Urgency Program the
objectives of which were to raise production of consumer goods to increase
the processing of domestic raw materials and to mechanize small firms
Some new factories were built but few continued to operate and few of the
small plants received or used new equipment A second plan was formulated
in 1956 It emphasized long-run economic goals calling for substantial
capital formation and projecting sources of financing However the plan
foundered on economic and political disorder Funds for development were
diverted to current expenditures Against this background the Eight Year
Development Plan covering the years 1961-1968 was drawn up
The new plan was a product of the National Planning Council an ad
hoc committee of representatives of regional and functional groups No
professional economists sat on the committee there was little of supporting
statistics or economic justification for the recommended projects in the
Plan It was intended to achieve several sometimes conflicting goals
There seems to have been little effort to weigh the costs and benefits of
such objectives as self-sufficiency in food and clothing which conflict
with the objective of efficient allocation of resources
The Plan was divided into A and B projects The former were to
contribute directly to national development the latter to provide domshy
estic revenues and foreign exchange to finance the A projects Some
recognition was given to the need to balance outlays and resources Howshy
ever the plan was confined to the public sector alone an economy-wide
balance was not attempted The needs for imports were understated proshy
jected exports were overstated the effects of inflation were ignored
Many of the A projects clearly represent undertakings that would be deshy
sirable for economic development Yet the failure adequately to analyze
their costs in terms of construction maintenance inventory replenishment
and resource allocation casts doubt on the micro-economic aspects of the
plan
156
No attempt was made to program outlays in such a way that output and
expenditure would increase together in order to reduce the rate of inflation
In 1967 and later under the new Suharto government Indonesia again
leaned to the West sought to check the rate of inflation and enlist the
energies of private enterprises in the service of economic growth The
new planning groun has drawn on able local economists a number of whom
were trained at Berkeley and Wisconsin and several groups of foreign
specialists In agriculture hopeful plans are being made to introduce highshy
yielding varieties of plants -- especially rice strains developed in the
Philippines that preliminary trials indicated can be adapted to
Indonesia The new varieties are very responsive to fertilizer inputs
and require an appropriate mix of other inputs and conditions including
adequate incentives to farmers It is likely that by 1973 the agriculshy1
tural picture in Indonesia will be widely improved over recent years
Planning in Indonesia is hobbled by shortage of reliable statistical
data and by excessive centralization rather than reliance on needed comshy
petent planning groups of high status within the Ministries and in the
regions of the far-flung and diverse cou- Land reform issues in
Java are important for the longer run so are those of cooperation between
the regions and the central government and between the technicians and the
military The possibilities of steadily improving the effectiveness of
the public administration are crucial2 Given these major constraints
the present plan seems to be a very good one
2 - Thailand
Most efforts of the Thai planning authorities have been concentrated
on the analysis of specific projects The development plan is still a
ISee Leon A Mears Guidelines to an Agricultural Strategy for Indonesia Discussion paper 68-27 Institute of Economic Development and Research School of Economics University of the Philippines August 1968 Also Everett D Hawkins and John A Richards Too Little and Too Much Rice Center for Development Working Paper University of Wisconsin August 1968
2Cf Hatzfeldt a cit esp pp 66-80
157
combination of sectoral programs and projects rather than an over-all plan that would balance the outputs of one sector with the requirements of another It also suffers like other plans of these countries from inadequate integration and from lack of tying together planning and governshy
ment financing
Thailand formulated its first National Economic Development Plan for the years 1961-66 a second for 1967-71 There was no attempt to achieve balance in development outlays and resources for the whole economy but an estimated balance of expenditures and revenues in the public sector was presented for each of the plan years In the first phase of the plan deveshylopment funds often had to be held in reserve due to a shoctage of approved projects More recently the staff of the Economic Planning Office of the National Economic Development Board has been increased
In both the 1961-66 and 1967-71 plans the government concentrates on provision of the basic infra-structure and maintenance of a favorable inshyvestment climate Emphasis is placed on rural development and on manpower training Regional planning and an attempt at achieving balance in econoshymic growth on a regional basis are undertaken The development nf manushyfacturing industry is left to private investment
The second plan provides for a Private Sector Planning Committee composed of representatives of private manufacturing trade and services which will identify investment areas of national significance to be conshytained in the Plan and recommend appropriate government policies Governshyment policy will shift emphasis from investment in state enterprises to provision of analysis and research services establishment of industrial standards and aid to small industry In this way the planning process will be broadened to include the private sector
Since its beginning in 1960 Thai central planning has become more comprehensive and more relevant to national possibilities It is technicshyally competent The deficiencies lie in the political sphere the planning
lacks authority its recommendations are in the main not carried out The need is for serious commitment to growth by the national political leaders
158
- Singapore
Singapore is a city-state so heavily dependent on foreign trade (and ou flexibility and efficiency in that trade) that any tight aggregashytive targets of GNP and export growth are unrealistic The government aims at infrastructure to increase efficiency and ability to adapt to changing circumstances and at social outlays to increase welfare and maintain polishytical stability There has been formal Planning with a planning group attached to the Prime Ministers office But the effort was not important and has been abolished Nevertheless Singapore has not like Hong Kong its parallel in many respects taken pride in non-planning and in nonshycollection of statistics
The Economic Development Board is the chief government agency focusshysing on the problems of economic growth It gives loans to encourage prishyvate industrial projects and participates directly in such projects The large Jurong Industrial Estate developed by the Board on built-up land west of the city contains many private firms in pioneer status encourshyaged by tax and other concessions The Estate is an impressive success all of its scores of industrial plots have been committed and more land is to be cleared for future expansion
The already considerable unemployment ia Singapore -- about 9 -- will be increased through withdrawal of British military forces by the end of 1971 The government is very concerned about the problem its strategy is major encouragement of foreign investment with some emphasis on the tourist industry which is labor intensive In general the tone of governshyment policy is eclectic and energetic there is reliance on encouraging private enterprise and on social welfare measures -- education municipal housing and other The government is committed to improving economic
research and statistics
Singapores eclectic approach leads to risk of inconsistency between the implications of the total of individual projects and over-all purposes and to risk of lack of vision on long run trends
159
4 - Philippines
There have been a succession of planning agencies and development plans
in the Philippines since the end of World War II But the plans have not been
put into effect
Responsibility for planning lies with the National Economic Council
The current plan the Socio-Economic Development Program for fiscal years
1966-67 to 1969-70 covers detailed government programs in agriculture and
in the development of infra-structure There is also detailed planning for
industrial development although principal reliance is placed on free entershy
prise The plan takes into account the effects of expansion in one industshy
ry on another Attempts are made to balance government developmental exshy
and to establish foreign exchange requirements forpenditures with revenues
sectoral programs and individual projects Timing of construction rated
capacity and financing of individual projects are specified
The industrial development program is designed to achieve the estabshy
lishment and expansion of basic industries such as iron steel and alumishy
nium chemicals wood pulp and paper food processing and wood product
industries Promotion of industrial research development of small-scale
industries and increased capacity utilization are also to be pursued The
goals are to be achieved through use of the governments direct allocative
powers and through public policies to channel private investment This
plan is said to enjoy more official support than have the previous deveshy
lopment plans But responsibility for implementing the plan still rests
with the individual ministries If there is not firm executive support
for the plan it -- like its predecessors -- is little more than a wishing
book
5 - Malaysia
Malaysian development planning is unlike that of the other nations
of Southeast Asia determined in large degree by the choices of people
throughout the cities and countryside The plans built on this solid
foundation have been carried out with considerable success Clair Wilcox
in hs summary of planning experience in Southeast Asia concludes Only
in Malaysia has (plan execution) been thorough and sustained
op cit p 33
160
Malaysian planning dates back to the two Malayan plans for 1956shy
1960 and 1961-1965 The latter describes general goals of development
growth targets and general programs bic gives little information on
specific projects Outlays for development are balances against the
resources available Industrial development is left to private entershy
prise with provision for public encouragement Public expenditures ace
made among broad programs with principal emphasis on agriculture
The Plan for 1966-70 continues the policies of the earlier Malayan plans extending these policies to Sabah and Sarawak Provision is made
in the new plan for substantial developmental expenditures in the latter
areas for government buildings survey and transport and communications
The government continues to leave the operational aspects of industrializashy
tion to private enterprise seeking to encourage both domestic and foreign
private investment This is to be done through manpower training policies
general stabilization of the economy development of infra-structure and
the provision of incentives
The Economic Planning Unit itself recommends capital expenditures so that the Plan and the budget are more closely related than in many countshy
ries The central planning agency has more influence on the capital budget
than does the Ministry of Finance Implementation is through the Ministry
of Rural Development headed by the vigorous Deputy Prime Minister to
whom full authority for development planning has been delegated Someshy
times the Rural Development Department has gotten ahead of the Plan and
inadequate pre-investment studies have led to difficulty in securing
foreign funds Few programming units (but more than in most LDCs)are
found in the operating departments Waterston praises the quality of
operations flow and the operations room approach for evaluation and reshy
porting (but attributes success mainly to executive pressure) Resources
available rather than requirements are emphasized as the starting point-shy
which may have resulted in a failure to stretch resources to the utmost
Resources for the planners include protective tariffs tax incentives
medium and long-term industrial credits loans to small industries indusshy
trial site development establishment of industrial standards and the undershy
taking of industrial research and apprenticeship and training programs
1Albert Waterston Development Planning--Lessons of Experience Johns Hopkins Press 1965 Malaysias experience is referred to at many places in this excellent volume
161
Development projects are proposed in the villages and municipalities
aggregated into district proposals screened at the state and federal level
and forwarded to the Economic Planning Unit which is responsible for formushy
lating the national plan Detailed reporting on the progress of approved
projects is required and frequent inspection trips are made to insure that
the plan is carried out Thus local participation and a combat-like operashy
tions procedure are combined
C - Multiple Objectives
1- Difficulties as seen by the planners
At the Bangkok conference of Asian Economic Planners in 1963 the
delegates were frank in citing difficulties they faced and the deficiencies
in their governments efforts to meet growth problems The external diffishy
culties they specified were unfavorable changes in terms of trade and in
the availability of external assistance As to domestic faults in economic
planning they cited (1) inadequate statistical data (2) poor coordination
among government planning and implementing agencies (3) lack of coordination
between government agencies and the community (4) unrealistic planning goals
and (5) failure to set priorities among sectors and projects
With respect to execution of programs they listed (6) scarcity of
adequately trained and motivated administrators and technical people (7) inshy
effective mobilization of domestic savings and (8) failure to stimnlat
private business and the conimunity to make their best contributioll to planned
development
These are then the conscious points of failure in economic platinin
in the minds of these knowledgeable planners The natural moral is Odat the
concerned administrator and technician should study how to correct tile Faults
and then do the correcting
An air of unreality hangs over such an analysis It assumes
that governments have maximum or at least rapid economic growth as
their central goal Neither the one nor the other is necessarily true
Economic growth is one only among a number of goals of government It
sometimes is not a serious goal at all Second any large organizashy
tion like a government or government department is subject to
162
administrative and ideological constraints on behavior that force it systemshyatically askew from efficiently achieving Its goals This theory of orror of large organizations holds for laissez-faire and communist governments and large private businesses alike and for their large departments and divisions also The existence of such systematic error is far from implying that government economic activities are not useful and necessary or that small private businesses are not subject to their own patterns of error
As soon as we accept the facts that governments have multiple goals and that bureaucracies function in their own characteristic patterns the evaluation of success versus failure in economic planning becomes a complex
problem
2 - The purposes of planning
We list and comment on briefly below first the economic goals and second the political and social goals of economic planning The latter turn out to be normally of major often of overwhelming importance The question then arises third of the extent to which the two goals are normally
coincident or in conflict
(a) Economic goals include the following
(I) Maximum rapidity of growth to be achieved within some given time horizon
(2) Minimum pressure on the standard of living
(3) Minimum unemployment and under-employment
(4) Minimum instability in economic life (5) Maximum shift of the rate of population change toward
an estimated ideal level in order to maximize income per capita
These economic goals are in competition with one another There is an administrative opportunity cost to each in that limited administrative resources devoted to one mean less available for the others They are also in more fundamental conflict Maximizing the standard of living is in conflict with maximizing the rate of economic growth higher consumption means less inshyvestment which often means a lower rate of growth Maximizing employment forces a choice of techniques that both immediately and through feedback
163
effects will diminish the rate of growth To maximize income one must seize
technical market and organizational opportunities as they appear but this
means more instability Effective policies to check the growth of population
may not be consistent with the location and occupation trends that will maxishy
mize total economic growth
Economic success must therefore be measured by a weighted index of the
subgoals
(b) As to the political goals The usual central preoccupation of any
governing group is keeping itself in power swelling its power if possible
The threat of loss of power may be remote permitshyand checking any decline
or it may be pressing leadingting considerable short-run freedom of action
tc urgent or desperate measures for survival
Means to the goal of maximizing political power involve strategically
(1) control of the military and police authority over taxation and the money
supply and control of general government and party administration (2) making
effective use of nationalist sentiments and (3) the weakening and dividing
winning over or possibly repressing and silencing of political opposition We
comment on each of these in turn
(1) Not much need be said about the first The functions of the milishy
tary are external defense and domestic order that is to achieve a credible
external posture and to put down the threat and fact of domestic disorder and
The threat of the military itself is parallel it may turninsurrections
against its own sponsors Complete control of taxation and the creation of
money is normally achieved with independence
(2) The implications of nationalism are more interesting Nationalism
is a major asset for nearly all governing groups and above all for those newly
The desire of governing groups to use thisindependent through force of arms
power for their own political advantage tempts them to oppose the foreigner in
They are impelled also to cater toconspicuous ways that are not too risky
They are likely specificallylocal religions customs and patterns of value
to support local economic orthodoxy whatever it is--private enterprise socialshy
ist communist cooperative or state-directed isolationist
(3)As to the political opposition governments that are insecure are
tempted--above all where the example of history is that of autocracy--to reshy
press expressions of dissent and independent criticism The governing group
may move abruptly or patiently and subtly toward the one-party state Illshy
fortune may more and more clearly await those who are discontented and show
164
it For those who accept the going orthodoxies and support the regime there will be the chance of political success and influence social success and
perhaps economic good fortune as well
Such a pragmatic listing has an unsympathetic air But it is meant to be only descriptive The desire for power and status is one of the deepshyest human drives found in all societies in all periods of history And party leaders may feel a non-selfish responsibility to their followers whose status incomes and perhaps personal safety depend on the continued strength of the regime Finally no economic or other program in fact focussed toward the welfare of the people of the state has much chance of success unless it is carried out over a considerable period of time--which means government
stability
In Indonesia in the early years after independence in the Philippines in recent years and in many another country effective economic planning has been vitiated by maneuvering for power among political leaders and frequent shifts of faces and policies Such government instability makes economic planning a frivolous exercise Whether one calls the pattern a failure of planning or a failure of direction is a matter of words
D - Spill-overs Plan Harmonization and Bilateral Agreements
1- The Spill-over Effect
The achievement of any kind of regional cooperation agreement or customs or payments union has deeper implications for the national economic policies monetary and fiscal of the member countries There is what Schmitt has called the spill-over effect of integration I whereby as in the case of the European Economic Community each step toward integration creates new needs and fresh demands to proceed in the same direction Thus with the OEEC as a beginning the Customs Union created pressures to integrate capital markets which in turn may eventually require currency unification for effectshyive functioning Currency unification in turn may imply pooling of sovershyeignties with a concomitant destruction of the separate identies of the partshy
icipating countries
IHans 0 Schmitt The Integration of Capital Markets in EuropeA Step Towards Political Unification World Politics 1968 Oesearch paper 6 in this Project)
165
There is no inevitability about this succession Rather the spillshy
over process implies the ultimate inconsistency of a customs union and the
political sovereignty of member countries In view of the resurgence of
nationalism both political and economic the less formal such cooperative
efforts are initially the more successful they are likely to be--which is
an implication for policy
The ECAFE proposal of the regional harmonization of national deveshy
lopment plans deserves specific discussion
2- The Regional Harmonization Proposal
The plan harmonization approach to integration is regarded by its 1
authors as an alternative to the classical prescription of free trade
It is defined as partial or comprehensive extension of national economic
planning to a regional or sub-regional plan for the allocation of productive
resources Sooner or later it should lead to the formulation of an investshy
ment and production program and policy from the point of view of the region
as a whole Trade liberalization is a permissive circumstance of plan
harmonization so that commodity movements will be a dictated rather than 2
a dictating factor in plan harmonization The plan harmonization approach
would replace national import substitution policies by regional or sub-regional
1Approaches to Regional Harmonization of National Development Plans in ECAFE Economic Bulletin for Asia and the Far East (December 1964) pp 33-81 Hiroshi Kitamura and Ajit N Bhagat Aspects of Regional Harmonizashytion of National Development Plans in T Morgan and N Spoelstra eds Economic Interdependence in Southeast Asia University of Wisconsin Press 1969 pp 39-58
2Two reasons are given one economic and the other institutional first it is said that liberalization by itself would increase trade only on the assumption of some elasticity of supply of internal resources in particular uses -- a condition that is often only dubiously satisfied in LDCs and second since almost all countries in Asia have resorted to some sort of planned approach to economic development a negotiated father than a spontaneous coordination of policies will be me meaningful Approaches op cit pp 37-39
166
import substitution policies that should have more specialization and larger1
scale and so greater chances of success Locational factors though imporshy
tant2 are subsidiary to the main elements in the harmonization approach the
widening of the size of the market and the avoidance of duplication of proshy
ductive activity 3 It is suggested also that in its earlier phases the
approach should emphasize the sectoral or the commodity approach on a
sub-regional basis 4 When once resource allocation over agreedareas of
specialization has been made and trade liberalization has taken place the
evils of nationally-based import substitution policies would be prevented
The focus of the plan harmonization approach therefore is the estabshy
lishment of a single region-wide investment and industrialization program
requiring deliberate changes in the production structure of individual
countries Such changes would be pursued along lines of specialization
jointly agreed on through negotiation The Approach is an ingenious and
highly institutionalized attempt to overcome foreign exchange shortages
to alter the existing pattern of the regions foreign trade and to accelshy
erate industrialization of the region as quickly as possible
IThe Approach warns against the possible dangers of non-operation of market forces of competition It suggests that appropriate safeguards will have to be devised to prevent the emergence of state monopolies and stateshyowned cartels and the loss of economic efficiency Furthermore suitable accounting and pricing procedures criteria for choice of techniques incenshy
tives to improve production techniques are relevant factors that will need to be examined Approaches2 p 43
2The location of the industries will be based on considerations
relating to the availability of material power techniques servicing facilities etc as to an equitable distribution of the industries among participating countries Economic Survey of Asia and the Far East 1963 pp 115-116
3It should not be difficult to devise joining industrial ventures at any (our underlining) location on the basis of some market-sharing agreeshyments Approaches op cit p 38
4The ECAFE Secretariat has in fact made some feasibilityor preshyinvestment studies in the fields of iron and steel fertilizers aluminum pulp and paper rubber jute and allied fibers and rice Approaches ibid pp 44-81
167
The Approach rejects free or freer trade among participating coutitries
as a means of ensuring efficient allocation of existing and future producshy
tive resources It is argued that enlargement of the market by a mere liftshy
ing of trade barriers is insufficien to expand intra-regional trade because
of the lack of complementarity of economic structure among the countries of
the region and because of the import substitution policies currently being
followed by those countries The countries require therefore radical
changes of resource allocation in a desirable direction which is assumed to
be one that would lead to an increase of new (rather than traditional) lines
of economic activity and to significant economies-of-scale It is contended
that the mere enlargement of the market need not lead toward new lines of
activity
Underlying the Approach seems to be an assumption that political hurshy
dles can be overcome by the lure of the considerable economic gain that the
venture will bring to individual countries--a gain achieved by cost reducshy
tions flowing from the growth of large-scale industries Furthermore it is
argued that in reaping the benefits of the economies-of-scale the location
of key industries does not really matter as long as the market is large
enough to absorb the increased production--only a larger market makes it posshy
sible to exploit the best technology
Several questions come to mind (1) It has been reasoned in a preceding
section of this paper that regional integration is accompanied by some trade
diversion from low cost to higher cost sources of imports It has also been
reasoned that such short-run losses would be offset by long-run gains arising
from dynamic elements such as internal and external economies and structural
changes This in fact is the implication of the Approach But it remains
uncertain that the Approach will bring about the necessary structural changes
(2) A number of pertinent problems such as the structure of industry
(competitive versus monopolistic forms) in member countries and their pricing
policies are hardly touched upon The relative absence of competitive
forces--in for example government controled operations and private cartels-shy
within the integrated industries may considerably reduce the economic gain
otherwise made possible A competitive environment is in part inconsistent
with the Harmonization Approach Nevertheless competition is imperative for
168
economic efficiency as even the champions of import substitution policies
eg Prebisch and Linder agree
(3) Besides the inter-country coordination of development plans there
is another problem of no less importance That is the unavoidable need for
bringing about changes in the monetary and fiscal policies of the member
countries consistent with regional policies in investment and trade
(4) For such a far-reaching proposal one would expect meaningful emshy
pirical work substantiating the economic arguments and spelling out a basic
set of formulas for the agreed specialization This work is conspicuous by
its absence The proposal does contain exploratory studies of seven indusshy
tries iron and steel fertilizer aluminum pulp and paper rubber jute
and allied fibers and rice Evidence of economies-of-scale comes from data
on other countries such as the US and France But due to difference in
the economic technical and social conditions of these countries as compared
with less developed Asian countries the comparisons may not always be jusshy
tified It is not surprising therefore to come across repeated references
to the unavailability of necessary data and to the need for further empirshy
ical research A positive proposal such as this needs more solid ground
to stand upon Once such an institutionalized arrangement is launched on
scale steering it in another direction would be difficult
(5) The harmonization of development plans is said to be feasible beshy
cause most countries rely on planning in solving problems of economic deshy
velopment This reasoning however seems oversimplified Planning means
something different from country to country In Malaya and Taiwan for exshy
ample economic planning is generally adopted to maintain the framework in
which economic activities are pursued by individuals and firms with a minishy
mum of government intervention In India Burma and Ceylon more of direct
control of economic activity is carried out by the government The fornmer
countries in view of the comparative success to date of their private enshy
terprise orientation may be extremely skeptical of an approach demanding
detailed and joint planning Also for Malaya Taiwan and Thailand the
foreign exchange gap has not been a critical problem the Approach directly
oriented toward region-wide saving of foreign exchange will not be espeshy
cially attractive to them
169
(6) Finally an obvious problem with the harmonization approach is
that it is likely to give rise to sensitive bargaining by member countries
for allocation to them of desirable industries--those with prestige and
those conferring military advantage Since trade liberalization follows
rather than precedes resource allocation the criteria of resource allocation are in constant danger of being distorted by national pressure
groups and national lobbying This risk exists in spite of pre-investment
and feasibility studies that will be made prior to settling upon the agreed
areas of specialization
One possible way out of the predicament is that institutional pressure
might be put on the prospective beneficiaries of a scheme through agencies
like the Asian Development Bank and the ECAFE Secretariat that are directly
involved in extending technical and financial help to promote two or three
nations or regional joint concerns International donor agencies involved
might make their help conditional on the recipient countries adherence
to the various criteria suggested in feasibility studies A certain degree
of institutional pressure within the framework of an obviously sound econoshy
mic rational should be suspected neither of partisanship nor of arbitrariness
3- Bilateral agreements
Quite a few countries in Asia have entered into bilateral agreements
with other Asian and non-Asian countries 1
1 For instance India has entered into bilateral trade agreements with Burma Ceylon Indonesia Nepal and Afshanistan See Sunanda Son Indias Bilateral Payments a nd Trade Agreeme nts (Calcutta Bookland Private Limited1965) Ceylon has similarly extensively used this technique for expandshying her trade During the 15 years period--between 1950 and l9i4--Ceylon entered into trade agreements with 24 countries including China India Burma Ceylon Egypt Australia Austria Japan See Karunatilkae fINSThe Impact of Import and Exchange Controls and Bilateral Trade AreenentS on Trade and Production in Ceylon in T Morgan and N Spoelstra eds Economic Interdependence in Southeast Asia University of Wisconsin Press 1969 pp 285-304
170
Bilateral trade and payments agreements are not in general a desirable
They are not a substitute for multilateral trade1
form of trade expansion
Though flexible between the contracting parties bilateral agreements reshy
strict the scope of trade especially when non-transferable bilateral credits
are granted This limitation however is not an unmixed evil in so Ear as
bilateral trade and payments agreements help toward utilizing surplus capashy
city in specific industries as well toward avoiding unnecessary duplication
of production By bringing into emphasis the possibilities of resource
and demand complementarity among contracting parties such agreements can
serve as guides for future action The detailed pricing and credit clauses
the integral parts of such agreements need not be far removed 2 wcrked out as
from prevailing conditions in the world market Trade preferences of which
bilateral trade and payments agreements are special case are potentially
as important among the LDCs as they are between them and the MDCs--but
in both cases the hope is that they are steps toward general freer trade
E - Some Conclusions 3
Despite their heterogenity the countries of Southeast Asia do share
a common aspiration they all want to build for themselves
IOften bilateral agreements are a symptom Df the inability of the contracting parties to sell in the open market
21n the case of the Regional Cooperation for Economic Development among Pakistan Turkey and Iran (July 1964) three commodities viz aluminum (to be supplied by Iran) banknote paper (to be supplied by Pakistan) and carbon black (to be supplied by Turkey) will be supplied at world market prices This would ensure markets without putting the buyers to any price disadvantage Kitamura and Bhagat 2p cit pp 26-27
3It is clear then that Southeast Asia does not constitute an economic region in the sense that all the countries in the region are more like each other than any of them is like countries in other regions in terms of the usual indicators of economic performance Benjamin Higgins Dominant Problems in Southeast Asia Planning A Western View The Philippine Economic Journal (Second Semester 1965) p 430
--
171
self-sufficient and politically viable nation states Realization of this fact is important in any move toward economic interdependence Economic
and political nationalism can be a friend of and stimulus to regional econoshy
mic cooperation
The accepted role of the State in planning economic development is therefore an asset of much potential value Realities of the situation
demand that regional cooperative endeavors promote national felt interests
Often this promoting will prove a subtle exercise in compromise along the pattern of the superb efforts of JeanMonnet in the earlier days of the
integrated-Europe movement
Pressure from international institutions is likely to be far more
effective than pressure exerted by individual countries from outside the
experience of political colonialism in the past has made countries wary
of economic neo-colonialism The external and regional framework necesshysary for objective and impersonal pressure does exist in the area already
ECAFE the Asian Development Bank and perhaps other regional organizations
that can render service And from the outside the International Bank group
and other United Nations organizations can be helpful
In no one of the national development plans of the countries of Southshy
east Asia however is there a mention -- direct or indirect -- of the
possibility of improving development efforts through the formation of reshy
gional groupings Nevertheless as evidenced from various inter-government
conferences held under the auspices of the ECAFE Secretariat there seems
to be an increasing awareness of the possible advantages of multi-national
efforts toward economic growth in the hope of avoiding the pitfalls of
autarchic policies
A proposal forcibly made by Benjamin Higgins is that there should be
set up associations of recipient nations to evaluate jointly the promise
of national and regional proposals and once proposals are underway to follow and check on their progress and efficiency There are political
advantages in having technicians from neighboring countries on committees
to evaluate costs and benefits-- in addition to technicians of donor countshy
ries and of regional organizations like ECAFE and the Asian Development Bank
172
V - Regional Cooperation in Southeast Asia --
Forms Policy
A - Taxonomy
I - Degree of formality and government commitment
Measures for regional cooperation can be classified by degree of
formality and government commitment Cooperative activity can go on
under either private or government auspices (a) The most informal are
occasional meetings of private societies in various countries and exshy
change of information advice and published documents Examples are
meetings of and exchange between technical and professional societies
literary groups cooperatives and political groups
(b) Occasional ad hoc meetings of government officials and groups
are a bit more formal These meet special problems as they arise
(c) There may be understandings or agreements to consult or regushy
lar meetings on matters of joint interest The Association of Southeast
Asia (ASA) composed of Malaya Thailand and the Philippines during its
active period 1961-1963 both held ad hoc consultations and maintained
continuing joint committees and working parties
(d) There may be commitments to take cooperative action on matters
of a public service type where provisions by one state of a service
useful also to others causes no decreased supply of the service domesticshy
ally Among these are research activities technical exchanges exchange
and television programs films artistic exhibit exchanges exchange
visits of specialists and of groups ASA carried on such exchanges The
173
UNs Economic Commission for Asia and the Far East (ECAFE) carries on
research in regional economic problems The Southeast Asia Treaty Organishy
zation (SEATO) has carried on research in tropical medicine ASA also
initiated some studies of the possibilities of such research The Associshy
ation of Southeast Asian Nations (ASEAN) set up by 5 nations in 1967
proposes many forms of regional cooperation Technical advice has been
supplied and programs of technical education undertaken by ECAFE SEATO
and also by the Colombo Plan (CP) and the Asian Productivity Organization
(APO) ASA again has done some planning in the areas The Asian and
Pacific Council (ASPAC) a regional group of nine countries set up in 1966
also proposes to carry on cooperative activities
(e) There may be significant commitment of resources in the joint
interest (I) of contiguous countries in individual fields like road or
river valley development The Committee for Coordination of Investigations
of the Lower Mekong Basin on which four bordering states are represented
(Thailand Laos Cambodia and South Vietnam) envisages this kind of joint
commitment (2) Resources may be contributed for regional purposes Coshy
operative deep-sea fishing and fish canning and the setting up of regional
air and shipping lines have been discussed by several organizations inshy
cluding ASA and ECAFE Several years ago ECAFE recommended setting up a
regional development bank now solidly in operation as the Asian Development
Bank at Manila There can be regional joint effort to conduct research and
explore the market for products like rubber coconuts and fiber and to
increase tourism ASA carried on some investigations in this area There
may be agreements to market cooperatively including cartel policies to
limit sales and raise prices In late 1968 seven Asian nations agreed to
form an Asian Coconut Community to improve production and marketing Standshy
ardization of products production research training of technicians and
market research were all included
In the meetings at Delhi of the UNs second Conference on Trade and
Development (UNCTAD) in early 1968 a common bargaining position was sought
by the trade union of countries from the different underdeveloped regions
on trade policies and commodity marketing agreements shipping rates and
the like The aim was to face the high income countries in a better barshy
gaining position
174
In the list above none of the forms of cooperation require abrogashytion of sovereignity that is there isno appreciable commitment to change domestic government policies
(f) But domestic policies may be altered by regional cooperation (1)There can be agreement to limit production of export crops in order to raise market prices as under the Stevenson Rubber Agreement of the 1920s Sanitary regulations may be agreed to be enforced in two or more countries (2) Trade can be encouraged between two or more countries of the region by joint simplifying and standardizing of customs regulations ECAFE has recommended such measures and ASA to some extent undertook to carry customs liberalization measures into effect (3) Trade can be encouraged within the region by lowering or eliminating tariffs and other trade barriers In 1963 ASA urged study of the possibility of setting up a regional free-trade area Several such proposals were made in 1968 (4) Would a free trade area in part or all of the region imply the need for agreement on the locashytion of given industries The argument for such a need is that duplicating investment should be avoided and so also excess capacity and high average costs because of small scale of production This line of reasoning in turn implies that major investments will be decided within countries in the main by government policy and that private decisions and competitive pressures should not or will not be effective in determining location growth and contraction ECAFE has been in the forefront in urging this kind of policy A 1963 ministerial meeting responded to an earlier economists report by accepting as an aim of policy the establishment of a customs union or free trade area within the region and agreed that national development plans should be harmonized in order to achieve rational location and size of new industries The 1966 Kojima and Miki plans proposed patterns for achieving regional free trade (5) There may be agreement for a regional payments union to cut the need for restrictions on intra-regional trade by deficit countries (6) The desire for stable trade and payments relationships exerts pressure toward coordinating monetary and tax policies so that prices will be stable or change at similar rates (7) There may be coordination of other economic policies and regulations There may even be mutually adjustshyed policies for political change
175
(g) Finally there may more or less be complete political union as
exemplified in the assimilation of West New Guines by Indonesia and in
the checkered history of Malaysia and Singapore
2 - Cooperation within the region only
Cooperation can exist only within the region ASA has fitted this
category So does the Lower Mekong Committee and so did Maphalindo
(Malaysia the Philippines Indonesia) Or cooperation can exist between
one or more countries of the region and countries outside The Asian
Development Bank set up in Manila fits this category The
Asian Productivity Organization has its nine members in Southeast Asia
and outside from Pakistan to Japan ECAFE has 23 Asian members in
Southeast Asia and beyond SEATO has Thailand and the Philippines and
also Pakistan and non-Asian members CP has 15 Asian members Afghanistan
to South Korea plus countries outside
3 - Other categories
The range of regional cooperation measures listed above in accordance
with their formality and degree of official commitment is only one pattern
useful for setting up alternatives One may list disregarding overlapping
(a) Regional projects that require the agreement of two or more
regional countries versus those that dont such as regionally useful
enterprises set up by one government perhaps with support from the UN
or other international organizations the US or other governments or
by private foundations
(b) Regional physical investment projects (the Asian Highway the
Mekong River Project) versus educational and technical projects (the Los
Banos Rice Institute APO the UNs Economic Research Institute at Bangkok
technician exchange agreements any well-thought-of educational or reshy
search program that attracts students from other countries of the region
This division parallels the economic theory issue over emphasis on conshy
ventional physical investment versus emphasis on human and non-material
resources for growth1
(c) Purely economic inter-government agreements (trade and payments
treaties) versus other agreements -- political cultural educational
research
1See Research Paper 11
176
(d) Arrangements with invidfous conoInic andor military implications
(SEATO trade or investment agreements leading to national location of iron and steel metalworking electronic chemical and like industries)
versus those that dont have them (eg educational and research projects with entry open to students from other countries and research findings
freely available)
(e) Organizations that have functioned (ECAFE SEATO ASA CP APO
versus regional proposals advanced (and broken up) for domestic or foreign political effect with little or no fur tion Sukarnos NEFO-- Neuly
Emerging Forces-- is an example of the Latter Maphalindo (Malaysia Indonesia and the Philippines) was hardly more than a slogan and senLishyment and was ended with Sukarnos campaign of confrontasi against malaysia
including Singapore ASA the Association of Southeast Asia composed of Thailand Malaysia and the Philippines carried on for a time after its founding in 1961 a number of modest and useful cooperative activities It was broken up by a Philippine claim to Sabah in North Borneo a part of
East ialaysia Its successor ASEAN the Association of Southeast Aian
Nations (Thailand the Philippines Malaysia Sip apore and IndoneiJa) launched in 1968 seems to be weathering a crisis over the same Philippine
claim
B - The Political Hurdles The bars to mutually useful regional cooperation in Southeast- Aia
have been much as elsewhere in the world primarily political And in large part the causes of such cooperation as has onc on have also ctin
conspi cuots1y poliical
h1aphalindo a purely politi cal vehicle died gclting born ASAs
imaginative efforis were halted by political [allin out Itetween Ma lyasia and th e Philippincs SEATO survives mainly because of its poliiica1shymiilary implications ()her organization (ECAFE AP3 CU) survive and ar effe Liv in large part because oF Con tinul Ollits ide support---ich is partly political-economic in motivation and only partly disinterested
177
There are here and there among countries of the region persisting
suspicions and antagonisms that cause them to be acutely sensitive to the
political and military aspects of regionalism These sensitivities will
continue in varying degrees into future years New sensitivities may arise
And basic policies differ Burma and Indonesia (and India to the
west) have been inward looking relying on direct controls and checking
trade Indonesia after its 1965 crisis has become less inward Malaysia
Thailand the Philippines (and Taiwan) have been outward looking
choosing to rely more on private enterprise and relatively free trade
The political differences and sensitivities imply a moral Outside
encouragement to regional cooperation measures have the best chance of sucshy
cess when they achieve a net maximum from two goals contribution to the
obvious economic and other advantage of the region and intra-regional polishy
tical neutrality and colorlessness The avoidance of political suspicions
and antagonisms is an absolute requisite
In the list at the beginning of this section effective measures
listed under (a) (b) (c) and (d) informal and requiring little resources
and frequently politically colorless are a better bet for survival than
equally effective measures listed under (e) (f) and (g)
C - Guidelines for Policy
Unqualified conclusions cannot validly be drawn from facts analyses
and evaluations with as many aspects of uncertainty as those surveyed in
this study But we do need guidelines for policy--guidelines that are
neither unduly vtgue in view of what we know nor unduly positive in view
of what we dont
The United States concerned with encouraging for their own benefit
cooperation among the countries of Southeast Asia could do worse than conshy
sider seriously as a guide to policy the two key provisions of the highly
successful Marshall Plan of 23 years ago (1) International cooperation was
proposed for planning and carrying through programs to solve some one obshy
vious problem while the nations concerned could remain at odds on other
matters that were to be set aside for the time (2) The US would pledge
good will cooperation and a share of goods and capital to make the plan
work
178
The countries of Southeast Asia have a diversity of background and of
experience with economic development Any meaningful approach to cooperashy
tion must be based on and proceed from their backgrounds and experiences
Among the domestic political aims that have first priority nation buildshy
ing takes high place It may be a costly goal and dream but it is highly
cherished Nationalism is a central fact Hence any attempts at regional
cooperation must bo viewed as subordinate to the major theme of nation
building How can nations and their elites consciously gain as individual
units through regional cooperation
The more formal proposals would compel the countries of Southeast Asia
to redefine some of their national goals and modify some national policies
The viability of such proposals is therefore very doubtful
In contrast less formal attempts and partial measures may soften
the edge of nationalism And in time the experience of varied individual
forms of cooperation and we hope the discipline imposed on diverse ecoshy
nomic policies by success and failure causing convergence of those policies
can lead to a deepening sense of regional identity and hence willingness to
deepen and broaden regional cooperative ventures
179
VI - Summary and Implications (Implications for foreign assistance policy are starred)
1 - Southeast Asia like other LDC areas should have comparative adshy
vantage in manufactures with relatively low levels of productivity per
employee and with relatively low value added both from labor and capital
components These manufactures are in general textiles and clothing wood
products furniture leather products miscellaneous and other narrowly
defined groups Exceptions to this generalization arise significantly from
management and local skills differences Also climate soil mineral deposshy
its and other local resources can give advantage in special primary products
and other local resources can give advantage in special primary products and
to rubber wood and cork manufactures and iron and steel products
2 - The region as a whole has been doing badly in its exports to MDCs
While 1956-7 to 1964-5 total imports of MDCs rose by 76 the regions
exports to them rose only 28 Two-thirds of this lag is due to a negative
composition effect--that is the region has a high concentration in primary
product exports that have been expanding slowly in the world market One
third of the lag is due to a negative competitive effect--that is the
region was being outcompeted in the kinds of goods it did export
3 - The best performers with respect to export sales are Taiwan (+281
in this period) Thailand (+82) and the Philippines (+63) The poorest
performers were Indonesia (+3) Burma (-6) and Pakistan (-8) The main
explanation of this wide divergence in performance is the competitive effect
Good performers typically did well in a wide variety of commodities and vice
versa The commonly held view that countries with concentration in primary
exports perform poorly is not supported in our data Thailand and the Philshy
ippines have done very well despite high specialization in primary products
4 - One tentative induction or hypothesis to be drawn from these
data is that export success and failure which is closely correlated with
general economic growth trends is influenced in major degree by the extent
of over-valuation equilibrium or under-valuation of the exchange rate of
a country Furthermore it is implied that efforts to compensate for the
frequent over-valuation (by various forms of export subsidies and import
price adjustments) are inadequate because of administrative costs and adminshy
istrative weaknesses that are characteristic of LDCs and political presshy
sures and uncertainties that are characteristic of all countries
180 5 - The confirmation of this hypothesis would imply that regional coshy
operation to shift disequilibrium exchange rates toward agreed-on equilibshyrium levels could have highly beneficial effects toward speeding up economic
growth
6 -The share of intra-regional trade of these countries varies widelyfrom 79 for Laos to 57 for Singapore and 507 for Burma to 6 for Ceylonand 4 for the Philippines Most countries show a recent decline in this share (for Hong Kong because its external trade has been growing fast) Pakshyistan Korea and the Philippines have had rapid increases in their intrashyregional trade The countries performing poorly in intra-regional trade are those with negative competitive effects
7 - Protectionism in the region as it is in the world generally is relatively high on manufactures and specially high on more complex manushyfactures Hence less developed countries are specially handicapped in trying to expand sales abroad of manufactures which they judge to have feedback and dynamic advantages to them in training of skills improvement of organishyzation and capital formation These dynamic effects justify much attention (14 below) Though not amenable to quantitative estimation they are the mainly important potentialities from a regional preference or freer-trade
arrangement
8 -The effects of quantitative restrictions and of tariffs toward checking trade and distorting the structure of production is best measured not by the nominal in-the-books tariffs and equivalent levies but by theeffective protection the restrictions produce Effective protection reshyfers to the effect of the regulation or duty on (a) net value added by the producing firm or alternately on (b) its rate of profit
In general in this region quantitative restrictions appear to be moreimportant than tariffs There is a wide range in the amounts of restrictionshyism among the countries The Philippines was recently the least restrictive administratively but often imposes the highest tariff duties of all the
countries
9 - Protectionism is a much sharper bar to economic growth than it seems effective protection is erratic and is in general far larger than the rates in the tariff codes The chance therefore of gains in efficiency from lowered trade barriers is great this goal might well be approached on a regional basis
181
10 - Our analysis and sample calculation indicate that a typical Southshy
east Asian country would suffer little reduction in tariff receipts from
entering a regional free trade area Tariff reductions would probably occur
gradually over some years so that any revenue loss would be similarly spaced
out
11 - Major candidates for attention in Southeast Asia as promising prodshy
ucts for negotiating lower trade barriers are a long list of manufuctures
that have recently been showing very rapid growth rates (from 14 to 49 a
year) in lower income countries Among them are aluminum musical instruments
watches and clocks sanitary plumbing heating and lighting fixtures travel
goods handbags glassware toys games scientific etc measuring and conshy
trolling equipment and food preparations
12 - Among these are many products for which economies of scale are imshy
portant Hence efficient producers might well be able to compete and expand
successfully in a regional market though they could not survive save with
burdensome protection in one (small) country market Here is logical space
for regional agreement toward freeing trade
13 - It is sometimes argued that regiLnal LDC trade is a will-of-the
wisp because ey all produce the same ching This view is mistaken Sucshy
cessful economic growth is characterized by the opening up of small but
swelling niches of comparative advantage which can gradually build into a
large and complex network of Lxchange
14 - Among the potential dynamic gains from regional or wider-area
shifts toward freer trade the effects on resource supplies and productive
efficiency are crucial for example simplification and standardization enshy
couraged through producing for a larger market emergence of new industries
out of the specialization encouraged by large scale production and from more
contacts development of skills and entrepreneuring abilities in one industry
that are useful in others and better commvnications (a road or railroad deshy
veloped for one business can be used by others)
A regional scheme should be specially solicitous toward freeing trade
in kinds of production that have the most feedbacks Attempts to secure
these efficiencies by protectionism invite the blockage through rising costs
that has been weighing down import-substitution policies in recent years in
Latin America and elsewhere
182
15 - The trend of world trade since 1900 and also recently reinforces
the argument that LDCs should seek to up-grade their skills organization
and technology as urgently as they can Commodities with low skill-andshy
capital requirements have been making up a falling proportion and those with
high skill-and-capital requirements a rapidly rising proportion of world
trade as a whole The value of food and raw materials exports of LDCs has recently been riming at less than one-fifth the rate of growths of manufacshy
tures
The relatively rapid growth of LDC and Southeast Asian manufactures exshyports despite relatively high tariff protectionisms against them in the world
offers a useful opyortunity With less protectionisms through regional or
other agreements manufactures exports would grow still more rapidly
16 - One specific form of US encouragement to regional freer trade
measures might take the form of trade preferences extended by - US on conshydition of reciprocal lowering of Southeast Asian barriers within the region
The extension of such pieferences by the more developed countries especially
the US would meet the official and emphatic wish of the LDCs--which is
more firmly rooted in fact and analysis than the usual arguments have conveyshy ed The United States has already formally accepted the general concept It
might well be in the forefront of exploring the practical issues invclved as a step toward lower regional trade barriers and perhaps lower trade )arriers
generally
17 - Useful research contributions to regional cooperation can be made through continuous studies of comparative advantage within the region The
effort would be to discover what products promise the best stimulus to growth
through contributions both of current efficiency and of dynamic feed-back
effects that traditional exports often have failed to provide
In our own research we have made a modest venture in this direction
External assistance could support such studies
But even this policy is limited and hobbled by uncertainties of data Without correction of existing sometimes flagrant errors standardization
more appropriate definitions and further refinement in the regional economic
data now collected assessment of the consequences of any specific industry
expansions is very uncertain (See 19 and 20 below)
183 18 -A regional payments union though in general attractive as a means
of economizing foreign exchange offers only very modest gains in Southeast Asia The reason is that trade within the region is highly unbalanced there are heavy creditors and heavy debtors The unbalance exists both in the short-run (in quarterly data) and in the longer run (over a recent 8-year period) There is little reason to expect that the regional creditors (Thaishyland Indonesia Cambodia Burma) will be willing to extend long-term credits to the regional debtors (the Philippines and Malaysia-Singapore)
However the payments slumps that will result from the prospective endshying of the Vietnam War offers a useful opportunity for regional cooperation in forecasting the dislocation problems by countries kinds and amounts and for proposing offsets External assistance could support such studies and the formulation of proposals perhaps assisting other regional organizations like the Asian Development Bank in that work
19 - All quantitative judgments on the effects on trade in Southeast Asia of policy changes cooperative measures and normal growth rest on the foundation of existing statistics We have tested the accuracy of trade statistics of seven countries Burma Ceylon Indonesia Malaysia the Philshyippines Singapore and Thailand The basic method is to compare total imshyports reported by each of these countries for the years 1962-63 with exports from it reported by its trading partners The partners were 29 countries within the region and developed Western countries Similarly exports reportshyed by each of the seven were compared with imports reported by its trading
partners
The import-to-export ratios vary widely Many display flagrant disshycrepancy with the higher figure of a pair twice or more the value of the lower Of the ratios for total bilateral trade 62 per cent have a discrepshyancy wide enough (taken as below 9or above 13 where 11 is in the neighshyborhood of a normal expectation) to present a firm presumption of error The use of free or black market exchange rates does not alter these findings
We conclude that quantitative conclusions resting on available trade statistics even with the special cases of entreport economies (Hong Kong Singapore) and of Indonesia allowed for are resting on feet of clay For countries with high tariff or other barriers to trade or with legal or
184
other barriers to the flow of capital substantial errors are likely to conshytinue Since the statistics will emphatically not sustain much of quantitashytive conclusions we are compelled mainly to qualitative judgments
20 - Even more basic worries pertain to the national income statistics including specifically their savings and investment components (a) Their margin of error is probably large (but not checkable as with trade data) for one main reason because agriculture is a major sector of the LDC econoshymies and because the uncertainty inherent in estimates of farm production is greater than that for most other economic sectors (b)More important the concepts of the standard national income accounts have been shaped especially in the 1930s and 40s primarily for business cycles and classification-ofshyfinal-product purposes--and not for separating out the uses of resources that do and do not lead to economic growth
A major effort toward redefining national income aggregates especially consumption savings and investment so that they fit more adequately the purposes of economic development analysis carried out for US data by John Kendrick of the National Bureau gives an estimate of total investment
nearly four times the official estimates
This more useful approach from the conditions-of-growth point of view when applied to the national accounts of Southeast Asian LDCs implies that the effects of regional cooperation measures on for example savings and investment would shed only modest light on the probable changed rate of growth We do not attempt such estimates
It would be highly useful to re-estimate Southeast Asia national income accounts along the lines pioneered by Kendrick AID might well support such
efforts in the various countries of the region
21 -National economic plans inevitably have multiple goals of which economic growth is only one Two policy patterns exist in the region the Inward Looking countries (Burma Ceylon India Pakistan Indonesia until recentshyly) tend to plan strict resource allocation control trade and capital flows and often nationalize foreign enterprises The Outward Looking countries (the Philippines Malaysia Thailand Hong Kong and Taiwan) have these charshyacteristics in milder degree or not at all The latter group have had a better record in growth of GNP productivity increase import capacity growth price level stability and import substitution
185
22 - Plans in the region often suffer from lack of government firm inshy
tention to execute them and from shifts of government faces and poi1ies
The Malaysian effort alone has won praise for its evoking of felt wants in the villages and towns incorporation of plans in the government budget and
vigorous execution
23 - In none of the Southeast Asian national development plans is there
reference to the possibility of accelerating development through regional cooperation Outside agencies foundations and donor governments can often
be helpful through directing attention to regional group activities and polishy
cies that can further national aims
24 - The planned harmonization of national investments and economic policies into a regional pattern faces di ficult and sensitive negotiation
problems on the location of prestigious and militarily iiportant industries
The proposal suffers so far from lack of emphasis on competitive efficiency and from knowledge of the amount of economies of scale that can be relied on
(data used have come primarily from distant high income countries) Detailed
studies of local economies of scale could be useful and might be supported
from outside the countries
25 - The range of kinds of regional cooperation is very wide varying by degree of formality and of government commitment by the extent to which
they may involve countries outside the region by the extent to which real resources are involved and external economies to one nation are present by the extent to which non-economic matters are involved and specifically by the extent to which there are political and military implications
26 - The bars to continuing mutually-useful regional cooperation in Southeast Asia even more than elsewhere in the world are primarily politishycal The problem is shown most vividly in the Maphalindo ASA ASEAN sucshy
cession of attempts at co-operative activities Fairly basic policy differshy
ences are likely to continue and also to appear and disappear at intervals An election in the offing can persuade candidates for office to stir up
nationalistic sentiments joint danger can draw countries together
27 - Individual proposals for regional activities require individual
cost-benefit analyses--whichpwith all their difficulties and inherent unshycertainties of valuation are indispensable International agencies and
national donors can usefully support such cost-benefit analyses
186
Ad hoc and continuing groups of technicians of countries of the Region
might well be set up to evaluate the promise of national and regional proshy
posals including those that could be financed by individual donors and by
the ADB etc and to follow and check on the efficiency of projects once
they are started Such coiittees or associations might be supported by
AID Any cost-benefit studies of regional industrial possibilities need to
consider both current efficiency (comparative advantage) the dynamic feedshy
back effects on skills organization values and social changes and
capital formation
28 - One general presumption gives a useful rule-of-thumb for initisl
evaluation of proposals Projects that expand production andor productivity
have an obvious presumption in their favor Projects that seek higher money
returns through checking production andor productivity (for example comshy
modity agreements to limit output) are highly suspect They of course deny
the basic nature of economic progress which consists of increasing producshy
tion (- real income) They carry inevitable administrative burdens--and
administrative efficiency is a major LDC problem Their intent is apt to be
frustrated 5y the obvious the subtle and the manifold inroads of competishy
tion both from other producers of the same product and from substitutes
both in the short run and the long run
29 - Regional cooperation measures may well have their greatest beneshy
fits through an indirect influence Southeast Asia appears to distant peoples
to be a tolerably homogeneous area It is in fact widely heterogeneous in
the relevant aspects of history culture mineral resources soil fertility
population density exposure to the West and to modern technical methods
and local patriotisms and antagonisms
Such contrasts have historically proved to be opportunities the coshy
operative mixing of peoples of diverse backgrounds has repeatedly in various
parts of the world been a mutual stimulus to practical achievements The
potential gain is great
30 - Diversities within the region and the uncertainties of benefits
from existing proposals for formal integration both suggest that external
assistance should in the main be directed to informal partial politically
neutral measures of obvious joint benefit
187
Outside encouragement of major integration projects should be cautious
More emphasis needs to be placed on research and on mutual education through
discussion of going problems and possibilities Until potential participants
see clearly that there is a problem that the problem requires regional coshy
operation and that the net benefits will be significant pressure from outshy
side the region is unlikely to achieve a continuing effect
31 -A modest one-thing-at-a-time policy is desirable focusing on some
one obvious problem whose solution is in the unmistakable joint interest-shy
about which nations can cooperate while other matters they are at odds on can
be put aside for the time
32 -External support to regional cooperation measures has the best
chance of success when it achieves a joint maximum from two goals obvious
contribution to the economic and other advantage of the regions and intrashy
regional political neutrality and colorlessness The avoidance of political
suspicions and antagonisms is an absolute requisite
33 -Nationalism is a central fact Any attempts at regional cooperashy
tion in Southeast Asia must be viewed as subordinate to the major theme of
nation-building How can nations and their elites consciously gain as indishy
vidual units through regional cooperation
Formal cooperation plans that would compel nations of Southeast Asia
to modify their national goals or their national policies have a highly dushy
bious viability
Less formal and partial measures may soften the edge of nationalism
In time the experience of various forms of cooperation and the disciplines
imposed on diverse economic policies by success and failure (so causing conshy
vergence of those policies) can lead to a deepening sense of regional common
interest and hence willingness to deepen and broaden regional cooperative
ventures
188
Papers Written In The AID-University of Wisconsin Research Project on
Economic Interdependence in Southeast Asia
Abrahamsson Bernhard1 - Developing Nations and Ocean TransportationAn Analysis of Price and Cost of Ocean Transportation the Balance of Payments and the Case for National Merchant Marines with Special Reference to Southeast Asia September 1967
2 - Alwan Dorra Development Criteria in the IBBD Survey Mission Reports January 1966
3 - Baldwin Robert E The Case Against the Infant Industry ArgumentSeptember 1966 in Journal of Political Economy MayJune 1969
4 - Bell Peter F A Quantitative Study of Entrepreneurship and Socio-Economic Determinants of Development in Asia Research Paper 14 February 1967
5 - Bell Peter F Small Industry Socio-Economic Aspects of its Proshymotion in Asia Research Paper 16 March 1967
6 - Bhagat A N A Regional Payments Union for South and Southeast Asia (draft) July 1965
7 - Bilkey Angela A Brief Analysis of the Intra-regional Trade of the Central American Common Market Countries - Some Consideration Regarding their Total Trade (draft) July 1967
8 - Castro Amado A Philippine Export Development 1950-65 Nov 1966
9 - Chou K R Hong Kongs Changing Pattern of Trade and Economic Interdependence in Southeast Asia November 1966
10 - Devoretz Don J PL 480 and Southeast Asia September 1965
11 - Ellsworth P T Import Substitution in Pakistan--a Comment Research Paper 9 June 1966
12 - Ellsworth P T Import Substitution Growth and the Balance of Payshyments Some Comparisons June 1967
13 - Fag El Nour Nawal Comparative Advantage Versus Economic Development State of the Debate July 1967
14 - Hawkins Everett D Job Inflation in Indonesia Asian Survey May 1966 Research Paper 4
15 - Havkins Everett D Demographic Trends and Problems in Indonesia 1966published as Indonesias Population Problem Ch 5 in S ChandrasekharAsias Population Problems Allen amp Unwin London 1967
189
16-- Hawkins Everett D and John A Richards Too Little and Too Much Rice June 1968
17 - Higgins Benjamin Prospects for Southeast Asian Development May 1967
18 - Huang Kai-Loo A Nucleus for Developing a Common Market in Southshyeast Asia April 1966
19 - Huang Kai-Loo Factors Discouraging Savings in Asia May 1966
20 - Huang Kai-Loo Capital Flight in Southeast Asia July 1966
21 - Islam Nurul Tariff Protection Comparative Costs and Industriashylization in Pakistan
22 - Karunatilake H N S The Impact of Import and Exchanges Controls and Bilateral Trade Agreements on Trade and Production in Ceylon December 1966
23 - Kelley Allen C Demographic Change and Economic Growth Australia 1861-1911 Part I 1967
24 - Kelley Allen C Regional Integration Demographic Change and Patterns of Industrial Growth Research Paper 19 May 1967
25 - Kelley Allen C and James C Knowles Trade Theory Regional Inteshygration and National Economic Development The Case of Southshyeast Asia August 1967
26 - Kelley Allen C and Jeffrey G Williamson The Prospects for Regional Economic Co-operation and the Rate of Household Savings in the LDCs Research Paper 15 March 1967
27 - Kitamura Hiroshi and Ajit N Bhagat Regional Harmonization of National Development Plans and Trade Co-operation Appriaches to Economic Integration in the Developing ECAFE Region January 1967
28 - Lakdawala D T and R H Patil Prospects of Indias Foreign Trade with ECAFE Countries December 1966
29 - Leith J C The Specification of Nominal Tariff Rates in Effective Protection Estimates The Philippine Economic Journal Vol VI 1967 Research Paper 12
30 - Leith J Clark Tariff Structures and Protection A Background Paper March 1966
31 - Leith J Clark Non-Traded Imputs and Substitution in Calculating the Effective Protective Rate June 1967
190
32 - Lim Chong Yah West Malaysia External Trade 1947-65
33 - Morgan Theodore Theory of Error in Centrally-Directed Economic Systems Quarterly Journal of Economics (August 1964)
Research Paper 2
34 - Morgan Theodore A Theory of Economic Growth in Newly Settled as Contrasted with Old-Settled Areas October 1964 In A H
Whiteford ed A Re-appraisal of Economic Development Aldine 1967
35 - Morgan Theodore Investment Versus Economic Growth Research Paper 11 August 1966 Economic Development and Cultural Change January 1969
36 - Morgan Theodore Trade Preferences as a United States Policy with Special Reference to Southeast Asia August 1967 Malayan Economic Review Nov 1968 Research Paper 18
37 - Morgan Theodore Economic Planning--Points of Success and Failure Philippine Economic Journal Feb 1966 Research Paper 5
38 - Myint Hla Economic Theory and the Underdeveloped Countries Research Paper 3 March 1965
39 - Myint Hla The Inward and Outward Looking Countries of Southeast Asia and the Economic Future of the Region Research Paper 7
February 1966
40 - Naya Seiji The Commodity Pattern and Performance of Southeast Asias Exports to the Developed Areas Economic Development
and Cultural Change (forthcoming) Research Paper 10
41 - Naya Seiji Some Comments on Trade Projections for Developing Asian
Countries A Background Paper March 1966
42 - Naya Seiji Natural Resources Factor Mix and Factor Reversal in
International Trade June 1966
43 - Naya Seiji and Theodore Morgan The Accuracy of International Trade Data The Case of Southeast Asian Countries August 1967 in Journal of American Statistical Association June 1969
44 - Naya Seiji and Nyle Spoelstra Commodity Trade Patterns Among Southeast Asia Japan India and the United States 962
Preliminary Data March 26 1965
45 - Panglaykim J and Kenneth D Thomas Indonesian Exports Performance and Prospects
46 - Stephen E Reynolds Customs Unions among Developing Countries April 1968
191
47 - DV Ramana and Kenichi Odawara Deficit Financing and Import Substitution India 1951-65 January 1967
48 - Schmitt Hans 0 The Integration of Capital Markets in Europe A Step Towards Political Unification World Politics 1968 Research Paper 6
49 - Sen K C The Inward-Looking and the Ouward-Looking in Southeast Asia January 1965
50 - Sen K C Convergence in Planned Economies Research in Paper 1 June 1965
51 - Sen K C Economic Growth and the Price Level--An Analysis of Some Asian Data Research Paper 13 March 1966
52 - Sen K C Nation-Building and Regional Integration Research
Paper 8 May 1966
53 - IJ Singh Agriculture and Development June 1965
54 - Sun I - Shuan Trade Policies and Economic Development in Taiwan
55 - Staff Economic Interdependence in Southeast Asia prepared for SEADAG Conference Honolulu March 1967
56 - Suparb Yossundara and Yune Huntrakoon Some Salient Aspects of Thailands Trade during 1955-64 January 1967
57 - Ta-Yeh Wu Problems and Prospects of Economic Co-operation in Southeast Asia March 1967
Longer and Summary Papers
58 - (Book) T Morgan and N Spoelstra eds Economic Interdependence in Southeast Asia Univ of Wisconsin Press Nov 1969 (based on a Bangkok Conference of Feb 1967 and the work of the group) 480 pp
59 - Staff Economic interdependence in Southeast Asia (pamphlet) interim paper prepared for Southeast Asia Development Advisory Group conference at Honolulu March 12-14 1967 49 pp
60 - Theodore Morgan and staff Regional Economic Cooperation in Southeast Asia--Problems and Prospects (pamphlet) a paper prepared for a Southeast Asia Development Advisory Group Rural Development Seminar Honolulu June 19-21 1969 21 pp published by the Asia Society May 1970
192
61 - Staff Final Report on Economic Interdependence in Southeast Asia (a summary of research findings) December 1969 192 pp
62 - Benjamin Higgins Trade Versus Aid in the Reconstruction and Development of Southeast Asia 450 pp August 1967
ECONOMIC INTERDEPENDENCE
IN SOUTHEAST ASIA
FINAL REPORT
The University of Wisconsin
AID Research Program
(Contract csd3565)
March 17 1970
Preface
In the spring of 1963 before Southeast Asia became so conspicuous
a problem of foreign policy as it later became the Agency for International
Development invited a number of US universities to consider the possibility of basic research on economic development in Southeast Asia and on economic
cooperation within the region AID also sought to encourage a rapid inshycrease in the number of American and Asian economists doing research in the field Eleven universities submitted proposals two were invited in final competition to revise and resubmit their proposals A contract was signed with the University of Wisconsin on March 23 1964 With extensions the
contract continued through 1967 and editing and publication work under the
contract has continued into 1970
The University of Wisconsin already had on its stdff a number of economists who had held teaching research or advisory roles in Southeast Asia and whose interest in that region was continued in their research and
teaching in the United States The University accepted the contract because of the promise of its fitting with mutual support into regular programs
of teaching research and exchanges both with respect to economic developshy
ment generally and Southeast Asia in particular
The University was disposed toward a broad framework in definition of the region and conceptually including basic issues of development
regional cooperation and planning within which to place the specific issues
of economic interdependence in Southeast Asia
The operation plan of the Contract was set out in Appendix B A - To ascertain as accurately as possible the nature and extent of
benefits that might accrue to certain South and Southeast Asian countries through increased economic co-operation
B - To stimulate research by qualified researchers both in the United States and in the Asian countries in the field of regional economic co-operation
C - To hold such meetings as necessary including working conferences in the United States and Asia to discuss and criticize research in progress and
D -To appraise AID by written reports of the political aspects of its analysis and to advise AID by written reports on the best way to use its resources to attain alternative policy objectives
2
The Contract projection of the research to be done was more indicative than specific Wisconsin agreed to use its best effort
a - To evaluate the economic advantage to countries of the region from economic co-operation and co-ordination
b - To assess the theory and experience of ecoyiomic growth and of common market and free trade association ventures and other forms of economic co-operation as compared with Southeast Asian possibilities
c -To assess the extent to which national plans have implications or specifications with respect to economic integration in the areaand the extent to which success or failures in implementationhave had any systematic relation to regional economic interest
d - To indicate future AID strategy with respect to regional economic co-operation In this camptegory Contractor shall advise AID what policiesof AID can most effectively encourage the economic co-operation measures that best serve the interests of the region
Most of the research done under this contract has gone into 62 papers
including 5 longer and summary studies The majority have been circulated to
AID or have been incorporated in a book published in 1969 by the University of Wisconsin Press Economic Interdependence in Southeast Asia The material
in this Report does not in general duplicate the basic papers though it often draws on them This Report attempts to meet more narrowly and specishy
fically the questions posed by the Contract summaries and conclusions
depend in part on material not reproduced here
The 42 people listed below have been authors in part or wholly of one or more of the Project papers (For those not now (March 1970)
at the University of Wisconsin we have put down the institution with which
they are connected) Among them Professors Everett D Hawkins Seiji
Naya Nyle Spoelstra K C Sen and Mrs Fag el Nour have been especially
close to the Project Professor Hawkins was in touch with the work from
the beginning contributed throughout and was for a time Director of
Research He has been a most helpful critic of this Report Professor Spoelstra
carried much of the administrative and editing burden during the whole Contract
period
Bernhard Abrahamsson Benjamin Higgins (Univ of Denver) (Univ of Montreal)
3
Dorra Alwan Harley Hinricks (Univ of Maryland) (Univ of Maryland)
Robert E Baldwin Kai-Loo Huang (Moravian College)
AN Bhagat (UN Econ Yune Huntrakoon (Bank of Com for Africa) Thailand)
Angela Bilkey Nurul Islam (Pakistan Inst of
Amado Castro (Univ of the Development Economics) Philippines)
KR Chou (Nan Yang Univ)
HNS Karunatilake (Central Bank of Ceylon)
PT Ellsworth (Univ of Allen C Kelley
California Riverside) Hiroshi Kitamura (UN Econ Com Naval Fag El Nour (American
for Asia and the Far East)
University Cairo) DT Lakdawala (Univ of Bombay)
Everett D Hawkins Robert J Lampman
Lim Chong Yah (Univ of JC Leith (Univ of Western Singapore) Ontario)
Theodore Morgan DV Ramana (Asian Inst for
Hla Myint (London School of Economics)
Econ Devel and Planning)
Stephen E Reynolds (Univ of
Seiji Naya (National Bureau of Utah)
Econ Research Univ of John Richards Hawaii)
Kenichi Odawara KC Sen (Asian Development Bank)
(Sophia University Tokyo) IM Singh (Ohio State University)
J PanglAykim (Australian National Univ)
I-Shuan Sun (Central Bank of China)
Douglas S Paauw (National Planning Association Washington)
Nyle Spoelstra (Nat Inst of Devel Administration Bangkok)
RH Patil (Univ of Bombay) Anthony Tang (Vanderbilt Univ)
4
John Power (Univ of the Kenneth D Thomas (La Trobe Philippines) Univ Melbourne)
Jeffrey G Williamson
Ta-Yeh Wu (UN Econ Devel Board Singapore)
Suparb Yossundara (Bank of Thailand)
The following 44 people have served as consultants to the research program being one or several days at Madison and holding formal and informal meetings with the research group and usually speaking at a Workshop
Herbert Grubel (Univ of Pennsylvania) Gottfried Haberler (Harvard University) Robert Z Aliber (Univ of Chicago) W M Corden (Oxford Univ)Ronald McKinnon (Stanford Univ) Guy Black (Council of Economic Advisers
WashingtonDC)Irma Adelman (Northwestern Univ) Adam Marton (Budapest Hungary) W Arthur Lewis (Princeton Univ) Clair Wilcox (Swarthmore College)Pan A Yotopoulos (Stanford Univ) D A Snider (Miami Univ) Hollis B Chenery (Harvard Univ) Lloyd J Reynolds (Yale Univ) Richard E Caves (Harvard Univ)Arthur T Mosher (Econ Devel Council
New York)Hla Myint (London School of Econ) Frank H Golay (Cornell Univ)Gerhard Tintner (Univ Calif Los Angeles) Kang Chao (Univ of Wisconsin)Nathan Keyfitz (Univ of Chicago)Emile Despres (Stanford Univ) Clifton R Wharton Jr (Michigan State Univ) Gustav F Papanek (Harvard Univ)Lauchlin Currie (National Univ of Columbia) Edward Fei (Agency for Int Devel
Washington D C)Richard Goode (Int Monetary Fund
Washington D C)Benjamin Higgins (Univ of Montreal) G Sicat (Univ of the Philippines)Douglas Fontein (Int Bank for Recon and Devel) J Strasma (Univ of Wisconsin)
5
A Ravenholt (Amer Univ Field Service Manila) Bela Balassa (Johns Hopkins Univ and IBRD) HK Mazumdar (Indian Statistical Institute Calcutta) Robert R Nathan (Nathan Associses Washington DC) Reed Irvine (Federal Rcmerve Board Washington DC) Julian H Singman (Washington DC) Lloyd I Rudolph (Univ of Chicago) George Dalton (Northwestern Univ) CH Thompson (Int Bank for Rec and Devel) Stephen Enke (Dept of Defense Washington DC) John H Power (University of the Philippines) Harry G Johnson (Univ of Chicago and London School
of Economics) I Robert Sinai (New York Univ)
A conference on Economic Interdependence in Southeast Asia was held at
Bangkok at Sala Santithan (ECAFE) in January 1967 Contributors are listed
in the first group above
The views presented here are of course personal ones and do not necesshy
sarily reflect those of the United States Agency for International Development
the University of Wisconsin or the other organizations with which various
contributors are or have been associated
Theodore Morgen Director of Research
University of Wisconsin
March 17 1970
6
Table of Contents
Preface page 1
I- Advantage to the region from economic cooperation 12
A- Less Developed Country comparative advantage in manufactured goods with special reference to Southeast Asia 12 I- Similarities in manufactures
B- Export patterns and trends of comparative
D- Asian commercial policies and the
a- An overview of Asian commercial
b- Quantitative restrictions on
c- Quantitative restrictions on foreign
E- Customs revenue loss in a Southeast Asian
F- Protectionism and the growth of productive
G- The variety of economic and non-economic
production structures 16 2- Implications export performance 30
advantage 37 1- Asian performance in world trade 37 2- Exports to More Developed Countries 39 3- Intra-regional trade 47
C- Cutting transportation costs 57
possibilities of expanding regional trade 60 1- Introduction 60 2- Theory 60 3- Quantitative restrictions 69
policies 1961-67 69
current account 72
capital 78 4- The pattern of tariff protection 79
customs union 88
efficiency 99
cooperation 102
II- Foreign exchange const7aints and regional cooperation in Southeast Asia 104
A- A regional payments union
C- Two gaps saving and foreign exchange
104 B- The end of the Vietnam war 114
as checks on regional growth 114 1- Empirical studies 118 2- Criticism 124
7
III- Major cautions on the statistics 126
3- Effect of adjusting trade data by the
B- Inaccuracies and misleading concepts in
2- Misleading categories for LDC growth
pageA- Inaccuracies in Southeast Asia trade data 126
- The problem procedure 126 2- The errors 128
exchange rate 137 4- Commodity trade statistics in detail 140 5- Concluding comment 142
the standard national income statistics 144 1- Errors in LDC social accounts 144
analysis 146
IV- National plans and regional integration in Southeast Asia 150
A- Planning patterns
D- Spill-overs Plan Harmonization and
150 I- Two directions of policy in LDCs 151 2- Two patterns of growth in Southeast Asia 152 3- A recent trend 153
B- Planning in five countries a summary 154 1- Indonesia 155 2- Thailand 156 3- Singapore 158 4- The Philippines 159 5- Malaysia 159
C- Multiple objectives 161 1- Ditficulties as seen by the planners 161 2- The purposes of planning 162
bilateral agreements 164 1- The spill-over effect 164 2- The regional harmonization proposal 165 3 - Bilateral agreements 169
E- Some conclusions 170
V- Regional cooperation in Southeast Asia--forms policy 172
- Degree of formality and government A- Taxonomy 172
commitment 172 2- Cooperation within the region only 175 3- Other categories 175
B- The political hurdles 176 C- Guidlines for policy 177
VI- Summary policy implications 179
Appendix Research papers written in the Project 188
8
Tables
1 - ISIC classification 17
2 - Indices of value-added per employee wages and salaries per employee and non-wage valueshyadded per employee for manufactures in selected Southeast Asian Countries (ISIC 2-3 = 100) 1963 18
3 - Consistency in value-added by industries in Asia 20
4 - Manufactures satisfying low value added peremployee criteria in the Philippines 23
5 - Manufactures satisfying low value added per employee criteria in the States of Malaysia 27
6 - Export performance of nine Asian Countries 1962-65 32
7 - Manufactured exports of dynamic character for selected Southeast Asian Countries 35
8 - Export directions by regions 38
9 - The compositional and competitive effects of exports to more developed countries by Asian Countries - averages of 1956-57 and 1964-65 41
10 - The composition and competitive effect of exports of Asian Countries by commodity groups averages of 1956-57 (I) and 1964-65 (II) in percentages 44
11 - Export growth and shares of intra-regional exports averages of 1956-57 and 1964-65 48
12 - Commodity composition of total and intra-regional exports of selected Asian Countries 1962 and 1965 50
13 - Commodity composition of total and intra-regional imports of selected Asian Countries 1962 and 1965 51
14 - Competitive and compositional effects of intra-Asian Trade by country 1962-65 53
15 - The compositional and competitive effects of less developed Asias export to more developed areas 1956-57 to 1964-65 56
16 - Asian commercial policies 70
17 - Current account restrictions 73
9
18 - Significant changes in current account policy 74
19 - Restrictions on current account 76
20 shy Tariffs-Major categories 82
21 - Sample commodities duties (Ad valorem or specifices equivalent) 84
22 - Import duties as a percent of total national government revenues selected Southeast Asian countries 1963-65 88
23 - Hypothetical calculations of revenue losses 93
24 - Federation of Malaysia revenues of Federal and State governments 94
25 - Malaysia revenue collected on imports from Two Partner Countries 1963 96
26 - Potential revenue loss 98
27 - Intraregional bilateral balances of trade 1958-65 108
28 - Growth of world and Indian exports 120
29 - Indicies of gross profits in Indian industries (1950-100) 121
30 - A zest of average export ratios (MiX i) assuming ar expected value of 1 10ij 133
31 - A test of average import ratios (MX) assuming an exrected value of 11031 133
32 - A test on variability of export and import ratios of Southeast Asian countries with Asian and more developed country partners 136
33 - The averages of export and import ratios standard deviations and coefficients of varishyations on the basis of adjusted data 139
34 - Philippine export ratios and import ratios by commodities with the four largest and with all Partner Countries 141
10
Charts
1 - Ratio of trading partners imports from Southeast Asian Countries to corresponding exports of Southeast Asian countries 131
2 - Ratio of Southeast Asian countries imports to corresponding exports of trading partners 132
ECONOMIC INTERDEPENDENCE IN SOUTHEAST ASIA
12
I - Advantage to the Region from Economic Cooperation
One purpose of the Contract was to evaluate the economic advantage
(or disadvantage) to the region from economic cooperation and coordination
(Appendix B pp B 1-2) Our response to this injunction is given below
under seven headings A to G
A - Less Developed Country (LDC) Comparative Advantage in Manufactured
Goods with Special Reference to Southeast Asia
A basic point underlying any discussion of development policies of
LDCs is the fact that although international trade may not be serving as an engine of growth it cannot be disregarded The degree of dependence of
LDCs on international trade has been and still is typically high In
many cases exports of these countries constitute more than 15 percent
of their national income and 50 percent or more of their export earnings
is derived from one or two commodities Recurrent discussions have emanated
from the United Nations and other sources relating to the present and future
prospects of a large trade gap for less developed countries These discusshy
sions run in terms of a growing need for foreign exchange by the LDCs to
meet their economic development programs Such foreign exchange needs are
presumably to be met by exports of their traditional primary commodities
or by expanding their recent venture into trade in manufactured goods
Trade projections of prospects of world demand and potentialities
for expanding exports of traditional primary commodities conducted by the
FAO the ECAFE and others reflect very modest rates of increase over the coming decades It thus becomes of great importance for LDCs to expand
their exports of manufactured goods
To the advantage of LDCls recent trends in international trade
point to a tendency toward convergence in world specialization and exchange
Contrary to the long established dichotomy in world production and trade
between predominantly primary goods production and export by less developed
countries and manufactured goods production and export by developed
countries recent trends indicate more diverse specialization patterns
The export of manufactures by LDCs though still much concentrated in origin and destination has also Xecently exhibited high rates of growth
Despite the difficulties inherent in attempts to generalize on production possibilities for various countries including the LDCs1
various attempts have been made to assess the implications of recent developments in world trade as an indication of the possibility of the LDCs developing a comparative advantage in the production of certain manufactured goods If one is to generalize broadly on the LDC comparashytive advantage area within manufactures one must choose for both logical and empirical reasons the area of relatively low skill-labor intensive2
manufactures This gives rise to the need to apply soue theoretically sound and workable criteria for the delineation of some manufactures potentially successful for LDCs specialization and trade The choice of any such criteria would to a large extent be influenced by the nature of
the data available for LDCs
The analysis of LDCs prospective comparative advantage in the production of certain manufactured commodities thus starts with the basic assumption that the LDCs have relatively little accumulated capital in either conventional or human-skills form Hence any comparative advantage they may have in manufactures apart from the resource oriented ones arises from their abundant labor The implication then is to specialize in the prcduction of those industries with a strong labor orientation defined to incorporate low capital requirements in the forms both of plant
and eqlpment and of education and training (human capital)3
1Particularly the presence of nonmonetized sector and the rigiditiesin the structure of their economies impeding factor mobility
2The importance of the availability of different levels of laborskills as the major factor explaining the patterns of international location and trade is emphasized by Donald B Keesing Labor Skillsand International Trade Evaluating Many Trade Flows with a Single Measurshying Device Review of Economics and Statistics (August 1965) pp 287-293
3Hal B Lary Imports of Manufactures from Less Developed CountriesNational Bureau of Economic Research New York 1968 p 4
14
Criteria satisfying this definition which can be applied to some
Southeast Asian countries data on manufactures were utilized by Professor
Hal B Lary 1 in a study at the National Bureau of Economic Research The
criteria were based on the ranking of industries with respect to the two
major components of value added per employee the wages and salaries per
employee (representing the labor component2) and the non-wage value added
per employee (representing the returns to factors other than labor interest
rentpprofits and depreciation allowances) The criteria thus allow for
the incorporation of human capital into the analysis a matter of first
importance In addition the criteria have the essential merit of feasishy
bility since data on value added employment and wages and salaries are
likely to be available for a large number of countries The difficulty of
incorporating natural resources as a direct factor of production is partly
assumed away since the study focuses on identifying labor intensive manushy
factures and omits primary products from the analysis There are a number
of labor intensive manufactures however which are also highly resource
oriented Their consideration for specialization purposes would thus
vary between individual countries depending upon the degree in which their
production requires specific natural resources versus low skill labor3
It should be noted however that such resource4 oriented products some
of which mainly undergo simple processing operations contribute signifishy
cantly to manufacturing output and are instrumental in explaining the
pattern of exports of LDCs
1lbid pp 21-22
2The validity of using the wages and salaries and the nonwage componshyents of value added per employee as indications of relative skill and capital requirements was supported by finding significant relations across industries between the wages component and other measures of skill mainly occupational and educational indices and between the remaining component and stocks of physical capital
3Ibid p 14
4Ibid pp 48-50
15
The entire analysis rests on the factor proportions theory with its underlying assumption of the comparability of the factor intensities for different countries It aloo assumes the possibility of approximating empirically to the Heckcher-Ohlin version of the theory of comparative advantage and the nonexistence or at least the practical irrelevance
of factor intensity reversal1
Because of the importance of the assumptions underlying the factor proportions theory in the specification of those manufactures potentially profitable for LDCs further research was undertaken in the NBER study on those points Comparison of value added per employee and its components for nine countries2 over the thirteen industry groups appearing in the UN The Growth of World Industry3 indicated a high degree of conformity as measured by Kendalls coefficient of concordance Thus based on the analysis of value added and its components for array of US iniustries the study pointed that the LDCs should have comparative advantage in manufactures which have (1) a low level of value added per employee and (2) low levels of both components of value added wages and salaries per employee and other remaining components These manufactures were found to be textiles and clothing wood products furniture leather products miscellaneous manufactures and a number of special manufactures in other
1Some qualifications result from studies by W Leontief Domestic Production and Foreign Trade The American Capital Position ReexaminedProceedings of the American Philosophical Society Sept 1953 In a secondarticle however Leontief put more emphasis on the skill requirements forthe different industries--a factor which is excluded in analysis based on examination of stocks of physical capital and man hours of labor W Leontief Factor Proportions and the Structure of American Trade Further Theoretical and Empirical Analysis Review of Economics and StatisticsNovember 1956 It should also be noted that in one of the calculations inwhich Leontief excluded natural resource sectors the paradox disappearedthe US was found to export more capital intensive products
BS Minhas The Homohypallagic Production Function Factor IntensityReversal and the H-O Theorem Journal of Political Economy April 1962Hinhas introduces the CES production function which permits the occurrenceof factor intensity reversal and points to the existence of some factor reversals Leontief however conducted more extensive tests and confirmed the empirical irrelevance of factor reversal W Leontief International Factor Costs and Factor Use AER June 1964
2United States Canada Australia Sweden United Kingdom BrazilJapan Mexico and India Lary opcit p 71
3United Nations TheGrowth of World Industry 1936-1961 National Tables (United Nations 1963)
16 1
major groups
1 Similarities in Manufactures Production Structure
Applying the criteria based on analysis of value added per employee to
data on manufactures for selected Southeast Asian countries yields results
generally in agreement with the NBER study findings Detailed analysis of
individual groups of manufactures however indicates somewhat wider possibilshy
ities for specialization
In general as shown in Table 2 there was much similarity in the rankshy
ings of the different manufacturing groups for the countries considered
The Kendall coefficient of concordance2 and the chi square test computed for six Southeast Asian countries over twenty industry groups for 1963 and for
the same countries plus Japan over eighteen industry groups yielded results
significant at the 001 confidence level The results of this test are in
Table 3 below
The major groups of manufactures that satisfied the relatively low
skill labor criteria 3 for practically all of the countries considered were
1Examples of such manufactures are plastic goods footwear glasswearand china jewelry optical goods cutlery aad hardware electrical apparatus and appliances non electrical machinery printed matter and processing and preserving of fish and fruits and vegetables
2The Kendall coefficient of concordance provides a measure of the relashytion among several rankings of N variables ie determines the association among N variables It constitutes an index of the divergence of the actual agreement shown in the data from the maximum possible (perfect) agreement See Sidney Siegel Nonparametric Statistics for the Behavioral Sciences (New York McGraw Hill Book Company Inc 1956) pp 229-239
3The relatively low skill labor manufactures are defined as those manufactures having (1) relatively low value added per employee below the overall average for the manufacturing sector of each country and (2) levels of both wages and salaries per employee and non-wage value added per employee below the overall average
17
ISIC Classification
20
21
22
23
24
25
26
27
28
29
30
31
32
33
34
35
36
37
38
39
Table 1
Manufacturing (Division 2-3)
Food Products
Beverages
Tobacco Products
Textiles
Clothing Footwear and Made-Up Textiles
Wood Products
Furniture
Paper and Paper Products
Printing and Publishing
Leather and Leather Products
Rubber and Rubber Products
Chemicals and Chemical Products
Petroleum and Coal Products
Non Metallic Mineral Products
Basic Metals
Metal Products
Machinery except Electrical Machinery
Electrical Machinery
Transport Equipment
Miscellaneous Manufactures
Table 2 -- Indices of ValueAdded per Employee Wages and Salaries per Employee and Non-WageValue-Added per Employee for Manufactures in Selected Southeast Asian Countries (ISIC 2-3 =_ 100) 1963 (r)
ISIC _(2-3) 20 21 22 23 24 25 26 27 28 29Value Added Per Employee (2)Japan(2) Taiwan India Rep of
10000 10000 10000 10000
9130 11555 9082 10289
12826 40360 14289 23782
---67741 6301
60326
6413 5521 8165 6220
5326 6034 6420 5948
5869 6185 6390
11514
6739 6963 7662 5693
10869 9297 12751 13516
11739 4079 9319
10102
8913 8311 7396 6664
Korea Singapore 10000 Malaysia(5) 10000
6657 9080
16699 11900
21994 13800
3834(3) 6660 7260
6053 8260
9620 6400
5898 10320
9564 8600
6320 7000
(West)Philippines 10000 12850
(6)15812 9878 4990 3480 5027 3613 9900 5856 4839
Wages amp Salaries Per Employee (2)Japan 10000 7575 8484 --- 7272 6363 7575 8484 10606 13333 10303Taiwan 10000 9285 12857 15357 7619 6904 9166 7380 11428 10238 9285India 10000 6354 8125 5208 9843 9270 5833 8958 10312 10989 7291Rep of 10000 8195 11403 17807 8254 8490 11341 8910 10609 14110 10699Korea (3)Singapore 10000 7975 8947 6396 5384 10242 13279 5668 11740 6072
Malaysia (5) (6)(West) 10000 8901 10989 7637 7307 7472 11263 7472 8241 12582 5494Philippines 10000 9185 14253 7466 7828 5610 8099 7918 11538 13212 8325
Non Wage Value Added Per EmployeeJapan 10000 10000 15254 593252) 4745 4915 5762 11016 10847 8135Taiwan 10000 11959 45450 7500 5112 5855 5608 6869 8873 2905 8108India 10000 12671 22397 7739 5958 2671 7123 5958 15958 7123 7534 Rep of
Korea 10000 11034 18185 75451 5496 5044 11576 4549 14550 8676 5229Singapore 10000 5956 t0817 30279 3010(3) 3827 7677 6021 8408 6451 Malaysia(5) (6)
(West) 10000 9182 12421 17327 6289 7138 6540 5786 11509 6320 7661Philippines 10000 14035 16315 10657 4078 2792 4035 2222 9371 3479 3713Source Data calculated from United Nations The Growth of World Industry (United Nations 1968) (1) Figures for the Philippines and India refers to 1962 and figures for Taiwan refer to 1961 (2) Data excludes tobacco manufacturers (ISIC22)(3) figure stands for textiles clothing and footwear (ISIC 23 and 24)
Table 2 ------- continued
ISIC 30 31 32 33 34 35 36 37 38 39Value Added Per Employeejapan(Z) 9239 18804 22826 10217 11304 8804 10217 10434 12934 8260Taiwan 8899 11593 25578 8804 14857 8045 5939 7988India 6660 899423698 23254 55502 8816 10917 10562 11183Rep of 11745 10177 89056029 14707 6743 10706 10366 6341 6395 9121 6430 5561 KoreaSingapore 8820 27247(4) 11179 17556 9873 7668 9522Malaysia(5) 8820 19440 7500 5407
(6) 11000 10280 8400 6820 15660 7500 30400(6)(West)Philippines 14607 15524 17690 11270 8320 8265 11911 9215 10994 5038Wages amp Salaries Per EmployeeJapan 9090 13030 14242 9696 14242 10000 11818 9696 12727Taiwan 90909404 12500 13095 10119 15714 9166 11071 10238 13333India 833316041 13281 27083 7552 12604 10312 11458Rep of 11718 11979 92189274 11974 8825 11847 12308 8476 10540 9801 13196 6943Korea (4)Singapore b23 13157 10688 10121 9757 10890 15870 12550 6356
Malaysia(5)(West) 9010 11648 (6) 10000 11758 9340 10439 11868 11978Philippines 11312 15610 16813 (6)29004 11493 10995 11085 12714 10361 12398 8235Non Wage Value Added Per EmployeeJapan
Taiwan India
9322 8783 33767
22033 11396 36369
27627 27882 92876
10508 8536
10479
9661 8135 9322 14662 7815 4954 8698 10890 10821
10847 13050 7554 5382
11780 7808
7796 9099 8493
Rep of Korea
Singapore 4874 8924
15679 6002 34731(4)
10300 11440
9676 21505
5582 9935
4921 5956
8879 6150
4024 4817
5069 4903
Malaysia(West) 8710
Philippines 15672 23899 (6) 15497 186038
11572 11198
9433 7456
7861 4748 7353 11652
17830 4937 8845 10540
38176(6) 4005
(4) figure stands for chemical and petroleum products (ISIC 31 and 32)(5) Data for Malaysia excludes tailors and dressmakers (part of ISIC 24) in smelting industry(part of ISIC 342) motor vehicles and bicycle repair shops (ISIC 384 and 385) goldsmithing(part of ISIC 394) and processing of agricultural products on estates comprising tea factories(part of ISIC 209) rubber processing on estates (part of ISIC 30) and copra kilns and palm
(6) oil milling (part of ISIC 312)Breweries and manufacturing of malt (ISIC 213) and manufactures of products of petroleumand coal (ISIC 32) are included under miscellaneous manufacturing industries (ISIC 39)
4 ~ ~v-gt 444 420~
~ ~ ~ ~ ~ ~~~~~~ ~
r 1963 data 0203 707244cou
gt 41e 44gt~ 4 ii iltlii ]IIR ii 1 144 4
Tile 44144 os Cocodnc eaursth CefCon onisecy rakfgt4 Of
Ii i ]CoFffice41t itC of h 4gt
(for seven Co 1963=iiL 60 8 7 n ris data)i
44t e nt s- on c lt4444v gt-4c KI19 6 pp 4 lt29-4 )Y~~ 4
~~lt4441~ ~ ~~ K - 1I 44 4 44 44KK
an Concardanccluduare
4it a p i f chanc o e4 (S SL441 e
ab r o f n un r es c nc rn d f r te 11ii th ve sh wn - h l am c CIiLIS111=
d~isa r em n iwoul Chi All e nde lsbe 0iltii~iii 7-~ theii Sq a a i r r
CulatedI )i over Itwenty industrial groupsiifor i i Fo Se ton l~ of the ta le th ab v co ntie Jap IltF ei IIILIS + [+
incude Ther areiover~lI eihte inutilgois rus2
21
similarly those of textiles (23) clothing and apparel (24) wood and wood products (25) furniture (26) leather and leather products (29) and miscellaneous manufactures (39)
In addition other groups of manufactures have alsc exhibited relatively low capital requirements measured by low indices of valueshyadded-per-employee and non-wage-value-added-per-employee These groups were mainly printing and publishing (28) metallic products (35) nonshyelectric machinery (36) and transport equipment (38) Such low indices also appeared for individual countries in groups (37) of electrical
machinery (34) of basic metals (33) of non-metal mineral products and (20) of food products The finding therefore encourages these countries to expand the production and export of some manufactures within the specified groups However wages and salaries were higher for groups 28 35 36 and 38 than for groups 23 24 25 26 and 39 suggesting somewhat high skill requirements The difference might however have reflected heterogeneity in groups 35 36 and 38 or in the other groups Hence a detailed study of two of the countries the Philippines and Malaysia I was
carried out
Our detailed analysis of manufacturing sectors in the Philippines
and Malaysia gives support to favoring disaggregated consideration of LDC specialization in manufacturei production In addition to manufactures in groups 23 24 25 26 and 29 all of which generally satisfy the criteria both of low-value-added-per employee and low wages and salaries and non-wages-added-per-employee there are subgroups here and there in virtually all of the remaining manufacture categories that show the same
characteristics
1Bureau of the Census and Statistics Annual Survey of Manufactures1960 Volume V (Manila Philippines 1962) and
Department of Statistics of Malaysia Census of ManufacturingIndustries in the States of Malaya 1963 (Kuala Lumpur Malaysia 1965)
22
We list below in Tables 4 and 5 those manufactures for the Philippines and Malaysia that qualify by the above criteria and so invite considerations as serious candidates for LDC production It is interesting to note that the manufactures listed below to a very large extent encompass those identified as labor intensive in the study sumnarized in Table 2 It is important to emphashysize however the wider possibilities for specialization that emerge from examination of individual LDC data on manufactures
23
Table 4
Manufactures Satisfying Low Value-Added per Employee Criteria in the Philippines
Wages and Non-Wage Value Added Salaries Value Added
per per per ISIC Employee Employee Employee
All Industries 100 100 100
20 Food Manufactured 201 Slaughtered Prepared
and Preserved Meat 5833 9863 4260 203 Canned and Preserved
Fruits amp Vegetables 8935 10319 8395 204 Preserved Fish and
205 Other Seafoods Grain Mill Products
4705 8128
5159 7625
4527 8324
206 Bakery Products 3871 6803 2727 208 Cocoa Chocolate and
Sugar Confectionary 3756 5296 3155 209 Miscellaneous Food
2093 Preparations Dessicated Coconut
7559 2525
7534 5342
7557 1425
21 Beverages - -
22 Tobacco Products 221 Cigars Cigarettes and
related Products 8038 7899 8092 23 Textiles 4871 100 2869
231 Textile Mill Products 4653 7990 3351 2311 Hemp Mill Products 3871 6392 2887 2313 Narrow Fabrics and
Small Wares 4025 6210 3172 2314 Cotton Textile Mill
2316 Products Jute Mill Products
4641 5307
8264 8082
3226 4224
232 Knitting Mill Products 5500 7214 4830 239 Other Textiles 1948 1872 1978
24 Footwear and Other Wearing Apparel and 3089 5433 2174 Made Up Textiles
241 Footwear (Shoes amp Slipshypers except Rubber) 2794 5662 1675
243 Wearing Apparel except Footwear 2871 5205 1960
245 Embroideries Hand or Machine Made 4769 6310 4171
24 Table 4 (continued)
25 Wood and Cork Products 4525 8127 3119 Except Furniture
251 2521 2551
Sawmill and Planning Mill Veneer and Plywood Sawah Nipa and Bamboo
4641 4576
3051
8127 8584
6712
3279 3012
1622 26
2611 2621
2631
2641
2661
Furniture and Fixtures Rattan Furniture except Wood Furniture except Upholstered Venetian Blinds and Other Screens Metal Furniture except Upholstered Mattresses and Bedshy
4217 2294
3384
4500
4102
7397 4931
7351
8310
8401
2976 1264
1836
3012
2424
Springs 6743 7579 6417
27 Paper and Paper Products 28 Printed and Published
2821 Materials (mainly) Books and Pamphlets 8987 9771 8680
29 Leather Products
2911
2921
except Footwear Leather Tanned or Finished Luggage Handbags and Small Leathergoods
4961
5076
5205
7534
7945
7214
3957
3957
4420
30 3011 309
Rubber Products (mainly)Rubber Shoes and Slippers Miscellaneous Rubber
6384 10000 4973
Products 5987 10365 4278
31 Chemicals and Chemical
3121 Products (mainly)Vegetables Oils 7705 10182 6737
32 Products of Petroleum and Coal (combined with ISIC 39 of Miscellaneous)
33 Non-Metallic Mineral
331
Products (mainly) except Products of Petroshyleum and Coal Strictural Clay Products 5487 8082 4474
339 Other Non-Metallic Mineral Products such as statuary conshycrete lime statuary
8995 6269 5204
25
Table 4 (continued)
art goods and cut stone products
34 3412
Basic Metal Products (mainly) Iron and steel FoundryProducts 6346 9223 5222
35
351
Metal Products Except Machinery and Transport Equipment Tin and Aluminum Ware
352 356
3561
3563
3594
36
(except household and hospital utensils)
Cutlery and Hand Tools Heating Cooking and Plumbing Equipment Heating and Cooking Appashyratus Metal Plumbing Fixtures and Fittings Needles Pins and Fasteners Machinery Except electrishy
6192
4769
5217
3628
6820
6347
9041
9315
8401
9817
6131
3101
3618
1764
5650
364 3641
365
369
cal (mainly)Special Industry Machinery Food Products Machinery and Euipment General Industrial Machinery amp Equipment Other Machinery
5230
4282
3282 5487
9452
9269
7853 10228
3582
2335
1497 3636
37
371
Electrical Machinery Apparatus Appliance and Supplies Electrical Industrial
8474 10410 7718
3711 3712
Apparatus Motors and Generators Electrical Distribution
6269 3461
7808 7260
5668 1978
3722
3741
3749
and Control Apparatus 7641 Household Radios Phonogrpahs amp TV Sets 6769 Household Cooking amp Heating Equipment 3858 Other Household Electrical
8036
9817
7990
7486
5579
2245
Appliances 7346 9908 6345 38
381 3832
3841
3851
Transportation EquipmentShipbuilding and Repairing Motor Vehicle Engines Parts amp Bodies Motor Vehicles Repair shop Products Bicycles
3333
4858
5730 5384
10000
8767
10365 9132
730
3333
3921 3921
26
Table 4 (continued)
39 Miscellaneous Manufactures 3923 Eye Glasses and Spectacles 6000 7899 5258 397 Buttons 3067 8538 986
3991 Stationers Artist amp Office 8500 10228 7825 Supplies
3992 Fabricated Platted Products 9935 10045 5721 3997 Sporting and Athletic Goods 4448 8127 3012 3998 Brooms Brushed and Fans 6064 8173 5240
Source Data calculated from Bureau of the Census and Statistics Annual Survey of Manufactures 1960 Volume V (Manila Philippines 1962)
27
Table 5
Manufactures Satisfying Low Value-Added Per Employee Criteria in the State of Malaysia
Value Wages and Non Wage Added Salaries Value Added Per Full- Per Full- Per Full-Time Paid Time Paid Time Paid
IS IC Employee Employee Employee
Total Off-Estate Manufacturing Industries B Processing of Estate Type Agricultural
10000 10000 10000
Products in Factories Off Estates 1121 Rubber Remilling 7233 8730 6416 1122 Rubber Smoke Houses 6915 7989 66329
C Other Manufacturing Industries
30 Foods 3032 3051 3054 3055 3061 3062 3080 3091 3093
Pickles andSauces Factories Small Rice Mills Sago and Tapioca Factories Large Rice Mills Biscuit Factories Bakeries Chocolate and Confectionery Factories Meehoom and Noodles Factories Spice and Curry Powder Grinding Mills
9364 7607 8448 8803 6392 7420 7289 6878 6205
9100 7301 9663 9629 7566 6613 5343 6296 5026
9508 7774 8612 7352 5851 7861 8352 7196 6899
31 Beverages
3110) Distillations and Wine Manufactures 8598 8412 8699 3120)
32 Tobacco Products
33 Textiles 6598 6772 6502 (Includes Spinning and WeavingKnitting Mills Cordage Rope Net amp Twine and Other Miscellaneous)
34 Footwear (Except Rubber) Other WearingApparel and Made Up Textiles 8149 6084 9277
3411 Footwear (except rubber amp wooden)3412 Wooden Clogs and Sandals 3432 Clothing Factories 3420) Other Wearing Apparel (such _j repair
7831 7738 8448 8766
6666 5873 5079 7354
8468 8757 10289 9537
3433) of footwear hats and made-up 3440) textiles)
28
Table 5 (continued)
Value Added Per Full-
Wages and Salaries Per Full-
Non Wage Value Added Per Full-
ISIC Time Paid Employee
Time Paid Employee
Time Paid Employee
35 Wood Rattan Mena and Cork
Kuang Attap
3531 3591
Wooden Boxes Cases and Crates Carpentary Shops Other Wood Products (such as Wood Preserved Rattan Processing Basketware Attap Products and other wood and Cork Products
5700 8485
7345
7195 5978
9841
4884 9855
5982
36 Furniture and Fixtures includes
6728 7513 6300
361) Household Furniture 362) Office and Connercial Furniture 367) Furniture Finishing and Repairing 364) Mattress Manufacturing 369) Other Miscellaneous Manufacture of
Furniture
37 Paper and Paper Products
38 Printing and Publishing 382 Job Printing Bookbinding amp Printing
Service 7289 8730 6502
39 Leather and Leather Products except Footwear and Wearing Apparel 7570 5291 8815
40 Rubber Products 4010) Rubber Products except Retreading and 4021) Vulcanizing of Tires and Tubes (inshy
cludes 4030) rubber footwear tires and tubes
foam
6485 8095 5606
4090) rubber products amp other Miscellaneous
41 4195
Chemicals and Chemical Products Matches
6093 9084 6300
42 Coal and Petroleum Products (included Under All Other Industries)
29
Table 5 (continued)
Value Added Per Full-
Wages and Salaries Per Full-
Non Wage Value Added Per Full-
ISIC Timc Paid Time Paid Time Paid Employee Employee Employee
43 Non-Metallic Mineral Products
4310 4320 4330
4350
(except Petroleum and Coal) Structural Clay Products Glass Products Pottery China amp Earthenware Structural Cement amp ConcreteProducts
6168 7009 6467
8835 7883 7142
4710 6531 6387
10317 10115 10433 44 BasicMetal Industries
4421
45
Iron Foundries
Metal Products Except Machinery amp Transport
7906
8523 10264
9523 6618
7976
4520 Architectural Metal Products 4530 Wire and Wire Products 454 Harware Tools and Cutlery
4561 Tin Cans and Metal Boxes 4563 Brass Copper Pewter and AluminumProducts
7794 7775 9158 7757
8941 7460 6402 8571
7167 7947
10664 7312
4581
46 4620
4630
Blacksmithing and welding Machinery (Except Electrical) RepairsIndustrial Machinery and Parts General Engineering amp MachineryRepair Shop
8915 9196
6915 6579
6971
9047 8465
10582 10211
9470
8843 9595
9913 4595
5606 47 Electrical Machinery Apparatus
Appliances and Supplies 48 Transport Equipment amp Repairs4834 Motor Vehicle Parts amp Accessories
4332 Bicycle Tricycle and Trishaw Parts4813) Other Transport Equipment (such as 4851) Marine Engines Bicycles Tricycles4890) Trishaws and other nes
5289 6345 7588
6931 5555 9629
3493 8323 6473
49 Miscellaneous Manufactures4940 Plastic Products nes 7757 7195 8063 Source Data calculated from Department of Statistics of Malaysia
Census of Manufacturing Industries in the StatesofMalaya1963(Kuala Lumpur Malaysia 1965)
30
2 Implications Export Performance
For the purpose of estimating comparative advantage possibilities available data suffer sharply from their aggregation--that isthey suffer from the heterogeneity of products included under a given classification Guidance is needed for very specific kinds of specialization But aggregated data lead only to rough guidelines and if the rules of behavior and parashymeter shifts of individual segments happen to combine malevolently aggregated data can lead to generalizations inverse to the real facts
The problem we face in trade matters stems from definitions of products that are heterogeneous with respect to factor requirements We should be on guard LDCs in general and Southeast Asian countries in particular may be able to specialize efficLently in the production of a large variety of manushyfactures that are labor intensive and require only modest skills irrespective of the general group within which they fall
Greater awareness of this diversity would free policy in thesecountries toward a wider area of choice and greater degree of adaptability It would also enable them to take advantage of favorable export prospects among the more numerous plausible sub-groups of manufactures
It is a major complaint of LDCs that world demand for their traditional primary exports is unpromising Preoccupation with only a few manufactures which alone are supposed to have export potential risks earning the same disappointment There are valid factor-supply reasons for considering a wide range of industries and sub-industries and of course also on tle demand side their long-run demand prospects
A study of future prospects of world trade in manufactures by Maizels1 has projected a declining share of textiles and clothing2 and other miscellshyaneous manufactures for industrial semi-industrial and non-industrial
IAlfred Maizels Industrial Growth and World Trade (Cambridge CambridgeUniversity Press 1963) pp 402-406
2The share of textile and clothing exports as a percentage of world trade in manufactures declined from 20 in 1937 to 10 in 1959 and is projected todecline further to only 5 by 1970-75
31
countries between the years 1959 and 1970-75 At the same time capital goods and chemical products were projected to attain an increasing share of total imports of virtually all countriesI
A survey of the export(1) performance of nine Asian countries -Singapore Malaya Philippines Hong Kong Taiwan India Pakistan Thailand and also the Republic of Korea - tends to support the arguments so advanced The ast general tendency is that although primary products still constitute the highest percentage of total exports they are a declining share As is shown in Table 6 the percentage share of SITC groups (0-2) that is food beverages tobacco and crude materials has declined from 59 percent of the value of total exports of the nine countries in 1962 to 53 percent in 1965 The largest decline has been for SITC 2 (crude materials) partially as a result of the decline in the export prices of such products as natural rubber Expanding products in this group are oil seeds nuts and kernels wood lumber and cork and crude fertilizers SITC group 0 (food and live animals) has almost maintained its share of total exports between 1962 and 1965 at 22 percent This is partly a result of the high rates of growth of the exports of such processed food products as fish and preparations cereals and preparashytions fruits and vegetables (almost half of its export proceeds from canned and preserved fruits and vegetables) and animal feeding stuff Such products as sugar coffee and tea have shown either very low rates of increase or a declining trend
SITC groups 3-5 (animal and vegtable oils and fats chemical proshyducts and petroleum and coal products) have remained stable maintaining a 7 percent share of the value of total exports with petroleum and its products contributing almost 4 percent The most rapidly growing was SITC 4 (vegetable oils and fats) rising by 455 percent between 1962 and 1965 Exports of chemical products increased by 345 percent and petroleum and products by 14 percent
1Harry Johnson includes such goods among others as manufactures ofexport interest to less developed countries Harry G Johnson EconomicPoliciesTowardLess Developed Countries (New York Frederick A Praeger1967) pp 174-75
(1)From United Nations Commodity Trade Statistics 1965 and UnitedNations Foreign Trade Statistics of Asia and the Far East 1962
32
Table 6
Export Performance of Nine Asian Countries 1962-65
SITC Composition Z Rate of Growth
1962 1965 1962-1965
(0 1 amp 2) 5900 5336 1421
0 Food and Live Animals 2258 2187 2227
1 Beverages and Tobacco 152 136 1314
2 Crude Materials 3489 3012 905
(3 4 amp 5) 708 707 2605
3 Mineral Fuels 386 349 1415
4 Animal and Vegetable 170 196 4553
5 Chemicals 151 161 3453
(6 7 amp 8) 3287 3778 4517
6 Basic Manufactures 2184 2384 3786
7 Machinery and Transport 304 334 3873
8 Miscellaneous Manufactures 798 1059 6763
33
SITC groups 6 7 and 8 encompassing the bulk of manufactured exports-shybasic manufactures machinery and transport equipment and miscellaneous manufactures have gained an increasing share rising from 33 percent in 1962 to 38 percent in 1965 The largest contribution is made by SITC group 6 (basic manufactures) which accounted for 238 percent of total exports in 1965 The most important product under this group is textile yarn and fabshyrics (14) with India Pakistan and Hong Kong followed by Taiwan and Singashypore supplying the largest proportion of its exports SITC 68 of nonferrous metals is the second in significance (45) with tin mainly originating from Malaysia Other important products are wood manufactures mainly suppliedby Philippines Taiwan Korea and Singapore Ocnmetal mineral manufactures mainly originating from India Singapore Taiwan Hong Kong and Thailand iron and steel products from India Singapore Korea and Taiwan leather products basically from India and Pakistan metal products from Hong KongSingapore India Taiwan and Malaya and rubber manufactures from Malaya India and Singapore
SITC group 7 (machinery and transport equipment) constituted 33 pershycent in 1965 and increased by 387 percent between 1962 and 1965 with exshyports of electrical and nonelectrical machinery rising at a higher rate than exports of transport equipment Exports of SITC 8 (iniscellaneous manushyfactures) exhibited the highest rate of growth 676 percent betweeki the two years and contributed 106 percent of total exports in 1965 The most important product in this group was clothing followed by toys and sportinggoods footwear plumbing heating and lighting equipment furniture printshyed ratter and articles of plastic Most of the exports of this group origshyinated from Hong Kong
The following table (7) lists goods with rapid export growth It shows rates of growth and percentage composition of the above products and
other manufactured and semi-manufactured goods of dynamic charactertwo and three SITC digit classifications
in
1Indicating rates of increase above that of total exports (26 percent)
--
34
It is interesting to note that the list to a very large extent consists of manufactures that were shown to be labor intensive by examination of these countries data Most worthy of noting is also the fact that rapidshyly growing manufactured exports from Southeast Asian countries though still concentrated in origin are spread over almost all manufactured groups and extend far beyond the traditional products to which analysis of LDCs comshyparative advantage in manufactures has often been restricted
We should emphasize in conclusion that the right choice of potentiallysuccessful manufacturing industries needs to be complemented by a right mix of policies for promoting exports including conspicuously reasonable exchange rates We need to hope also that the HDCs adopt favorable import policies
It is important for LDCs to maintain price competition in the production of the manufactures in which they specialize a matter of the domestic pricelevel exchange rates and of specific policies There are indications that it is basically those LDCs with favorable export policies that are more successful in their general development efforts
Another important implication involves the skill composition of the labor force Skills including organization and administrative capacity are a scarce resource They should be considered soalong with quantity of capital natural resources and foreign exchange in planning for industrial development Skill availability over the course of time has relevance to the appropriate product mix of individual countries It directly influences the levd of current productivity and productivity potentials for the future
As development proceeds successfully the importance of industries low in skill and capital requirements will subside relative to those more demanding in their requirements
A final caution is relevant Experience in the United States indicates that the kind of industry or sub-industry that a business is in a poor guide to its individual success or failure Expanding fields which on the average are doing well have a built-in check the individual business faces increased competition from expansion of others and new entrants Its fortunes dependcrucially on its management which can cause it to sink in calm seas or sail sturdily through rough weather
35
Table 7 Manufactured Exports of Dynamic Character for
Selected Southeast Asian Countries SITC Product Composition Z Rate of Growth
1965 1962-1965 03 Fish and preparations 110 3884
04 Cereals and Preparatiens 526 4010042 Rice 417 3191046 Wheat meal or flour 16 6360
053 Fruits preserved and prepared 100 7309055 Vegetables preserved and prepared 53 7857
081 Animal feeding stuff 162 3251
24 Wood lumber and cork 338 4879242 Wood rough 4565243 Wood shaped
249 87 8331
27 Crude fertilizers 64 2822
332 Petroleum products 330 2615
422 Fixed vegetables oils nonsoft 189 6434
51 Chemical elements and oxides 4582512 Organic chemicals 30 15 2865513 Inorganic elements and oxides 07 7198
53 Dyes tanning and coloring products 15 3567
541 Medicinal etc products 27 6403
55 Perfumes and cleaning products 45 16748554 Soaps cleaning materials etc 14 12163
561 Fertilizers manufactured 13 6021
581 Plastic materials 08 2629
61 Leather manufactures 106 4276
62 Rubber manufactures nes 24 11773621 Materials of rubber 04 5909629 Rubber articles nes 19 6243
63 Wood and cork manufactures 121 13865
36
65 Textile and yarn fabric 1419 3115 651 Textile yarn and thread 141 5297 652 Cotton fabrics woven 438 4881 657 Floorcoverings tapestry etc 041 2986
66 Non metal mineral manufactures 110 8027 664-5 Glass and glassware 010 2682 667 Pearls precious and semi precious stones 063 16681
67 Iron and steel products 107 13889 673 Iron and steel shapes 036 9259 674 Iron and steel universals plates sheets 025 17618 678 Iron and steel tubes pipes etc 018 12802
68 Non ferrous metals 449 4950 684 Aluminum 010 7169 687 Tin 429 4874
69 Metal Products nes 093 2669 695 Tools 004 3038 696 Cutlery 007 20298
71 Machinery non electric 095 2647 711 Power machinery non electric 020 4657 715 Metal working machinery 003 6400
72 Electrical machinery 130 10064 723 Electrical distributing machinery 006 4267 724 Telecommunication equipment 055 24230 729 Electrical machinery nes 045 5440
812 Plumbing heating and lighting equipment 0301 5133
831 Travel goods handbags 0131 3885
841 Clothing 539 7050
851 Footwear 072 5320
861 Instruments and apparatus 0121 4482 89 Miscellaneous manufactured goods nes 354 8052 892 Printed matter 028 3318 893 Articles of plastic 024 11654 894 Toys and sporting goods 108 12341 896 Works of art etc 013 6475 897 Gold silverware and jewelry 015 4686
Source Calculated from United Nations Commodity Trade Statistics 1965 United Nations Foreign Trade Statistics of Asia and the Far East 1962 and United Nations Yearbook of International Trade Statisshytics 1965
1India not included
37
B - Export Patterns and Trends of Comparative Advantage
The need of Asian countries for sustained export expansion has been much emphasized in recent years These countries have in general experienced slow growth compared to their import and servicing-of-loans requirements As means of meeting the need regional cooperation and integration have been proposed as possible courses of action
But although the export growth of the region has been slow differences in performance among the countries are considerable Differences in export performance would affect the outcome of any preferential scheme that might be adopted and also the willingness of the countries to integrate or to move toward economic integration
This section examines the export performance and the trends of comshypetitiveness of individual Southeast Asian countries Problems of transport costs are treated in C Some implications for regional cooperation are drawn in this section a fuller analysis is given later on An analysis of the accuracy of Asian trade and income statistics on which we must rely throughshyout are presented in III below
This section is divided into
1-Asian performance in world trade 2- Trade with more developed countries (MDCs)
3- Intra-regional trade 1-Asian Performance inWorld Trade
Exports of less developed Asia have grown slowly compared to those of most other world regions (Table 8 ) Its exports to within the region have fallen somewhat (from 29 between 1955-56 and 1965-66) at the same time its exports to more developed countries have remained about stable Asias exports to high income countries are a much larger share of its total exports than its exports to any other region But all the other less developed regions export to high income countries a higher proportion of their total exports than does Asia
In two respects less developed Asia is unique among the worlds lower income regions All the other less developed countries export to the more developed countries (MDCs) a higher proportion of their total exports than does Asia (60 recently) Also Asia has a much larger share of its trade flow to within the region (25 recently) than does any other LDC region
TABLE 8
Export Directions by Regions
A-Less Developed
Asia Exports Less Latin Less Less
Developed America Developed Developed Middle
East More
Developed All
The
Exports of less developed Countries Asia Africa Countries World
Asia to the indicated regions (in $s million FOB) 1955-56 $2535 $140 $2020 $190 $143 $4020 $6870
1965-66 3080 116 2345 308 240 5690 9520
Share of total exports from less developed Asia going to the indicated regions (in ) 1955-56 37 2 29 3 2 59 1007
1965-66 32 12 25 3 3 60 100
B-Exports from the Regions Listed
Exports to more developed countries from the indicated 1938 72 80 7(r 84 68 69 region (in of total exports 1955-56 72 79 59 82 68 67 of the region) 1965-66 72 73 60 80 74 75
Exports to within the same 1938 22 6 1 6 14 69 region (as of total exports 1955-56 24 9 6729 10 13 of each region) 1965-66 21 10 25 7 6 75
C-Exports of the indicated 1938 25 7 5 4 2 41 100Region as of total 1955-56 24 8 7 5 3 65World Exports 1965-66 18 6
100 5 4 3 69 100
Definitions and coverage make 1938 figures not strictly comparable with later data Part of the table is notcarried back to 1938 because of lack of comparability All percentages are rounded to the nearest whole percent We estimate that the accuracy of the data does not warrant putting down fractions of a per cent
Sources United Nations Yearbook nf International Trade Statistics 1966 pp 20-31 op cit 1962 various pages
39
The lagging growth of the regions exports slower than that of Africa and the Middle East is usually explained by the extremely high concentrashytion of exports of traditional primary products combined with a progressively smaller export surplus of food and raw materials Primary commodities (SITC 0 through 4) are three-fourths of the regions total exports We will examine data relevant to this usual explanation below
2- Exports to More Developed Countries
The regions share of total world exports has been falling (7 in 1956shy57 and 5 in 1965-66) But the share of its total exports going to MDCs appears not to have changed greatly the share was 60 in 1965-66 and seems to have been only moderately higher before World War II
The share varies widely for individual countries ranging in 1965 from 95 for the Philippines to 46 for Thailand and 31 for Burma
In evaluating the pattern of individual countries we analyze the extent to which export growth has been affected by two interrelated factors
(1) the compositional effect showing the changing proportion ofworld exports consisting of goods exported by a given regional country
and (2) the competitive effect denoting the changing proportion of world exports of a given commodity that the country provides
To find quantitative values for these effects the hypothetical export growth (h) of a given Asian country (J) is first computed This growth is based on the assumption that the country is able to maintain the same share in each commodity for each export market in the second period as in the first In notational form Js hypothetical export growth (HJ) is as follows
c
Hj =
c i xji where X refers to Js exports to another country i and Mi to is total imports Superscript c indicates the commodity and 1 and 2 refer to periods
The competitive effect ismeasured as the actual export growth (A)of the country minus its hypothetical growth (H) The compositional effect isdefined as H minus D which is the weighted average import growth of its trading partshyners The sum of these effects (A - -H + H D) is the difference between growth rate of the countrys exports and its partners imports (A - D)
40
In computing these effects with respect to the MDCs two periods have been selected Period I (1956 and 1957) and Period II (1964 and 1965) In
each period the average of the two years is used to minimize the yearly
fluctuation of trade values The country-by-coumodity trade data on Asian countries are not readily available especially for the earlier period
(except Malaya-Singapore) To overcome the scarcity-of-data problem the export patterns of Asian countries are approximated from the import data of
their trading partners
The growth rate of the regions as well as individual countries exports to the selected MDCs in terms of the compositional and competitive effects
is given in Table 91 As shown in the last row the region has labged for both composition ind competitive reasons Exports grew only 28 while
total imports of the MDCs rose by 76 from 1956-57 to 1964-65 -- a lag
of 482
The low growth rate for exports of the region is partly due to regional concentration on primary products that have been expanding slowly in the world market This negative compositional effect is not surprising The emphasis
on and effort in Asian countries toward export diversification and toward industrialization is partly a reaction to slowly growing world markets for
primary products
The remainder of the export lag the (negative) competitive effect of 16 or one-third the total export lag of -48 (A-D) is unexpectedly large Even when the unfavorable compositional effect is taken into account the position of the regions exports in various commodities vis-a-vis other world
exporters has declined
l1n computing these effects SITC Group r (Unclassified Goods) ia
excluded The group makes up an almost neglIgible proportion of total exports
2Also see Seiji Nayas Project Research Paper The Commodity Pattern and Export Performance of Developing Asian Countries to the Developed Areaspublished in Economic Development and Cultural Change (July 1967) in which the regions but not individual countries exports to various developed countries are analyzed employing the same method used here with 1962-63 as the terminal period
Table 9 The Compositional and Competitive Effects of Exports to More Developed Countries
by Asian Countries Averages of 1956-57 and 1964-65
Country Exports(in $1000) Growth of Exports Competitive() CompositionalEffect (Z) Difference inEffect (Z)1956-57 Growth ( )1964-65 Actual(A) Hypothetical(H) (A-H) (H-D) (A-D)Burma 67617 63284 -64 793 -857 35 -822 Ceylon 194219 215434 109 265 -156 -493 -649 India 914833 1060360 159 436 -277 -322 -599 Indonesia 592632 590476 - 3 385 -387 -374 -761 Pakistan 266064 244609 -81 315 -396 -443 -839 Philippines 461731 750468 626 408 219 -350 -132 Taiwan 72097 274361 2805 1835 970 1077 2047 Thailand 152747 277069 814 368 446 -391 56
TOTAL 2721940 3477059 277 438 -161 -320 -481
Average growth of more developed countries imports (D) is 7581
42
Within this over-all picture of the region considerable variation exists
in the performance of individual countries Striking differences are revealed
the increase in exports of Taiwan(281) Thailand (81) and the Philippines
(63) is outstandingly high compared with that of other countries some of
whose export values fell absolutely (Indonesia -028 Burma -6 Pakistan-8)
A negative compositional effect is common to most countries considered
reflecting unfavorable commodity shifts in MDC markets for these countries
goods (Taiwan is the main exception)1
But there is a distinctive difference in competitive effects The
countries with fast-rising exports (Taiwan Thailand and the Philippines)
show positive competitive effects Countries with relatively stagnant exports
(Burma Ceylon Pakistan Indonesia and India) show negative effects Furthershy
more the relative sizes of the negative competitive effects (as well as unshy
favorable compositional effects) that have hindered export expansion are large
in some cases more than or close to one-half the total lag (A-D) However
the Philippines was able to offset her unfavorable compositional change conshy
siderably and Thailand more than sufficiently What is implied in Table 11
then is the importance of the competitive effect in influencing relative
export performance
1The country-by-commodity trade data for Malaya and Singapore are most ready available since these countries were the only reporting developingAsian countries in Commodity Trade Statistics until the latter part of the 1950s But they are excluded in Tables 11 and 12 and Appendix Table 17 since the trade data for these two countries are reported together for early years but separately for recent years other reporting countries (MDCs) do not consistently use the same definitiofi of these countries from year to year there are large reporting differences especially in Singapores trade figures probably because of its entrepot trade See Seiji Naya and Theodore Morgans project research paper The Accuracy of International Trade Data The Case of Southeast Asian Countries Journal of the American Statistical Association July 1969
The results based on combined figures for these two countries and which should be interpreted cautiously for the above reasons are as follows 919 (A) 4381 (H) -3661 (A-H) -3001 (H-D) and -4807 (A-D) Comparable results on the intra-regional trade pattern for the two countries are given separately in Table 16
43
In order to determine which commodity groups are responsible for this effect the same computation was made for each comnodity group The results are given in Table 10 together with the commodity composition of exports1
The differences again are striking For Thailand the Philippines and Taiwan positive competitive effects are shown in a relatively large number of comshymodity groups The reverse is true for the other countries although numershyical values differ from commodity to commodity and country to country Furthershy
more in relating Tables 9 and 10 the negative (or positive) competitive effect of a countrys exports (Table 9 ) is shown to be largely due to the negative (or positive) values in primary products especially those that comprise a relatively large proportion of total exports (SITC Groups 0 and 2) That is given the slow expansion of these products in MDC markets the lag in export growth of many Asian countries can be attributed to their inability to maintain even this low growth rate of primary exports
Changes in commodity compositions and export increases by two broad categories primary and manufactured are shown in Table 10 together with total exports of Thailand the Philippines and Taiwan The experience of these countries stands in clear contrast to stagnation for the other countries The commonly held view that countries with high concentrations in primary exports perform poorly is not supported Thailand and the Philippines have done remarkably well and they have a high degree of specialization in primary
exports
1The hypothetical export growth for a given commodity used for this purpose is computed from the formula (page 39)
2The sluggish expansion of primary products inMDC markets (comparedto manufactured products) is reflected in low hypothetical increases (H) ofthese exports Numerical values of the increases for individual commodity groups are not shown in Table 10 They can be found by subtracting competshyitive effect from actual growth A - (A-H) - H
3Examinations of the three-digit commodity exports reveals that these two countries have been able to diversify within primary commodities therebyoff setting the decline of some traditional primary exports by increases ofothers (eg maize and kenaf in the case of Thailand lumber and minerals in the case of the Philippines)
Table 10
The Composition and Competitive Effect of Exports of Asian Countries by Commodity Groups
Averages of 1956-57 (I) and 1964-65 (I1) In PercentagesC - Commodity Composition of Exports
A = Actual Growth of Exports A-H = Competitive Effect
Burma Ceylon India
SITC1 C(I) C(nI) A A-H C(I) C(II) A A-H C(I) C(II) A A-H
0 673 510 -292 -1324 781 798 132 -155 326- 3081 0 0 99 1300 - 206 0 0 02 295 0 25 25 143 -150416 321 85 164 1513 20 -162 320 259 - 607 -46411 426 32 2 0 0 -402 74 4 -374 -8500 0 0 1 39 37 39 200 39 55 -845 -9060 0 0 -2000 6 6 142 -9586 23 60 8 9 217 -12521469 535 8 216 -758 2647 2 4 1300 911 7 374 646 -1191 1 2045 -215 2 68 1986 -1800 0 0 -2900 1 0 0 -3301 10 10 161 -3006
Primary 975 936 -102 986 985 108 716 602 -26(0-4)Manufactured 25 64 1411 14 15 213 284 398 626
(5-8)
TOTAL2 1000 1000 - 64 1000 1000 109 1000 1000 159
Table 10 continued
C Commodity Composition of Exports A = Actual Growth of Exports
A-H - Competitive Effect
SITC1
C(I) Indonesia
C(II) A A-H C(I) Pakistan C(II) A A-H C(I)
Philippines
C(II) A A-i
0 1 2 3 4 5 6 7
8
127 44
553 207 49
6 14 1
0
150 22
393 378 43
9
5
0
0
174 -486 -291 822
-136 520
-623 -494
387
-581 -602 -555 347
-338 -1194 -1891 -2622
-2877
55 1
890 0 0 2
41 3
9
51 0
699 1 0 2
221 8
19
-147 0
-279 +
0 - 53 3928 1241
2918
-430 -618 -541 +
- 19 -1524 3185 - 701
- 234
294 6
600 0
47 3
11 0
39
273 16
541 0
76 2
49 0
43
510 3351 465
+ 1621 435 6398
0
793
304 2505
81 +
1445 513
5761 -2285
-1604
Primary 980 986 3 945 750 -270 948 906 555 (0-4)
Manufactured 20 15 -292 55 250 3199 53 94 1915 (5-8)
TOTAL2 1000 1000 - 3 1000 1000 - 81 1000 1000 626
CONTINUED
TABLE Io continued
=C Comodity Composition of Exports A = Actual Growth of Exports
A-H - Competitive Effect
Taiwan Thailand SITC C(I) C(II) A A-H C(I) C(II) A A-H
0 778 678 2317 303 232 424 2324 1315 1 0 3 + + 8 13 2072 1735 2 110 81 1800 722 751 515 244 88 3 9 2 -307 -1169 0 0 + + 4 1 1 1724 1333 0 0 0 0 5 70 31 653 - 685 3 5 2055 898 6 18 124 25057 24228 5 39 14026 13177 7 0 11 + + 1 0 40 -2488 8 15 71 17002 14738 2 4 2852 59
Primary 897 763 2240 990 953 745 (0-4)
Manufactured 103 237 7701 10 48 7699
TOTAL2 1000 1000 2805 1000 1000 814
1SITC Commodity Groups 0 (Food and Live Animals) 1 ( Beverages and Tobacco) 2 (Crude Materials excluding Fuels) 3(Mineral Fuels etc) 4 (Animal and Vegetable Oils and Fats) 5 (Chemicals 6 (Basic Manufactures) 7(Machines and Transport Equipment) 8 (Miscellaneous Manufactures)
2Total may not add up to 10000 due to rounding For dollar values of exports see Table 2
- denotes positive actual growth of exports and competitive effect (no exports in Period I but positive exports in Period II)
47
In contrast to the varied performances of primary exports the rapid rise in exports of manufactures common to almost all countries is very encouraging (A notable exception is Indonesia with an absolute decline of 29 which is however understandable in view of the countrys political difficulties during the period covered) Some groups of manufactured goods have grown at rates even higher than the relevant import growth of the MDCs indicating positive competitive effects It is worth noting that those countries with expanding primary products tend to perform better in manufactured exports as well
Examination of commodity detail shows that much of manufactured exports are suitable to the factor endowments of this region Among these are textile products footwear plywood and leather These exports have expanded rapidly despite high import protection (especially high effective rates of protectshyion) generally accorded by MDCs on commodities of this type
3- Intra-Rexional Trade
Intra-regional trade (which is strikingly larger than that of other LDC regions) is analyzed here although the record is handicapped by lack of availability of adequate data
The share of intra-Asian trade of the individual countries varies widely ranging from 79 for Laos to 57 for Singapore and 50 for Burma to 6 for Ceylon and 4 for the Philippines (in 196465 Table 11) Most countries show a decline in this trade evident in the Lowered shares from 1956-57 to 1964-65 The large absolute decline of intra-regional shares for Hon- Kong and Indonesia stands out Deviating from this trend are Pakisttn Korea and the Philippines who have had rapid increases in their intra-regional
trade shares
Of course using intra-regional trade shares alone can be misleading A share may be kept fairly constant simply as a reflection of low growth of both total and regional exports as for Burma Or a share may fall at the same time regional trade rises rapidly ie exports to the rest of the world grow faster than intra-regional trade as for Taiwan Cambodia and Thailand The latter pattern is more encouraging than the former
The close association of the relative expansion of intra-regional exports with the export growth to the HDCs is interesting Intra-regional export growth rates for Burma and Indonesia(India also) are extremely low compared with those for the Philippines Taiwan and Thailand That is the latter
48
Table 11 Export Growth and Shares of Intra-Regional Exports Averages of 1956-57
and 1964-65
Country Total Exports (millions ofdollars)
Intra-Regional Ex-ports as of total
Percent Change in Value of
Total Intra-Regional
1956-57 1964-65 1956-57 1964-65 Exports Exports
Burma 2398 2315 518 505 -35 -60 Cambodia 445 965 358 316 1171 915 Ceylon 3587 4015 55 58 119 179 Hong Kong 5461 10775 510 220 973 -148 India 13252 17155 110 97 295 133 Indonesia 9257 6830 332 105 -262 -766 Korea 234 1470 137 234 5282 10734 Laos 12 12 833 792 0 -50 Pakistan 3493 5105 52 198 411 538 Philippines 4355 7545 26 37 732 1451 Taiwan 1333 4415 332 289 2312 1885 Thailand 3495 6100 542 466 745 501 Vietnam 628 420 134 151 -331 -244 Malaya 7260 9610 na 270 324 na Singapore 11285 9434 na 571 -164 na
Sources Data are taken from Direction of Trade for 1956 and 1957 and Direction of Trade A Supplement to International FinancialStatistics for 1964-65 except data for Malaya and Singaporewhich are taken from Yearbook of International Statistics for 1964-65
Note na means not available
49
countries perform well in export markets of both the MDCs and the regionand consequently in total exports the reverse is true for the former countries
Pakistan offers a contrast intra-regional and total exports have grownfast compared to its sluggish exports to MDCs indicating a directional changetowards intra-regional trade
A pronounced directional change away from intra-regional trade (thereverse of Pakistans) is clear for Hong Kong (Table 11) Its total exportsincreased 97 in contrast to the fall of its intra-regional exports by 15 from 1956-57 to 1964-65
The export and import commodity composition and shares of intra-regionaltrade are given together with the total trade of the region in Tables 12 andfor the years 1962 and 196515 Both tables show a considerable differencebetween the compostion of total trade and that of intra-regional trade
Intra-regional exports lean towards manufactured products more than do totalexports (Table 12) a surprisingly large proportion of total manufacturedproducts about 50 go to other countries of the region ( Of course theintra-regional trade share of manufactured products comprises only a small proportion of total imports of manufactures)
Primary commodities make up the largest share of both intra-regionalexports and intra-regional imports 63 and 73 respectively in 1965 Butrelatively small shares of total exports and imports of these primary productsgo to and come from regional countries (24 and 38 respectively in 1965)1
Although not shown here considerable differences exist in the tradecompositon for individual countries The intra-regicnal exports of CambodiaCeylon the Philippines and Thailand (also Burma Indonesia) are relativelyconcentrated in primary products Exports of Malaya Singapore Pakistanand Taiwan (also India and Hong Kong) are less concentrated2
1The pattern varies from commodity to commoditypattern is food trade One example of thisthere are considerable net imports for the regionsas a whole yet more than one-third of rice exports go outside the region
2The countries given in parentheses are not included in Tables14 and15 For Burma India and Pakistan 1965 trade data are not availableHong Kong is excluded because of its typical export structure (primarygoods are less than one-tenth its total exports in 1965)
50
Table 12
Commodity Composition of Total and Intra-Regional Expors of Selected Asian Countries 1962 and 1965
SITC Comnodity Groups Commodity Composition Intra-regional 2 ExportsCode
Total Intra-regional2 ( of Total) 1962 19653 1962 19653 1962 1965
0 Food amp Live Animals 260 281 280 279 326 287
1 Beverages amp Tobacco 9 8 8 5 279 166
2 Crude Materials excl Fuels 449 391 233 235 157 175
3 Mineral Fuels etc 50 47 92 91 557 568
4 Animals amp Veg Oils amp Fats 24 31 21 20 262 180
5 Chemicals 15 17 38 46 780 783
6 Basic Manufactures 131 159 165 169 381 308
7 Machines amp Transport Equipment 33 31 102 95 921 887
8 Misc Manufactured Goods 17 24 38 39 673 484
9 Unclassified Goods 11 11 23 22 606 571
0- 4 793 758 635 629 242 241
5 - 8 196 231 343 373 528 439
Total in 1000 1000 1000 1000 305 292
in $1000000 4011748249 1213114001
Source United Nations Commodity Trade Statistics various issues of 1962 and 1965
NotesN Countries included are the Philippines Singapore Thailand Taiwan Cambodia Ceylon Malaya and Pakistan
2 Intra-regional trade refers to exports of these above countries to countries listed under Other Asia in Commodity Trade Statistics
3 For the Philippines only 1964 figures are used
51
Table 13 Comuodity Composition of Total and Intra-regional Imports of Selected
Asian Countries 1962 and 1965
Commodity Composition Intra-regional
Code Commodity Groups Imports Total intraregiona 2 s Of tot)
1962 19653 1962 19653 1962 1965 0 Food amp Live Animals 164 165 239 281 4021 Beverages amp Tobacco
332 13 12 8 6 160 1032 Crude Materials excl Fuels 137 99 374 297 757 582
3 Minerals Fuels etc 103 83 163 121 4394 Animal amp Veg Oils amp Fats 284
14 15 14 23 276 2875 Chemicals
78 87 26 31 93 706 Basic Manufactures 204 209 88 131 120 1227 Machines amp Transport Equip 227 265 24 36 29 278 Misc Manufactured Goods 46 46 46 51 272 2169 Unclassified Goods 14 18 19 24 389 241
0 -4 431 374 797 728 522 3795 -8 556 608 184 250 91 80
Total in 1000 1000 1000 1000 287 195 in $1000000 4739 0 57966 13106 11204
Source United Nations Commodity Trade Statistics various issues of1962 and 1965
Notes 1 Countries included are the Philippines Singapore ThailandTaiwan Cambodia Ceylon Malaya and Pakistan2 Intra-regional imports are imports from those countries listedunder Other Asia in Commodity Trade Statistics3 For the Philippines only 1964 figures are used
52
The period from 1962 to 1965 is short Nonetheless the intra-regional
trade pattern points to a trend of declining intra-regional trade and to
relatively fast-rising manufactures and stagnant primary products In order
to better analyze intra-regional trade the export performance of individual
countries is discussed here with respect to the two effects competitive and 1compositional The results are summarized in Table 14 (The computational
method employed for this table is the same as that for Table 9 with the
growth rate of total imports of Asia S corresponding to D in Table 9)
The intra-regional export perforimances of Burma Indonesia India Hong
Kong and Singapore are extremely poor in comparison with those of Pakistan
the Philippines Korea Taiwan and Thailand A few qualifications are
however in order Because of the short period for which we have data the
results shown may be due to random fluctuations rather than to trends though
the results conform very closely to those for the longer period of Table 11
The results are also generally similar to those shown for these countries
traue with MDCs in Table 9
The different competitive effects provide implications for intra-regional
trade The countries performing poorly in intra-regional trade are generally
those with negative competitive effects (eg Burma India Indonesia Hong
Kong but not Singapore) Furthermore the negative competitive effects far
exceed the positive compositional effects In contrast the countries that
have been expanding their regional exports (Taiwan Korea the Philippines
Pakistan Thailand and Malaya) have positive competitive effects For Malaya
Pakistan and Thailand negative compositional effects have been more than
offset by positive competitive effects
The comodity breakdown of individual countries indicates that the positive
(or negative) competitive effects are due in large measure to the relative exshy
pansion (or decline) of intra-regional primary exports Furthermore as indishy
cated in Table 13 the intra-regional imports of primary goods declined absolutely
while total imports of these goods were rising The decline of the intrashy
regional primary trade of a few countries had a large dampening effect on total
intra-regional trade
IAs an example figures given for India are for the actual and hypothetical
growth of exports from India to Asia
53
Table 14
Competitive and Compositional Effects of Intra-Asian Trade by Country 1962-65 (in percentages)
Country Growth Rate of Growth Competi- Compo Differ-C yt es tive sitional ences in Export to Asia hsa EffectEffect Growth Rates
AsnActual Hypothe- Countries (A) tical (H) (S) (A-H) (H-S) (A-S)
Burma -439 58 125 -497 - 67 -564 Hong Kong 5 173 177 -168 - 1 -169 India -101 75 174 -176 98 -274 Indonesia -825 - 55 281 -770 -1106-336
Korea 2204 154 103257 1947 2050
Malaya 257 -163 64 420 -227 193 Singapore 157 52 281 106 -229 -124
Pakistan 1275 29 122 1246 - 93 1153 Philippines 1130 768 205 563362 925
Taiwan 702 125 62187 515 577 Thailand 197 142 -185-44 241 55
Notes Data are taken from United Nations Commodity Trade Statistics various
issues of 1962 and 1965 All figures listed are based on import of Asian countries which include
(1) Ceylon (2) Cambodia (3) Malaya (4) Singapore (5) Pakistan (6)Taiwan and (7)Thailand Asian countries which in some cases do not clearly break down imports from particular countries by SITC one-digit codes are excluded for the listed countries concerned The following gives (inparentheses) those Asian countries considered for each of the listed countries
Burma (1 3 4 5 7 above) Malaya (1 2 4 5 6 7)Hong Kong (1 3 4 5 6 7) Singapore (1 2 3 5 6 7)India (1 through 7) Pakistan (1 2 3 4 5 6 7)Indonesia (1 2 3 5 6 7) Philippines (3 4 5 6 7)Korea (3 4 6 7) Thailand (1 3 4 5 6)
54 The negative compositional effects shown for many countries suggest that
Some intra-regional trade decline is due to the small proportion of manufactured goods exports set against the large import requirements of thosm products by countries of the region This trade-reducing effect is likely to continue in the future at a declining rate since most regional counties have been expandshying their manufactured goods exports rapidly
The trend is significant because it is to these very fields that importsubstitution policies are directed and so high protection is accorded The strength of comparative advantage in manufactured goods for the regional counshytries is much greater than it is generally diagnosed And in time a tendency toward more economic cooperation among the countries of the region may facilishytate the exchange of manufactured goods1
The pattern of Asian country exports to MDCs and to their intra-regional neighbors is similar We have not found any significant association between the high concentration of countries such as the Philippines and Thailand and the stagnant performance of other countries such as Burma Indonesia and India A shift increasing the share of manufactured exports is taking placeand should be encouraged to offset the relative stagnation of primary exports The latter has probably been caused in part by heavy industrialization programspursued by many countries in the region tending to divert resources away from production of primary commodities and to push aside the difficult but necessary problems of improving the agricultural sector
The material above has been mainly based on descriptive trade data Ascertaining why these Asian countries perform as differently as they do is another range of inquiry But it is likely that more favorable export pershyformances are largely due to the relatively outward looking economic and
IA greater exchange of commodities especially manufactured goods isentral to the existing and proposed plans for economic cooperation among Asiancountries although progress in this direction so far seems more apparent thanreal --see Theodore Morgan and Nyle Spoelstra eds Economic Interdependencein Southeast Asia (Madison University of Wisconsin Press)
55
trade policies of certain countries (eg Thailand the Philippines Taiwan)and poorer performances tc_the inward looking policies of other countries (eg Burma Ceylon India) In the former countries economic planning is generally adopted to maintain the framework in which economic activilies arepursued by individuals and private firms with a minimum of government intershyvention in the latter countries economic activities are more directly conshytrolled by government
Import substitution policies have in various forms been common to all these countries But outward-looking countries have been more selective in the application of the policy than inward-looking countries Outwardshylooking countries have also exhibited greater concern for economic efficiencyand a tendency toward de-control (ie away from exchange and import control as in the Philippines and Korea in recent years) In Taiwan for a product to be eligible for the import control list the domestic producer has had to show that his factory cost would not be more than 15 above the cif import priceof a similar product 2 Variations in export performance seem in part to be explained by built-in-bias against exports in large-scale import substitution3 programs
1Cf Hla Myint The Inward and Outward Looking Countries of SoutheastAsia and the Economic Future of the Region Research paper 7 February 1966K C Sen The Inward-Looking and Outward-Looking in Southeast Asia Projectpaper of January 1965 Cf also Barend A DeVries The Export Experience ofDeveloping Countries World Bank Staff Occasional Papers 3 InternationalBank for Reconstruction and Development 1967 esp pp 11-15 60-63 43-47 2IMF Annual Report on Exchange Restrictions 19643It is interesting to note that even some of the strong advocates ofprotection have recently expressed considerable disenchantment with the disshytorting effects of excessive protection Mr Raul Prebisch for examplecautions that customs protection has been indulged in excessively and bylimiting competition from abroad has frequently given rise to internal reshystrictive practices or monopolistic combines that weaken the incentive toobtain satisfactory levels of productivity (Raul Prebisch SurmountingObstacles to a Latin American Common Market pp 141-142 in MS Wiconezeked Latin American Economic Integration Frederick A Praeger Inc 1966)
------------------------------------------------------------------------------------------------
Table 15
THE COMPOSITIONAL AND COMPETITIVE EFFECTS OF LESS DEVELOPED ASIAS EXPORT TO MORE DEVELOPED AREAS 1956-57 to 1964-65
(in percentages)
Growth Rate of Actual Growth Southeast Asias Rate of Developed
Developed Countries
Exports to the Developed Areas
Areas Total Imports
Composi-tional Effects
Compe-titive Effects
Differenre in Growth Rates
Actual Hyposhythetical
(A) (H) (D) (H-D) (A-H) (A-D)
US 2913 2494 5633 -3139 419 -2720 UK 603 1852 4100 -2248 -2455 -4703 EEC 2038 4439 9532 -5093 -2401 -7494 Japan 8672 9344 11427 -2083 - 672 -2755 Australia 3271 7494 8519 -1025 -4223 -5248
TOTAL 2774 4381 7581 -3200 -1607 -4807
--
57
C- Cutting transportation costs
Transportation costs like administrative blocks to the movement of goods reduce the potential gains from regional specialization Goods that are relashytively heavy and bulky compared to their value -- which are most goods moving across national boundaries in Southeast Asia -- move by water Is there much room for reducing the costs of ocean transportation in the region
Water transportation costs can be divided into tjo types The first is the expenditures most governments make in providing for waterway and port facilities These costs are indirect as far as the ship owner is concerned The second type is the costs incurred by the carriers directly This cost category consists of two components the capital costs of acquiring equipment and operating costs Permanently reduced freight rates are primarily dependent
on lower costs of operation
Most of the operating costs are port costs Sixty to seventy percent of the cost of transporting cargo at sea is accounted for by what takes place while the ship is at the dock and not by steaming time 1 From the frequent surcharges imposed on shipments to and from Southeast Asia it seems highly probable that a figure near the upper limit is relevant to that area For example a recent study found that delays that could be controlled or avoided
waiting time for pilots tugs barges berths stores and clearance of customs papers --were responsible for more lost time than unavoidable delays such as those due to adverse weather and tides2 There appears to be much scope for improvement
Insurance for the ship and crew is to some extent affected by the degree of congestion of the ports the ships call at and a country can lower the insurance premium paid by the carriers through port improvements Although this part of cost reduction is small compared to other cost reductions achieveable through port improvements from the shipowners viewpoint there may be implication in vigorous action here of other government action to lower port costF that are likely to have a greater final effect on the carriers
costs structies
1DC MacMillan and TB Westfall Competitive General Cargo Ships
(Society of Naval Architects and Marine Engineers November 1960) p2
2NewYork Times (February 21 1965) reviewing a study by the Socony
Oil Company
58 Measures to lower operating costs can also be taken by ship owners
The scope for government action is wider than that for the carriers But there is close relationship between actions taken by the two parties a change by one will have repercussions on the other For example technoshylogical innovations in shipping equipment that require facilities other than those currently available in ports will encourage installation of such facilshyities or else the innovation will not be generally adopted
There is no unique cause-effect relationship between port improvementand carrier innovation However a good case can be made for the portsbeing the major causal factor Ports require huge long-term investments At the time that investment is made the port facilities are adapted to the existing or immediately foreseeable shipping technology The ships on the other hand while requiring large capital investments and having a life of twenty to thirty years are relative to ports short-term investments A ship owner who builds a new ship adapts his ships design to the expected ports
Another means of reducing operating costs is the introduction of largerand more efficient equipment by shipowners This policy is generally limited at present to tanker operations Possible cost reductions are large a tanker of say 65000 tons can operate profitably at rates that would drive a 20000 ton tanker into bankruptcy But tankers cannot carry dry cargoand a dry-cargo ship requires dock space and depth Unless the major portsof the world undertake dredging and enlarge berths dry-cargo ships as large as the modern tankers will be restricted to a very few ports
Innovation by carriers in the field of cargo stowage appears to be thebest cost reducing action they can take Increased use of pallets and conshytainers has been the most important development in this area
Pallets and containers reduce cargo handling and make possible the useof smaller gangs It has been estimated that the use of containers can cut terminal costs by fifty percent on the average and that US ship operatorsin coastwise trade have reduced this costs to one third of the costs faced in the break-bulk system used previously1 An additional advantage of conshytainers is the protection they give against pilfering and rough handlingSuch losses are greater where labor is unskilled and illiterate The gainsin this respect would be particularly great in LDCs
ISee Times (London) January 3-4 1962 quoted in JL Eyre The UnhappyMarriage paper delivered at the American University School of BusinessAdministration (Washington DC May 22 1963) p 5
59
Despite the advantages of using pallets and containers their rate of adoption has been slow Income is lost by many of the participants in marishytime transportation services stevedores forwarders truckers and the port authority Customs procedures are insufficiently flexible for container shipments since ordinary procedures require inspection at the pier rather than at ultimate destinati n A further problem is the balancing of inward and outward use by individual carriers container pools such as those found in Europ can reduce this potential cost
In addition to institutional blocks and delays the use of containers in Southeast Asia has been hampered by the costs of acquiring containers redesigning stowage space and the heavy port installations required Further internal transportation facilities to move the containers are inadequate in most countries of the region In consequence the region is only in the early stages of considering pallet and container port facilities Increased capashycity of ships and quicker turn-around time in more efficient ports like Singapore and Hong Kong seem to be compensating for the extra some five days required now that Suez is closed to sail around the Cape of Good Hope The sharply competitive tramp-shipping trade is expanding
The issues of containerization are therefore being uncertainly antishycipated and faced Hong Kong is cautious Colombo has already one container berth Singapore has built one wharf for bulk cargo There is general rather rapid expansion in port tonnages handled with sharp decline during the past several years in Burma a sharp exception to the trend1
In summary reduced port congestion and innovation in cargo stowage and handling appear to be promising avenues to lower operating costs and hence lower freight rates The scope for governmental action here is wide Futhermore regional cooperation in developing more efficient ports and providing the facilities for containers and container pools on a common standard could bear considerable fruit In these ways the countries of Southshyeast Asia can benefit from a reduced freight bill on their trade both intrashyregionally and with the rest of the world
1Some data on recent shipping volume policies and problems are givenin Far Eastern Review Oct 31 1968
60
D- Asian commercial policies and the possibilities of expanding regional trade
1 Introduction
Tariffs and quantitative restrictions restrict international tradeand administrative practices can do so This section seeks to ascertain the Asian countries that are most likely to cooperate toward expanding their trade by changing their conercial policies To make such a selection we must have a set of criteria in mind for predicting the most likely candidates for
cooperation
In part 2 we examine some recent theoretical contributions on commercial policy bargaining and customs union formation First to be considered is the orthodox approach developed by Viner and extended by Lipsey Meade and Vanek which focuses on the effects of a customs union on welfare derived from personal consumption A second approach to the problem developed by Johnson Copper and Massel will then be presented It defines welfare more broadly to include a collective preference for industrial production Finally the view of trade expansion problems of the developing countries themselves expressed in the UNCTAD document Trade Expansion and Economic Co-operation among Developing Countries will be presented as evidence for emphasizing the selection criteria implied by the second approach
In part 3 of this section the status of quantitative restrictions in nine Asian countries are examined and recent trends defined Part 3 will
- examine tariff schedules primarily of the countries that make the least use of quantitative restrictions Quantitative restrictions are usually more important in checking and blocking trade flows than are tariffs Hence there is considerable presumption that countries making the least use of quantitashytive checks on trade (the most use of tariffs) are the most likely candidates for regional cooperation to facilitate trade flows
2 Theory
(a) The potential gains from freer trade are well known They are assuming unrealistically no influence on the rate of change of technology
skills and organization
61
i - increased specialization according to (even assuming unchanged averagecosts) comparative efficiency
ii - increased realization of economies of scale andiii shy increased efficiency through more specialization among the resources
used -- labor and other resources
If countries have different factor endowments (which includes the subtleshyties of skill and organization differences) and hence different relative cost structures each country can raise its real income through fuller participation in international trade By specializing in the products that can be produced domestically relatively most cheaply and trading a part of these products for other products produced relatively most cheaply by othercountries each country can transform its given factor endowment into a greater quantity of output than it could otherwise
Economies of scale can be achieved by expanding the size of the market Domestic markets especially in LDCs may not be large enough to permit existshying firms to take advantage of the fact that costs can decline as output inshycreases or to permit the building of new plants whose scale is optimal in the sense that they have the lowest possible unit costs
External economies may also be realized by expansion of the market The expansion of one firm in an expanding market can induce the expansion of others if the expanding firm either produces more cheaply an input for other firms or provides a market for the output of the other firms Other external economies such as increased diffusion of technical knowledge and organizational ability can result from non-market inter-action among industshyries To the extent that commercial policies especially administrative practices are applied arbitrarily or on an ad hoc basis the freeing of trade can produce external economies by reducing the risk and uncertainty of international transactions
Where commercial policies protect inefficient firms an increase in competition brought about by freer trade forces a more efficient allocation of resources in all trading countries Increased efficiency may also result from the increased specialization of labor that freer trade makes possible
62Having briefly described the gains that can result from a reduction intrade barriers we move to a discussion of the methods countries can use to
bring about a reduction in barriers to trade The most obvious method for reducing trade barriers is for a countryunilaterally to remove its restrictions on foreign products Governments
are often reluctant to take such steps because they fear that they will losetheir bargaining power in future attempts to induce other countries to lowertheir barriers Or if restrictive commercial practices were originallyinitiated to improve a countrys terms of trade by exploiting monopoly powerunilateral reductions are unlikely Where commercial policies are used toinfluence the domestic distribution of income and employment so as to favor a particular factor of production or power group uncompensated or unilateralreductions in restrictions are not to be expected A final reason why unishylateral reductions in restrictions are unlikely is the infant industry argushyment which has special appeal to less developed countries
Reductions in trade barriers are therefore more likely to be achievedby negotiation than by unilateral action Negotiations under the rules ofGATT should be based on the principles of non-discrimination and reciprocityThe direction of negotiations under these limitations is likely to be shapedby the advanced internationally competitive countries who can offer access to a large well-protected market in return for concessions granted
International negotiations have therefore tended to focus on productsof particular interest to the relatively advuaced countries indirectly disshycriminating against third parties especially less developed nations Forexample the Kennedy Round negotiations were dominated by the products ofspecial interest to the United States and the EEC countries GATT rulesthrough anti-dumping provisions also prohibit the subsidization of exportsLess developed nations faced with balance of payments problems limiteddomestic markets and infant export industries are likely to find export subsidization particularly attractive
GATT rules do sanction customs unions free trade areas and commonmarkets all of them exceptions to the principles of non-discrimination andreciprocity Regional integration schemes are attractive means for lessdeveloped nations to expand exports and to negotiate trade barrier reductions on products of mutual interest so evading the GATT limitations on exportsubsidization and the general requirements of non-discrimination and reciprocity
63
(b) (i) Much of the discussion of regional integration has been in terms of static effects on the allocation of resources that is of increases in specialization according to comparative advantage Viner Meade Lipseyand Johnson have used the traditional definition of welfare based on the pershysonal consumption of goods and services to analyze the effects of changes in the allocation of resources caused by the formation of a customs union Their analysis reduced to barest essentials concludes that there will be gains in welfare for the countries forming a customs union to the extent that the reduction in protection within the union permits a shift toward lower cost sources of supply ie trade creation There will be losses in welfare for the countries of a customs union to the extent that a high external tariff causes the substitution of a higher cost source of supply for a lower cost source of supply from outside the union ie trade diversion
However Lipsey points out that the possibility of substitution in conshysumption qualifies the claim that a trade-diverting customs union alwayslowers welfare By providing the members of the customs union with a wider choice of consumers goods the union can permit a consumer shift to higher utility goods that is the relevant domestic price ratios may diverge more from the union-wide price ratios than from the previous international price ratios
(ii) To go more in detail From the trade-creation-trade-diversion analysis a number of causes can be identified that shape the size of the gains or losses resulting from a customs union (i) The gains from trade creation are larger th greater the differences in relative cost ratios of the countries considering union This is true because the greater the differences in relative cost ratios the greater the scope for specialization according to comparativeadvantage (ii)the losses from trade diversion to the countries forming a customs union are smaller the more competitive and the more similar the goodsthey produce as compared with non-union economies The more these conshyditions hold true the less likely are substitutions of high cost sources of supplies within the union for supplies previously obtained from outside (iii) A customs union moves prices toward the relative price pattern (rates of transportation) of partners and away from the relative price pattern(rates of transformation) in the world outside We therefore expect gainsfrom customs union formation to be larger the greater the proportion of preshy
64
union trade among the prospective members and the smaller the unions volume
of world trade relative to internal production Pre-union trade is evidence
that potential partners are efficient producers whose costs do not exceed world
costs The smaller the ratio of world trade to domestic production the smallshy
er will be the share of supplies from outside the union whose prices are reshy
latively low
Harry Johnson supplements the above reasoning Among his points A
country is more likely to gain from trade creation the higher the initial
level of its tariffs the more elastic is domestic demand for the partners
goods and the more elastic the supply of goods that the partners export A
country is less likely to lose from trade diversion the less elastic are the partners supplies and the less elastic the worlds supplies the less the subshy
stitutability between goods from partner and foreign sources and the lower the tariff on foreign sources after union is formed relative to the pre-union
level
(iii) The preceding analysis is weak as a guide to policy on two grounds
First LDCs are likely to be concerned with their balance of payments position unemployment repercussions inflation implications redistribution
of domestic income and social and political implications of the structural
changes expected in the economy
Second the static orthodox analysis is too limited It employs a defshy
inition of welfare -- the current utility derived from personal consumption of
goods and services -- that is too narrow Loss from trade diversion is normal
among LDCs (that is they are likely to have higher costs in many products
than the outside-of-union MDCs) But they can often and reasonably hope for
offsetting long-run gains through the dynamic improvements mentioned above
feedbacks toward eventual higher skills better organization and the like
Any losses to HDCs may earn a lower emphasis in the total calculation
The static analysis ignores the possible gains from economies external
to the firms that expand (or losses from external die-economies to the firms that contract) Possible economies of scale within the firms need emphasis
and possible business cumulative (business cycle) effects should be considered
The business cycle effects alone can be more important than all the static
effects
65
Dynamic effects primarily the effects on efficiency over time are crucial Long periods of time are necessary to work out the effects of cuts in trade restrictions (How much gain was there immediately from eliminating tariffs among the fledgllmg colonies that formed the United States) Expectations are shifted for the pattern of trade in the years ahead and the impact of those shifts are eventually fundamental The shaping of trade toward a regional network isa basic change
These long-run dynamic effects in outline to be predicted only unshycertainly and in detail usually impossible to predict can easily comshypletely swamp effects predicted in the static kinds of reasoning The static analysis can be nearly irrelevant and if its predictions are taken as indicating the direction of dynamic change it will often be misleading
The rate and pattern of growth of the LDC economies in a union over 1020 and more years after the union is formed are the crucial questions Clues May be found in the static analyses they may also be found more uncertainly and vaguely and also more relevantly in the wide range of other economic and non-economic considerations
(c) Concern with their mixed objectives in addition to the level of income at a point in time has led less developed nations to view industrishyalization as a very desirable goal They argue that external economies especially those arising from the diffusion of technological knowledge are most likely to be found in the manufacturing sector The fact that manushyfactured goods tend to make up a large proportion of imports in less develshyoped countries makes them likely to believe that import substitution which will also improve their countrys balance of payments position is desirable (cf Chenerys view) The terms of trade of primary products compared to manufactured goods are often asserted to be deteriorating (Prebisch) To the extent that foreign factors are concentrated in the export sectors
ISee R F Mikesell The Theory of Conmnon Markets as applied to RegionalArrangements among Developing Countries in International Trade Theoryina Developing World R Harrod and D Hague eds Macmillan London 1963also Organization for Economic Cooperation and Development InternationalEconomic Integration among Development Countries mimeo Paris May 1968 esp pp 3-28
66
the desire to minimize the leakage abroad of future earnings or to maximize the re-investment of future earnings will cause the industrial sector to be preferred over the traditional section (Levin) Finally the historic experience of most of the advanced countries confirms a pattern of developshyment led by rapid growth of the industrial sections (Kuznets)
Cooper Masseland Harry Johnson have developed approaches to the analysis of commercial policy formation that take explicit account of the existence of a collective preference for industrial production Johnson points out that the orthodox approach which focuses on the gains in personal consumption arising from the trade creating effects and the losses from trade diverting effects of a union always leads to advocacy of free trade which is attainable by unilateral action Cooper and Massel point out that the total effects of a customs union results from two processes a tariff lowering trade and income creating step and a tariff raising trade and income diverting step Since unilateral action can achieve gains from the first effect without suffering losses from the second customs union formation according to the orthodox analysis would always be inferior to a unilateral reduction in barriers to trade
To explain such real world phenomena as conercial policies tariff bargaining and the limited conditions under which countries are likely to begin customs union negotiations these authors employ a broader definition of welfare They recognize an association between welfare and personal conshysumption similar to that of the orthodox analysis but in addition they posit that people enjoy increased welfare derived from the collective consumption of domestic industrial production Trade restrictions provide resources to satisfy collective preferences fcr industrial production by placing a tax on the consumer the proceeds of which are transferred to the industrial proshyducer who is unable to compete in the world market
Protective commercial policies can be thought of as an additional resource which the economy uses efficiently when the marginal collective utility from industrial production is equated to the marginal private cost of protection In such a formulation we can not make judgments about the goodness and the badness of orthodox trade creation and trade diversion Trade creation within a customs union results in gain in consumer welfare since consumers obtain goods at a lower cost however trade creation means a decrease in
67
welfare to the extent that a country loses industrial production Trade
diversion results in a loss in consumer welfare through increased costs of
goods and services but in gains by increasing domestic industrial production
This formulation helps account for the facts of tariff bargaining and of
estimates of advantages of customs unions among less developed nations A
reduction in protection implies a reduction in psychic income (through losses
in industrial production) which can be compensated for by less protection
among partners (allowing a rise in industrial production) Countries with
strong competitive positions would be likely to seek such partner concessions
on a multi-national basis But countries with weak comparative advantage in
industrial production could expect to gain little from increased industrial
exports within the union and would suffer from increased competition from
within the union
Discrimination in the guise of a customs union offers a fairly efficient
country a chance to increase industrial exports without suffering losses in
its own industrial production That is countries find that they can satisfy
their preference for industrial production more cheaply than they could in
isolation Each encourages the others exports through granting preferential
entry within the customs union
We have been stressing the factors affecting gains and losses to welfare
when there are changes in industrial production In so far as industrial
production is a goal the most likely candidates to gain industrial productshy
ion by establishing a customs union are countries
i) with a strong and nearly equal preference for industrial production
ii) with weak comparative advantage in industrial production compared to the world
iii) whose comparative advantage ratios differ so that they will each have a profitable basis on which to exchange industrial production and
iv) whose kinds of products are complementary rather than competitive
68
The Coopfr Hassel and Johnson approach does not replace the orthodox approach They have presented reasoning that only qualifies gains and losses
to personal consumption as ordinarily defined
(d) We conclude our discussion of the theory of comnercial policy
formation by listing problems that were broi ht before the 1968 Delhi meetshy
ing of UNCTAD by the less developed nations (UNCTAD Trade Expansion and
Economic Co-operation among Developing Countries 1968)
The UNCTAD document presents the less-developed economy view of the gains from trade Trade is seen not as an end in itself but as a means to foster development Increased exports are needed to pay for the increased imports that usually Rccompany a development effort A market widened by trade is desirable because it enables economies of scale to be captured Greater speshy
cialization of labor and a certain amount of external competition increases
efficiency in line with the general objective of industrialization and
development
Nowhere in the discussion of the gains from trade is increased specialshyization according to the existing pattern of comparative advantage presented as gain Trade is viewed as means of securing industrial development more
effectively Increases in income from a more efficient allocation of resources in the more traditional sectors of the Pconomy are not a concern
UNCTAD discusses a number of influences on the rate of development which therefore should be considerations in the negotiating process
i) The more severe the balance of payments problems of a countrythe more sensitive it is to a possible greater increase in imports than in exports
ii) The greater the disparity in tariff structure before negotiations the greater the problem of establishing an external tariff
iii) The more the reliance on commercial policies to earn government revenue the greater is the readjustment in fiscal policy necessitated by a customs union
iv) The more rapid a countrys rate of inflation the more difficult are payments adjustments within a union
v) The greater the disparity between levels of development the more sensitive a country is to unequal gains in industrial production resulting from the union and the more importantis the problem of compensation within the union
69
vi) The greater the preference for industrial production ofpotential members the more important will be the need forcompensation to insure equitable distribution of economies of scale and external economies arising from the union
3-Quantitative Restrictions
Below is a subnary of a survey of quantitative restrictions in nine Asian countries from 1961 to 1967 Part a contains an overview of the kinds of comercial policies followed by these nine countries A comshyparison of the two years 1961 and 1967 is made and important trends
noted
Next specific restrictions on current account in 1967 are compared to restrictions in 1961 On the basis of their 1967 position the nine countries are divided into three categories relatively unrestrictive moderately restrictshyive and severely restrictive Next an attempt is made to determine the relative positions of these countries within a particular category A rather detailed schedule of changes in current account restrictions for the nine countries is made On the basis of this schedule the countries are divided into those movshying toward freer trade and those having made changes in both directions
Then the nine countries are surveyed as to their treatment of foreign capital in 1967 Policies toward inflow and outflow are noted
When examining comercial policies one is confronted with maze of specific details pertaining to a myriad of international transaction The form the sumshymary below has taken is dictated by the two aims of this survey to present a survey of commercial policies in developing Asia today and to assess the directshyion of change in these policies over the years covered Numerous details concerning the policies of particular countries are excluded
(a) A Survey of Asian Counercial Policies 1961-1967 In Table 16 an assessment of the 1967 position of Asian countries is made
with respect to particular commercial policies and important trends toward the changes in the use of particular commercial policies are noted Where given restrictions or characteristics exist they are marked by an X
Fixed exchange rates usually based on the par value of a countrys currency as established with the IDW have been maintained by five of the countries
surveyed
Table 16
Asian Commercial Policies
67 61 67 61 67 61 7 61 67 61 67 61 67 61 67 61 67 61
0 to 0 -4 0
94
Exchange Rate Agreed Par Value x x x x x x x Par Value Applied x X x x x xx
Unitary Effective Rate Fixed x x x Free x x x Pegged x x x
Special Rates for Capital Transactions x x x Import Rates diff from Export Rates x x x x x Multiple Import Rates x x x x Multiple Export Rates x x x x x
Trade Restrictions On Current Account x x x x x x x xx x x xx x x On Capital Account x x x x x x x x x x x x x x x x
Preecriptions of Currency x x x x x x x x x x x x x x x x
Bilateral Payment Agreements x x x x x x x
Import Surcharges x xx x Advanced Deposit x x x x x x Surrender of Export Proceeds x x x x x x x x x x x x x x x x xx
Part of a Monetary Area x x x x x x Participates in Economic Cooperation x I -
Source INF Annual Report on Exchange Restrictions 1961 1967
71
In the period 1961 to 1967 there has been a movement toward fixed exshy
change rates and the establishment of par values with the IlF The former
British colonies of Burma Ceylon and Malaysia replaced exchange rates pegged
to the British pound Thailand replaced its freely fluctuating exchange rate
and the Philippines replaced its system of multiple exchange rates Contrary
to this trend Burma and Indonesia have moved from their application of a
fixed rate toward the use of multiple exchange rates Pakistan uses multiple
exchange rates to subsidize some exports and to encourage some capital imports
Korea has freely fluctuating rates
Among these countries restrictions on current account range from extensive
state trading in Burma to the absence of any quantitative restrictions in the
Philippines (A detailed survey of current account restrictions will be made
in the next section below)
All Asian countries except the Philippines have restrictions on capital
movements Most countries especially former colonies discriminate between old and new or approved investments Repatriation of old capital is
considered on an individual basis while new capital is in general treated
much more liberally (A detail survey of capital account restrictions will
be made in sections c below)
All countries except Thailand list prescribed currencies with which intershy
national transactions must be made In the last seven years this list has
been widened considerably usually to include the currencies of European countshy
ries All countries require the surrender of export proceeds
Import surcharges have been increasingly used to counteract balance of
payments problems or to raise revenue for defense purposes They are now in
effect in Indonesia Pakistan Ceylon and Taiwan No trend in the use of
advance deposits is apparent for Asian countries as a whole Three countries
have introduced them two countries have abandoned them
There has been a general trend toward bilateral payments agreements
reflecting increased trade between Asian and Communist Bloc countries Ceylon
Pakistan and Malaysia are members of a larger monetary area the Sterling
Area Pakistan participates with Turkey and Iran in a program of regional
cooperation
72
(b) Quantitative Restrictions on Current Account
With the aid of Table 17 the present level of import restriction in
various Asian countries can be evaluated The Philippines Thailand and
Malaysia are the most free of import restrictions although no country
allows completely unrestricted imports The Philippines prohibits imports
of some agricultural products for protective purposes Thailand had in
1967 quantitative restrictions on ten items and Malaysia has prohibited
certain agricultural and industrial products and has recently imposed a
number of quantitative restrictions pending an increase in tariff rates to
protect pioneer industries
The imports of Korea Pakistan Taiwan and Ceylon face more regulation
than do the imports of the Philippines Thailand and Malaysia In lorea
and Pakistan most imports are free or subject to open general licensing
In Korea 87 of imports are made under open general licensing 142 items
require approval and 362 items are prohibited for protective reasons In
Pakistan most items are on the free list and may be imported without quantishy
tative restrictions Licenses for other items are allocated to industries
on the basis of the industrys importance in the nations development program
An industrys ability to earn foreign exchange is considered when import
licenses are issued Importation of some items is prohibited for protective
reasons
Taiwan requires specific licenses for all imports Import quotas are
allocated to industries on the basis of their importance in the overall
development program and their ability to earn foreign exchange In 1964
Taiwan declared that to be eligible for protection an industry had to show
that its costs were not more than 15 above the products import price
Ceylon requires a specific license for all imports A state monopoly
imports forty items Most luxury imports are prohibited
Indonesia and Burma have the most restrictive import regulations Burma
practices state trading and private importers are generally not permitted
In Indonesia most imports have been subject to quantitative restrictions and
sharply differentiated multiple exchange rates
73
Table 17
Current Account Restrictions
67 61 Go 61 67 61 67 ol67 61 67 61 67 61 67 61 67 61
4 0
-4 00 V-4
0d
IMPORTS Open generally or automatishycally approved x x x x x
Free x x x x
Specific licensing and quota xi x4 x x x x x x x x x x
2 3 Prohibited x x x x x
With export vouchers only x
6 State trader x x x
Multiple exchange rates to allocate iLejrts x x
EXPORTS 5 Approval or license required x xx x x x x x x x x
Free x x x x x x x x
Prohibited x
State trader x x
Notes 1 Import of sugar and wheat flour are restricted for protective reasons 2 Import of textiles and most other light manufactured goods from
Communist China are prohibited 3 A few agricultural products are prohibited for protective reasons 4 Ten items still require licenses In 1961 72 items required licenses 5 Rice export is subject to government approval 6 The statecontrols the import and export of about 40 items 7 Korea permits the import of 2984 items on open general license 142 items
required individual licensing 362 items are prohibited The export of a number of raw materials is prohibited
8 Pakistan requires import licenses for most important industrial input 9 Those goods on the free list as well as those which require licensing
are subject to multiple exchange rates
Source Annual Report or Exchange Restrictions International Monetary Fund 1961-1967
Table 18
SIGNIFICANT CHANGES IN CURRENT ACCOUNT POLICY
1961 1962 1963 1964 1965 1966
Government requir- Quotas establighed ed to purchase for TVs table locally goods fans rice mift
Rice import Licensing of Quota on Thai Central govern- whose imported machines bicy -oa
control scheme Soviet Bloc poultry removed ment places price less than and certain tightened sugar removed quotas on 101 107 below the chemicals
MALAYSIA items domestic price Wheat flour im-Licenses are re- port prohibited quired for the Quota removed for import of iron tires and copper and steel bars wire
Registration fee of 504m per ton for ru~de export
Requirement that
PHILIPPINES
Importers of decontrolleditems permitted
Quantitative restrictionsremoved from None None
20 of export -ceeds be surrendb ed at the offi- Export licensing
to use own en
importsoFree
cial rate removed market rateabolished
by Central Bank abolished
Par value export rate established
Export of eggs Cigarettes gunny Prior approval Export control Duties raised rice require bags and timber for export of Import control over sorghum on 10 items specific licens- subject to import large quantity over nickel amp Import license quantity res~L-1 in license of rice required paper established for rice milling tions on 15 items Import of steel Rice price sta- Import restric- machines enamel Export license drumbs fish bilization plan tion on tires ware amp cotton for rice chemicals and establish and tubes yarn discontinued motor vehicles require specific license
Source Survey of Commnercial Policies International Monetary Fund 1961-1967
75
These countries can be ranked according to the degree of current account
restriction they practice The Philippines is the least restrictive followed by Malaysia and Thailand Then come Korea and Pakistan Taiwan comes next followed by Ceylon which practices a great deal of import restriction
Indonesia and Burma are the most restrictive countries surveyed
The pattern of export control is like the pattern of import control Exshyports are in general free of restriction in Malaysia the Philippines Thailand
Korea and Pakistan Exceptions are government control of rice export in Thailand and prohibitions against the export of a few essential products in Pakistan and
Korea China Ceylon Indonesia and Burma require approval for all exports No approval for private exports has been granted in Burma since 1963
Table 20 illustrates the most important changes affecting the current account position of three countries From this kind of table trends toward
increasing or decreasing control can be ascertained which may forecast a countrys
future position on quantitative restrictions
Burma and the Philippines have undergone the most radical though opposite
changes in the use of quantitative controls Between 1963 and 1964 Burma nationalized all international trade Beginning in 1960 the Philippines in contrast gradually abandoned all quantitative restrictions and multiple exchange rates By 1967 the Philippines had become the least restrictive country in Asia
Pakistan and Korea have gradually moved away from quota restrictions
Thailand Ceylon and Malaysia have moved toward increased restrictions Ceylon made the greatest change moving from the application of open general licensing for most categories of imports in 1961 to quantitative restrictions and state
monopoly in 1967 Malaysia temporarily increased quantitative restrictions to protect pioneer industries while tariff increases were being considered
Indonesia although remaining in the most restrictive category liberalized its position considerably moving from a position of 80 state trading in 1961 to the position of issuing licenses to private importers on a quota basis in 1967
These countries can be classified as to whether or not they have been inshycreasing or decreasing current account controls Burma and Ceylon have inshycreased restrictions the most Malaysia and Thailand have made moderate inshycreases in quantitative restrictions Indonesia Pakistan Korea Taiwan and the Philippines have made substantial reductions in quantitative restrictions
on current account transactions
Table 19 - Restrictions on Current Account
1961 1962
Taiwan China
11Z devaluationof None official exchange rate
Ceylon Imports of 45itans Customs duties placed under quit raised by 20 on license from open all items except license food amp pet Imports of tires and tubes pro-
hibited
Korea Retention of ex- None port earning scheme blocked Specid customs duties imposed on luxury goods
Pakistan The list of auto- None matically imported goods doubled to include 62 items 11 items placedm open gen license Export of cotton garments to UK subject to licens
1963 1964 1965
Exchange certi- Decontrolledaoco- None ficate system nut coffee syn-abolished and fix- thetic fibres ed rate set
Pet subject to import license fish amp most other commodities
Restrictions im-
cement fibres unfinished motor cycles frames Quantitative resshytriction would be limited to 3 year To be eligible fo control a product cost less than 15 import price
All products made Imports of Petr subject to indivi products news-dual import lice- print cotton
1966
Controls reshylaxed for a large number of itelub
_
State control of textiles imports was
nse yarn corn fodder announced caustic soda under needed state trading
_
A number of spe- The number of Imports from ports removed frod cial taxes on im- items imported countries with number of items ports were abol-
ished Most goods brought under automatic approval pro-
cedure Number of items imported only byend user reduced
None Restrictions on trade with India established A defense sur-charge of 25 levied on all imports
was doubled whom Korea had favorable B of r were given preshyference
The number of items autoshymatically apshy
up t 3000__oed
Items of free list Govern conad doubled 31 to 66 over import Number industries iron amp steel allowed to apply shy
for import license finished 128-258 64 import Zed4 euro r of metal from US chemicalsput liberalized between on free list raw materials amp Tariff struL
ture revised
_J 8fr 8fdWUX2
-- 1961
Indonesia Import taxes on certain goods eased
Burma Licenses were in-creased to export-ers 27 raw mater-ials could be imported freely from anywhere
1962
Import Quotas sharply reduced
Tires amp tubes removed from open general license petr products chemicals placed on open general license
1963
Effective exchane rates depreciated sharply State monopolies on number of goods ended private importers lic-ensed
All foreign firms prohibited making imports Govern assumed control over all imports amp most exports
1964 1965
New appreciated ex- Withdrew change rate estab from amp all exchange taxei fund that existed abol-ished
Govern would allow importers to bring in any
product but most use own resourm 5 tax imposed on all imports A levy of 1350 Rps per $US was imposed on all imports()
Govern completed none nationalization of export trade
1966
A surcharge of 50 introshyduced for less essential imports
none
78
(c) Quantitative restrictions on foreign capital
Only the Philippines has no restrictions on foreign capital inflows or
outflows The Philippines does however require that at least sixty percent
of the capital invested in extractive industries be of domestic origin Pakistan allows free inflow of foreign capital Malaysia allows free inflow of foreign
capital into a list of approved industries Thailand Ceylon Korea and Indonesi
have no list of approved industries and negotiate terms of entry of foreign capshy
ital completely
Malaysia Ceylon Pakistan and Indonesia distinguish between old foreign
capital and new or approved foreign capital In all these countries except Indonesia repatriation of approved capital is guaranteed although Ceylon and Pakistan limit repatriation in any one year to prevent disturbance of the balshy
ance of payments Indonesia requires prior approval before any capital can be
repatriated
Malaysia Ceylon Pakistan and Indonesia define foreign capital that was in the country before independence as old capital Its repatriation is subshy
ject to individual approval in Ceylon Pakistan and Indonesia Malaysia permits
free repatriation of old capital within the Sterling Area repatriation outshy
side the Sterling Area requires individual approval
Thailand and Burma generally allow free repatriation but both reserve the right to limit repatriation of capital in any one year for particularly large
transactions Korea requires prior approval for any repatriation
There have been relatively few changes in restrictions on foreign capital
over the last seven years The Philippines has undergone the greatest change moving from a position in 1961 of prohibiting all repatriation and of severely
limiting remittance of dividends to a position of permitting the unrestricted
remittance of both in 1963 Other changes of note in the countries surveyed include the establishment in 1964 of blocked Malayan dollar accounts for firms
desiring to remit outside the Sterling Area a moratorium on all remittances
declared by Ceylon in 1964 and the nationalization of all foreign firms in
Burma during 1963 and 1964
79
4- The pattern of tariff protection In evaluating tariff protection and in making international comparisons
one needs to take account of two qualifications One is the uncertainty varying between countries and the times concerned as to valuation of imports and so the rates of duties actually imposed The evidence summarized below on pervasive error in Asian trade data indicates that this worry is no minor one The second is that effective protection not nominal protection is what is important Effective protection is measured by the percentage change in valueshyadded or alternatively in net earnings of the producer in the protected product Suppose a 10 duty is levied on imports of a good for which the doshymestic producer pays out 80 of the former price for his raw materials so that his value-added is 207of the former price When domestic price is raiseshyed by 10 (a simple result that does not always hold) value-added rises (from 20 to 30) by 50
If net earnings (profits) of the producer were half of value added or 10 of the previous price then effective protection defined in relation to net earnings rises (from 10 to 20) by 100
If the cost of raw materials rises as a result of the complete schedule of protection effective protection will be different and is likely to shift surprisingly even to negative levels (which means that cost of raw materials rises by more than does price of final product)
Effective protection has had high success in theoretical tTade discusshysions in recent years and has come to be actively used in practical trade negotiations Its success is justified It offers a much closer approximashytion to measuring the influences on production decisions than does the nomshyinal protection reported in the tariff code books But effective protection is difficult to calculate it requires data on average industry inputs and costs and sometimes firm costs that we do not have in Asian countries in adequate reliability and detail (We have experimented in such a calculashytion for one of our countries which we do not reproduce here) In most countries effective rates are higher and erraticaily higher than nominal rates and that generalization appears to hold for Southeast Asian countries
Bela Balassa does attempt such estimates for four high income countriesand the Common Market Trade Liberalization among Industrial Countries McGraw-Hill 1967 pp 178-184
80
The following samples briefly tariff rates for the four countries of region that rely on tariffs relatively most and on quantitative controls
least
With few exceptions Philippine duties are higher than those of other three countries Philippine duties also seem more consistently graduated to tax more heavily products with a high degree of fabrication The aim is evishydently to protect domestic processing and assembling Effective protection of processing and assembling must be very much greater than the reported nomshy
inal protection
The contrast between the Philippines and the other countries is espeshycially great for such luxury and semi-luxury things as processed foods pershyfumes consumer durables and such import-substitution candidates as cotton yarn and fabrics cement and glass products processed fertilizer and paper
board
Although lower than those of the Philippines Thailands duties are genshyerally high and show little graduation by degree of processing The pattern reflects a heavy reliance on import duties for revenue purposes rather than the aim of protecting domestic industry or controlling consumption
Halaysiasduties on non-consumer goods are generally much lower than those of Thailand and the Philippines Their pattern is closer to that of the Philippines than that of Thailand indicating the ruling purpose of domestic protection rather than revenue Duties are 0 to 5 on investment goods and low for intermediate goods save some of special interest (lumber rubber and tires glass and textile products) which are relatively highly protected Consumer goods are subject to a uniform rate of 25 suggesting the implicit purpose of revenue
Singapore has in general the lowest level of duties Except for rvenue producers such as alcoholic beverages tobacco processed foods cement and a few consumer durables all other items are free Singapore is constrained against raising duties on consumer products because of its over-riding aim of luring a swelling tourist trade through low prices on a wide range of standard consumer goods When it raises duties as in the budget speech of December 1968 it does so cautiously and modestly
--
81
In conclusion the tariff structures of these four countries differ wideshyly in their heights and considerably in the apparent purposes of the levies to raise revenue to check luxury consumption to protect the balance of payments to stimulate domestic industry or some combination of the four
The quantitative and qualitative differences in these tariff schedules and the different commercial and political purposes that the schedules reshyflect are likely to be stubborn obstacles to lowering tariffs in a regional cooperation scheme Reform mongering is possible especially if the goals are modest but it will be difficult
Table 20 - Tariffs-Major Categories
Consumer Goods
Food products
Cereal amp Preparations
Dairy Products
Meats and Preparations
Fish amp Preparations
Sugar
Non-Durables
Coffee and Tea
Alcoholic Beverages
Tobacco
Soap
Essentials Oils amp Perfumes
Pharmaceuticals
Footwear
Garmets
Durables
Refrigerators
Air Conditions
Appliance amp Uandtools
Automobiles
Bicycles
Radio amp TV
Malaysia
0
89
0-20
0-25
40
10
100-200
250
20
0
25 or $12
25
20
20
15-20
0
$14
25
Singapore
0
10
0
0
50
0
60-100
200
20
0
40
0
207
0
0
10
0
0-25
Thailand Philippinea
220 Bakg 10-30 P100kg
Milk Butter 30 5 - 70
25 Bakg 15
307 75
65 25-10 Pkg
25-55 30-75
25-10OBalit 100-2007
40 100 + 8-200Pkg
75OBakg 40
0-80 0-307
30 50-1007
30-40 90-110
60 120-150
60 100
30-55 10-25
60 40-160 Assem 20-30 Unassem
25 80
35 80-100
83
Table 20 (continued)
Intermediate Products I Malaysia ThailandSingapore Philippines
Crude Oil 0 0 0 5
Crude Material including Wood 0-25 0 30 5-10
Thread and Yarn 15 0 lOOBa-220 Cotton Wool Bakg 707 25
Intermediate Products II
Diesel Gasoline Fuels amp Lubricants 3 40 30-40 12-8OBalit 8-257
Chemicals 0 0 30 10-25
Rubber Manufacture 50 50 30 Bel -1 00 Foam Tires 70 140lb 15 30-60 Cement 10 20 150BaMet 60
ton Glass 25 0 50-70 50-70
Iron amp Steel pig and ingots 0 100 0
Metal Manufacture 0-25 0 22-150 10-80 Bakg
Paper amp Paperboard 15 0 10 40-69
Fabrics 25 25-300 50-100
Investment goods amp agriculture imports
Railroad 0 0 5 10
Trucks 0 0 207 15-20
Electric Equipment motors and generators 0-5 0-5 15 10-20 Other 0-5 0-5 80 10-20 Machinery 0 15-250 10-30 Fertilizer 7 0 0 Guano Potassic
0 20 Tractors 0 0 5 10
84
Table 21 Sample Commodities Duties
(Ad Valorem or Specifics Equivalent)
Code Product Malaysia Singapore Thailand Philippines
0 Food and live animals
00 Live animals 0 0 25Bakg 0
01 Meat amp Heat 0-20 0 25Bakg 15 Preparations 0 Milk Butter
02 Dairy Products 8 10 30 5 - 70
03 Fish amp Fish in cans Preparations 0 25 0 30 75
Rice 0 0 22OBakg lO-20P100kg Maise 0 0 220Bakg 15P100kg Flour 0 0 220Bakg 20-30PlO0kg
05 Fruits amp Vege- 60-100 0 50 15-40PlO0kg tables 45 Prefshy
erence raw refined 06 07
Sugar Preparations Coffee Tea
40 107
50 0
65 Coffee Tea
25 -Coffee
1OPkg Tea
25 55 30-40 75 11 Beverages
Beer 100 100 165OBalit 75 Spirits 200 and up 60 24-10OBalit 100-200
12 Tobacco 250 2007 40 or 25-55kg lO0+8-20Pkg
2 Crude Materials 0-25 0 30 5-107 inedible
85
Table 21 (continued)
Code Product Malaysia Singapore Thailand Philippines
3 Mineral Vuel 4 Lubricants
33 Petroleum amp Products
Gasoline 40 $130 gal 80Balit 25 or 40
Kerosene Diesel Residential
2 3
307
30 30 30
33Balit
12Balit
25Balit
87 8
15 Fuels
Crude Oil Lubricating Oil
0 $1gal
0 $1gal
0 66Balit
5 10r
4 Animal amp Vegetable Oils
0 0 44OBakg
or 25 5Pkg
5 Chemicals Sulphuric Acid 0 0 307 25 Nitric Acid 0 0 307 107 Sodium U 0 307 lOPkg Hydroxide
Pharmaceuticals 0 0 0-80 0-30 Soap 207 207 75OBakg 40 Paints 20 25 30 15 Essential Oils 50 0 50 50 Perfumes 50 0 80 200
86
Table 21 (continued)
Code Product Malaysia Singapore Thailand Philippines
6 Manufactured goods
61 Leather goods 25 or rubber 40 or $12 30 50-100 sole rubber sole Belts Foam
85 Rubber Manu- 50 50 30 10 shy 100 facture
Tires 70 140lb 33-132 Ba 30-65
65 Textile Products or 15 ea
grey bleached Yarn cotton 15 0 100-220 707
Bakg
Fabrics cotton 25 or 0 25-30 50-1007 10 cts
Silk Hemp Yarn Fabric Man Made Textile 0-25 0 30-40 25 - 75
products
84 Garments 25 0 30-407 90-110
66 Non Metallic MinerAX Manufacture
Cement 107 20 150Bametton 60
Glassware 25 0 50-70 50-70
67 Iron and Steel
Ingots or Pig 0 0 107 0
Rods Plates Shapes 0 0 10-30 10-307
68 Non Ferrous Metals 0-30 0 30 0-20
69 Manufactures of Metals 0-25 0 22-15OBakg 10-807 most 20
70 Machinery 0 0 15-25 10-30
Refrigerators 20 20 60 120-150
Air cenditioners 20 0 60 100
87
Table 21 (coatinued)
Code Product Halaysia Singapore Thailand Philippines
72 Electrical Equipment
Motors amp generators 0-5 0-5 15 10-20 Other Elect equipment 0-5 0-5 30 10-207 Bulbs 0 0-200 ea 30 10 Batteries amp Cells 25-30 5cent ea 30 20 Radio amp Television 25 Radio T V
0 2 35 80-100Appliances amp Tools 15-20 0 30-55 10-25
73 Transport Equipment Rail 0 0 5 10 Tractors 0 0 5 10 Buses 0 0 20 15-20 Trucks 0 0 20 15-20 Automobiles 0 10 60 40-160 Assem
20-30 UnassemBicycles $14 ($11 0 25 80 prefer)
Fertilizer 7 Guano Potassic0 0 0 20
Source Recent Tariff Codes of the four countries
88
e- Customs Revenue Loss in a Southeast Asian Customs Union
One of the economic deterrents to governments considering the formation of a customs union among LDCs is the possible loss of customs revenue It is
often casually assumed that since governments normally place great reliance on import duties as a source of revenue a customs union would substantially reshy
1duce national revenues The purpose of this note is to examine briefly the significance of the problem as a deterrent to a Southeast Asian customs union
The national governments in Southeast Asia have been obtaining 13 to 30 of their total revenues from import duties (Table 22) By means of a simplified
model we will attempt to indicate how much of this would have to be given up
presumably be replaced from some other revenue source if a customs union were
Table 22 - Import Duties as a Percent of Total National Government
Revenues Selected Southeast Asian Countries 1963-65
Country 1963 19651964
Ceylon 272 297 302
India 133 149 157
Federation of Malaya 297 NA NA
Pakistan 256 160 183
Philippines 219 226 236
Taiwan 172 175 190
Thailand 318 299 226
Source Statistical Office of the UN Statistical Yearbook 1965 for all except Taiwan from Monthly Statistics of the Republic of China Taipei December 1966
Note 1965 figures represent latest available estimates
1Some governments also obtain substantial revenues from export dutieshowever on the assumption that these apply mainly to goods sold outside the region we are ignoring them
89-90 formed We will then present a case study an estimate of the consequences for the Federation of Malaya of a free trade area with the Philippines and Thailand
(1)The Model Consider a typical country with the following pattern of import duties (a) Competitive and luxury imports subject to extremely high duties
(1) For most the rates are prohibitive and hence not
revenue-producing (2) A few luxuries however continue to enter There
is some revenue
(b) Non-competitive imports (1) Near-zero duties are on imports required as inputs for
domestic production and thus negligible revenue generated (2) Moderate to high duties are on non-competitive imports for
final consumption providing almost the entire import duty
revenue Descriptions of such a pattern can be found in a variety of sources
The Overseas Business Reports of the US Department of Commerce containfrequent references to such tariff structures In Taiwan for example the duties under 20 percent apply to books raw materials certain machinery and fuels those between 20 and 40 to products essential to education and healththose between 40 and 80 to most manufactured articles and those above 80 to luxuries and certain textiles2 This structure of tariffs combined with an import licensing system that grants licenses liberally for raw materials capital equipment and essential consumer goods but sharply limits imports of luxuries and of goods produced domestically3 is the frequent and nearshytypical pattern
IUS Department of Commerce Overseas Business Reports (Washington DC)irregular
20BR 64-89 Foreign Trade Regulations of Taiwan September 1964 p 1 31bid p 6
91
Similarly the Thai customs tariff is being used increasingly to protect new industries Luxury items are dutiable at higher rates imports of manushyfactures which are not produced locally are dutiable at lower rates and essenshy
tial materials are often duty free1
The Malayan import tariff automatically provides many Malayan industries with a measure of protection against competing imports In addition a Tariff Advisory Committee has been set up by the Malayan Government to consider applishy
cations of manufacturers for tariff protection the reduction of import duties on raw materials or any application for other assistance or concesshysions involving tariff policy
2
Finally the ECAFE study of import substitution notes the same pattern A brief examination of the tariff rates shows that there are two broad cateshygories of tariffs which may relate to two basic aims of tariff policy One aim is to influence the pattern of domestic consumption by levying high duties on luxuries and semi-luxuries The other aim is to protect domestic industries Essential goods would normally be expected to carry a low tariff(but) the higher rates of import duty are obviously imposed for protection Thus there seems to be a blending of these two basic aims of tariff policy higher duties on non-essentials and essentiala produced adequately or likely to be produced adequately at home lower duties on essentials which cannot be met by domestic
production at present or in the very near future3
A customs union would alter the typical picture just described by eliminashyting duties on intra-union trade but would probably retain approximately the existing pattern of external duties Customs revenue would thus continue to accrue to our typical national government from luxury imports and from nonshycompetitive imports for final consumption coming from outside the union but not from within the union The crucial question then is what proportion of
10BR_ 66-52 Market Factors in Thailand July 1966 p1
2OBR 65-18 Foreign Trade Regulations of Malaya March 1965 p 2
3ECAFE Economic Survey of Asia and the Far East 1963 pp 46-47
92
the value of existing imports in these two categories would be purchased from within the union The answer depends in part on whether one is speaking of the short-run with the existing industrial structures constantor of the longshyrun with time allowed for the establishment of new industries
In the short-run the high degree of similarity in the productive structures and outputs of the economies of the region suggests the following impact on the
revenue-producing imports of a typical country (a) luxury imports would be obtained from outside the union and thus
continue to provide the same revenue (b) A small proportion say (the probably excessive proportion of) 10
or 15 of the value of existing non-competitive consumption imports would be available from within the union Altogether then let us assume that in the short-run union would place 10 of current revenue-producing imports in the duty-free category
The revenue loss in the short-run would be the tariff rate times the value of those imports that will come duty-free from within the union but now pay
duty Assuming a tariff rate of 50 on affected imports 1 then 50 of 10 that is 5 of current national import tariff revenues would be lost by a cusshytoms union This in turn amounts to a normal maximum of 15 of total govshyernment revenue The preceeding (alternative) and similar calculations are presented in tabular form in Table 23
In the long-run union should accelerate the broadening of import substishytution with the tariff wall to include more and more of currently non-competishytive consumption imports from outside the region This would mean a further reduction of revenue-producing imports for our typical country Although it is difficult to determine exactly how much of such structural changes would be attributable to union let us make the extreme assumption that in total 50 of current revenue-producing imports are either eliminated or are obtained
1The assumption of a 50 rate on non-competitive consumption imports isprobably an overstatement Even import substitution items on the average are subject to nominal rates lower than 50
Table 23 Hypothetical Calculations of Revenue
Losses
Alter- Import duties Percent of non- Non-compet- Percent of Tariff Rate Percent of Percent ofnative as a of competitive im- itive imports revenue- on revenue- current total currentnational re- ports available as of rev- producing producing tariff re- national reshyvenue within union enue-producing imports to imports to venue to be venues to be imports be admitted be admitted lost by lost by union
duty-free duty free union
(1) (2) (3) (2)x(3)=(4) (5) (4)x(5)=(6) (1)x(6)=(7)
A 25 125 80 10 50 5 125 B 25 125 80 10 1007 10 250 C 25 125 80 10 25 25 0625 D 20 125 80 10 50 5 10 E 307 125 80 10 50 5 15
94 from within the union Thus again assuming a tariff rate of 50 and that import duties account for 25 of government revenues the government would have to adjust to a loss of (50 times 50) 25 of current import tariff revenues or a maximum of 75 of government revenues (tariff revenues assumed 30 of total revenues) Alternative calculations can be made in the manner of Table 14 above for other long-run assumptions
(2) Example
To illustrate the foregoing analysis consider the impact on the revenues of the Federation of Mlqnta of a hypothetical free trade arrangement with the Philippines and Thailand
The Federation of MalayWa is highly dependent on import duties for revshyenue and would be hard-pressed to replace them completely in a short period(See Table 24) However we will show that the effect on revenues of the assumed free trade arrangement is very small
Table 24 Federation of Masl~sa Revenues of Federal and State Governments (millions of Malay dollars)
1961 1962 1963 1961-63 Taxes on income and
wealth 2396 2351 1964 2237 Export duties 1920 1784 1524 1743 Import duties 3579 3592 3341 3504 Other direct taxes 1178 1202 1584 1321 Other receipts 2654 2755 2819 2743
Total 11727 11684 11232 11548
Source UN National Accounts Yearbook 1963 New York 1964 Estimates forfor 1962 and 1963
95
The minimum loss to theMOIatian government would be the duty collected
on imports from the partner countries Thus inte figure belw ifthe foreign
supply price is Op and the duty rate is pp then the total revenue is
measured by the rectangle pedp If the partner countries supply the quantity
aamp then the revenue collected on imports from the partner countries amounts
to b h k c We calculate this value by applying the scheduled Mak6sim tariff1
to each commodity imported2 in 1963 from the two assumed partner countries
the Philippines and Thailand The results are given in Table 23
Pf
II
a Q
1The Malayan tariff schedule is contained in Malaysia Trade Classificashytion and Customs Tariff (Kuala Lumpur 1964)
2 mport data were taken from Department of Statistics States of Malaya Annual Statistics of External Trade 1963 Vol I Imports
3These results are in summary form The Ml4sysin tariff schedule is at the six-digit level of detail and the calculations therefore were carried out at the six-digit level In this and the subsequent calulation any item generating lecs than M$100 duty was omitted
96 Table 25 Malaysian Revenue Collected on Imports from Two Partner
Countries 1963
SITC Section Duty (in thousand M$)
0 15765 1 25819 2 9840 3 46 4 17 5 36 6 1240 7 00 8 2373
Total 55439
Note Items do not add exactly to total because of rounding
97
The total duty collected on imports from the two partners amounts to only 158 of the duty collected on imports from all sources in 1963
Free trade however will cause a shift of Mmlaysian imports away from traditional sources and towards the partners The crucial question ishow much of the quantity of a f on page 95 would the partners supply in the shortshyrun As a hypothetical extreme we assumed that for each good the partner countries would replace other suppliers in the M aysan market up the amount of their (the partner countries) total exports of that good 1 This procedure assumes that exports of the partner countries are perfect substitutes for the Masysianimports within each SITC six-digit grouping Further we assume that there would be no substitution between SITC six-digit groupings and hence no loss of revenue on other imports The revenue loss calculated on this basis
bullis summarized inTable 26
1Only those goods currently imported from the partner countries are considerud on the ground that the partner countries products are not subshystitutes for the goods of other suppliers if they do not sell currently in the Malayan market These calculations were also carried out at the sixshydigit level using the Philippine export statistics for 1963 (Bureau of Census and Statistics Foreign Trade Statistics of the Philippines 1963Manila) Thai export statistics were for 1964 (Thailand Department of Customs Foreign Trade of Thailand 1964 Vol IIExports and Re-exports)These figures were used because 1963 was not available to us There were a few difficulties encountered in matching items but such cases all inshyvolved small amounts of trade and therefore any inaccuracies arising from this source should have little effect on the result
2No attempt was made to separate out Commonwealth and non-Commonwealth imports that would be eliminated Consequently the full rate was appliedThis assumption yields an upward bias in the calculated duty loss
98
Table 26 Potential Revenue Loss
SITC Section Loss Th M$
0 78626 1 1111649 2 11916 3 46 4 209 5 1332 6 16582 7 00 8 9189
Total 1229550
Total except 1 11 7901
The total potential revenue loss amounts to 3503 of Malayan customs
revenue in 1963 However this is concentrated in Section 1 beverages and
tobacco If one omits the duty loss on Section 1 which could readily be
recouped by imposing equivalent excise taxes the total revenue loss is only1
336 of Malayan import duty revenue in 1963 or approximately 1 of total
Malayan government revenue
Finally we should add that duties collected on-exports to the two
hypothetical partner countries in 1963 was 0105 and of tin 03012 of
total customs revenue
1Further Section 0 includes an assumed Philippine switch of exports of refined sugar from the US to Malaya which is unlikely in view of the high US price paid If this is omitted along with all of Section 1 the revenue loss amounts to 174 of import duty revenue in 1963
2The variable leviT export duty made it impossible for us to calculate the revenue collected on rubber and tin The ad valorem duties on other exports to the partners yielded revenues of less than M$10000
99
The conclusion is clear Both from general reasoning and from the
case example we conclude that government revenue of a typical Southeast
Asian country entering a regional customs union would be reduced very
little in the short-run Long-run structural changes would cause greater
lossbut since intra-union tariff reductions would occur over a period
of a few years adjustment to the loss of revenues should not prove a
major impediment to union
f- Protectionism and the growth of productive efficiency
Let us suwmarize and extend the above and develop policy implications
Trade barriers within the region and internationally are a major qualificashy
tion on the possibilities of achieving comparative advantage growth and of
expanding in the fields where feed-back effects toward still higher efficiency
are most promising They are higher than they seem modest rates on the custshy
oms books (above Section D4) say 10 or 40$ can in fact mean 80 or 200
change in the returns left to the producer when his local business costs are
paid and even more change in his net profits
Modest quotas also can be surprisingly protective to final processors
In addition protective effects are erratic A modest duty on final
output can be transformed when tariffs on inputs into the production process
are counted into a heavy net tax rather than the subsidy innocently intended
by lawmakers High and erratic protection means that the distortion to world
patterns of specialization and the injury to regional and world efficiency
are much greater than have been traditionally thought
Protection in DCs and LDCs alike is relatively high on manufactures
and specially high on more complex manufactures Hence less developed countshy
ries are especially handicapped in trying to expand sales abroad of manufactshy
ures which they judge have feedback and dynamic advantages to them in trainshy
ing of skills improvement of organization and capital formation
These feedback and dynamic effects justify much attention They are
the mainly important potentialities from a regional preference or freershy
trade arrangement
100
In such an arrangement export markets will expand for the proshy
ducts of the most efficient regional countries Domestic markets for their
products are small often very small As the size of the market and the
volume of production expand average costs in many industries can fall sharply
through a considerable range handicraft and small-scale production is outshy
competed by mechanization use of power equipment specialization in subshy
processes and assembly line fabrication Expansion of the market develops
other economies feedback effects in their broadest sense skills and entreshy
preneuring abilities in one industry that are useful also in others better
communications (a road or railroad developed for one business can be used by
others) simplifications and standarization encouraged through producing for
a large market emergence of new industries out of the specialization encourshy
aged by producing for a large market and from more contacts and growth of
a sense of momentum and confidence in economic possibilities
Industries differ in their extent of feedbacks toward higher efficiency
It is sensible in any regional or broader scheme for increased trade to
stimulate those that have the most
The trend of world trade since 1900 and more recently reinforces the
urgency of the argument that LDCs should aim diligently to up-grade their
skills organization and technology and do so as rapidly as they can In
world trade as a whole commodities with low skill-and-capital requirements
have been making up a falling proportion and those with high skill-andshy
capital requirements a rapidly rising proportion The value of food and raw
materials has been rising recently at less than one-fifth the rate of growth
of manufactures Exports of LDCs to high income countries show this same
pattern foodstuffs and agricultural raw materials exports have been rising
recently at the rates of 20 and 14 a year respectively In contrast
manufactures and base metals have been growing recently (1960 to 1964) at
the surprisin rate of 14 a year faster even than petroleum exports
Among manufactures the highest growth rates among exports have been for
machinery and equipment followed by other manufactures textiles
and chemicals
Low income countries have been gaining new markets within the manushy
factures class in the less complex types of producers goods and machine
parts such as electric generators diesel engines locomotives steel frames
101
for furniture and the like 1 These have a high labor content and require
less elaborate marketing than consumer goods especially consumer durables
Tariffs and other restrictionist measures within the region have thereshy
for three reinforcing injurious aspects (1) they are much more distorting to
the efficient static flow of resource use than the nominal rates imply since
it is the effective (not the nominal) rates that count (2) They bear most
heavily on manufactures and the more technical manufactures in which feedshy
back effects toward higher productivity are often most promising (3) They
limit trade in that segment of international commerce the higher skill-andshy
czpital requirement group which are often manufactures in which market opshy
portunities have been growing specially fast
In addition (4) lowered trade barriers within the region and generally
have a special advantage to the smaller LDCs for a reason not often highlightshy
ed LDC economies are typically thin subject to sporadic scarcities and surshy
pluses of particular products due to crop failure or abundance to transport
breakdown to industrial difficulties or successes where suppliers are few and
to failures of central planning There is therefore especially large gain
to their economic life from opening up freer trade channels for supplies and
markets and for this reason they ought to be devout supporters of freer trade
On the other hand because most low-income countries are hIeavily depenshy
dent on government revenues for customs receipts they are inAined to move
cautiously--probably excessively cautiously (see the analysis above)--in lowershy
ing customs levies even though lower rates need not mean lower receipts2
1United Nations World Economic Survey 1962 vol I pp 14 65 T Morgan Economic Relationships among Nations the Pattern of Comodity Trade ch 5 in B Hoselitz ed Economics and the Idea of Mankind pp 156 174
2The subject matter of this section is discussed more in detail in the research paper of the Project entitled Preferences Revisited
102
g- The variety of economic and non-economic cooperation
This section has been centered on the possibilities of regional tradeshy
increasing cooperation with its implications for increased economic efficiency
This is the usual focus of studies of regional cooperation But there are in
addition many other kinds of economic cooperation and many kinds of cooperashy
tion that are not primarily economic
These will be referred to in various contexts in the later sections We
list below four groups to suggest their range and variety Among them are
--informal and formal consultations on economic and other matters
--agreements to undertake cooperative administrative action on economic and other problems of joint concern (eg health measures)
--agreement among two or more countries to commit resources for joint purposes (eg river valley development cooperative deep sea fishing)
--arrangements with international organizations and with countries outside the region to undertake notions of regional benefit (ECAFE and Asian Development Bank activities the Colombo Plan)
Regional advantage as distinct from advantage to one country can come
through (a)measures that benefitting one country can have their advantages
spread to other countries without added cost (eg research and health measures)
(b) projects where there are economies of scale of substantial amount (eg
a regional market can enable output to rise to a level where average costs
are substantially lower) (c) projects and activities that in addition to
their direct effects can stimulate and catalyze across national boundariesshy
broaden peoples horizons encourage them with evidence of possibilities
extend their perspectives raise their usable skills
Potential gains are large The evaluation of their realized amount turns
on the kinds of projects undertaken the conditions under which they are carried
out and the energy and perception applied to them
The acceptance or rejection of any one project proposal rests on the outshy
come of a specific cost-benefit analysis Priority goes to those projects
that rank highest in such analyses up to the limit of the resources available-shy
which is itself a variable depending on the estimated productivity of the reshy
sources at the margin
103
One general presumption gives a useful rule-of-thumb for policy decisions
Projects that expand production andor productivity have an obvious presumption
in their favor Conversely projects that seek high money returns through
checking production andor productivity are suspect The latter of course
deny the basic nature of economic progress which consists of increasing
production or real income The latter are likely also to involve specially
burdensome administrative problems--and administrative efficiency is a major
LDC bottleneck Finallytheir intent is apt to be frustrated by the obvious
the subtle and the manifold inroads of competition both from the same proshy
duct and from substitutes both in the short run and the long run
104
II -Foreign Exchange Constraints and Regional Cooperation in Southeast Asia
One of the most vivid and persistent contraints on economic development is that of scarcity of foreign exchange The Minister of Finance and the Chairman of the Development Board must in the Lypical LDC ask themselves whenever any attractive growth project is proposed Do we iave or can we obtain enough foreign exchange to meet its external costs
In one sense the concern is no more than the inevitable not enough
money image of the resource scarcity permanently faced by any group and anyindividual In another sense if the LDC economy is composed of private maxishymizing units and of government bodies that behave as if they were it reflects disequilibrium exchange rates the exchange rate overvalues domestic currency But the survival power of disequilibrium exchange rates is very great they
1 are chronically with us
A - A Regional payments union
Hence proposals for that form of regional cooperation called a regional payments union continuouslyinvite attention The basic idea is that among the national members of the union a large part of their payments falling due can be offset and cancelled against claims in the oppositedirection Hence an advantage (1) foreign exchange will be economized and there will be a larger value of trade made possible both within the union and between the union members and the outside world A larger volume of trade means that specialization along the lines of comparative advantage can be carried further with its direct (static) and indirect (static and dynamic) advantages to the rate of growth
A payments union can operate in one of several ways Simply lengthening the period over which international payments are made will conserve foreign exchange ordinarily importers must pay their debts in foreign morey on demand or within a limited specified period Instead member countries can designate central authorities to keep accounts in which importers pay and exporters receive domestic money and in which foreign transactions are offset and the
ISee the reasoning of CP Kindleberger Liberal Policies vs Controlsin the Foreign Trade of Developing Countries AID Discussion Paper 14 April 1967
105
net foreign balance settled at the end of some agreed-on-period -- a week or
month for example The national clearing houses are an easy variation on
the exchange control offices with which most LDCs are familiar The latter
are already in fact extending credit across national boundaries as part of
their functioning They grow to extend credit explicitly if member countries
agree to give each other swing credits for say three or more months
Such swing credits function most effectively if changes in bilateral balances
tend to average out over the settlement period
If a regional clearing office is set up the bookkeeping can be done
more efficiently 1regional clearing house can by joint agreement grow
into a central authority with specified powers among which may be the estabshy
lishment of common unit of account for settling balances Such accounting
units permit still greater foreign exchange economizing the credits of a
persistent creditor can be used to finance negative balances of a persistent
debtor country -- up to agreed-on amountis and time periods
Two additional advantages are sometimes claimed for a payments union
among LDCs (2) Through regional cooperation it may be possible to avoid
some of the ordinary financial charges on international transactions Proshy
ponentsof financial cooperation for Central American have made such of the 1
savings that would result from by-passing New York as a financial center
In the past for example payment for an export from Guatemala to Nicaragua
had to pass through New York banks and thus was subject to a maximum of two
financial charges one when the importers cordobas were converted into dollars
for payment and again when the exporter took payment in quetzales The same
kind of economy -- not large but something -- would be obtained in Asia
through a regional payments union to the extent obligations can be settled
directly in rupiah or baht or pesos rather than indirectly into pounds or 2
dollars and out again
1John Parke Young Central American Monetary Union United States Department of State Agency for International Development RCCAP 1965
2This economy is advocated cautiously by RobertTriffin in a intershy
esting symposium with disbelievers in an Asian Payments Union Japan and the Development of Asia The Oriental Economist Nov 1968 pp 26-38
106
(3)A third claimed advantage stems from the fact I that currencies of
LDCs are usually overvalued and often inconvertible By clearing through the
union member countries avoid paying the premia in local currency that would
otherwise be required to obtain hard currencies needed to finance intrashy
regional trade Some further saving in charges may therefore result
(4)Finally there are the advantages of more home rule Decisions on
credits and other payment terms are made less in London or New York and to a
greater extent within the region Nationalist sentiments are favored and governments grow more into the habit of considering regional incerost and of
cooperating with their neighbors in the joint interest This advantage may be
the most important of all those claimed
One of two conditions must be met in order for a payments union to be successful The totals of existing and incremental intra-regional trade may or may not be fairly evenly offset among countries If persistent creditors
and debtors become conspicuous the union is threatened with breakdown But
it can still survive if the persistent creditors are willing to lend at long term to cover the deficits of the persistent debtors within the region We
illustrate with concrete examples
The most conspicuous payments union of the post-war period is the Euroshy
pean Payments Union (EPU) in operation from 1950 to 1958 The EPU structure provided for a se tlement period of one month with swing credits allowed over a longer period European trade and financial flows tended to be unbalanced
but the EPU was able to function effectively because the nations that became
persistent creditors (especially Germany) were willing ultimately to convert the short term balances of the persistent debtors (Greece and Italy) into long
term loans
The EPU operated under unique historical circumstances the economies
and trade network of Europe had been disrupted by World War II and were afflictshy
ed in the early 1950s by what was called partly misleadingly the dollar
shortage Thus the EPU helped provide liquidity and time for the European
Countries to rebuild already proven industrial structures and reconstruct old patterns of intra-regional trade With the successful recovery of Europe the
basically discriminatory payments arrangements could be abandoned A return
to convertibility was possible by 1958
1Jaroslav Vanek Payments Unions Among the Less Developed Countries and Their Economic Integration Journal of Common Market Studies(Dec 1966)
107
In partial contrast with EPU the Central American experiment began as
a clearing-house with minimal credit provisions progressed through a stage of bilateral credit arrangements and has evolved to a stage where liabilities
and claims within the Union are stated in a common unit of account--the Central
American peso The success of the organization owes much to strong support by the authorities of the countries involved In addition the initially balanced trade pattern of Central American and especially the balanced growth of regional trade must also have contributed And the balanced growth of trade has to be
attributed to factors and policies other than the payments union itself (eg
to the program of integration industries)
The situation in Southeast Asia is different from those just described
in important respects
We have examined the possibilities for a payments union among six counshytries of Southeast Asia proper Burma Cambodia Indonesia Malaysia-Singapore
the Philippines and Thailand The calculation is necessarily based only on
reported trade and is therefore subject to uncertainties surrounding trade data (see below Section III) But the data indicate that the benefits from creation
of a payment union among these six while positive would be small
The main reason for this conclusion is shown in Table 27 which lists bilateral trade balances among the six countries on the right with imports of the country (-) subtracted from exports (+) The bilateral negative balshy
ances are subtracted from the bilateral positive balances to give the net poshysition gross claims have no such subtraction Both totals are given with
and without Burma and Cambodia which are special cases
The pattern of trade so measured has remained very stable and it is
clearly unbalanced Simple debt pooling would promptly lead to the appearance of heavy creditors and heavy debtors both between pairs of trading countries
and between a given country and the region as a whole There is little reason
to expect the regional creditor nations (Thailand Indonesia and Cambodia who are caught up in their own development problems to be willing to advance long term credits to the persistent regional debtors (the Philippines and
Malaysia-Singapore)
But because--as we shall see--this debtor-creditor problem can be overshy
come in various other ways we should inquire as to whether or not at least
savings in foreign exchange would be possible Quarterly trade balances
Table 27
INTRAREGIONAL BILATERAL BALANCES OF TRADE 1958-1965
(recorded exports in millions of US dollars)
Trade Net Net Gross Claims
ofwith Burma Cambodia Indonesia Malaysia Philippines Thailand Position Position ClaimswithoutBurmaampBurmaBurma amp
without ampCambodia
Cambodia
Burma
1965 x - - - + 69 + 76 +310 -17 + 438 + 455 1964 x - - - +316 + 94 + 91 -01 + 500 + 501 1963 x - - shy +312 +169 +126 -05 + 602 + 602 1962 x - - shy +310 +146 - 01 -13 + 442 + 456 1961 x - - - +306 +152 + 04 -12 + 450 + 462 1960 x - - - +411 + 76 - - - -03 + 484 + 487 1959 x - - - +352 + 71 - - - +06 + 429 + 435 1958 x - - - +249 +161 + 32 -08 + 434 + 447
TOTAL +3779 +3845
Cambodia 1965 - - - x - 32 +124 + 57 - - - + 149 + 181 1964 - - - x - 21 +107 + 08 - - - + 95 + 115 1963 - - - x - 58 + 93 - - - - + 35 + 93 1962 - - - x + 01 -22 - -- - - - - 21 + 01 1961 - - - x - 02 -08 - - - - 10 - - -
1960 - - - x + 05 + 64 - - - - - - + 69 + 69 1959 - - - x - - - + 43 - - - - - - + 34 + 34 1958 - - - x - - - + 72 - - - - - - + 72 + 72
TOTAL + 423 + 565
Indonesia
1965 - 69 + 32 x - - - + 173 + 29 + 165 + 202 + 234 + 202 1964 -316 + 21 x - - - + 213 -285 - 367 - 72 + 234 + 213 1963 -312 + 58 x - 162 + 189 - 34 - 261 - 07 + 247 + 189
0-
- - -
- - -
Trade ofwith
Indonesia
1962
1961
1960
1959
1958
TOTAL
Burma
-310
-306
-411
-352
-249
Cambodia
- 01
+ 02
- 05
Table 27 (cont)
INTRAREGIONAL BILATErAL BALANCES OF TRADE 1958-65
(recorded exports in millions of US dollars)
Net NetPosiion Indonesia Malaysia Philippines Thailand Position Position
Without Burma amp Cambodia
x - 414 + 239 + 53 - 433 - 122
x +1348 + 192 -112 +1473 +1777
x +2001 + 191 - 90 +1686 +2102
x +1777 + 184 + 08 +1617 +1969
x + 954 + 290 - 76 + 919 +1168
44849 +7261
Gross Claims
+ 292
+1891
+2192
+1969
+1244
+8303
GrossGrs Claims Without Burma amp Cambodia
+ 292
+1889
+2192
+1969
+1244
+8190
Table 27 (cont)INTRAREGIONAL BILATERAL BALANCES OF TRADE 1958-1965 (recorded exports in millions of US dollars)
Trade of
Burma Cambodia Indonesia Malaysia Philippines Thailand Net Position
Net Position
Gross Claims
Gross Claims
with without without Burma amp Burma amp
Subject Countries
Cambodia Cambodia
Malaysia 1965 - 76 -124 - - shy x + 113 -1163 -1255 -1055 + 113 + 113 1964 - 94 -107 - - shy x + 79 -1119 -1241 -1040 + 79 + 79 1963 -169 - 93 + 162 x + 114 -1029 -1055 - 753 + 276 + 276 1962 1961
-146 -152
+ +
22 08
+ 414 -1348
x x
+ +
86 68
-1051 - 747
- 675 -2171
- 551 -2027
+ 522 + 76
+ +
50z 68
1960 - 76 - 64 -2001 x + 193 - 606 -2554 -2413 + 193 + 193 1959 - 71 - 34 -1777 x + 189 - 679 -2372 -2267 + 189 + 189 1958 -161 - 72 - 954 x + 174 - 553 -1566 -1333 + 174 + 174
TOTAL -12849 -11439 +1622 + 1594
Philippines 1965 -310 - 57 - 173 - 113 x - 145 - 798 - 431 - - - - - -1964 - 91 - 08 - 213 - 79 x - 133 - 524 - 425 - - - - - -1963 -126 - - - - 189 - 104 x - 72 - 491 - 365 - - shy - - -1962 + 01 - - - - 239 - 86 x - 06 - 330 - 331 + 01 - - -1961 - 04 - - - - 192 - 68 x - 164 - 428 - 424 - - - - - -1960 - - - - - - - 191 - 194 x - 04 - 389 - 389 - shy - - - -1959 - - - - - - - 184 - 189 x + 02 - 371 - 371 + 02 + 02 1958 - 32 - - - - 290 - 174 x - 59 - 555 - 523
TOTAL -3886 -3259 + 03 + 02
Thailand 1965 + 17 - - - - 29 +1168 + 145 x +1301 +1283 +1312 + 1295 1964 + 01 - - shy + 285 +1119 + 133 x +1538 +1537 +1538 + 1537 1963 + 05 - - shy + 34 +1029 + 72 x +1140 +1135 +1140 + 1135 1962 + 13 - - - - 53 +1051 + 06 x +1017 +1004 +1070 + 1052 1961 + 12 - - shy + 112 + 747 + 164 x +1035 +1023 +1035 + 1023 1960 + 03 - - - + 90 + 606 + 04 x + 703 + 700 + 703 + 70v 1959 - 06 - - - - 08 + 679 - 02 x + 663 + 669 + 679 + 673 1958 + 08 - - - + 76 + 553 + 59 x + 696 + 688 + 696 + 688
TOTAL +8093 +8039 +8173 + 8108
for these countries for the years 1962-1)65 have been calculated The
quarterly pattern indicates that a payments union based on quarterly
swing credits would not save appreciable (added) amounts of foreign exshy
there are very few swings in quarterly bilateral balanceschange
Nevertheless a simple clearing union would lead to some saving of
foreign exchange simply because weekly r longer clearing periods would
We have been unable to determineallow some transaction to be offset
substantial savings in the administrative costs of makingwhether net
Partly for his reason we have made no attempttransactions would result
the actual monetary costs of operating a to determine whether or not
regional payments union in Southeast Asia would exceed the monetary beneshy
fits (measured in foreign exchange)
Although the detailed study was made for six countries might there
be some other group of countries in the region that could form a viable
payments union Professor Nurul Islam I has suggested that Pakistan and
India might benefit considerably from a payments union with other countries
But from the data we have available we conclude there isin the region
that otherlittle in the pattern of bilateral trade balances Lo indicate
groups of the region larger or smaller could form a viable payments union
There would still be persistent and extreme creditors and debtors for whatshy
ever plausible set of countries one selects
re-The above analysis is based on the existirg pattern of trade and
Let us approachgretably but necessarily on an uncertain statistical base
the problem in a different way
A relevant question is whether or not the existing low levels of inshy
the lack of bilatoral or multilateral balancetraregional trade as well as
a result of a past histury ofin the region may nut to some z be
1Nurul Islem Comment in T Morgan and N Spoelstra eds
in Southeast Asia University of Wisconsin PressEconomic Interdependence
Madison 1969
112
regional payments problems For example the regions Sterling bloc
countries (Ceylon Burma and Malaysia-Singapore) adjusted the direction
and composition of their foreign trade during the 1950s to cooperate
with the requirements of the entire Sterling bloc 1 But the Asian case
on the whole does not seem to be one of regaining a past pattern of
regional trade Froe the evidence on trade and economic structure preshy
sented earlier we judge that the present pattern of regional trade is
primarily due to fundamental structural economic characteristics of the
region Analogies between Europe in the 1950s and Southeast Asia at
present are not appropriate
There are it is true incipient changes in the structure of Asian
production and trade that may prove to be a basic for meaningful cooperashy
tion in the future And an Asian payments union may have indirect effects
of the type that apparently were important for Central America facilishy
tating and accelerating other forces for change But a payments union for
Asia (as for Central America) is more likely to be a permissive or passive
factor than an initiating or active force We find little evidence that a
payments union will by itself do much to increase the volume of Asian
regional trade
In addition to these considerations we should report a minus that
stems from a fundamental reality of the region In recent years several
countries -- notably Thailand Malaysia Singapore and the Philippines shy
have enjoyed absence of pressure on their exchange rates as well as a
favorable basic international reserve position Other countries -- Pakistan
India Burma Indonesia and Ceylon -- have operated under often extreme
foreign exchange pressures with the familiar accompanying features of
overvalued rates complicated systems of exchange control and bilateral
trading arrangements
Professor Islams point about the potential benefit of a payments
union to deficit countries like Pakistan is well taken But it is not
clear that countries in the first (surplus) group have much incentive to
enter into payments arrangements with the second (deficit) group The
countries with comfortable reserve positions and reasonable exchange rates
1American Trade with Asia and the Far East Robert J Barr ed
Marquette University Press 1959
113
have maintained satisfactory export performance and they have been free
to import the commodities they choose from any source they choose
Because their participation in a regional arrangement with the deficit
group might require purchases of less-desirable products from within
the region and because there might be some planned or unplanned poolshy
ing of regional foreign exchange reserves countries in the first group
would probably suffer a clear loss from being cooperators They would
do better by acting alone
If in anticipation of economic benefits or for other policy reasons
a payments union should be established in Southeast Asia there are cershy
tain policies that might be adopted to maximize short run and long run
benefits Nurul Islam suggests one possibility1
The credit facilities would be extended to
the deficits and surpluses arising not out of total trade but from incremental trade among the member countries Thevolume of trade taken as the base for estimating increments could be a moving base which can
be taken to increase by a given percentage per year
Instead of an incremental trade or payments union suggested by Islam
a complete payments union would be possible despite the presence of exshy
treme creditors and debtors if the problem of extending regional long
term credits could be solved One possible solution would be to use
external foreign aid to support the net positions of debtor countries
with the rest of region Of course adequate safeguards would have to
be employed so that debtor countries would not be able to run up excesshy
sive obligations A general infusion of long term capital into the
region through the payments union is preferable to bilateral aid to the
extent that a payments union (1) allows more scope for the price mechanshy
ism to operate to fix the patterns of intraregional trade and of regional
location of industry and (2) introduces useful regional disciplines
against low-efficiency uses of foreign aid
1 Nurul Islam Comment in T Morgan and N Spoelstra op cit
114
In view of the above arguments an obvious institutional arrangeshyment for regional cooperation might be a regional payments union combined in some way with a regional development bank One of the functions of the development bank would be to finance by long term investment the net
regional trade deficits of slow growing countries
B - The end of the Vietnam War
The hoped-for and prospective easing off and perhaps ending of the Vietnam war offers an obvious opportunity for useful regional cooperation The present payments flows within the Region are influenced by direct and indirect spending for the War Continuing studies of these payments flows by countries kinds and amounts can be helpful in envisaging what is likely once the War ends and what compensating policies on a regional basis are most feasible AID can be helpfu in such studies the Asian Development Bank at Manila will naturally carry them on other organizashy
tions may assist
C - Two gaps saving and foreign exchange
as checks on regional growth
In the growth literature of the past several years attention has often been directed to the concept of a double gap -- a domestic savshyings gap and a foreign exchange gap -- that checks economic growth The argument is that LDCs are generally deficient in the ability to finance domestic capital formation (the domestic savings gap) and that this capishytal deficiency can be met only through kinds of goods and skills that must be imported in excess of what can be paid for by prospective exports (the foreign exchange gap)
This approach assumes a division of income between consumption which does not contribute to real income growth and nationai -- accounts-shydefinition savings (identical in total to investment) which does A target rate of growth of GNP is accepted and a constant incremental capitalshyoutput ratio assumed (dKdO equals a fixed value) Hence a minimum sufshyficient rate of savings (investment) is implied Part of those investment goods may have to be imported because of domestic production lacks
115
If resources can be shifted readily between domestic investment use
and exports abroad then no distinction need be drawn between the savshy
ings gap and the foreign exchange gap The question of the two gaps
arises in this model when resources cannot be so shifted
The two-gap approach has the inconvenience of diverting attention
from the accounting fact that a savings-investment relation is not someshy
thing separate but is implicit in the balance of payments A surplus
of imports over exports is necessarily equal to the surplus of products
utilized by the economy over products created by it or the excess of
investment over saving1
More savings that is less consumption if income and domestic conshy
sumption are constant is a condition for closing the foreign exchange 2
gap
1Harry Johnson Economic Policies toward Less Developed Countries Allen amp Unwin London 1967 pp 53-54
2This is the Absorption Approach to the balance of payments which
states that an improvement in a countrys balance of payments implies an increase in savings a decline in domestic investment or some combination of the two In this approach the balance of payments is generally deshyfined in terms of B-Y-E where Y is total income from home production and E is total domestic expenditure This can be derived from the usual foreign trade definition as follows
Let M be total imports X the total production of exportables of which Xh is consumed at home and Xf exported so that
X = Xh + Xf
Y be total income derived from production of exportshyables X and of goods sold at home only H so that
Y - X + H
E be total domestic expenditure both for consumption C and investment I so that
E - C + I H + M + Xh
116
Foreign exchange earnings are a constraint on the process of 1
economic growth if (a) the elesticity of demand for the countrys
exports is close to unity or is less than unity so that a rise in the
quantity of exports cannot (much or at all) raise foreign exchange
earnings or if additional resources cannot be freed to flow into export
uses and if (b) the growth of the economy is dependent on the import of
strategic goods and services including capital goods intermediate inshy
puts and raw materials and also goods conventionally classed as conshy
sumer goods that are nonetheless necessary for growth Foreign exshy
change is assumed not to be significantly available through external
assistance
(continued from page 115)
Then the balance of payments (surplus or deficit)
B X - M
X-Xh-M
(Y-H)- (E - H) Y- E
But also total income is (conventially) defined as distributed between savings S and consumption C so that
Y = S + C and E I + C
So that B (S + C) - (I + C) or
B S - I
1Ronald I McKinnon Foreign Exchange Constraints in Economic Devshylopment and Efficient Aid Allocation The Economic Journal June 1964 pp 388-409 JoiFei and Douglas Paauw Foreign Assistance and Self-Help A Reappraisal of Development Finance The Review of Economics and Statistics August 1965 pp 251-267 Hollis B Chenery and AM Strout Foreign Assistance and Economic Development American Economic Review September 1966 pp 679-733
117
Domestic savings are said to be a constraint on the process of
growth if required (national-accounts-definition) investments are not
created by the economy in adequate quantity (Savings are not of
course a cowtaint on growth to the extent specific kinds of consumpshy
tion needed for growth are bottlenecks or institutional or other blocks
limit the usefulness of more capital goods These are major qualifications)1
There is no unique sequence of the two constraints nor is there any
a prior reason why either of the two constraints must have a finite termshy
ination data It may be that for some countries only one constraint is
binding then the other is never relevant
Limits on the availability of foreign exchange are (1) demand
oriented if the elasticity or position of the foreign demand curve for
the LDC countrys exports is the block The elasticity of demand for
the countrys exports may be near one or be less than one so that no
amount of output increase will increase foreign exchange earnings There
may be a problem of secular stagnant demand Price instability may be
the problem the prices of a countrys exports can fall for a number of
crucial years Technological change abroad sometimes threateas the sales
of LDC exports There may also be institutional barriers to trade -shy
tariff or non-tariff restrictions that prevent the LDCs from exploiting
fully their comparative advantage
A frequent cause of sluggish foreign demand is simply that exports
are priced too high in foreign markets The problem is a combination
of the exchange rate and of domestic price trends -- so that eventually
given the current domestic price level the exchange rate ove(-alues the
currency The policies involved may be forced by political considerations
or they may be unintentional or the result of inaction We assume what
is usually the case that demand for the exports of the given country is
reasonably elastic Then a rise in price to foreign buyers will decrease
foreign exchange earnings
1See our Research Paper 11 Investment Versus Growth summarized in part below in III-B
118
Alternately limits on the availability of foreign exchange are
(2) supply oriented if (a) the supply of exports cannot be readily exshy
panded or if (b) the supply of exports is so erratic or the quality so
poor that foreign markets find them unattractive
1 - Empirical Studies
All the specific causes of export earnings lag listed above are
relevant to Southeast Asian experience Three of the papers of this
Project relate to the over-pricing of exports I -- which appears to be a
thoroughly important possible error of policy or of omission of policy
We have surveyed above (Section I-B) the study in the Project2 of the
export lag of Southeast Asian countries in terms of compositional
effect and competitive effect We summarize briefly
We saw in Section I-B that the compositional effect is a measure
of demand deficiency the competitive effect is a measure of supply
deficiency or maladaptation The compositional effect is defined statisshy
tically as the difference between the growth rate for the Southeast Asia
kind of mix of exports into the More Developed Areas and the growth rate
of total imports into those areas The compositional effect therefore
indicates the extent to which Southeast Asia exports to MDCs are helped
or injured because they are like or unlike what the MDCs are importing
1Hla Myint The Inward and Outward Looking Countries of Southeast Asia and the Economic Future of the Region Research Paper 7 Feb 1966 KC Sen The Inward-Looking and the Outward-Looking in Southeast Asia Jan 1965 KC Sen Economic Growth and the Price Level -- an Analysis of Some Asian Data Research Paper 13 Mar 1966
2Seiji Naya The Commodity Pattern and Performance of Southeast Asias Exports to the Developed AreasResearch Paper 10 May 1966 The Southeast Asian countries include Burma Ceylon India Malaysia Singashypore Laos the Republic of Vietnam Cambodia the Philippines Thailand China (Taiwan) Hong Kong and the Republic of South Korea The developed countries consist of 20 countries in seven areas the US Canada Japan Australia the EEC the UK and other Europe Cf also the findings of Barend A DeVries The Export Experience of Developing Countries World Bank Staff Occasional Papers 3 1967
119
The competitive effect is the difference between the actual growth rate
of Southeast Asia exports to the MDCs (A below) and the growth rate of the
Southeast Asia kind of mix of exports to the NDCs (H below) The competitive
effect so defined is due to one or more of price quality and supply disshy
advantages or advantages as compared to MDC imports of the same kinds
The evidence is that Southeast Asia has been lagging behind in export
growth to the MDCs because of both effects Between 1956-57 and 1964-65
exports of the eight Southeast Asian countries covered fell behind the average
import growth of the more developed countries by 48 The competitive effect
contributed 16 to this lag the compositional effect 32
Exports of the Southeast Asian countries lagged partly because the
region was not on the average able to maintain its base year export share
of the various commodity groups even when the unfavorable commodity composishy
tion of its exports--mainly primary goods particularly foodstuffs and other
agricultural products--is allowed for Some countries did very well with
traditional primary commodity exports
The above study therefore denies the importance of demand deficiency
as a unique explanation of the regions relatively slow export growth
(2)Doubt has been cast on the hypothesis of demand deficiency to che
exclusion of supply considerations by other writers
Commenting on Haizels attempt 1 to demonstrate the demand deficiency
hypothesis Bieda maintains that the actual world trade figures reflect the
Supply effect and the Demand effect together and the two are inextricably
fused in the amount traded 2 He rejects Maizels thesis that the
process of industrialization per se did not have a retarding effect on
1A Maizels The Effect of Industrialization on Exports of Primary Producing Countries KYKLOS Vol xiv 1961 Fasc 1
2K Bieda The Causes of the Export Lag of the Industrializing
Countries A comment KY1OS Vol xv 1962 Fasc 2 pp 485-95
120
the development of exports from the semi-industrial countries He
gives two reasons for this rejection first resources can be diverted
industry as a result of forced industrializashyaway from agriculture to
tion reducing the exportable surplus of agricultural commodities and
second the protectionist policies of the LDCs might divert resources
in general toward the domestic market adversely affecting thcir exports
The generally more rapid inflation in the LDCs as compared to the MDCs
has tended to discourage production for export since domestic demand has
been strong and price competition abroad has been keen
(3) Manmohan Singh has provided data suggesting that for India the
important factor in explaining the behavior ofsupply lag has been an
He ascribes the lag to defective government policies with respectexports
to export duties and export controls that the Indian government followed
Table 28
Growth of World and Indian Exports
A B
Growth of Exports Growth of Exports
1948-50 to 1958-60 1951-53 to 1958-60
Tea World280
Indian110
World133
Indian26
Cotton textiles 179 45 148 97
Tobacco 372 113 252 - 28
Pepper 1444 287 718 157
Castor 200 287 45 22
iCf W Arthur Lewis in a Note (on an article by R W Lindholm)
in Social and Economic Studies March 1960
2Manmohan Singh Indias Export Trends and the Prospects for Selfshy
sustaining Growth Clarendon Press Oxford 1964 p 153
121
during this period Indices of gross profit in Indian industries
(Table 32) show that the large and flourishing domestic demand for new
manufactures stands in the way of exports
Table 29
INDICIES OF GROSS PROFITS IN INDIAN INDUSTRIES
(1950-100)
1951 1952 1953 1954 1955 1956 1957 1958
Engineering 1173 1249 1159 15714 2552 3052 3357 3539
Chemicals 1134 1059862 1066 1519 1764 2127 2355
Cement 1280 1289 1245 1501 1689 1549 1605 1775
Singhs general conclusion is that though there were adverse trends
in world demand it is fair to stress also overvalued exchange rates
export controls and increased domestic absorption as being in part responshy
sible for the lagging exports over the three plan periods (1950-51 to
1965-66)
The empirical evidence above supports one point clearly causes of
foreign exchange shortage may lie on the supply side as well as on the
demand side There is not reason to regard the supply deficiency as less
significant than demand deficiency in explaining the foreign exchange
bottleneck to growth in the LDCs
1Export controls were exercised on jute manufactures tea cotton textiles vegetables oilseeds and oils raw cotton raw wool coffee manganese ore export duties were levied on jute manufactures tea raw cotton raw wool black pepper cotton cloth manganese ore groundnut oil linseed oil cottonseed oil The period covered is 1950-60
122
(4) In a recent study Hollis Chenery and A M Strout examine the performance of 31 LDCs between 1957 and 1962 in terms of three
criteria investment saving and trade They define these criteria
as follows
Investment criterion Initially the rate of growth of investment must be greater than the target growth rate of GNP Thereafter the investment rate must be adequate to sustain the target GNP growth rate
Saving criterion The marginal savings rate must be greater than the target investment rate unless the average rate of saving is alreadyabove this level
Trade criterion Either export growth must exceed the growth tarshyget for GNP or the marginal import ratio must be substantially less than the initial average ratio 2
Of 31 countries studies 12 meet both and 10 meet neither of the Saving and Trade criteria for approaching self-sustaining growth (at a rate of 5 a year in GNP) Failure on the trade side seems to be at least as important as deficiencies in domestic saving and investment A
number of these countries --India Greece Turkey Chile Columbia
Costa Rica Boliva Guatemala and Honduras -- have been characterized by import shortages substantial excess capacity and in some even falling
saving rates
In the 12 countries that satisfy both the savings and trade critshyeria exports play a predominant role Of these 10 have export rates of 5 or more Conversely one of the most significant aspects of the
unsatisfactory performance of countries meeting neither of the two critshyeria is the stagnation of their exports Finally there is almost no example of a country that has for a long period sustained a growth rate
1Over this period Indias share of world exports has declined from 21 in 1950 to 12 in 1960 to 10 in 1966 The export-import ratio was 834 during the first five year plan 562 in the second and 580 in the third See Fourth Five year Plan of India (A Draft Outline)Government of India Planning Commission New Delhi 1966 pp 92-105
2Hollis B Chenery and AM Strout Forign Assistance and Economic Development American Economic Review September 1966 pp 679-733
123
substantially higher than its growth rate of exports through continuing
import substitution In the past Brazil Colombia Turkey and India
have done so for considerable periods but each has run into severe balance
of payments difficulties in recent years1
(5)There is no necessary reason why either the Savings gap or the
Exchange gap should have a termination date though that is of course
desirable for both Fei and Paauw analyze this problem at length
Fei-Paauw model of Foreign assistance and self-help consists of 2 3
five primary parameters and two scale factors They estimate these
values for 31 countries that received over 70 of United States developshy
ment assistance in recent years They observe that the termination date
for foreign assistance (as a proof of foreign exchange gap) is finite for
only 8 out of 31 countries The absence of a finite termination date for
foreign assistance is in most cases associated with a low per capita
marginal savings ratio Their final conclusion is as follows relatively
high values of the per capita marginal savings ratio are associated with
a finite termination date for foreign assistance In other wordr the
inductive evidence seems to indicate that with reasonable realistic values
of other parameters domestic austerity efforts involving a per capita
marginal savings ratio of about 35 are essential for fulfilling the selfshy
help criteria 4
1Ibid p 710
2Primary parameters (1) the initial average saving rate -- so) (2) the per capita marginal savings ratio -- (u) (3) the capital rate of population growth -- (r)
3Scale Factors (1) initial population and (2) initial gross national product
John Fei and Douglas Paauw Foreign Assistance and Self-Help A Reappraisal of Development Finance The Review of Economics and Statistics August 1965 Also Douglas Paauw and Forrest E Cookson Planning Capital Flows for Southeast Asia National Planning Association 1966 esp pp 38 follows Application to Southeast Asia
4 Ibid p 263
124
From the above it follows that first even if the per capita marshyginal savings ratio is high it will not help in narrowing the domestic savings gap if the values of other parameters are not realistic and
second that adequate domestic savings are a prerequisite to reducing
the foreign exchange gap
(6) In another study1 Paauw and Cookson find that of the six countshyries studied by them (Burma Indonesia Malaya the Philippines Thailand and Taiwan) the first two have no termination date for either the domestic savings gap or the foreign exchange gap the next two have a termination date for the domestic savings gap only while the last two have termination dates for both The period of projection covered by them is 1965-1975 and
beyond
In summary the studies above suggest that foreign exchange can be a binding constraint on economic growth In actual practice factors behind emergence of the foreign exchange constraint might lie in the overshyall absorptioi of the economy that is in its capacity to save The implication is that it would be of interest to study the effects of specific
growth-promoting policies of the LDCs on the domestic savings and foreign exchange gaps Regional cooperation in such studies can be useful
2 - Criticism
These savings-gap exchange-gap studies are valiant and commendable efforts to attach numerical tags to conditions for growth But the studies
have sharp deficiencies
Specifically (la) Some of the data are influenced by post-War II and by other war and crisis phenomena affecting prices and production The hope is that these aberrations will average out even though they certainly
Douglas S Paauw and Forrest E Cookson Planning Foreign CapitalRequirements in Southeast Asia The Savings and the Foreign Exchange GapCentre for Development Planning National Planning Association May 1965 (mimeographed)
125
misrepresent the secular trends for individual countries Earlier studies based on data from the first years of the 50s clearly had distortion
built in
(lb) Statistical errors in trade data are large (We discuss this matter in III A below) Errors in trade data for other LDCs must be also
substantial and errors where data have as partial basis financial flows
across borders are likely to be very large Errors in the estimates for
GNP are likely to be larger than those for trade flows and variations of GNP can be substantial for the most of the LDCs where agriculture is a major sector and can be affected for a year or several years by climate
pests and disease Unreliable data are used they are aggregated invalidly
(2) Even if the social accounts data were precisely accurate they measure variables that are related only partially to the causes and conshy
comitants of growth Part of investment as measured in national income accounts does not contribute to economic growth or does not contribute
within the time period under consideration parts of consumption are or
can be critical determinants of growth some growth does not require inputs
of economic resources at all (Our Research Paper 11 Investment vershysus Growth discusses these issues Some of its material is given in
Section III - B below)
In summary these studies use data that have d wide margin of error and whose concepts are only partially adapted to their purpose They anshyalyze only a modest part of the total determinants of growth and so require
implausible assumptions of other things being equal and other things
changing appropriately When the necessary qualifications are added the
significance of these diligent studies becomes very uncertain
126
III - Major Cautions on the Statistics
A - Inaccuracies in Southeast Asian Trade Data
1 The problem procedure
For a number of reasons trade statistics are considered to be among various LDC economic data the most reliable Foreign trade is a well-defined area in which goods move under the noses of customs offishycers Goods are supposed to be counted andor measured systematically for such purposes as the imposition of tariffs subsidies and other regulations In LDCs where foreign exchange is scarce particular attention is focused to the trade rector the single largest source of
demand and supply of foreign exchange
A check on accuracy is presented in the records kept by both trading partners which can be compared side by side Comparable double accounts are not usually available for domestic economic transactions
One countrys exports to another country should be roughly equal in values and identical in typesywith the imports of the receiving country In practice modest differences will result due to transport and other service charges timing lags differences and inconsistencies of classishyfication and transit trading The amounts of these divergence are rarely measured quantitatively Instead any differences in two records are usually assumed away or considered to be caused by the obvious factors especially the transport margin (cif imports and fob exports) For example M Michaely assumes away the discrepancy between two recordings in computing a given countrys geographically-weighted share in world exports The likely discrpoancy is recognized but dismissed
from casual observation one gets the impression that the element of error introduced by differences between the records of the exporting and impoitshying country is not very large2
IM Michaely Concentation of International Trade (Amsterdam North Holland Publishing Co 1962) p 135
21bid
127
For our region in a trade projection study made by ECAFE adjustshy
ment is made for the differences between values of intra-regional exports
and imports by attributing the difference to shipping and insurance 1
charges between the region and outside The freight and insurance acshy
counts in the balance of payments of a given country are often derived
simply by taking some percentage margin of its imports eg Malaya
used 89 and 65 of the cif imports from sterling and non-sterling
areas respectively2
For a study of the accuracy of the regions trade statistics we
selected data from Burma Ceylon Indonesia Malaysia the Philippines
Singapore and Thailand For each of these countries two ratios were
computed
1) Mij (is imports from J) to Xji (Js exports to i)
and 2) Mji (Js imports from i) to Xij (is exports to J)
where j is a given Southeast Asian country and i is js trading partner
The trading partner countries include both Asian and Developed Western
countries (approximately 30 in all) 1 and 2 are defined respectively
as the export and the import ratios of j country For most of these bishy
lateral or pairwise comparisons the average value of 1962 and 1963 trade
figures is used in order to minimize differences that can result from time
lags in the reports of any two trading countries3 For Indonesias exports
(import figures not available) and some minor cases of other Southeast
Asian countries only 1962 figures are used due to the lack of suitable
figures and comparable data for 1963
1United Nations Review of Long Term Economic Projections for Countries
in the ECAFE Region 1964 p 199
2Department of Statistics States of Malaya States of Malaya Statistics
of External Trade 1963 Vol 1 p 11
3The trade data are taken primarily from 1962 and 1963 issues of the
United Nations Commodity Trade Statistics and partly from the United
Nations Yearbook(s) of International Trade Statistics Data for some
minor cases are from the International Monetary Fund and International Bank
for Reconstruction and Development Direction of Trade a Supplement to
International Financial Statistics Annual 1961-1965
128
Standard deviations and t statistics were computed (Section 2
below) to assess the probability of a systematic bias in each of js
ratios Then F statistics measure whether or not there exists a
significant difference between the variance of js intra-regional trade
ratios and Js trade ratios with more developed countries In section
3 below the discrepancy in trade data is observed again after trade
values of each country are adjusted by the difference between official
exchange rate and the free or black market exchange rate Examshy
ination of the pattern of individual commodity trade statistics follows
in section 4
2 The Errors
The ratios of all pairs of recordings for every Southeast Asian
countrys exports (JjXji) and imports (MjiXij) are plotted in Charts 1
and 2 respectively Each ratio is marked by a lower case letter which is
the initial of J the Southeast Asian country Corresponding trading
partners are given on the horizontal axis (Absolute values of each
paired recording and the ratios for individual Southeast Asian countries
are given in Table 33) A dotted horizontal line is drawn on
each chart to indicate indentical values (the ratios = 10) of paired
recordings If bilateral pairs of recordings are accurate then the
ratios should be slightly above this line (perhaps usually 106 to 114)
since imports are typically valued at cif The diversion of the ratios
from the line measures the influences of obvious causes such as transshy
portation and other charges and of uncertain factors such as errors and
deliberate falsification
Conspicuous in both charts (and especially Chart 1) are the wide
dispersion and variation of the ratios Transport margins do not adeshy
quately explain the discrepancies Many ratios demonstrate flagrant
discrepancy with the higher figure of a pair 100 or more above the
lower figure Ratios for Indonesia reach as high as 4800 A surprising
number of ratios fall well below the dotted line in both charts--a
deviation in the reverse direction from what the transport cost margin
could explain for the region as a whole almost one-third of the total ratios
129
lie below 10 The discrepancy in these pair records that have ratios
less than one is larger than it seems on the chart The overstatement of Xji (or Xij) in relation to Mij (or Mj ) is proportional to the recipshy
rocal of ratios of MijXj (or MjiXij) between 10 and 0
Most of Singapores MijXj ratios can be piausibly explained Out
of 25 ratios (Chart 1) 22 are below 10 The plausible qualitative
implication of these low ratios is difference in labels not statistical
error Singapores entrepot trade is large and much of such exports
are not recorded as being from Singapore by her trading partners Simshy
ilarly Singapores import ratios MjiXij (Chart 2) are generally much
greater than one suggesting that countries exporting via Singapore as
antrepot often list those exports as going to the ultimate destination
while Singapore customs enter the goods simply as an import (only 2 out
of 26 ratios fall below one)
In Direction of Trade export and import figures for a non-reporting
country are derived by using a 10 margin as a norm that is if ratio
values for MX of 110 are accepted as reasonable a significance test
(the t test) can be applied to judge whether or not the average ratio
of each Southeast Asian country can be explained by normal statistical
error Data for each j country were evaluated separately since there is
considerable variation from country to counry We have assigned et~ual
weight to ratios of all paired recordings but have excluded ratios
involving absolute values less than $20000 in either X or M on the
grounds that small absolute errors can in these cases lead to large proshy
portionate errors The exclusions have eliminated most of the extreme
ratios Results of the significance test are given in Tables 33 and
34 for exports and imports respectively
A survey of Column 2 in both Table 33 and Table 34 shows that the
average ratios of HijIXji and MjiXij usually differ considerably from
the assumed norm ratio of 110 For half the ratios the deviation is
significant using the t test with the 5 criterion of significance
as the watershed the other half fail the criterion
Even for the former cases however it is difficult to accept the
notion that the average and the expected ratios belong to the same unishy
verse with differences due only to normal statistical errors A large
130
value for the computed probability (associated with a low t value) might
have resulted either from a small difference or from a large estimate of
the standard error--or both For example relatively satisfactory t
values shown for Burma Ceylon and the Philippines seem to have resulted
mainly from high values of the computed standard errors Espectally for
Indonesia little statistical meaning can be inferred from its t value in
view of the wild implications of the other two sets of statistics
Two exceptional cases out of 13 in all are consistent with aggreshy
gative trustworthy data Thailands export ratio and the Philippines imshy
port ratio I indicate satisfactory and acceptable results in terms of both
the average ratio and the estimated standard error (But for Thailands
import ratio and the Philippines export ratio the consistency does not
exist) Save for the two exceptions we can reasonably regard the
MijXjis and MjiXijs of these countries as random samples with respect
to the expected value of 110
1The use of the 10difference for the Philippines is not correct
since this country reports its imports at fob value (which is reflected in the low average import ratio 98)
i(4bO) CHART 1U568-7)16 (10 i9) patio of Trading Partners
(69) (9- 3) -(5-9) a- (68) Imports from Southeast Asia36) A 0 ) i36) i(4) Countries(I-) to Corresshy32)( 5
pond ing Exports of Southshy(-4 east Asian Countries(Xji+)a( -(3o0) p 3L(29) 1962-1963 Averages
b
iXj forp = biupb m
b Ceylon = t2bullo t pFed of
i halaya =M
= iIndonesia m Philippines = p
Thailand tm p tn tSingapore =s in~ t rb
0+ p t tb0n deg tPb
00 t --- ---------
--------------Op PC b
b pt t t
t
t____ tao __p___ r e1 )0
Countries(i)E D
c(661O)CHAIRT 2
2
t(36)
0(6o)
s(2L2)
b(60)t64l M(4) t-
os(22)Countries
) (28) m(30)
(7) b(27)
Ratio of Southeast AsianImports (M )
to Corresponding Expors of Trading Partners (Xi)1962-63 Averages
m(28)
2
On
at
b
P
9p
m
s
14s am
p
s
et
S
0
sPhilippin6s
8 b t
as
c mso8
MjiXij for
Burma CeylonFed of
laya
Thailand Singapore
= =
= = = =
b c
M
pt s
0
o 8P tb bullt 0
so S
P ~
b S
-f 8
a
go OP bba t i a t a t n t I
OC b t b brnb M- - 9
am OP R
Op Op
0
vi W
r
0 ca9 1A
+ ID 4shy
0 6
Trading Partner Countries~i)
133
A Test of Average Export Ratios (MijXji)Table 30
Assumming an Expected Value of 110
Average Ratio Computed Computed Value ofNo of
StandardTrading Part- (MXji) Standard
ners (i) Compared 1 Deviation Error
(5)(3) (4)Country (1) (2)
2081 Burma 20 1433 716 160
283 121221 1443 1295Ceylon 25 1143 405 081 531
Thailand 417 43082105 2165Malaya 27 085 -752942625 460Singapore 125 188861324 1336Philippines 5635 16952768110470Indonesia 24
Assumming an ExpectedTable 31 A Test of Average Import Ratios (MjiXij)
Value of 110
No of Trading Average Computed Computed Value of tStandardStandardRatioPartners (i)
Compared (MijXji) Deviation Error
(4) (5)(1) (2) (3)
254 1083121723 1375Burma 232 86622 1301 1086Ceylon 237326 1463 778 153
Thailand 150 2725 Malaya 28 1509 796
105 366752425 1485Singapore -110124 991 485 099
Philippines
134
The assumption of the 10 margin used above though plausible is
arbitry Transport and other service costs vary according to such inshy
fluences as value volume and type of goods traded and distance Accurate
information on these costs is not available But these costs even if
available and accurate could not explain the violence and directions of
the deviations shown in Charts 1 and 2 and the results of Tables 30 and 31
Our tests of trade data of Southeast Asian countries indicate frequent
and large errors But conclusions are less gloomy if we divide the MX
ratios into two groups
(a) their trade with other countries in the region and
(b) their trade with more developed countries (MDCs) including Japan
A statistical measure of the dispersion in terms of variance and F ratio
for individual Southeast Asian countries is given in Table 32
The import ratios for Table 32 show variances for intra-regional trade
(Column 1) uniformly higher than those with the MDCs (Column 2) Also
the import ratio values of F indicate that the probability of obtaining
values of F as large as those observed fails at the 5 criterion of
significance We conclude that the variances of import ratios for the two
groups of countries differ significantly
For the export ratios the result is slightly different Values of
variance and F for the intra-regional trade of Indonesia Burma Malaya
and Singapore are larger than those values for their trade with MDCs But
for Ceylon Thailand and the Philippines the variance with developed
countries is larger than that with Asian countries The F ratio for the
two latter countries is small enough however so that we can judge no
significant difference exists between the variances of the two sets of data
Ceylons F value indicates that the variance of its MDC trade is signifishy
cantly larger than that of its intra-regional trade But this high varishy
ance with the MDCs is to a great extent illusory since it is largely the
result of one untypically high MijXj ratio 6810 with Sweden When
Sweden is excluded Ceylons variance with the MDCs is 048 and is signishy
ficantly smaller than that with Asian countries
135
We conclude that data on Southeast Asian countries intra-regional
trade suffers from much more of discrepancies than data for their trade 1
with developed countries This finding encourages the use of MDCs trade
data to measure Southeast Asias trade with them especially whenever
data from Southeast Asian countries are not directly available
There has in recent years been rising interest in regional coopershy
ation among ECAFE countries The analysis presented so far implies that
studies of the benefits and costs of any integration scheme for the region
must rest on the shaky foundation of conspicuously wrong trade data The
shares of intra-regional trade surprisingly high for these countries save
for the Philippines vary substantially depending on which trade data are
used For example the percentage figure for Indonesias exports to less
developed Asian countries is 4142 according to the countrys data and
5436 according to that of its trading partners Similarly intrashy
regional import shares of Malaysia are 43807 according to Malaysia data
and 6432 according to partners data There also are many vexing cases
where a trade surplus (or deficit) in one recording reverses itself and
becomes a trade deficit (or surplus) in the other recording
1That MDC trade data show smaller discrepancies is evident in a frequency distribution we have made of bilateral ratios of exports and imports of the US Canada the UK the Common Market countriep and Japan with 14 MDC trading partners For almost all countries in our sample period 75 or more of export and import ratios for pairs of countries fall within the 90 to 129 range Most of the remaining ratios do not diverge much from that range Some error is suggested most clearly in the range below about 106 but not the wide errors of our LDCs
136
Table 32 A Test on Variability of Export and Import Ratios of Southeast
Asian Countries with Asian and More Developed Country partners
ImportRatio (M Xi) Export Ratio (Mi1X i)
Variance F Ratio Variance F Ratio
Asian Developed 1 2
12 Asian Developed 3 4
34 or 43
Burma 2798 295 9471 907 154 5874
(11) (12) (10) (10)
Ceylon 2581 (10)
033 (12)
78147 252 (9)
2861 (12)
13385
Thailand 1031 053 19505 148 160 1080
(14) (12) (13) (12)
Malaya 931 (16)
265 12)
3507 7722 (15)
379 (12)
20367
Singapore 417 (14)
076 (11)
5465 250 (15)
052 (10)
4801
Philippines 483 (12)
008 (12)
57003 284 (12)
484 (12)
1706
Indonesia - - - 1353010 2878 470136
(13) (11)
Note Computations are based on data given in Table 33 Ratios inshy
volving absolute values less than $20000 in either X or M are excluded
The numbers in parentheses denote the number of trading partners (i) considered
Each F ratio is computed by placing the larger variance in the numerator
137
3 Effect of Adjusting Trade Data by the Exchange Rate
The trade data of Asian countries (except Korea and the Philippines)
initially reported to world institutions such as the UN and IMF in domshy
estic currencies are converted by these institutions into dollar equishy
valents according to each countrys official exchange rate The conversion
though convenient may be a source of discrepancy since the official exshy
change rates of many Asian countries are over-valued The rates are mainshy
tained by exchange controls and trade regulations that encourage individual
exporters and importers to overstate or understate their reporting The
controls also encourage black market transactions
In order to observe how discrepancies are modified by the use of
more realistic exchange rates the trade figures of each country have
been adjusted by using the free or black market exchange rate of the
particular country Selection of the free or black market rate has
been determined by data availability -- this and the official rate genershy
ally are the only exchange rate information available Since the proshy
portions of free and official rates in which reported trade is initially
transacted are not known using the free or black market rate does
not by itself eliminate the arbitrariness in the exchange rate adjustshy
ment made here In the adjustment the conversion factor of the country
or the ratio of its official exchange rate to its free or black
market rate (average of monthly figures) has been multiplied by the dollar 1
value of the countrys trade Application of this adjustment is made to
all Southeast Asian countries and their trading partners (except the US)
1The monthly exchange rates as well as official rates have been
taken from 1966 Picks Currency Yearbook (New York Pick Publishing Co 1965) A 24-month average (1962-63) is used for the free or black market rate and a 12-month average where trade figures are available for only one year
138
The conversion factor that measures the extent of over-valuation of a countrys exchange rate varies--estimated as the ratio of the official rate to the free or black market rate--substantially in 1962-63 among Asian counshytries ranging from nearly I for Hong Kong Malaysia the Philippines and Thailand to low values for India (670) Ceylon (503) Burma (434) and Indonesia (118) for 1962 and 1963 For all MDCs there is some deviation from one the range being from 1090 to 915 (to 996 if Japan is excluded) 1
In general the ratios of bilateral recordings derived from the adjusted trade figures reveal a deviation from one greater than that of the unadjusted ratios Little difference from unadjusted figures is shown for the bilateral ratios of Malaysia the Philippines Singapore and Thailand with MDCs The results reflect the likeness of conversion ratios of the two groups of counshytries Greater discrepancies from the unadjusted ratios are observed in the ratios of Burmas Ceylons and Indonesias trade with developed countries For intra-regional trade deviation is greater compared to unadjusted results for every Southeast Asian country
Table 33 presents averages standard deviations and coefficients of variation for both export and import ratios using the adjusted data On the whole both averages and standard deviations are considerably greater than those given earlier in Tables 30 and 31 And all import and export ratios of the adjusted data (except with Singapores exports) are more widely dispersed around the average ratios than are those of unadjusted data as shown by the coshyefficients of variation This result holds especially for the import ratios (The unadjusted data coefficients are given in parentheses in Table 33)
1US data are not adjusted because the exchange rate of other countries is given as the price of dollars in terms of their currencies
Table 33 Averages of Export and Import Ratios Standard Deviations and Coefficients of Variation on the Basis of Adjusted Data
Export Ratio Import Ratio M X Xij
Country j Average Ratio
Computed Std Deviation
Coefficient of Variation
Average Ratio
Computed Std Deviation
Coefficient of Variation
1 2 3 (21) 4 5 6 (54)
Burma 3288 2189 666 (500) 1568 4758 3034 ( 885) Ceylon 2722 2632 967 (897) 756 661 874 ( 835) Thailand 1027 457 445 (354) 2939 6383 22172 ( 532) Malaya 1908 2090 1095 (1029) 2320 2500 1076 ( 528) Singapore 371 296 798 (926) 2401 2851 1187 ( 353) Philippines 1218 664 545 (459) 1860 3664 1970 ( 489) Indonesia 175195 221050 2940 (2664)
Notes The dumber of trading partners (i) is the same as that given in Tables 33 and 34 for each j countryCoefficients of variation given in parentheses are those based on unadjusted trade data and derived from average ratios and standard deviations given here and in Table 34
Ishy
140
4 Commodity Trade Statistics in Detail
The analysis so far has dealt only with totals for exports and imports
of given countries not with individual commodities One can expect the
discrepancies in data to be larger and more dispersed on a finer scale than
when we deal with totals Large differences in totals eg Xji and Mij
prove marked discrepancies in individual commodity items that make up the
totals But small differences in paired recordings do not necessarily reshy
flect similarity they may be due to the cancelling out of opposing errors
in the data for individual commodities
The Philippines is selected for two reasons to illustrate the discrepshy
ancies in commodity data For one reason this country is the only Asian
country that reports fob values of its imports in US dollars (theoreticshy
alli Mji should be equal toor very close to Xij) thus eliminating the proshy
blem of transport costs Also discrepancies in the countrys total exports
and imports are small compared with those of other Southeast Asian countries
(except Thailand) --- thus presenting a limiting case of only modest error
The commodities considered are nine groups of the one-digit Standard
International Trade Classification (SITC) excluding Goods Not Classified by
Kind Bilateral ratios of the countrys exports and imports with the four
largest trading partners are given by commodity groups in Table 34 Also
shown in Table 34 are the weighted ratios (SMjiSXij) and (SMijSXji) with
all trading partners (the four largest plus all others)
In bilateral comparisons of ratios for all totals that of the grand
total as well as of the major trading partners ratios are usually not far
from 1 (last column of Table 34) The individual commodity ratioshowever
exhibit wide variation The Philippines-US export ratios by commodities
for example vary from 1524 for SITC-8 to 0 for SITC-3 and SITC-7 (no values
recorded by the US positive values by the Philippines) whereas total
MijXji is a plausible 106 And when SMijSXji is 111 the commodity ratios
range from 1445 to 43 Similar dispersions hold for import ratios
Out of 178 bilateral export ratios of country-commodity recordings
(not shown here) 78 are less than 5 and 35 are greater than 20---uiider or
overstatement of XJi by more than 100 compared to Mij Similarly for import
ratios 70 out of 191 total are less than 50 and 26 are greater than 20
Philippine Export Ratios and Import Ratios by commodities withTable 34 I
the Four Largest and with all Partner Countries
6 7 8 0 R Countryi 3 SITC 2 0 1 2 3 4 5
Ratio Conr
93 98 105 0 1524 106109 126 85 0Export US
99 127 13957 181 125(MijXji) Japan 126 422 124 52 151
0 4009 - 030 122 41 0
49 0 0 126 Netherland
W Germany 139 1311 125 0 73
66 101 69 9698 500 204 114 125 100
Import US 71 82(MjiXij) Japan 97 26 101 121 91 82 74 87
93 W Germany 261 167 174 100 92 92 58
76 103667 125 120 105 101 102UK 107 72
43 90 128 106 426 1445 111110 148 108Export
(M ij5Xji)
All Partner 4
Countries
98 15 157 209 133 101 74 97 72 94 Import
(IMji AXij)
Computed from trade data for 1962 and 1963 given in United Nations ECAFE Foreign Trade Statistics of Asia and
the Far East Vol I No 1 and Vol II No 1 1965 and 1966 for the ECAFE countries and various issues of United
Nations Commodity Trade Statistics for other countries
2SITC commodities are Food and Live Animals (0) Beverages and Tobacco (1) crude materials excluding Fuels
(3) Animal Oils and Fats (4) Chemicals (5) Basic Manufactures (6) Machines and (2) Mineral Fuels etc Transport Equipment (7) and Miscellaneous Manufactures (8) 3For both ratios the countries are listed in descending order of Xji and Mji
4Twenty-six countries are included
142
5 Concluding Comment
There are a number of possible reasons for errors in trade data
1) Transport costs will as we have seen create a discrepancy between fob
export and cif import values 2) Different recording definitions are 1
used by different countries The entrepot trade of Singapore with other
countries of the region is as we have also seen not treated congruently
in their respective records And for specific trade commodities sub-items
may be differently defined and so be entered under different aggregated
headings Customs officers may have considerable discretion as where among
several plausible categories a given item should be listed
But the discrepancies are often so large that these innocent explanashy
tions plainly fail 3) There may be simple error in counting and recording
4) Countries with considerable tariffs and other trade barriers and with
poorly policed boundaries on land or extensive shorelines on the ocean
invite attempts to smuggle Smuggling enterprises in the Philippines are
said to be notably successful and Indonesia was like England made by
heaven for free trade 5) Customs officers may be encouraged by suitable
tokens of friendship to understate quantity and quality of imports where
these are taxed similarly for exports where these are taxed 6) The
major channel for illegal transfer of wealth between countries is undershy
invoicing of exports and over-invoicing of imports
The purposes of capital flight may be (a) avoiding taxation and legal
seizure of ill-gotten gains (b) avoiding the risk of taxation or confiscashy
tion of legally-gotten property (as of the Chinese in Indonesia in 1959-61
and later) (c) avoiding property destruction from domestic disorder or
from war (d) avoiding loss of value of liquid assets through inflation
(e) transferring funds for the care of relatives abroad or to meet debts
accruing abroad or to provide for ones retirement abroad These transfers
may be illegal under exchange control laws or difficult or likely to
lead to unpleasant questions about the source of the funds and whether all
taxes had been paid or simply to uncomfortable knowledge by the authorities
about ones asiets
1See R G D Allen and J Edward Ely eds International Trade Statistics (New York John Wiley and Sons Inc 1963) for detailed appraisal of international trade statistics and definitions
143
Much can be done by energetic customs administrations to correct the
causes of discrepancies numbered 2 and 3 above But 4 5 and 6 are
more resistant They will be less serious sources of error if tariffs and
other trade restrictions are lowered if exchange controls wane and a
economic development in general progresses and so probity and efficiency
improve 6 is a major source of error though the error will not be
visible in the statistics unless different documents are entered in the
exporting and importing countries It is said that in some countries a
10 to 20 percent misrepresentation of the quantity andor quality of traded
goods is normal In one case that has come to our attention a large export
from a Southeast Asian country was under-invoiced by 90
Errors in trade data are substantial and plainly can be overwhelmingly
large Of our original MX ratios imports and exports taken together
62 per cent well over half are in a range that is prima facie evidence 1
of error
For countries with high tariffs or equivalent bars to the international
movement of goods and with legal or other bars to the export or import of
capital substantial errors in trade data are likely to continue For some
countries -- those with inviting boundaries high hurdles to the movements
of goods or of capital and lakadaisical administration--the best guess
of an informed and conscientious outside student can be more trustworthy 2
than the official figures
1Taking 130 and 90 as tolerable limits to discrepancies 198 out
of 318 observations fall outside the range Difference in origin-classshy
ification is the only other significant explanation as not due to error
and may well explain descrepancies for Singapore
2Detailed statistics relevant to much of the discussion of the abive
pages are available in our full study
144
B Inaccuracies and misleading concepts in the standard national income statistics
We have been very concerned that in these pages conventional and misshy
leading interpretations of national social accounts and their sub-categories
should not creep in as they can so easily do to distort analysis and
conclusions
1-Errors in LDC social accounts
It is a truism that the social accounts of LDCs are less accurate
than those of MDCs The reasons partly lie in scarcities of skills and of
time a measure of the pressure of economic realities on the statistics
offices of the various countries governments give higher priority to other
uses of their funds and training resources (In one country of our region
the basic social accounts reported to the UN were developed in two weeks
by an available non-specialist) The methods of estimation and the diffishy
culties of estimation of macro-totals vary widely The accuracy of results
therefore varies considerably A general rule is that where there is inshy
centive to misrepresent the figures will be biased and where difficulties
of estimation are great random errors will be large
In most countries government reported tax and expenditure data are
quite accurate In other sectors errors increase Simon Kuznets a long
time research worker in the US on national income data some years ago
with his fellow workers once put down estimates of the estimated -ange
of error in three classes With an estimated error of under 15 basic
manufacturing and public utilities -- With estimated errors above 15
but below 30 agriculture mining manufactured gas pipelines trade
banking insurance and government -- With errors of 30 or more construcshy
tion water transport real estate direct service industries and miscelshy
laneous
What is the implication of Kuznets estimates of error for the range
of-error to be expected in LDC income data
Kuznets found the least error in manufacturing and public utilities
The first produces normally a small segment of total production in LDCs
and usually the second also Relatively large segments of productive
activity in lower income countries are in agriculture construction and
service industries All these lie in the 15 or more error clas3es
145
Where data are not written down accuracy suffers because respondents
genuinely do not know what the facts are Often accuracy suffers because
respondents are uncertain of the meaning of inquiries or because of the
demands of courtesy The average farmer knows only roughly what the yield
has been of crops not grown for sale His uncertainty may have a bias
added by suspicion that his answer will in some way influence the taxes
he must pay
It is difficult also to value output that is not sold in the market
In the LDCs much of what is produced especially in agriculture goes into
home consumption and not the market At the market place part of the goods
brought in may be bartered not sold for money
-- givenBut improvements in the accuracy of the national accounts
their concepts and detailed definitions -- have been proceeding steadily
And to some extent one can diminish the inevitable errorsin recent years
by averaging (as Kuznets does) using the average of 2 years or 5 to 10
One should avoid using as base periods years that are clearly abnormal
like the late 1940s and the early 1950s when adjustments to the ending
of World War II were incomplete or the early 1950s again when the Korean
War was causing sharp rises in primary product prices Studies of Southshy
east Asia trade and incomes are becoming more significant as these years
recede into perspective
the LDCs and specific-The application of the national accounts to
ally those of Southeast Asia involves special problems of interpretation
There is in LDCs more fusing of economics and social activities than in
the higher income countries for which the accounts were primarily designed
Separating out economics from the blur requires rule-of-thumb decisions
arbitrary at the margin
Also averages and aggregates in the social accounts can move mis-
They may for example rise because of higher production inleadingly
a few export industries while nearly all the population live as before
back in the bush away from port cities mines and plantations Still
worse as in Africa the indexca may rise as male workers migrate into
mining employment while back in the villages farming deteriorates -shy
-- and wives and children find family lifeunmeasured in the indexes
disrupted Some of this disruptive movement to employment and away from
families exists also in Southeast Asia
146
2 - Misleading categories for LDC growth analysis
But a further and more important worry inhibits our use of the national
accounts in Southeast Asia and in other LDCs as a measure and guide
for social policy and so as a guide to the economic effects of regional
integration
The basic concepts of the social accounts are astray from the purposes
of growth analysis The accounts were formulated and defined in the 1930s
and 1940s and are still dominated by the interests of those two decades
The over-riding interests of the times were the desire to interpret and
to shape policy on business cycles (the Great Depression and the World War II
and postwar inflations were concerns) and to classify production
(especially during the war years)
The particular special-purpose of social accounts is due in surprising
measure to Keynes and other economists with interest in cycle analysis in
the late 30s and in the 40s1 Keynes was unworried about the division
in the national accounts between consumption and investment because he
was concerned with the motives of groups of spenders Any reasonable
definition of the line between consumer-purchasers and investor purchasers 2
will serve us equally well provided it is consistently applied His
purpose was the analysis of unemployment and the business cycle
His light-hearted view on the social accouns is inappropriate if
ones aim is instead to understand the process of economic growth The
standard accounts were not focussed on and turn out to be ill adapted co
interpreting the growth problems of less developed countries The basic
categories of consumption and investment are misleading and partial when
applied to growth problems It is more usual than not for reasoning and
policy to go astray through assuming that one can analyse growth issues
in terms of the conventional national income categories
1General Theory Macmillan London 1960 p 61
2Edward F Denison Report on Tripartite Discussions of National Income Measurement Studies in Income and Wealth vol 10 Conference on Research in Income and Wealth National Bureau of Economic Research
New York 1947 Referred to in John W Kendrick Restructuring the
National Income Accounts for Investment and Growth Analysis Statististisk Tidskrift No 5 1966 p 354
147
For example the central problem of growth is conventionally portrayed
as extracting more (national income concept) savings out of an economy in
order that there can be more (national income concept) investment The
majority of academic and official discussions take this framework for
granted But in all economies this is sharply imperfect reasoning and
in LDCs it can be flagrantly wrong In low income societies a very large
proportion of the population possibly the great majority live at consumpshy
tion levels that closely determine the health and energy that in turn detershy
mine productivity Carl Shoup concludes there is a range of consumption
where the ratio of marginal products to increased consumption reaches the 1
order of 20-to-i to 80-to-l Increased food supplies -- calories and
protective elements both -- can be the critical requisite for increased
production More consumption can also offer necessary incentives
To the extent this effect is important cutting consumption in an
LDC economy (for example by higher taxes) in order to have more savings
for conventional investment can have the effect of reducing production
not increasing it
The crucial matters of the general health energy skills and incenshy
tives of the working population are completely neglected in the traditional
analyses focussing on national income consumption versus investment that
is they neglect human capital and various forms of social capital
nourished by consumption outlays
Nor is national income investment either locally or empirically
necessarily to be closely associated with growth Conventional capital
includes public buildings and luxury housing and prestige-orientated public
buildings Capital may stand idle or be used only one shift a day due to
lack of demand and effective organization There may be frequent holidays
and long weekends and frequent absences from work due to debility sickshy
ness and lack of incentives Scarcity of conventional capital need not
be an important bottleneck at allAnd sometimes a high priority route
to higher production does not draw on real resources at all for example
leisure time can be used productively
Where absenteeism from illness is due to too little consumption
and where childrens low consumption forces down their future productivity Carl S Shoup Production from Consumption Public Finance vol xx no 1-21965 pp 173-202
148
Our concern in this research project to avoid the conventional and
misleading uses of the standard national accounts in reasoning on economic
growth and its relation to regional cooperation suggests the possibility
of useful future research to improve the regional accounts so that they
can be more useful
A model that could be productively followed in improving the national
accounts of the region is offered in the work of John Kendrick of the Natshy
ional Bureau of Economic Research in New York Using US data Kendrick
has been experimenting with redefining social accounts categories so that
they interpret growth more effectively He does not go so far as to
estimate non-economic inputs that raise production He does add to
convenlional investment other uses of resources that increase productive
capacity
Parts of these are purchases of durable goods plus inventory change
of consumers and of government The rest consists of intangible outlays
(1) education and training
(2) medical and health outlays
(3) research and development
(4) mobility costs and perhaps--an optional item-shy
(5) costs of rearing children to working age
Much under these headings is usually classified as consumption
Kendricks total investment turns out to diverge widely from official
investment estimates This total investment is much larger its share of
GNP has grown as GNP has grown and it is more stable cyclically In 1965 1
his total investment is $422 billions or 380 of higher than the official
(gross) investment figure of $111 billions
1Excluding rearing costs If they are included total investment is $476 billions In the present official estimates gross investment is 16 of GNP Kendricks total investment is 47 or 53 of adjusted GNP dependshying on whether rearing costs are excluded or included
149
Kendricks work is a major advance toward shaping national accounts
so that they interpret better the process of economic growth Similar
work in LDCs specifically in Southeast Asia should be very fruitful
toward better reasoning on growth and so toward better policy Such efforts
could well be supported by international or national aid programs
To our knowledge it has not been attempted in LDCs save for a small
study in Singapore
Continued from page 148
Total investment as a share of adjusted GNP has risen from 38 in 1929 to 47 in 1965 The contrast suggests reasonably enough that the share of income a society devotes to future growth rises when income rises
A summary of this experiment-in-progress is given in John W Kendrick Studies in the National Income Accounts Forty-seventh Annual Report National Bureau of Economic Research June 1967 pp 9-15 An earlier fulshyler report is his Restructuring the National Income Accounts for Investshyment and Growth Analysis in Statistisk Tidskrift No 5 1966 pp 353shy365
See also our fuller analysis of this basic problem Research Paper 11 shyInvestment vs Growth published in Economic Development and Cultural Change April 1969
150
IV - NATIONAL PLANS AND REGIONAL INTEGRATION IN SOUTHEAST ASIA
To what extent have national plans had implications for economic inshytegration in Southeast Asia And to what extent have successes and failshyures in plan implementation had systematic relation to regional economic interest We seek to shed light on these questions in this summary section
A - Planning Patterns
Planning as a means accelerating economic growth has become a catchshyword and an orthodoxy 1 Whether a national plan is formal or eclectic its inevitable characteristic is multiplicity of goals all associated in
2some sense with nation building In those countries where formal
1At the national level the most striking event of the early nineshyteen sixties has been the widespread adoption of planning as a tool ofeconomic and social policy In the nineteen fifties relatively few deshyveloping countries had national plans for economic and social developmentthough numerous countries had elaborate medium term programmes for specificsectors or regions of the economy Since the turn of the decade howeveralmost all of the developing countries--often with the encouragement of national multi-lateral agencies concerned with international developmentassistance--have undertaken the formulation of medium-term or long-termplans as a means of guiding their current policy decisions Two majorevents occasioning this upsurge in planning activity were the achievementof independence by many African countries and the launching of the Alliance for Progress in Latin America A more fundamental and general cause howshyever was the widespread realization that the acceleration of economic andsocial development requires a more long-sighted approach to policy formushylation it has come to be understood that current policy decisions can nolonger be made simply in response to the circumstances of the moment buthave to contribute actively to bringing about the structural and institushytional changes which underlie economic development United Nations World Economic Survey 1964 pp 3-4
2As one strong instance of this we may quote the following We are neglecting our wealth purposefully because we are concentrating on nationshybuilding said Dr Subandrio ex-Foreign Minister and Deputy Prime Minister of Indonesia Straits Times December 7 1963 Quoted in Clair WilcoxThe Planning Straits and Execution of Economic Development in SoutheastAsia Harvard University Center for International Affairs Occasional Papers 10 January 1965 Economic development has not been the central concern of any government in Southast Asia ibid p 43
151
plans have been instituted--countries like India Pakistan and Malaysia-shy
the measurable role of the public sector in direct economic decision making
has been increasing over time1 In other countries where no formal plans
have been instituted the State systematically assumes responsibility for
promoting private enterprise In both cases the role of the State in the
economic life of the people has been increasing
1 Two Directions of Policy in LDCs
The two over-riding popular aims of economic policy making in the
LDCs are (a) diversification of exports and (b) import substitution2
Diversification of exports has seemed necessary to LDC policy makers
(in part wrongly - see Section I) because of alleged inelastic demands
for primary products in the world markets Import substitution has been
partly the result of foreign exchange difficulties and partly--this is
crucial--it is the expression of the urge to nation-building itself In
short planning for economic development has meant in the LDCs in large 3
part planning for industrialization
1For instance The share of the public sector (ie the government sector) has steadily grown in the Fourth Plan about three-fifths of all investments will be in the public sector Fourth Five Year Plan of India 1966-1971 Planning Commission Government of India p22
2R id development cannot be achieved in the future simply by conshy
tinuing the traditional pattern of economic growth The twin pillars of the Malayan economy rubber and tin will remain important for some time to come but they cannot be expected to contribute significantly to income growth First Malaysian Plan 1966-1970 Juala Lumpur 1965 p 6 The most important of the long term objectives (in Malaysia) is the need for economic diversification and industrialization Ibid p 15 although attempts will be made wherever possible to promote the growth of exports efforts to solve the problem (of foreign exchange) will probshyably have to rely mainly on import substitution Ibid p 16 If industrialization and diversification of the economy are to be rapid enough the country must aim at developing basic industries and industries which make the machines needed for further development Third Five Year Plan of India Chapter 2 p 27
3Both countries (India and Pakistan) tended to identify economic development with industrialization achieved principally through import substitution and without significant regard for considerations of comparashytive advantage Edward Mason Economic Development in India and Pakistan
152 2 Two Patterns of Growth in Southeast Asia
Two distinct patterns of growth are observable in Southeast Asia the Inward Looking and the Outward Looking The Inward Looking pattern--that ofBurma Ceylon India Pakistan Indonesia--has been generally characterized by() strict control of resource allocation through formal planning (ii)strict trade and capital flow controls and (iii) some disposition to nationalize foreign enterprises Recently Ceylon to some extent and Indonesia more emphatshyically have retreated from this pattern The Outward Looking pattern--that ofthe Philippines Malaysia Thailand Taiwan--has these characteristics in milddegree or not at all The Outward Looking group has followed relatively liberal trade policies and their exchange rates have been adjusted where needed to achieve equilibrium1
continued from page 151 (Center for International Affairs1966) p 12
Harvard University Press SeptemberReporting in 1960 the Food Agricultural Commission of Pakistannoted It is essential to appreciate how very recent is the sense of anyurgency for increased agricultural production Report of The Food andAgriculture Commission (Karachi Pakistan 1960) p 150
IPT Ellsworth has observed In the Philippines the price levelshowed no net upward movement until after 1959 from then to 1963 it advancedat an annual rate of about 4 percent A 60 percent devaluation in 1962 seemsto have been effective in overcoming any currency overvaluation that may havepersisted from World War II for exports responded vigorously in the followingyear Thailands inflation rate was approximately 5 percent per annum sinceexports increased at 64 percent a year (at about the same rate as GNP)there would appear to be little reason to believe the haht was overvaluedeven with a virtually stable exchange rate In Taiwan where inflation wasat an average rate of some 9 percen- a year exports were buoyant partlybecause any tendency for overvaluatin to appear was quickly offset by recurshyrent and substantial devaluation (1951 1953 1954 1957 and 1958) andpartly because import substitution or industrialization succeeded in openshying up lines of production that expanded from import substitution into exportmarkets Import Substitution Growth and the Balance of Payments SomeComparisons June 1967 Madison Wisconsin mimeographed
153
The Outward Looking group of countries have in the 1950s and 1960s
shown a better record than the Inward Looking Group with respect to rates
of growth of GNP productivity increases increase in import capacity (ie
income terms of trade) price level stability import substitution1
3 A Recent Trend
Recently there has been a growing awareness among the countries of
Southeast Asia--particularly the Inward Looking group--of t - importance of
the market mechanism in efficient resource allocation 2 Increasing reliance
is being placed on the following
1) Exchange rates not too far from equilibrium
2) Moderation of tariff rates and equivalent bars to imports
3) Selective encouragement of import competing industries and
4) Encouragement of exports
IHly Myint The Inward and Outward Looking Countrics of Southeast Asia and the Economic Future of the Region Research Paper 7 February 1966 K C Sen The Inward and Outward-Looking in Southeast Asia working paper January 1965
2The Plan places greater reliance on the mrket mechanism and fiscal and monetary policies instead of on direct consumption and discourage production so that over the longer run economic development is adversely affected Where it is necessary to retain controls their rationalization and simplification will be necessary Controls which restrict imports must be continued but the form of controls may be modified and heavier reliance placed on market forces The Second Five Year Plan of Pakistan 1960-1965 Planning Commission Government of Pakistan It must be remembered that excessive (exchange) rates could provoke undervaluation of imports dumping and smuggling defeating the very purpose of developshyment and growth Socio-Economic Development Program for FY 1966-67 to FY 1969-70 of the Philippines Manila Philippines May 1966 Indeed in the long run import substitution and export promotion will become harmshyonizing policies since new industries which spring up in response to local demand can later expand if they are efficient (our underlining) into export markets First Malaysia Plan 1966-1970 p 16 Similarly the Third Plan of Pakistan calls for a revision of the present tariff policy (which is highly protective and discriminatory) reexamination of the current interest rate structure and use of shadow prices for Lhe appraisal of at least the major projects in the Plan p 135
154
Several reasons may be given for this evolution in thinking overshy
valued currencies have discouraged exports while subsidizing imports
leading to adverse balance of payments restrictive import policies-shy
through tariff and non-tariff protection--have encouraged indiscriminate
import substitution preoccupation with foreign exchange saving as against1
foreign exchange earning has resulted in the neglect of exports excess
capacity in export industries has been a comnmon phenomenon
the attempt to save foreign exchange at any cost has led to a wasteful
use of domestic resources in the import-competing industries the total
real resource cost of every unit of foreign exchange saved is extremely
high the protectionist environment in which import substitution policy
is followed has contributed to inflation
This list of reasons for change implies disillusionment with past
policy but not a clear reversal The policy objectives in the LDCs remain
the same but there seems to have been a perceptible shift toward policy
instruments that depend less on bureaucratic discretion and more on the
market
It is being realized that import policy invariably affects the export
sector that the net effect on balance of payments is the result of import
savings and export earnings not just the former The importance of the
opportunity cost of resources is now being emphasized more than before
These changes of emphasis improve the prospects for regional cooperation
B- Planning in Five Countries A Summary
The following material summarizes briefly trends in planning as
indicated mainly in the published plans--which means there is a publicity
and political aspect--of five countries in Southeast Asia2
IThe Indian Third Five Year Plan document somewhat ruefully observed in 1961 that one of the main drawbacks in the past has been that the proshygram for exports has not been regarded as an integral part of the countrys development effort under the Five Year Plans Quoted in Mason opcit p 31
2Among the compact evaluations of planning in this area attention should be drawn to Clair Wilcoxs perceptive The Planning and Execution of Economic Development in Southeast Asia referred to above and also to the series of empirical reports in late 1968 and early 1969 by Hermann Hatzfeldt and mimeographed by the Ford Foundation regional office Thai Farmers Bank Building Bangkok See also our own Research Paper 5 Economic Planning--poiits of Success and Failure
155
1 Indonesia
Indonesia was not able during the early 1950s and emphatically during
the Sukarno regime to formulate and implement an effective development
plan In 1951 the government adopted an Economic Urgency Program the
objectives of which were to raise production of consumer goods to increase
the processing of domestic raw materials and to mechanize small firms
Some new factories were built but few continued to operate and few of the
small plants received or used new equipment A second plan was formulated
in 1956 It emphasized long-run economic goals calling for substantial
capital formation and projecting sources of financing However the plan
foundered on economic and political disorder Funds for development were
diverted to current expenditures Against this background the Eight Year
Development Plan covering the years 1961-1968 was drawn up
The new plan was a product of the National Planning Council an ad
hoc committee of representatives of regional and functional groups No
professional economists sat on the committee there was little of supporting
statistics or economic justification for the recommended projects in the
Plan It was intended to achieve several sometimes conflicting goals
There seems to have been little effort to weigh the costs and benefits of
such objectives as self-sufficiency in food and clothing which conflict
with the objective of efficient allocation of resources
The Plan was divided into A and B projects The former were to
contribute directly to national development the latter to provide domshy
estic revenues and foreign exchange to finance the A projects Some
recognition was given to the need to balance outlays and resources Howshy
ever the plan was confined to the public sector alone an economy-wide
balance was not attempted The needs for imports were understated proshy
jected exports were overstated the effects of inflation were ignored
Many of the A projects clearly represent undertakings that would be deshy
sirable for economic development Yet the failure adequately to analyze
their costs in terms of construction maintenance inventory replenishment
and resource allocation casts doubt on the micro-economic aspects of the
plan
156
No attempt was made to program outlays in such a way that output and
expenditure would increase together in order to reduce the rate of inflation
In 1967 and later under the new Suharto government Indonesia again
leaned to the West sought to check the rate of inflation and enlist the
energies of private enterprises in the service of economic growth The
new planning groun has drawn on able local economists a number of whom
were trained at Berkeley and Wisconsin and several groups of foreign
specialists In agriculture hopeful plans are being made to introduce highshy
yielding varieties of plants -- especially rice strains developed in the
Philippines that preliminary trials indicated can be adapted to
Indonesia The new varieties are very responsive to fertilizer inputs
and require an appropriate mix of other inputs and conditions including
adequate incentives to farmers It is likely that by 1973 the agriculshy1
tural picture in Indonesia will be widely improved over recent years
Planning in Indonesia is hobbled by shortage of reliable statistical
data and by excessive centralization rather than reliance on needed comshy
petent planning groups of high status within the Ministries and in the
regions of the far-flung and diverse cou- Land reform issues in
Java are important for the longer run so are those of cooperation between
the regions and the central government and between the technicians and the
military The possibilities of steadily improving the effectiveness of
the public administration are crucial2 Given these major constraints
the present plan seems to be a very good one
2 - Thailand
Most efforts of the Thai planning authorities have been concentrated
on the analysis of specific projects The development plan is still a
ISee Leon A Mears Guidelines to an Agricultural Strategy for Indonesia Discussion paper 68-27 Institute of Economic Development and Research School of Economics University of the Philippines August 1968 Also Everett D Hawkins and John A Richards Too Little and Too Much Rice Center for Development Working Paper University of Wisconsin August 1968
2Cf Hatzfeldt a cit esp pp 66-80
157
combination of sectoral programs and projects rather than an over-all plan that would balance the outputs of one sector with the requirements of another It also suffers like other plans of these countries from inadequate integration and from lack of tying together planning and governshy
ment financing
Thailand formulated its first National Economic Development Plan for the years 1961-66 a second for 1967-71 There was no attempt to achieve balance in development outlays and resources for the whole economy but an estimated balance of expenditures and revenues in the public sector was presented for each of the plan years In the first phase of the plan deveshylopment funds often had to be held in reserve due to a shoctage of approved projects More recently the staff of the Economic Planning Office of the National Economic Development Board has been increased
In both the 1961-66 and 1967-71 plans the government concentrates on provision of the basic infra-structure and maintenance of a favorable inshyvestment climate Emphasis is placed on rural development and on manpower training Regional planning and an attempt at achieving balance in econoshymic growth on a regional basis are undertaken The development nf manushyfacturing industry is left to private investment
The second plan provides for a Private Sector Planning Committee composed of representatives of private manufacturing trade and services which will identify investment areas of national significance to be conshytained in the Plan and recommend appropriate government policies Governshyment policy will shift emphasis from investment in state enterprises to provision of analysis and research services establishment of industrial standards and aid to small industry In this way the planning process will be broadened to include the private sector
Since its beginning in 1960 Thai central planning has become more comprehensive and more relevant to national possibilities It is technicshyally competent The deficiencies lie in the political sphere the planning
lacks authority its recommendations are in the main not carried out The need is for serious commitment to growth by the national political leaders
158
- Singapore
Singapore is a city-state so heavily dependent on foreign trade (and ou flexibility and efficiency in that trade) that any tight aggregashytive targets of GNP and export growth are unrealistic The government aims at infrastructure to increase efficiency and ability to adapt to changing circumstances and at social outlays to increase welfare and maintain polishytical stability There has been formal Planning with a planning group attached to the Prime Ministers office But the effort was not important and has been abolished Nevertheless Singapore has not like Hong Kong its parallel in many respects taken pride in non-planning and in nonshycollection of statistics
The Economic Development Board is the chief government agency focusshysing on the problems of economic growth It gives loans to encourage prishyvate industrial projects and participates directly in such projects The large Jurong Industrial Estate developed by the Board on built-up land west of the city contains many private firms in pioneer status encourshyaged by tax and other concessions The Estate is an impressive success all of its scores of industrial plots have been committed and more land is to be cleared for future expansion
The already considerable unemployment ia Singapore -- about 9 -- will be increased through withdrawal of British military forces by the end of 1971 The government is very concerned about the problem its strategy is major encouragement of foreign investment with some emphasis on the tourist industry which is labor intensive In general the tone of governshyment policy is eclectic and energetic there is reliance on encouraging private enterprise and on social welfare measures -- education municipal housing and other The government is committed to improving economic
research and statistics
Singapores eclectic approach leads to risk of inconsistency between the implications of the total of individual projects and over-all purposes and to risk of lack of vision on long run trends
159
4 - Philippines
There have been a succession of planning agencies and development plans
in the Philippines since the end of World War II But the plans have not been
put into effect
Responsibility for planning lies with the National Economic Council
The current plan the Socio-Economic Development Program for fiscal years
1966-67 to 1969-70 covers detailed government programs in agriculture and
in the development of infra-structure There is also detailed planning for
industrial development although principal reliance is placed on free entershy
prise The plan takes into account the effects of expansion in one industshy
ry on another Attempts are made to balance government developmental exshy
and to establish foreign exchange requirements forpenditures with revenues
sectoral programs and individual projects Timing of construction rated
capacity and financing of individual projects are specified
The industrial development program is designed to achieve the estabshy
lishment and expansion of basic industries such as iron steel and alumishy
nium chemicals wood pulp and paper food processing and wood product
industries Promotion of industrial research development of small-scale
industries and increased capacity utilization are also to be pursued The
goals are to be achieved through use of the governments direct allocative
powers and through public policies to channel private investment This
plan is said to enjoy more official support than have the previous deveshy
lopment plans But responsibility for implementing the plan still rests
with the individual ministries If there is not firm executive support
for the plan it -- like its predecessors -- is little more than a wishing
book
5 - Malaysia
Malaysian development planning is unlike that of the other nations
of Southeast Asia determined in large degree by the choices of people
throughout the cities and countryside The plans built on this solid
foundation have been carried out with considerable success Clair Wilcox
in hs summary of planning experience in Southeast Asia concludes Only
in Malaysia has (plan execution) been thorough and sustained
op cit p 33
160
Malaysian planning dates back to the two Malayan plans for 1956shy
1960 and 1961-1965 The latter describes general goals of development
growth targets and general programs bic gives little information on
specific projects Outlays for development are balances against the
resources available Industrial development is left to private entershy
prise with provision for public encouragement Public expenditures ace
made among broad programs with principal emphasis on agriculture
The Plan for 1966-70 continues the policies of the earlier Malayan plans extending these policies to Sabah and Sarawak Provision is made
in the new plan for substantial developmental expenditures in the latter
areas for government buildings survey and transport and communications
The government continues to leave the operational aspects of industrializashy
tion to private enterprise seeking to encourage both domestic and foreign
private investment This is to be done through manpower training policies
general stabilization of the economy development of infra-structure and
the provision of incentives
The Economic Planning Unit itself recommends capital expenditures so that the Plan and the budget are more closely related than in many countshy
ries The central planning agency has more influence on the capital budget
than does the Ministry of Finance Implementation is through the Ministry
of Rural Development headed by the vigorous Deputy Prime Minister to
whom full authority for development planning has been delegated Someshy
times the Rural Development Department has gotten ahead of the Plan and
inadequate pre-investment studies have led to difficulty in securing
foreign funds Few programming units (but more than in most LDCs)are
found in the operating departments Waterston praises the quality of
operations flow and the operations room approach for evaluation and reshy
porting (but attributes success mainly to executive pressure) Resources
available rather than requirements are emphasized as the starting point-shy
which may have resulted in a failure to stretch resources to the utmost
Resources for the planners include protective tariffs tax incentives
medium and long-term industrial credits loans to small industries indusshy
trial site development establishment of industrial standards and the undershy
taking of industrial research and apprenticeship and training programs
1Albert Waterston Development Planning--Lessons of Experience Johns Hopkins Press 1965 Malaysias experience is referred to at many places in this excellent volume
161
Development projects are proposed in the villages and municipalities
aggregated into district proposals screened at the state and federal level
and forwarded to the Economic Planning Unit which is responsible for formushy
lating the national plan Detailed reporting on the progress of approved
projects is required and frequent inspection trips are made to insure that
the plan is carried out Thus local participation and a combat-like operashy
tions procedure are combined
C - Multiple Objectives
1- Difficulties as seen by the planners
At the Bangkok conference of Asian Economic Planners in 1963 the
delegates were frank in citing difficulties they faced and the deficiencies
in their governments efforts to meet growth problems The external diffishy
culties they specified were unfavorable changes in terms of trade and in
the availability of external assistance As to domestic faults in economic
planning they cited (1) inadequate statistical data (2) poor coordination
among government planning and implementing agencies (3) lack of coordination
between government agencies and the community (4) unrealistic planning goals
and (5) failure to set priorities among sectors and projects
With respect to execution of programs they listed (6) scarcity of
adequately trained and motivated administrators and technical people (7) inshy
effective mobilization of domestic savings and (8) failure to stimnlat
private business and the conimunity to make their best contributioll to planned
development
These are then the conscious points of failure in economic platinin
in the minds of these knowledgeable planners The natural moral is Odat the
concerned administrator and technician should study how to correct tile Faults
and then do the correcting
An air of unreality hangs over such an analysis It assumes
that governments have maximum or at least rapid economic growth as
their central goal Neither the one nor the other is necessarily true
Economic growth is one only among a number of goals of government It
sometimes is not a serious goal at all Second any large organizashy
tion like a government or government department is subject to
162
administrative and ideological constraints on behavior that force it systemshyatically askew from efficiently achieving Its goals This theory of orror of large organizations holds for laissez-faire and communist governments and large private businesses alike and for their large departments and divisions also The existence of such systematic error is far from implying that government economic activities are not useful and necessary or that small private businesses are not subject to their own patterns of error
As soon as we accept the facts that governments have multiple goals and that bureaucracies function in their own characteristic patterns the evaluation of success versus failure in economic planning becomes a complex
problem
2 - The purposes of planning
We list and comment on briefly below first the economic goals and second the political and social goals of economic planning The latter turn out to be normally of major often of overwhelming importance The question then arises third of the extent to which the two goals are normally
coincident or in conflict
(a) Economic goals include the following
(I) Maximum rapidity of growth to be achieved within some given time horizon
(2) Minimum pressure on the standard of living
(3) Minimum unemployment and under-employment
(4) Minimum instability in economic life (5) Maximum shift of the rate of population change toward
an estimated ideal level in order to maximize income per capita
These economic goals are in competition with one another There is an administrative opportunity cost to each in that limited administrative resources devoted to one mean less available for the others They are also in more fundamental conflict Maximizing the standard of living is in conflict with maximizing the rate of economic growth higher consumption means less inshyvestment which often means a lower rate of growth Maximizing employment forces a choice of techniques that both immediately and through feedback
163
effects will diminish the rate of growth To maximize income one must seize
technical market and organizational opportunities as they appear but this
means more instability Effective policies to check the growth of population
may not be consistent with the location and occupation trends that will maxishy
mize total economic growth
Economic success must therefore be measured by a weighted index of the
subgoals
(b) As to the political goals The usual central preoccupation of any
governing group is keeping itself in power swelling its power if possible
The threat of loss of power may be remote permitshyand checking any decline
or it may be pressing leadingting considerable short-run freedom of action
tc urgent or desperate measures for survival
Means to the goal of maximizing political power involve strategically
(1) control of the military and police authority over taxation and the money
supply and control of general government and party administration (2) making
effective use of nationalist sentiments and (3) the weakening and dividing
winning over or possibly repressing and silencing of political opposition We
comment on each of these in turn
(1) Not much need be said about the first The functions of the milishy
tary are external defense and domestic order that is to achieve a credible
external posture and to put down the threat and fact of domestic disorder and
The threat of the military itself is parallel it may turninsurrections
against its own sponsors Complete control of taxation and the creation of
money is normally achieved with independence
(2) The implications of nationalism are more interesting Nationalism
is a major asset for nearly all governing groups and above all for those newly
The desire of governing groups to use thisindependent through force of arms
power for their own political advantage tempts them to oppose the foreigner in
They are impelled also to cater toconspicuous ways that are not too risky
They are likely specificallylocal religions customs and patterns of value
to support local economic orthodoxy whatever it is--private enterprise socialshy
ist communist cooperative or state-directed isolationist
(3)As to the political opposition governments that are insecure are
tempted--above all where the example of history is that of autocracy--to reshy
press expressions of dissent and independent criticism The governing group
may move abruptly or patiently and subtly toward the one-party state Illshy
fortune may more and more clearly await those who are discontented and show
164
it For those who accept the going orthodoxies and support the regime there will be the chance of political success and influence social success and
perhaps economic good fortune as well
Such a pragmatic listing has an unsympathetic air But it is meant to be only descriptive The desire for power and status is one of the deepshyest human drives found in all societies in all periods of history And party leaders may feel a non-selfish responsibility to their followers whose status incomes and perhaps personal safety depend on the continued strength of the regime Finally no economic or other program in fact focussed toward the welfare of the people of the state has much chance of success unless it is carried out over a considerable period of time--which means government
stability
In Indonesia in the early years after independence in the Philippines in recent years and in many another country effective economic planning has been vitiated by maneuvering for power among political leaders and frequent shifts of faces and policies Such government instability makes economic planning a frivolous exercise Whether one calls the pattern a failure of planning or a failure of direction is a matter of words
D - Spill-overs Plan Harmonization and Bilateral Agreements
1- The Spill-over Effect
The achievement of any kind of regional cooperation agreement or customs or payments union has deeper implications for the national economic policies monetary and fiscal of the member countries There is what Schmitt has called the spill-over effect of integration I whereby as in the case of the European Economic Community each step toward integration creates new needs and fresh demands to proceed in the same direction Thus with the OEEC as a beginning the Customs Union created pressures to integrate capital markets which in turn may eventually require currency unification for effectshyive functioning Currency unification in turn may imply pooling of sovershyeignties with a concomitant destruction of the separate identies of the partshy
icipating countries
IHans 0 Schmitt The Integration of Capital Markets in EuropeA Step Towards Political Unification World Politics 1968 Oesearch paper 6 in this Project)
165
There is no inevitability about this succession Rather the spillshy
over process implies the ultimate inconsistency of a customs union and the
political sovereignty of member countries In view of the resurgence of
nationalism both political and economic the less formal such cooperative
efforts are initially the more successful they are likely to be--which is
an implication for policy
The ECAFE proposal of the regional harmonization of national deveshy
lopment plans deserves specific discussion
2- The Regional Harmonization Proposal
The plan harmonization approach to integration is regarded by its 1
authors as an alternative to the classical prescription of free trade
It is defined as partial or comprehensive extension of national economic
planning to a regional or sub-regional plan for the allocation of productive
resources Sooner or later it should lead to the formulation of an investshy
ment and production program and policy from the point of view of the region
as a whole Trade liberalization is a permissive circumstance of plan
harmonization so that commodity movements will be a dictated rather than 2
a dictating factor in plan harmonization The plan harmonization approach
would replace national import substitution policies by regional or sub-regional
1Approaches to Regional Harmonization of National Development Plans in ECAFE Economic Bulletin for Asia and the Far East (December 1964) pp 33-81 Hiroshi Kitamura and Ajit N Bhagat Aspects of Regional Harmonizashytion of National Development Plans in T Morgan and N Spoelstra eds Economic Interdependence in Southeast Asia University of Wisconsin Press 1969 pp 39-58
2Two reasons are given one economic and the other institutional first it is said that liberalization by itself would increase trade only on the assumption of some elasticity of supply of internal resources in particular uses -- a condition that is often only dubiously satisfied in LDCs and second since almost all countries in Asia have resorted to some sort of planned approach to economic development a negotiated father than a spontaneous coordination of policies will be me meaningful Approaches op cit pp 37-39
166
import substitution policies that should have more specialization and larger1
scale and so greater chances of success Locational factors though imporshy
tant2 are subsidiary to the main elements in the harmonization approach the
widening of the size of the market and the avoidance of duplication of proshy
ductive activity 3 It is suggested also that in its earlier phases the
approach should emphasize the sectoral or the commodity approach on a
sub-regional basis 4 When once resource allocation over agreedareas of
specialization has been made and trade liberalization has taken place the
evils of nationally-based import substitution policies would be prevented
The focus of the plan harmonization approach therefore is the estabshy
lishment of a single region-wide investment and industrialization program
requiring deliberate changes in the production structure of individual
countries Such changes would be pursued along lines of specialization
jointly agreed on through negotiation The Approach is an ingenious and
highly institutionalized attempt to overcome foreign exchange shortages
to alter the existing pattern of the regions foreign trade and to accelshy
erate industrialization of the region as quickly as possible
IThe Approach warns against the possible dangers of non-operation of market forces of competition It suggests that appropriate safeguards will have to be devised to prevent the emergence of state monopolies and stateshyowned cartels and the loss of economic efficiency Furthermore suitable accounting and pricing procedures criteria for choice of techniques incenshy
tives to improve production techniques are relevant factors that will need to be examined Approaches2 p 43
2The location of the industries will be based on considerations
relating to the availability of material power techniques servicing facilities etc as to an equitable distribution of the industries among participating countries Economic Survey of Asia and the Far East 1963 pp 115-116
3It should not be difficult to devise joining industrial ventures at any (our underlining) location on the basis of some market-sharing agreeshyments Approaches op cit p 38
4The ECAFE Secretariat has in fact made some feasibilityor preshyinvestment studies in the fields of iron and steel fertilizers aluminum pulp and paper rubber jute and allied fibers and rice Approaches ibid pp 44-81
167
The Approach rejects free or freer trade among participating coutitries
as a means of ensuring efficient allocation of existing and future producshy
tive resources It is argued that enlargement of the market by a mere liftshy
ing of trade barriers is insufficien to expand intra-regional trade because
of the lack of complementarity of economic structure among the countries of
the region and because of the import substitution policies currently being
followed by those countries The countries require therefore radical
changes of resource allocation in a desirable direction which is assumed to
be one that would lead to an increase of new (rather than traditional) lines
of economic activity and to significant economies-of-scale It is contended
that the mere enlargement of the market need not lead toward new lines of
activity
Underlying the Approach seems to be an assumption that political hurshy
dles can be overcome by the lure of the considerable economic gain that the
venture will bring to individual countries--a gain achieved by cost reducshy
tions flowing from the growth of large-scale industries Furthermore it is
argued that in reaping the benefits of the economies-of-scale the location
of key industries does not really matter as long as the market is large
enough to absorb the increased production--only a larger market makes it posshy
sible to exploit the best technology
Several questions come to mind (1) It has been reasoned in a preceding
section of this paper that regional integration is accompanied by some trade
diversion from low cost to higher cost sources of imports It has also been
reasoned that such short-run losses would be offset by long-run gains arising
from dynamic elements such as internal and external economies and structural
changes This in fact is the implication of the Approach But it remains
uncertain that the Approach will bring about the necessary structural changes
(2) A number of pertinent problems such as the structure of industry
(competitive versus monopolistic forms) in member countries and their pricing
policies are hardly touched upon The relative absence of competitive
forces--in for example government controled operations and private cartels-shy
within the integrated industries may considerably reduce the economic gain
otherwise made possible A competitive environment is in part inconsistent
with the Harmonization Approach Nevertheless competition is imperative for
168
economic efficiency as even the champions of import substitution policies
eg Prebisch and Linder agree
(3) Besides the inter-country coordination of development plans there
is another problem of no less importance That is the unavoidable need for
bringing about changes in the monetary and fiscal policies of the member
countries consistent with regional policies in investment and trade
(4) For such a far-reaching proposal one would expect meaningful emshy
pirical work substantiating the economic arguments and spelling out a basic
set of formulas for the agreed specialization This work is conspicuous by
its absence The proposal does contain exploratory studies of seven indusshy
tries iron and steel fertilizer aluminum pulp and paper rubber jute
and allied fibers and rice Evidence of economies-of-scale comes from data
on other countries such as the US and France But due to difference in
the economic technical and social conditions of these countries as compared
with less developed Asian countries the comparisons may not always be jusshy
tified It is not surprising therefore to come across repeated references
to the unavailability of necessary data and to the need for further empirshy
ical research A positive proposal such as this needs more solid ground
to stand upon Once such an institutionalized arrangement is launched on
scale steering it in another direction would be difficult
(5) The harmonization of development plans is said to be feasible beshy
cause most countries rely on planning in solving problems of economic deshy
velopment This reasoning however seems oversimplified Planning means
something different from country to country In Malaya and Taiwan for exshy
ample economic planning is generally adopted to maintain the framework in
which economic activities are pursued by individuals and firms with a minishy
mum of government intervention In India Burma and Ceylon more of direct
control of economic activity is carried out by the government The fornmer
countries in view of the comparative success to date of their private enshy
terprise orientation may be extremely skeptical of an approach demanding
detailed and joint planning Also for Malaya Taiwan and Thailand the
foreign exchange gap has not been a critical problem the Approach directly
oriented toward region-wide saving of foreign exchange will not be espeshy
cially attractive to them
169
(6) Finally an obvious problem with the harmonization approach is
that it is likely to give rise to sensitive bargaining by member countries
for allocation to them of desirable industries--those with prestige and
those conferring military advantage Since trade liberalization follows
rather than precedes resource allocation the criteria of resource allocation are in constant danger of being distorted by national pressure
groups and national lobbying This risk exists in spite of pre-investment
and feasibility studies that will be made prior to settling upon the agreed
areas of specialization
One possible way out of the predicament is that institutional pressure
might be put on the prospective beneficiaries of a scheme through agencies
like the Asian Development Bank and the ECAFE Secretariat that are directly
involved in extending technical and financial help to promote two or three
nations or regional joint concerns International donor agencies involved
might make their help conditional on the recipient countries adherence
to the various criteria suggested in feasibility studies A certain degree
of institutional pressure within the framework of an obviously sound econoshy
mic rational should be suspected neither of partisanship nor of arbitrariness
3- Bilateral agreements
Quite a few countries in Asia have entered into bilateral agreements
with other Asian and non-Asian countries 1
1 For instance India has entered into bilateral trade agreements with Burma Ceylon Indonesia Nepal and Afshanistan See Sunanda Son Indias Bilateral Payments a nd Trade Agreeme nts (Calcutta Bookland Private Limited1965) Ceylon has similarly extensively used this technique for expandshying her trade During the 15 years period--between 1950 and l9i4--Ceylon entered into trade agreements with 24 countries including China India Burma Ceylon Egypt Australia Austria Japan See Karunatilkae fINSThe Impact of Import and Exchange Controls and Bilateral Trade AreenentS on Trade and Production in Ceylon in T Morgan and N Spoelstra eds Economic Interdependence in Southeast Asia University of Wisconsin Press 1969 pp 285-304
170
Bilateral trade and payments agreements are not in general a desirable
They are not a substitute for multilateral trade1
form of trade expansion
Though flexible between the contracting parties bilateral agreements reshy
strict the scope of trade especially when non-transferable bilateral credits
are granted This limitation however is not an unmixed evil in so Ear as
bilateral trade and payments agreements help toward utilizing surplus capashy
city in specific industries as well toward avoiding unnecessary duplication
of production By bringing into emphasis the possibilities of resource
and demand complementarity among contracting parties such agreements can
serve as guides for future action The detailed pricing and credit clauses
the integral parts of such agreements need not be far removed 2 wcrked out as
from prevailing conditions in the world market Trade preferences of which
bilateral trade and payments agreements are special case are potentially
as important among the LDCs as they are between them and the MDCs--but
in both cases the hope is that they are steps toward general freer trade
E - Some Conclusions 3
Despite their heterogenity the countries of Southeast Asia do share
a common aspiration they all want to build for themselves
IOften bilateral agreements are a symptom Df the inability of the contracting parties to sell in the open market
21n the case of the Regional Cooperation for Economic Development among Pakistan Turkey and Iran (July 1964) three commodities viz aluminum (to be supplied by Iran) banknote paper (to be supplied by Pakistan) and carbon black (to be supplied by Turkey) will be supplied at world market prices This would ensure markets without putting the buyers to any price disadvantage Kitamura and Bhagat 2p cit pp 26-27
3It is clear then that Southeast Asia does not constitute an economic region in the sense that all the countries in the region are more like each other than any of them is like countries in other regions in terms of the usual indicators of economic performance Benjamin Higgins Dominant Problems in Southeast Asia Planning A Western View The Philippine Economic Journal (Second Semester 1965) p 430
--
171
self-sufficient and politically viable nation states Realization of this fact is important in any move toward economic interdependence Economic
and political nationalism can be a friend of and stimulus to regional econoshy
mic cooperation
The accepted role of the State in planning economic development is therefore an asset of much potential value Realities of the situation
demand that regional cooperative endeavors promote national felt interests
Often this promoting will prove a subtle exercise in compromise along the pattern of the superb efforts of JeanMonnet in the earlier days of the
integrated-Europe movement
Pressure from international institutions is likely to be far more
effective than pressure exerted by individual countries from outside the
experience of political colonialism in the past has made countries wary
of economic neo-colonialism The external and regional framework necesshysary for objective and impersonal pressure does exist in the area already
ECAFE the Asian Development Bank and perhaps other regional organizations
that can render service And from the outside the International Bank group
and other United Nations organizations can be helpful
In no one of the national development plans of the countries of Southshy
east Asia however is there a mention -- direct or indirect -- of the
possibility of improving development efforts through the formation of reshy
gional groupings Nevertheless as evidenced from various inter-government
conferences held under the auspices of the ECAFE Secretariat there seems
to be an increasing awareness of the possible advantages of multi-national
efforts toward economic growth in the hope of avoiding the pitfalls of
autarchic policies
A proposal forcibly made by Benjamin Higgins is that there should be
set up associations of recipient nations to evaluate jointly the promise
of national and regional proposals and once proposals are underway to follow and check on their progress and efficiency There are political
advantages in having technicians from neighboring countries on committees
to evaluate costs and benefits-- in addition to technicians of donor countshy
ries and of regional organizations like ECAFE and the Asian Development Bank
172
V - Regional Cooperation in Southeast Asia --
Forms Policy
A - Taxonomy
I - Degree of formality and government commitment
Measures for regional cooperation can be classified by degree of
formality and government commitment Cooperative activity can go on
under either private or government auspices (a) The most informal are
occasional meetings of private societies in various countries and exshy
change of information advice and published documents Examples are
meetings of and exchange between technical and professional societies
literary groups cooperatives and political groups
(b) Occasional ad hoc meetings of government officials and groups
are a bit more formal These meet special problems as they arise
(c) There may be understandings or agreements to consult or regushy
lar meetings on matters of joint interest The Association of Southeast
Asia (ASA) composed of Malaya Thailand and the Philippines during its
active period 1961-1963 both held ad hoc consultations and maintained
continuing joint committees and working parties
(d) There may be commitments to take cooperative action on matters
of a public service type where provisions by one state of a service
useful also to others causes no decreased supply of the service domesticshy
ally Among these are research activities technical exchanges exchange
and television programs films artistic exhibit exchanges exchange
visits of specialists and of groups ASA carried on such exchanges The
173
UNs Economic Commission for Asia and the Far East (ECAFE) carries on
research in regional economic problems The Southeast Asia Treaty Organishy
zation (SEATO) has carried on research in tropical medicine ASA also
initiated some studies of the possibilities of such research The Associshy
ation of Southeast Asian Nations (ASEAN) set up by 5 nations in 1967
proposes many forms of regional cooperation Technical advice has been
supplied and programs of technical education undertaken by ECAFE SEATO
and also by the Colombo Plan (CP) and the Asian Productivity Organization
(APO) ASA again has done some planning in the areas The Asian and
Pacific Council (ASPAC) a regional group of nine countries set up in 1966
also proposes to carry on cooperative activities
(e) There may be significant commitment of resources in the joint
interest (I) of contiguous countries in individual fields like road or
river valley development The Committee for Coordination of Investigations
of the Lower Mekong Basin on which four bordering states are represented
(Thailand Laos Cambodia and South Vietnam) envisages this kind of joint
commitment (2) Resources may be contributed for regional purposes Coshy
operative deep-sea fishing and fish canning and the setting up of regional
air and shipping lines have been discussed by several organizations inshy
cluding ASA and ECAFE Several years ago ECAFE recommended setting up a
regional development bank now solidly in operation as the Asian Development
Bank at Manila There can be regional joint effort to conduct research and
explore the market for products like rubber coconuts and fiber and to
increase tourism ASA carried on some investigations in this area There
may be agreements to market cooperatively including cartel policies to
limit sales and raise prices In late 1968 seven Asian nations agreed to
form an Asian Coconut Community to improve production and marketing Standshy
ardization of products production research training of technicians and
market research were all included
In the meetings at Delhi of the UNs second Conference on Trade and
Development (UNCTAD) in early 1968 a common bargaining position was sought
by the trade union of countries from the different underdeveloped regions
on trade policies and commodity marketing agreements shipping rates and
the like The aim was to face the high income countries in a better barshy
gaining position
174
In the list above none of the forms of cooperation require abrogashytion of sovereignity that is there isno appreciable commitment to change domestic government policies
(f) But domestic policies may be altered by regional cooperation (1)There can be agreement to limit production of export crops in order to raise market prices as under the Stevenson Rubber Agreement of the 1920s Sanitary regulations may be agreed to be enforced in two or more countries (2) Trade can be encouraged between two or more countries of the region by joint simplifying and standardizing of customs regulations ECAFE has recommended such measures and ASA to some extent undertook to carry customs liberalization measures into effect (3) Trade can be encouraged within the region by lowering or eliminating tariffs and other trade barriers In 1963 ASA urged study of the possibility of setting up a regional free-trade area Several such proposals were made in 1968 (4) Would a free trade area in part or all of the region imply the need for agreement on the locashytion of given industries The argument for such a need is that duplicating investment should be avoided and so also excess capacity and high average costs because of small scale of production This line of reasoning in turn implies that major investments will be decided within countries in the main by government policy and that private decisions and competitive pressures should not or will not be effective in determining location growth and contraction ECAFE has been in the forefront in urging this kind of policy A 1963 ministerial meeting responded to an earlier economists report by accepting as an aim of policy the establishment of a customs union or free trade area within the region and agreed that national development plans should be harmonized in order to achieve rational location and size of new industries The 1966 Kojima and Miki plans proposed patterns for achieving regional free trade (5) There may be agreement for a regional payments union to cut the need for restrictions on intra-regional trade by deficit countries (6) The desire for stable trade and payments relationships exerts pressure toward coordinating monetary and tax policies so that prices will be stable or change at similar rates (7) There may be coordination of other economic policies and regulations There may even be mutually adjustshyed policies for political change
175
(g) Finally there may more or less be complete political union as
exemplified in the assimilation of West New Guines by Indonesia and in
the checkered history of Malaysia and Singapore
2 - Cooperation within the region only
Cooperation can exist only within the region ASA has fitted this
category So does the Lower Mekong Committee and so did Maphalindo
(Malaysia the Philippines Indonesia) Or cooperation can exist between
one or more countries of the region and countries outside The Asian
Development Bank set up in Manila fits this category The
Asian Productivity Organization has its nine members in Southeast Asia
and outside from Pakistan to Japan ECAFE has 23 Asian members in
Southeast Asia and beyond SEATO has Thailand and the Philippines and
also Pakistan and non-Asian members CP has 15 Asian members Afghanistan
to South Korea plus countries outside
3 - Other categories
The range of regional cooperation measures listed above in accordance
with their formality and degree of official commitment is only one pattern
useful for setting up alternatives One may list disregarding overlapping
(a) Regional projects that require the agreement of two or more
regional countries versus those that dont such as regionally useful
enterprises set up by one government perhaps with support from the UN
or other international organizations the US or other governments or
by private foundations
(b) Regional physical investment projects (the Asian Highway the
Mekong River Project) versus educational and technical projects (the Los
Banos Rice Institute APO the UNs Economic Research Institute at Bangkok
technician exchange agreements any well-thought-of educational or reshy
search program that attracts students from other countries of the region
This division parallels the economic theory issue over emphasis on conshy
ventional physical investment versus emphasis on human and non-material
resources for growth1
(c) Purely economic inter-government agreements (trade and payments
treaties) versus other agreements -- political cultural educational
research
1See Research Paper 11
176
(d) Arrangements with invidfous conoInic andor military implications
(SEATO trade or investment agreements leading to national location of iron and steel metalworking electronic chemical and like industries)
versus those that dont have them (eg educational and research projects with entry open to students from other countries and research findings
freely available)
(e) Organizations that have functioned (ECAFE SEATO ASA CP APO
versus regional proposals advanced (and broken up) for domestic or foreign political effect with little or no fur tion Sukarnos NEFO-- Neuly
Emerging Forces-- is an example of the Latter Maphalindo (Malaysia Indonesia and the Philippines) was hardly more than a slogan and senLishyment and was ended with Sukarnos campaign of confrontasi against malaysia
including Singapore ASA the Association of Southeast Asia composed of Thailand Malaysia and the Philippines carried on for a time after its founding in 1961 a number of modest and useful cooperative activities It was broken up by a Philippine claim to Sabah in North Borneo a part of
East ialaysia Its successor ASEAN the Association of Southeast Aian
Nations (Thailand the Philippines Malaysia Sip apore and IndoneiJa) launched in 1968 seems to be weathering a crisis over the same Philippine
claim
B - The Political Hurdles The bars to mutually useful regional cooperation in Southeast- Aia
have been much as elsewhere in the world primarily political And in large part the causes of such cooperation as has onc on have also ctin
conspi cuots1y poliical
h1aphalindo a purely politi cal vehicle died gclting born ASAs
imaginative efforis were halted by political [allin out Itetween Ma lyasia and th e Philippincs SEATO survives mainly because of its poliiica1shymiilary implications ()her organization (ECAFE AP3 CU) survive and ar effe Liv in large part because oF Con tinul Ollits ide support---ich is partly political-economic in motivation and only partly disinterested
177
There are here and there among countries of the region persisting
suspicions and antagonisms that cause them to be acutely sensitive to the
political and military aspects of regionalism These sensitivities will
continue in varying degrees into future years New sensitivities may arise
And basic policies differ Burma and Indonesia (and India to the
west) have been inward looking relying on direct controls and checking
trade Indonesia after its 1965 crisis has become less inward Malaysia
Thailand the Philippines (and Taiwan) have been outward looking
choosing to rely more on private enterprise and relatively free trade
The political differences and sensitivities imply a moral Outside
encouragement to regional cooperation measures have the best chance of sucshy
cess when they achieve a net maximum from two goals contribution to the
obvious economic and other advantage of the region and intra-regional polishy
tical neutrality and colorlessness The avoidance of political suspicions
and antagonisms is an absolute requisite
In the list at the beginning of this section effective measures
listed under (a) (b) (c) and (d) informal and requiring little resources
and frequently politically colorless are a better bet for survival than
equally effective measures listed under (e) (f) and (g)
C - Guidelines for Policy
Unqualified conclusions cannot validly be drawn from facts analyses
and evaluations with as many aspects of uncertainty as those surveyed in
this study But we do need guidelines for policy--guidelines that are
neither unduly vtgue in view of what we know nor unduly positive in view
of what we dont
The United States concerned with encouraging for their own benefit
cooperation among the countries of Southeast Asia could do worse than conshy
sider seriously as a guide to policy the two key provisions of the highly
successful Marshall Plan of 23 years ago (1) International cooperation was
proposed for planning and carrying through programs to solve some one obshy
vious problem while the nations concerned could remain at odds on other
matters that were to be set aside for the time (2) The US would pledge
good will cooperation and a share of goods and capital to make the plan
work
178
The countries of Southeast Asia have a diversity of background and of
experience with economic development Any meaningful approach to cooperashy
tion must be based on and proceed from their backgrounds and experiences
Among the domestic political aims that have first priority nation buildshy
ing takes high place It may be a costly goal and dream but it is highly
cherished Nationalism is a central fact Hence any attempts at regional
cooperation must bo viewed as subordinate to the major theme of nation
building How can nations and their elites consciously gain as individual
units through regional cooperation
The more formal proposals would compel the countries of Southeast Asia
to redefine some of their national goals and modify some national policies
The viability of such proposals is therefore very doubtful
In contrast less formal attempts and partial measures may soften
the edge of nationalism And in time the experience of varied individual
forms of cooperation and we hope the discipline imposed on diverse ecoshy
nomic policies by success and failure causing convergence of those policies
can lead to a deepening sense of regional identity and hence willingness to
deepen and broaden regional cooperative ventures
179
VI - Summary and Implications (Implications for foreign assistance policy are starred)
1 - Southeast Asia like other LDC areas should have comparative adshy
vantage in manufactures with relatively low levels of productivity per
employee and with relatively low value added both from labor and capital
components These manufactures are in general textiles and clothing wood
products furniture leather products miscellaneous and other narrowly
defined groups Exceptions to this generalization arise significantly from
management and local skills differences Also climate soil mineral deposshy
its and other local resources can give advantage in special primary products
and other local resources can give advantage in special primary products and
to rubber wood and cork manufactures and iron and steel products
2 - The region as a whole has been doing badly in its exports to MDCs
While 1956-7 to 1964-5 total imports of MDCs rose by 76 the regions
exports to them rose only 28 Two-thirds of this lag is due to a negative
composition effect--that is the region has a high concentration in primary
product exports that have been expanding slowly in the world market One
third of the lag is due to a negative competitive effect--that is the
region was being outcompeted in the kinds of goods it did export
3 - The best performers with respect to export sales are Taiwan (+281
in this period) Thailand (+82) and the Philippines (+63) The poorest
performers were Indonesia (+3) Burma (-6) and Pakistan (-8) The main
explanation of this wide divergence in performance is the competitive effect
Good performers typically did well in a wide variety of commodities and vice
versa The commonly held view that countries with concentration in primary
exports perform poorly is not supported in our data Thailand and the Philshy
ippines have done very well despite high specialization in primary products
4 - One tentative induction or hypothesis to be drawn from these
data is that export success and failure which is closely correlated with
general economic growth trends is influenced in major degree by the extent
of over-valuation equilibrium or under-valuation of the exchange rate of
a country Furthermore it is implied that efforts to compensate for the
frequent over-valuation (by various forms of export subsidies and import
price adjustments) are inadequate because of administrative costs and adminshy
istrative weaknesses that are characteristic of LDCs and political presshy
sures and uncertainties that are characteristic of all countries
180 5 - The confirmation of this hypothesis would imply that regional coshy
operation to shift disequilibrium exchange rates toward agreed-on equilibshyrium levels could have highly beneficial effects toward speeding up economic
growth
6 -The share of intra-regional trade of these countries varies widelyfrom 79 for Laos to 57 for Singapore and 507 for Burma to 6 for Ceylonand 4 for the Philippines Most countries show a recent decline in this share (for Hong Kong because its external trade has been growing fast) Pakshyistan Korea and the Philippines have had rapid increases in their intrashyregional trade The countries performing poorly in intra-regional trade are those with negative competitive effects
7 - Protectionism in the region as it is in the world generally is relatively high on manufactures and specially high on more complex manushyfactures Hence less developed countries are specially handicapped in trying to expand sales abroad of manufactures which they judge to have feedback and dynamic advantages to them in training of skills improvement of organishyzation and capital formation These dynamic effects justify much attention (14 below) Though not amenable to quantitative estimation they are the mainly important potentialities from a regional preference or freer-trade
arrangement
8 -The effects of quantitative restrictions and of tariffs toward checking trade and distorting the structure of production is best measured not by the nominal in-the-books tariffs and equivalent levies but by theeffective protection the restrictions produce Effective protection reshyfers to the effect of the regulation or duty on (a) net value added by the producing firm or alternately on (b) its rate of profit
In general in this region quantitative restrictions appear to be moreimportant than tariffs There is a wide range in the amounts of restrictionshyism among the countries The Philippines was recently the least restrictive administratively but often imposes the highest tariff duties of all the
countries
9 - Protectionism is a much sharper bar to economic growth than it seems effective protection is erratic and is in general far larger than the rates in the tariff codes The chance therefore of gains in efficiency from lowered trade barriers is great this goal might well be approached on a regional basis
181
10 - Our analysis and sample calculation indicate that a typical Southshy
east Asian country would suffer little reduction in tariff receipts from
entering a regional free trade area Tariff reductions would probably occur
gradually over some years so that any revenue loss would be similarly spaced
out
11 - Major candidates for attention in Southeast Asia as promising prodshy
ucts for negotiating lower trade barriers are a long list of manufuctures
that have recently been showing very rapid growth rates (from 14 to 49 a
year) in lower income countries Among them are aluminum musical instruments
watches and clocks sanitary plumbing heating and lighting fixtures travel
goods handbags glassware toys games scientific etc measuring and conshy
trolling equipment and food preparations
12 - Among these are many products for which economies of scale are imshy
portant Hence efficient producers might well be able to compete and expand
successfully in a regional market though they could not survive save with
burdensome protection in one (small) country market Here is logical space
for regional agreement toward freeing trade
13 - It is sometimes argued that regiLnal LDC trade is a will-of-the
wisp because ey all produce the same ching This view is mistaken Sucshy
cessful economic growth is characterized by the opening up of small but
swelling niches of comparative advantage which can gradually build into a
large and complex network of Lxchange
14 - Among the potential dynamic gains from regional or wider-area
shifts toward freer trade the effects on resource supplies and productive
efficiency are crucial for example simplification and standardization enshy
couraged through producing for a larger market emergence of new industries
out of the specialization encouraged by large scale production and from more
contacts development of skills and entrepreneuring abilities in one industry
that are useful in others and better commvnications (a road or railroad deshy
veloped for one business can be used by others)
A regional scheme should be specially solicitous toward freeing trade
in kinds of production that have the most feedbacks Attempts to secure
these efficiencies by protectionism invite the blockage through rising costs
that has been weighing down import-substitution policies in recent years in
Latin America and elsewhere
182
15 - The trend of world trade since 1900 and also recently reinforces
the argument that LDCs should seek to up-grade their skills organization
and technology as urgently as they can Commodities with low skill-andshy
capital requirements have been making up a falling proportion and those with
high skill-and-capital requirements a rapidly rising proportion of world
trade as a whole The value of food and raw materials exports of LDCs has recently been riming at less than one-fifth the rate of growths of manufacshy
tures
The relatively rapid growth of LDC and Southeast Asian manufactures exshyports despite relatively high tariff protectionisms against them in the world
offers a useful opyortunity With less protectionisms through regional or
other agreements manufactures exports would grow still more rapidly
16 - One specific form of US encouragement to regional freer trade
measures might take the form of trade preferences extended by - US on conshydition of reciprocal lowering of Southeast Asian barriers within the region
The extension of such pieferences by the more developed countries especially
the US would meet the official and emphatic wish of the LDCs--which is
more firmly rooted in fact and analysis than the usual arguments have conveyshy ed The United States has already formally accepted the general concept It
might well be in the forefront of exploring the practical issues invclved as a step toward lower regional trade barriers and perhaps lower trade )arriers
generally
17 - Useful research contributions to regional cooperation can be made through continuous studies of comparative advantage within the region The
effort would be to discover what products promise the best stimulus to growth
through contributions both of current efficiency and of dynamic feed-back
effects that traditional exports often have failed to provide
In our own research we have made a modest venture in this direction
External assistance could support such studies
But even this policy is limited and hobbled by uncertainties of data Without correction of existing sometimes flagrant errors standardization
more appropriate definitions and further refinement in the regional economic
data now collected assessment of the consequences of any specific industry
expansions is very uncertain (See 19 and 20 below)
183 18 -A regional payments union though in general attractive as a means
of economizing foreign exchange offers only very modest gains in Southeast Asia The reason is that trade within the region is highly unbalanced there are heavy creditors and heavy debtors The unbalance exists both in the short-run (in quarterly data) and in the longer run (over a recent 8-year period) There is little reason to expect that the regional creditors (Thaishyland Indonesia Cambodia Burma) will be willing to extend long-term credits to the regional debtors (the Philippines and Malaysia-Singapore)
However the payments slumps that will result from the prospective endshying of the Vietnam War offers a useful opportunity for regional cooperation in forecasting the dislocation problems by countries kinds and amounts and for proposing offsets External assistance could support such studies and the formulation of proposals perhaps assisting other regional organizations like the Asian Development Bank in that work
19 - All quantitative judgments on the effects on trade in Southeast Asia of policy changes cooperative measures and normal growth rest on the foundation of existing statistics We have tested the accuracy of trade statistics of seven countries Burma Ceylon Indonesia Malaysia the Philshyippines Singapore and Thailand The basic method is to compare total imshyports reported by each of these countries for the years 1962-63 with exports from it reported by its trading partners The partners were 29 countries within the region and developed Western countries Similarly exports reportshyed by each of the seven were compared with imports reported by its trading
partners
The import-to-export ratios vary widely Many display flagrant disshycrepancy with the higher figure of a pair twice or more the value of the lower Of the ratios for total bilateral trade 62 per cent have a discrepshyancy wide enough (taken as below 9or above 13 where 11 is in the neighshyborhood of a normal expectation) to present a firm presumption of error The use of free or black market exchange rates does not alter these findings
We conclude that quantitative conclusions resting on available trade statistics even with the special cases of entreport economies (Hong Kong Singapore) and of Indonesia allowed for are resting on feet of clay For countries with high tariff or other barriers to trade or with legal or
184
other barriers to the flow of capital substantial errors are likely to conshytinue Since the statistics will emphatically not sustain much of quantitashytive conclusions we are compelled mainly to qualitative judgments
20 - Even more basic worries pertain to the national income statistics including specifically their savings and investment components (a) Their margin of error is probably large (but not checkable as with trade data) for one main reason because agriculture is a major sector of the LDC econoshymies and because the uncertainty inherent in estimates of farm production is greater than that for most other economic sectors (b)More important the concepts of the standard national income accounts have been shaped especially in the 1930s and 40s primarily for business cycles and classification-ofshyfinal-product purposes--and not for separating out the uses of resources that do and do not lead to economic growth
A major effort toward redefining national income aggregates especially consumption savings and investment so that they fit more adequately the purposes of economic development analysis carried out for US data by John Kendrick of the National Bureau gives an estimate of total investment
nearly four times the official estimates
This more useful approach from the conditions-of-growth point of view when applied to the national accounts of Southeast Asian LDCs implies that the effects of regional cooperation measures on for example savings and investment would shed only modest light on the probable changed rate of growth We do not attempt such estimates
It would be highly useful to re-estimate Southeast Asia national income accounts along the lines pioneered by Kendrick AID might well support such
efforts in the various countries of the region
21 -National economic plans inevitably have multiple goals of which economic growth is only one Two policy patterns exist in the region the Inward Looking countries (Burma Ceylon India Pakistan Indonesia until recentshyly) tend to plan strict resource allocation control trade and capital flows and often nationalize foreign enterprises The Outward Looking countries (the Philippines Malaysia Thailand Hong Kong and Taiwan) have these charshyacteristics in milder degree or not at all The latter group have had a better record in growth of GNP productivity increase import capacity growth price level stability and import substitution
185
22 - Plans in the region often suffer from lack of government firm inshy
tention to execute them and from shifts of government faces and poi1ies
The Malaysian effort alone has won praise for its evoking of felt wants in the villages and towns incorporation of plans in the government budget and
vigorous execution
23 - In none of the Southeast Asian national development plans is there
reference to the possibility of accelerating development through regional cooperation Outside agencies foundations and donor governments can often
be helpful through directing attention to regional group activities and polishy
cies that can further national aims
24 - The planned harmonization of national investments and economic policies into a regional pattern faces di ficult and sensitive negotiation
problems on the location of prestigious and militarily iiportant industries
The proposal suffers so far from lack of emphasis on competitive efficiency and from knowledge of the amount of economies of scale that can be relied on
(data used have come primarily from distant high income countries) Detailed
studies of local economies of scale could be useful and might be supported
from outside the countries
25 - The range of kinds of regional cooperation is very wide varying by degree of formality and of government commitment by the extent to which
they may involve countries outside the region by the extent to which real resources are involved and external economies to one nation are present by the extent to which non-economic matters are involved and specifically by the extent to which there are political and military implications
26 - The bars to continuing mutually-useful regional cooperation in Southeast Asia even more than elsewhere in the world are primarily politishycal The problem is shown most vividly in the Maphalindo ASA ASEAN sucshy
cession of attempts at co-operative activities Fairly basic policy differshy
ences are likely to continue and also to appear and disappear at intervals An election in the offing can persuade candidates for office to stir up
nationalistic sentiments joint danger can draw countries together
27 - Individual proposals for regional activities require individual
cost-benefit analyses--whichpwith all their difficulties and inherent unshycertainties of valuation are indispensable International agencies and
national donors can usefully support such cost-benefit analyses
186
Ad hoc and continuing groups of technicians of countries of the Region
might well be set up to evaluate the promise of national and regional proshy
posals including those that could be financed by individual donors and by
the ADB etc and to follow and check on the efficiency of projects once
they are started Such coiittees or associations might be supported by
AID Any cost-benefit studies of regional industrial possibilities need to
consider both current efficiency (comparative advantage) the dynamic feedshy
back effects on skills organization values and social changes and
capital formation
28 - One general presumption gives a useful rule-of-thumb for initisl
evaluation of proposals Projects that expand production andor productivity
have an obvious presumption in their favor Projects that seek higher money
returns through checking production andor productivity (for example comshy
modity agreements to limit output) are highly suspect They of course deny
the basic nature of economic progress which consists of increasing producshy
tion (- real income) They carry inevitable administrative burdens--and
administrative efficiency is a major LDC problem Their intent is apt to be
frustrated 5y the obvious the subtle and the manifold inroads of competishy
tion both from other producers of the same product and from substitutes
both in the short run and the long run
29 - Regional cooperation measures may well have their greatest beneshy
fits through an indirect influence Southeast Asia appears to distant peoples
to be a tolerably homogeneous area It is in fact widely heterogeneous in
the relevant aspects of history culture mineral resources soil fertility
population density exposure to the West and to modern technical methods
and local patriotisms and antagonisms
Such contrasts have historically proved to be opportunities the coshy
operative mixing of peoples of diverse backgrounds has repeatedly in various
parts of the world been a mutual stimulus to practical achievements The
potential gain is great
30 - Diversities within the region and the uncertainties of benefits
from existing proposals for formal integration both suggest that external
assistance should in the main be directed to informal partial politically
neutral measures of obvious joint benefit
187
Outside encouragement of major integration projects should be cautious
More emphasis needs to be placed on research and on mutual education through
discussion of going problems and possibilities Until potential participants
see clearly that there is a problem that the problem requires regional coshy
operation and that the net benefits will be significant pressure from outshy
side the region is unlikely to achieve a continuing effect
31 -A modest one-thing-at-a-time policy is desirable focusing on some
one obvious problem whose solution is in the unmistakable joint interest-shy
about which nations can cooperate while other matters they are at odds on can
be put aside for the time
32 -External support to regional cooperation measures has the best
chance of success when it achieves a joint maximum from two goals obvious
contribution to the economic and other advantage of the regions and intrashy
regional political neutrality and colorlessness The avoidance of political
suspicions and antagonisms is an absolute requisite
33 -Nationalism is a central fact Any attempts at regional cooperashy
tion in Southeast Asia must be viewed as subordinate to the major theme of
nation-building How can nations and their elites consciously gain as indishy
vidual units through regional cooperation
Formal cooperation plans that would compel nations of Southeast Asia
to modify their national goals or their national policies have a highly dushy
bious viability
Less formal and partial measures may soften the edge of nationalism
In time the experience of various forms of cooperation and the disciplines
imposed on diverse economic policies by success and failure (so causing conshy
vergence of those policies) can lead to a deepening sense of regional common
interest and hence willingness to deepen and broaden regional cooperative
ventures
188
Papers Written In The AID-University of Wisconsin Research Project on
Economic Interdependence in Southeast Asia
Abrahamsson Bernhard1 - Developing Nations and Ocean TransportationAn Analysis of Price and Cost of Ocean Transportation the Balance of Payments and the Case for National Merchant Marines with Special Reference to Southeast Asia September 1967
2 - Alwan Dorra Development Criteria in the IBBD Survey Mission Reports January 1966
3 - Baldwin Robert E The Case Against the Infant Industry ArgumentSeptember 1966 in Journal of Political Economy MayJune 1969
4 - Bell Peter F A Quantitative Study of Entrepreneurship and Socio-Economic Determinants of Development in Asia Research Paper 14 February 1967
5 - Bell Peter F Small Industry Socio-Economic Aspects of its Proshymotion in Asia Research Paper 16 March 1967
6 - Bhagat A N A Regional Payments Union for South and Southeast Asia (draft) July 1965
7 - Bilkey Angela A Brief Analysis of the Intra-regional Trade of the Central American Common Market Countries - Some Consideration Regarding their Total Trade (draft) July 1967
8 - Castro Amado A Philippine Export Development 1950-65 Nov 1966
9 - Chou K R Hong Kongs Changing Pattern of Trade and Economic Interdependence in Southeast Asia November 1966
10 - Devoretz Don J PL 480 and Southeast Asia September 1965
11 - Ellsworth P T Import Substitution in Pakistan--a Comment Research Paper 9 June 1966
12 - Ellsworth P T Import Substitution Growth and the Balance of Payshyments Some Comparisons June 1967
13 - Fag El Nour Nawal Comparative Advantage Versus Economic Development State of the Debate July 1967
14 - Hawkins Everett D Job Inflation in Indonesia Asian Survey May 1966 Research Paper 4
15 - Havkins Everett D Demographic Trends and Problems in Indonesia 1966published as Indonesias Population Problem Ch 5 in S ChandrasekharAsias Population Problems Allen amp Unwin London 1967
189
16-- Hawkins Everett D and John A Richards Too Little and Too Much Rice June 1968
17 - Higgins Benjamin Prospects for Southeast Asian Development May 1967
18 - Huang Kai-Loo A Nucleus for Developing a Common Market in Southshyeast Asia April 1966
19 - Huang Kai-Loo Factors Discouraging Savings in Asia May 1966
20 - Huang Kai-Loo Capital Flight in Southeast Asia July 1966
21 - Islam Nurul Tariff Protection Comparative Costs and Industriashylization in Pakistan
22 - Karunatilake H N S The Impact of Import and Exchanges Controls and Bilateral Trade Agreements on Trade and Production in Ceylon December 1966
23 - Kelley Allen C Demographic Change and Economic Growth Australia 1861-1911 Part I 1967
24 - Kelley Allen C Regional Integration Demographic Change and Patterns of Industrial Growth Research Paper 19 May 1967
25 - Kelley Allen C and James C Knowles Trade Theory Regional Inteshygration and National Economic Development The Case of Southshyeast Asia August 1967
26 - Kelley Allen C and Jeffrey G Williamson The Prospects for Regional Economic Co-operation and the Rate of Household Savings in the LDCs Research Paper 15 March 1967
27 - Kitamura Hiroshi and Ajit N Bhagat Regional Harmonization of National Development Plans and Trade Co-operation Appriaches to Economic Integration in the Developing ECAFE Region January 1967
28 - Lakdawala D T and R H Patil Prospects of Indias Foreign Trade with ECAFE Countries December 1966
29 - Leith J C The Specification of Nominal Tariff Rates in Effective Protection Estimates The Philippine Economic Journal Vol VI 1967 Research Paper 12
30 - Leith J Clark Tariff Structures and Protection A Background Paper March 1966
31 - Leith J Clark Non-Traded Imputs and Substitution in Calculating the Effective Protective Rate June 1967
190
32 - Lim Chong Yah West Malaysia External Trade 1947-65
33 - Morgan Theodore Theory of Error in Centrally-Directed Economic Systems Quarterly Journal of Economics (August 1964)
Research Paper 2
34 - Morgan Theodore A Theory of Economic Growth in Newly Settled as Contrasted with Old-Settled Areas October 1964 In A H
Whiteford ed A Re-appraisal of Economic Development Aldine 1967
35 - Morgan Theodore Investment Versus Economic Growth Research Paper 11 August 1966 Economic Development and Cultural Change January 1969
36 - Morgan Theodore Trade Preferences as a United States Policy with Special Reference to Southeast Asia August 1967 Malayan Economic Review Nov 1968 Research Paper 18
37 - Morgan Theodore Economic Planning--Points of Success and Failure Philippine Economic Journal Feb 1966 Research Paper 5
38 - Myint Hla Economic Theory and the Underdeveloped Countries Research Paper 3 March 1965
39 - Myint Hla The Inward and Outward Looking Countries of Southeast Asia and the Economic Future of the Region Research Paper 7
February 1966
40 - Naya Seiji The Commodity Pattern and Performance of Southeast Asias Exports to the Developed Areas Economic Development
and Cultural Change (forthcoming) Research Paper 10
41 - Naya Seiji Some Comments on Trade Projections for Developing Asian
Countries A Background Paper March 1966
42 - Naya Seiji Natural Resources Factor Mix and Factor Reversal in
International Trade June 1966
43 - Naya Seiji and Theodore Morgan The Accuracy of International Trade Data The Case of Southeast Asian Countries August 1967 in Journal of American Statistical Association June 1969
44 - Naya Seiji and Nyle Spoelstra Commodity Trade Patterns Among Southeast Asia Japan India and the United States 962
Preliminary Data March 26 1965
45 - Panglaykim J and Kenneth D Thomas Indonesian Exports Performance and Prospects
46 - Stephen E Reynolds Customs Unions among Developing Countries April 1968
191
47 - DV Ramana and Kenichi Odawara Deficit Financing and Import Substitution India 1951-65 January 1967
48 - Schmitt Hans 0 The Integration of Capital Markets in Europe A Step Towards Political Unification World Politics 1968 Research Paper 6
49 - Sen K C The Inward-Looking and the Ouward-Looking in Southeast Asia January 1965
50 - Sen K C Convergence in Planned Economies Research in Paper 1 June 1965
51 - Sen K C Economic Growth and the Price Level--An Analysis of Some Asian Data Research Paper 13 March 1966
52 - Sen K C Nation-Building and Regional Integration Research
Paper 8 May 1966
53 - IJ Singh Agriculture and Development June 1965
54 - Sun I - Shuan Trade Policies and Economic Development in Taiwan
55 - Staff Economic Interdependence in Southeast Asia prepared for SEADAG Conference Honolulu March 1967
56 - Suparb Yossundara and Yune Huntrakoon Some Salient Aspects of Thailands Trade during 1955-64 January 1967
57 - Ta-Yeh Wu Problems and Prospects of Economic Co-operation in Southeast Asia March 1967
Longer and Summary Papers
58 - (Book) T Morgan and N Spoelstra eds Economic Interdependence in Southeast Asia Univ of Wisconsin Press Nov 1969 (based on a Bangkok Conference of Feb 1967 and the work of the group) 480 pp
59 - Staff Economic interdependence in Southeast Asia (pamphlet) interim paper prepared for Southeast Asia Development Advisory Group conference at Honolulu March 12-14 1967 49 pp
60 - Theodore Morgan and staff Regional Economic Cooperation in Southeast Asia--Problems and Prospects (pamphlet) a paper prepared for a Southeast Asia Development Advisory Group Rural Development Seminar Honolulu June 19-21 1969 21 pp published by the Asia Society May 1970
192
61 - Staff Final Report on Economic Interdependence in Southeast Asia (a summary of research findings) December 1969 192 pp
62 - Benjamin Higgins Trade Versus Aid in the Reconstruction and Development of Southeast Asia 450 pp August 1967
2
The Contract projection of the research to be done was more indicative than specific Wisconsin agreed to use its best effort
a - To evaluate the economic advantage to countries of the region from economic co-operation and co-ordination
b - To assess the theory and experience of ecoyiomic growth and of common market and free trade association ventures and other forms of economic co-operation as compared with Southeast Asian possibilities
c -To assess the extent to which national plans have implications or specifications with respect to economic integration in the areaand the extent to which success or failures in implementationhave had any systematic relation to regional economic interest
d - To indicate future AID strategy with respect to regional economic co-operation In this camptegory Contractor shall advise AID what policiesof AID can most effectively encourage the economic co-operation measures that best serve the interests of the region
Most of the research done under this contract has gone into 62 papers
including 5 longer and summary studies The majority have been circulated to
AID or have been incorporated in a book published in 1969 by the University of Wisconsin Press Economic Interdependence in Southeast Asia The material
in this Report does not in general duplicate the basic papers though it often draws on them This Report attempts to meet more narrowly and specishy
fically the questions posed by the Contract summaries and conclusions
depend in part on material not reproduced here
The 42 people listed below have been authors in part or wholly of one or more of the Project papers (For those not now (March 1970)
at the University of Wisconsin we have put down the institution with which
they are connected) Among them Professors Everett D Hawkins Seiji
Naya Nyle Spoelstra K C Sen and Mrs Fag el Nour have been especially
close to the Project Professor Hawkins was in touch with the work from
the beginning contributed throughout and was for a time Director of
Research He has been a most helpful critic of this Report Professor Spoelstra
carried much of the administrative and editing burden during the whole Contract
period
Bernhard Abrahamsson Benjamin Higgins (Univ of Denver) (Univ of Montreal)
3
Dorra Alwan Harley Hinricks (Univ of Maryland) (Univ of Maryland)
Robert E Baldwin Kai-Loo Huang (Moravian College)
AN Bhagat (UN Econ Yune Huntrakoon (Bank of Com for Africa) Thailand)
Angela Bilkey Nurul Islam (Pakistan Inst of
Amado Castro (Univ of the Development Economics) Philippines)
KR Chou (Nan Yang Univ)
HNS Karunatilake (Central Bank of Ceylon)
PT Ellsworth (Univ of Allen C Kelley
California Riverside) Hiroshi Kitamura (UN Econ Com Naval Fag El Nour (American
for Asia and the Far East)
University Cairo) DT Lakdawala (Univ of Bombay)
Everett D Hawkins Robert J Lampman
Lim Chong Yah (Univ of JC Leith (Univ of Western Singapore) Ontario)
Theodore Morgan DV Ramana (Asian Inst for
Hla Myint (London School of Economics)
Econ Devel and Planning)
Stephen E Reynolds (Univ of
Seiji Naya (National Bureau of Utah)
Econ Research Univ of John Richards Hawaii)
Kenichi Odawara KC Sen (Asian Development Bank)
(Sophia University Tokyo) IM Singh (Ohio State University)
J PanglAykim (Australian National Univ)
I-Shuan Sun (Central Bank of China)
Douglas S Paauw (National Planning Association Washington)
Nyle Spoelstra (Nat Inst of Devel Administration Bangkok)
RH Patil (Univ of Bombay) Anthony Tang (Vanderbilt Univ)
4
John Power (Univ of the Kenneth D Thomas (La Trobe Philippines) Univ Melbourne)
Jeffrey G Williamson
Ta-Yeh Wu (UN Econ Devel Board Singapore)
Suparb Yossundara (Bank of Thailand)
The following 44 people have served as consultants to the research program being one or several days at Madison and holding formal and informal meetings with the research group and usually speaking at a Workshop
Herbert Grubel (Univ of Pennsylvania) Gottfried Haberler (Harvard University) Robert Z Aliber (Univ of Chicago) W M Corden (Oxford Univ)Ronald McKinnon (Stanford Univ) Guy Black (Council of Economic Advisers
WashingtonDC)Irma Adelman (Northwestern Univ) Adam Marton (Budapest Hungary) W Arthur Lewis (Princeton Univ) Clair Wilcox (Swarthmore College)Pan A Yotopoulos (Stanford Univ) D A Snider (Miami Univ) Hollis B Chenery (Harvard Univ) Lloyd J Reynolds (Yale Univ) Richard E Caves (Harvard Univ)Arthur T Mosher (Econ Devel Council
New York)Hla Myint (London School of Econ) Frank H Golay (Cornell Univ)Gerhard Tintner (Univ Calif Los Angeles) Kang Chao (Univ of Wisconsin)Nathan Keyfitz (Univ of Chicago)Emile Despres (Stanford Univ) Clifton R Wharton Jr (Michigan State Univ) Gustav F Papanek (Harvard Univ)Lauchlin Currie (National Univ of Columbia) Edward Fei (Agency for Int Devel
Washington D C)Richard Goode (Int Monetary Fund
Washington D C)Benjamin Higgins (Univ of Montreal) G Sicat (Univ of the Philippines)Douglas Fontein (Int Bank for Recon and Devel) J Strasma (Univ of Wisconsin)
5
A Ravenholt (Amer Univ Field Service Manila) Bela Balassa (Johns Hopkins Univ and IBRD) HK Mazumdar (Indian Statistical Institute Calcutta) Robert R Nathan (Nathan Associses Washington DC) Reed Irvine (Federal Rcmerve Board Washington DC) Julian H Singman (Washington DC) Lloyd I Rudolph (Univ of Chicago) George Dalton (Northwestern Univ) CH Thompson (Int Bank for Rec and Devel) Stephen Enke (Dept of Defense Washington DC) John H Power (University of the Philippines) Harry G Johnson (Univ of Chicago and London School
of Economics) I Robert Sinai (New York Univ)
A conference on Economic Interdependence in Southeast Asia was held at
Bangkok at Sala Santithan (ECAFE) in January 1967 Contributors are listed
in the first group above
The views presented here are of course personal ones and do not necesshy
sarily reflect those of the United States Agency for International Development
the University of Wisconsin or the other organizations with which various
contributors are or have been associated
Theodore Morgen Director of Research
University of Wisconsin
March 17 1970
6
Table of Contents
Preface page 1
I- Advantage to the region from economic cooperation 12
A- Less Developed Country comparative advantage in manufactured goods with special reference to Southeast Asia 12 I- Similarities in manufactures
B- Export patterns and trends of comparative
D- Asian commercial policies and the
a- An overview of Asian commercial
b- Quantitative restrictions on
c- Quantitative restrictions on foreign
E- Customs revenue loss in a Southeast Asian
F- Protectionism and the growth of productive
G- The variety of economic and non-economic
production structures 16 2- Implications export performance 30
advantage 37 1- Asian performance in world trade 37 2- Exports to More Developed Countries 39 3- Intra-regional trade 47
C- Cutting transportation costs 57
possibilities of expanding regional trade 60 1- Introduction 60 2- Theory 60 3- Quantitative restrictions 69
policies 1961-67 69
current account 72
capital 78 4- The pattern of tariff protection 79
customs union 88
efficiency 99
cooperation 102
II- Foreign exchange const7aints and regional cooperation in Southeast Asia 104
A- A regional payments union
C- Two gaps saving and foreign exchange
104 B- The end of the Vietnam war 114
as checks on regional growth 114 1- Empirical studies 118 2- Criticism 124
7
III- Major cautions on the statistics 126
3- Effect of adjusting trade data by the
B- Inaccuracies and misleading concepts in
2- Misleading categories for LDC growth
pageA- Inaccuracies in Southeast Asia trade data 126
- The problem procedure 126 2- The errors 128
exchange rate 137 4- Commodity trade statistics in detail 140 5- Concluding comment 142
the standard national income statistics 144 1- Errors in LDC social accounts 144
analysis 146
IV- National plans and regional integration in Southeast Asia 150
A- Planning patterns
D- Spill-overs Plan Harmonization and
150 I- Two directions of policy in LDCs 151 2- Two patterns of growth in Southeast Asia 152 3- A recent trend 153
B- Planning in five countries a summary 154 1- Indonesia 155 2- Thailand 156 3- Singapore 158 4- The Philippines 159 5- Malaysia 159
C- Multiple objectives 161 1- Ditficulties as seen by the planners 161 2- The purposes of planning 162
bilateral agreements 164 1- The spill-over effect 164 2- The regional harmonization proposal 165 3 - Bilateral agreements 169
E- Some conclusions 170
V- Regional cooperation in Southeast Asia--forms policy 172
- Degree of formality and government A- Taxonomy 172
commitment 172 2- Cooperation within the region only 175 3- Other categories 175
B- The political hurdles 176 C- Guidlines for policy 177
VI- Summary policy implications 179
Appendix Research papers written in the Project 188
8
Tables
1 - ISIC classification 17
2 - Indices of value-added per employee wages and salaries per employee and non-wage valueshyadded per employee for manufactures in selected Southeast Asian Countries (ISIC 2-3 = 100) 1963 18
3 - Consistency in value-added by industries in Asia 20
4 - Manufactures satisfying low value added peremployee criteria in the Philippines 23
5 - Manufactures satisfying low value added per employee criteria in the States of Malaysia 27
6 - Export performance of nine Asian Countries 1962-65 32
7 - Manufactured exports of dynamic character for selected Southeast Asian Countries 35
8 - Export directions by regions 38
9 - The compositional and competitive effects of exports to more developed countries by Asian Countries - averages of 1956-57 and 1964-65 41
10 - The composition and competitive effect of exports of Asian Countries by commodity groups averages of 1956-57 (I) and 1964-65 (II) in percentages 44
11 - Export growth and shares of intra-regional exports averages of 1956-57 and 1964-65 48
12 - Commodity composition of total and intra-regional exports of selected Asian Countries 1962 and 1965 50
13 - Commodity composition of total and intra-regional imports of selected Asian Countries 1962 and 1965 51
14 - Competitive and compositional effects of intra-Asian Trade by country 1962-65 53
15 - The compositional and competitive effects of less developed Asias export to more developed areas 1956-57 to 1964-65 56
16 - Asian commercial policies 70
17 - Current account restrictions 73
9
18 - Significant changes in current account policy 74
19 - Restrictions on current account 76
20 shy Tariffs-Major categories 82
21 - Sample commodities duties (Ad valorem or specifices equivalent) 84
22 - Import duties as a percent of total national government revenues selected Southeast Asian countries 1963-65 88
23 - Hypothetical calculations of revenue losses 93
24 - Federation of Malaysia revenues of Federal and State governments 94
25 - Malaysia revenue collected on imports from Two Partner Countries 1963 96
26 - Potential revenue loss 98
27 - Intraregional bilateral balances of trade 1958-65 108
28 - Growth of world and Indian exports 120
29 - Indicies of gross profits in Indian industries (1950-100) 121
30 - A zest of average export ratios (MiX i) assuming ar expected value of 1 10ij 133
31 - A test of average import ratios (MX) assuming an exrected value of 11031 133
32 - A test on variability of export and import ratios of Southeast Asian countries with Asian and more developed country partners 136
33 - The averages of export and import ratios standard deviations and coefficients of varishyations on the basis of adjusted data 139
34 - Philippine export ratios and import ratios by commodities with the four largest and with all Partner Countries 141
10
Charts
1 - Ratio of trading partners imports from Southeast Asian Countries to corresponding exports of Southeast Asian countries 131
2 - Ratio of Southeast Asian countries imports to corresponding exports of trading partners 132
ECONOMIC INTERDEPENDENCE IN SOUTHEAST ASIA
12
I - Advantage to the Region from Economic Cooperation
One purpose of the Contract was to evaluate the economic advantage
(or disadvantage) to the region from economic cooperation and coordination
(Appendix B pp B 1-2) Our response to this injunction is given below
under seven headings A to G
A - Less Developed Country (LDC) Comparative Advantage in Manufactured
Goods with Special Reference to Southeast Asia
A basic point underlying any discussion of development policies of
LDCs is the fact that although international trade may not be serving as an engine of growth it cannot be disregarded The degree of dependence of
LDCs on international trade has been and still is typically high In
many cases exports of these countries constitute more than 15 percent
of their national income and 50 percent or more of their export earnings
is derived from one or two commodities Recurrent discussions have emanated
from the United Nations and other sources relating to the present and future
prospects of a large trade gap for less developed countries These discusshy
sions run in terms of a growing need for foreign exchange by the LDCs to
meet their economic development programs Such foreign exchange needs are
presumably to be met by exports of their traditional primary commodities
or by expanding their recent venture into trade in manufactured goods
Trade projections of prospects of world demand and potentialities
for expanding exports of traditional primary commodities conducted by the
FAO the ECAFE and others reflect very modest rates of increase over the coming decades It thus becomes of great importance for LDCs to expand
their exports of manufactured goods
To the advantage of LDCls recent trends in international trade
point to a tendency toward convergence in world specialization and exchange
Contrary to the long established dichotomy in world production and trade
between predominantly primary goods production and export by less developed
countries and manufactured goods production and export by developed
countries recent trends indicate more diverse specialization patterns
The export of manufactures by LDCs though still much concentrated in origin and destination has also Xecently exhibited high rates of growth
Despite the difficulties inherent in attempts to generalize on production possibilities for various countries including the LDCs1
various attempts have been made to assess the implications of recent developments in world trade as an indication of the possibility of the LDCs developing a comparative advantage in the production of certain manufactured goods If one is to generalize broadly on the LDC comparashytive advantage area within manufactures one must choose for both logical and empirical reasons the area of relatively low skill-labor intensive2
manufactures This gives rise to the need to apply soue theoretically sound and workable criteria for the delineation of some manufactures potentially successful for LDCs specialization and trade The choice of any such criteria would to a large extent be influenced by the nature of
the data available for LDCs
The analysis of LDCs prospective comparative advantage in the production of certain manufactured commodities thus starts with the basic assumption that the LDCs have relatively little accumulated capital in either conventional or human-skills form Hence any comparative advantage they may have in manufactures apart from the resource oriented ones arises from their abundant labor The implication then is to specialize in the prcduction of those industries with a strong labor orientation defined to incorporate low capital requirements in the forms both of plant
and eqlpment and of education and training (human capital)3
1Particularly the presence of nonmonetized sector and the rigiditiesin the structure of their economies impeding factor mobility
2The importance of the availability of different levels of laborskills as the major factor explaining the patterns of international location and trade is emphasized by Donald B Keesing Labor Skillsand International Trade Evaluating Many Trade Flows with a Single Measurshying Device Review of Economics and Statistics (August 1965) pp 287-293
3Hal B Lary Imports of Manufactures from Less Developed CountriesNational Bureau of Economic Research New York 1968 p 4
14
Criteria satisfying this definition which can be applied to some
Southeast Asian countries data on manufactures were utilized by Professor
Hal B Lary 1 in a study at the National Bureau of Economic Research The
criteria were based on the ranking of industries with respect to the two
major components of value added per employee the wages and salaries per
employee (representing the labor component2) and the non-wage value added
per employee (representing the returns to factors other than labor interest
rentpprofits and depreciation allowances) The criteria thus allow for
the incorporation of human capital into the analysis a matter of first
importance In addition the criteria have the essential merit of feasishy
bility since data on value added employment and wages and salaries are
likely to be available for a large number of countries The difficulty of
incorporating natural resources as a direct factor of production is partly
assumed away since the study focuses on identifying labor intensive manushy
factures and omits primary products from the analysis There are a number
of labor intensive manufactures however which are also highly resource
oriented Their consideration for specialization purposes would thus
vary between individual countries depending upon the degree in which their
production requires specific natural resources versus low skill labor3
It should be noted however that such resource4 oriented products some
of which mainly undergo simple processing operations contribute signifishy
cantly to manufacturing output and are instrumental in explaining the
pattern of exports of LDCs
1lbid pp 21-22
2The validity of using the wages and salaries and the nonwage componshyents of value added per employee as indications of relative skill and capital requirements was supported by finding significant relations across industries between the wages component and other measures of skill mainly occupational and educational indices and between the remaining component and stocks of physical capital
3Ibid p 14
4Ibid pp 48-50
15
The entire analysis rests on the factor proportions theory with its underlying assumption of the comparability of the factor intensities for different countries It aloo assumes the possibility of approximating empirically to the Heckcher-Ohlin version of the theory of comparative advantage and the nonexistence or at least the practical irrelevance
of factor intensity reversal1
Because of the importance of the assumptions underlying the factor proportions theory in the specification of those manufactures potentially profitable for LDCs further research was undertaken in the NBER study on those points Comparison of value added per employee and its components for nine countries2 over the thirteen industry groups appearing in the UN The Growth of World Industry3 indicated a high degree of conformity as measured by Kendalls coefficient of concordance Thus based on the analysis of value added and its components for array of US iniustries the study pointed that the LDCs should have comparative advantage in manufactures which have (1) a low level of value added per employee and (2) low levels of both components of value added wages and salaries per employee and other remaining components These manufactures were found to be textiles and clothing wood products furniture leather products miscellaneous manufactures and a number of special manufactures in other
1Some qualifications result from studies by W Leontief Domestic Production and Foreign Trade The American Capital Position ReexaminedProceedings of the American Philosophical Society Sept 1953 In a secondarticle however Leontief put more emphasis on the skill requirements forthe different industries--a factor which is excluded in analysis based on examination of stocks of physical capital and man hours of labor W Leontief Factor Proportions and the Structure of American Trade Further Theoretical and Empirical Analysis Review of Economics and StatisticsNovember 1956 It should also be noted that in one of the calculations inwhich Leontief excluded natural resource sectors the paradox disappearedthe US was found to export more capital intensive products
BS Minhas The Homohypallagic Production Function Factor IntensityReversal and the H-O Theorem Journal of Political Economy April 1962Hinhas introduces the CES production function which permits the occurrenceof factor intensity reversal and points to the existence of some factor reversals Leontief however conducted more extensive tests and confirmed the empirical irrelevance of factor reversal W Leontief International Factor Costs and Factor Use AER June 1964
2United States Canada Australia Sweden United Kingdom BrazilJapan Mexico and India Lary opcit p 71
3United Nations TheGrowth of World Industry 1936-1961 National Tables (United Nations 1963)
16 1
major groups
1 Similarities in Manufactures Production Structure
Applying the criteria based on analysis of value added per employee to
data on manufactures for selected Southeast Asian countries yields results
generally in agreement with the NBER study findings Detailed analysis of
individual groups of manufactures however indicates somewhat wider possibilshy
ities for specialization
In general as shown in Table 2 there was much similarity in the rankshy
ings of the different manufacturing groups for the countries considered
The Kendall coefficient of concordance2 and the chi square test computed for six Southeast Asian countries over twenty industry groups for 1963 and for
the same countries plus Japan over eighteen industry groups yielded results
significant at the 001 confidence level The results of this test are in
Table 3 below
The major groups of manufactures that satisfied the relatively low
skill labor criteria 3 for practically all of the countries considered were
1Examples of such manufactures are plastic goods footwear glasswearand china jewelry optical goods cutlery aad hardware electrical apparatus and appliances non electrical machinery printed matter and processing and preserving of fish and fruits and vegetables
2The Kendall coefficient of concordance provides a measure of the relashytion among several rankings of N variables ie determines the association among N variables It constitutes an index of the divergence of the actual agreement shown in the data from the maximum possible (perfect) agreement See Sidney Siegel Nonparametric Statistics for the Behavioral Sciences (New York McGraw Hill Book Company Inc 1956) pp 229-239
3The relatively low skill labor manufactures are defined as those manufactures having (1) relatively low value added per employee below the overall average for the manufacturing sector of each country and (2) levels of both wages and salaries per employee and non-wage value added per employee below the overall average
17
ISIC Classification
20
21
22
23
24
25
26
27
28
29
30
31
32
33
34
35
36
37
38
39
Table 1
Manufacturing (Division 2-3)
Food Products
Beverages
Tobacco Products
Textiles
Clothing Footwear and Made-Up Textiles
Wood Products
Furniture
Paper and Paper Products
Printing and Publishing
Leather and Leather Products
Rubber and Rubber Products
Chemicals and Chemical Products
Petroleum and Coal Products
Non Metallic Mineral Products
Basic Metals
Metal Products
Machinery except Electrical Machinery
Electrical Machinery
Transport Equipment
Miscellaneous Manufactures
Table 2 -- Indices of ValueAdded per Employee Wages and Salaries per Employee and Non-WageValue-Added per Employee for Manufactures in Selected Southeast Asian Countries (ISIC 2-3 =_ 100) 1963 (r)
ISIC _(2-3) 20 21 22 23 24 25 26 27 28 29Value Added Per Employee (2)Japan(2) Taiwan India Rep of
10000 10000 10000 10000
9130 11555 9082 10289
12826 40360 14289 23782
---67741 6301
60326
6413 5521 8165 6220
5326 6034 6420 5948
5869 6185 6390
11514
6739 6963 7662 5693
10869 9297 12751 13516
11739 4079 9319
10102
8913 8311 7396 6664
Korea Singapore 10000 Malaysia(5) 10000
6657 9080
16699 11900
21994 13800
3834(3) 6660 7260
6053 8260
9620 6400
5898 10320
9564 8600
6320 7000
(West)Philippines 10000 12850
(6)15812 9878 4990 3480 5027 3613 9900 5856 4839
Wages amp Salaries Per Employee (2)Japan 10000 7575 8484 --- 7272 6363 7575 8484 10606 13333 10303Taiwan 10000 9285 12857 15357 7619 6904 9166 7380 11428 10238 9285India 10000 6354 8125 5208 9843 9270 5833 8958 10312 10989 7291Rep of 10000 8195 11403 17807 8254 8490 11341 8910 10609 14110 10699Korea (3)Singapore 10000 7975 8947 6396 5384 10242 13279 5668 11740 6072
Malaysia (5) (6)(West) 10000 8901 10989 7637 7307 7472 11263 7472 8241 12582 5494Philippines 10000 9185 14253 7466 7828 5610 8099 7918 11538 13212 8325
Non Wage Value Added Per EmployeeJapan 10000 10000 15254 593252) 4745 4915 5762 11016 10847 8135Taiwan 10000 11959 45450 7500 5112 5855 5608 6869 8873 2905 8108India 10000 12671 22397 7739 5958 2671 7123 5958 15958 7123 7534 Rep of
Korea 10000 11034 18185 75451 5496 5044 11576 4549 14550 8676 5229Singapore 10000 5956 t0817 30279 3010(3) 3827 7677 6021 8408 6451 Malaysia(5) (6)
(West) 10000 9182 12421 17327 6289 7138 6540 5786 11509 6320 7661Philippines 10000 14035 16315 10657 4078 2792 4035 2222 9371 3479 3713Source Data calculated from United Nations The Growth of World Industry (United Nations 1968) (1) Figures for the Philippines and India refers to 1962 and figures for Taiwan refer to 1961 (2) Data excludes tobacco manufacturers (ISIC22)(3) figure stands for textiles clothing and footwear (ISIC 23 and 24)
Table 2 ------- continued
ISIC 30 31 32 33 34 35 36 37 38 39Value Added Per Employeejapan(Z) 9239 18804 22826 10217 11304 8804 10217 10434 12934 8260Taiwan 8899 11593 25578 8804 14857 8045 5939 7988India 6660 899423698 23254 55502 8816 10917 10562 11183Rep of 11745 10177 89056029 14707 6743 10706 10366 6341 6395 9121 6430 5561 KoreaSingapore 8820 27247(4) 11179 17556 9873 7668 9522Malaysia(5) 8820 19440 7500 5407
(6) 11000 10280 8400 6820 15660 7500 30400(6)(West)Philippines 14607 15524 17690 11270 8320 8265 11911 9215 10994 5038Wages amp Salaries Per EmployeeJapan 9090 13030 14242 9696 14242 10000 11818 9696 12727Taiwan 90909404 12500 13095 10119 15714 9166 11071 10238 13333India 833316041 13281 27083 7552 12604 10312 11458Rep of 11718 11979 92189274 11974 8825 11847 12308 8476 10540 9801 13196 6943Korea (4)Singapore b23 13157 10688 10121 9757 10890 15870 12550 6356
Malaysia(5)(West) 9010 11648 (6) 10000 11758 9340 10439 11868 11978Philippines 11312 15610 16813 (6)29004 11493 10995 11085 12714 10361 12398 8235Non Wage Value Added Per EmployeeJapan
Taiwan India
9322 8783 33767
22033 11396 36369
27627 27882 92876
10508 8536
10479
9661 8135 9322 14662 7815 4954 8698 10890 10821
10847 13050 7554 5382
11780 7808
7796 9099 8493
Rep of Korea
Singapore 4874 8924
15679 6002 34731(4)
10300 11440
9676 21505
5582 9935
4921 5956
8879 6150
4024 4817
5069 4903
Malaysia(West) 8710
Philippines 15672 23899 (6) 15497 186038
11572 11198
9433 7456
7861 4748 7353 11652
17830 4937 8845 10540
38176(6) 4005
(4) figure stands for chemical and petroleum products (ISIC 31 and 32)(5) Data for Malaysia excludes tailors and dressmakers (part of ISIC 24) in smelting industry(part of ISIC 342) motor vehicles and bicycle repair shops (ISIC 384 and 385) goldsmithing(part of ISIC 394) and processing of agricultural products on estates comprising tea factories(part of ISIC 209) rubber processing on estates (part of ISIC 30) and copra kilns and palm
(6) oil milling (part of ISIC 312)Breweries and manufacturing of malt (ISIC 213) and manufactures of products of petroleumand coal (ISIC 32) are included under miscellaneous manufacturing industries (ISIC 39)
4 ~ ~v-gt 444 420~
~ ~ ~ ~ ~ ~~~~~~ ~
r 1963 data 0203 707244cou
gt 41e 44gt~ 4 ii iltlii ]IIR ii 1 144 4
Tile 44144 os Cocodnc eaursth CefCon onisecy rakfgt4 Of
Ii i ]CoFffice41t itC of h 4gt
(for seven Co 1963=iiL 60 8 7 n ris data)i
44t e nt s- on c lt4444v gt-4c KI19 6 pp 4 lt29-4 )Y~~ 4
~~lt4441~ ~ ~~ K - 1I 44 4 44 44KK
an Concardanccluduare
4it a p i f chanc o e4 (S SL441 e
ab r o f n un r es c nc rn d f r te 11ii th ve sh wn - h l am c CIiLIS111=
d~isa r em n iwoul Chi All e nde lsbe 0iltii~iii 7-~ theii Sq a a i r r
CulatedI )i over Itwenty industrial groupsiifor i i Fo Se ton l~ of the ta le th ab v co ntie Jap IltF ei IIILIS + [+
incude Ther areiover~lI eihte inutilgois rus2
21
similarly those of textiles (23) clothing and apparel (24) wood and wood products (25) furniture (26) leather and leather products (29) and miscellaneous manufactures (39)
In addition other groups of manufactures have alsc exhibited relatively low capital requirements measured by low indices of valueshyadded-per-employee and non-wage-value-added-per-employee These groups were mainly printing and publishing (28) metallic products (35) nonshyelectric machinery (36) and transport equipment (38) Such low indices also appeared for individual countries in groups (37) of electrical
machinery (34) of basic metals (33) of non-metal mineral products and (20) of food products The finding therefore encourages these countries to expand the production and export of some manufactures within the specified groups However wages and salaries were higher for groups 28 35 36 and 38 than for groups 23 24 25 26 and 39 suggesting somewhat high skill requirements The difference might however have reflected heterogeneity in groups 35 36 and 38 or in the other groups Hence a detailed study of two of the countries the Philippines and Malaysia I was
carried out
Our detailed analysis of manufacturing sectors in the Philippines
and Malaysia gives support to favoring disaggregated consideration of LDC specialization in manufacturei production In addition to manufactures in groups 23 24 25 26 and 29 all of which generally satisfy the criteria both of low-value-added-per employee and low wages and salaries and non-wages-added-per-employee there are subgroups here and there in virtually all of the remaining manufacture categories that show the same
characteristics
1Bureau of the Census and Statistics Annual Survey of Manufactures1960 Volume V (Manila Philippines 1962) and
Department of Statistics of Malaysia Census of ManufacturingIndustries in the States of Malaya 1963 (Kuala Lumpur Malaysia 1965)
22
We list below in Tables 4 and 5 those manufactures for the Philippines and Malaysia that qualify by the above criteria and so invite considerations as serious candidates for LDC production It is interesting to note that the manufactures listed below to a very large extent encompass those identified as labor intensive in the study sumnarized in Table 2 It is important to emphashysize however the wider possibilities for specialization that emerge from examination of individual LDC data on manufactures
23
Table 4
Manufactures Satisfying Low Value-Added per Employee Criteria in the Philippines
Wages and Non-Wage Value Added Salaries Value Added
per per per ISIC Employee Employee Employee
All Industries 100 100 100
20 Food Manufactured 201 Slaughtered Prepared
and Preserved Meat 5833 9863 4260 203 Canned and Preserved
Fruits amp Vegetables 8935 10319 8395 204 Preserved Fish and
205 Other Seafoods Grain Mill Products
4705 8128
5159 7625
4527 8324
206 Bakery Products 3871 6803 2727 208 Cocoa Chocolate and
Sugar Confectionary 3756 5296 3155 209 Miscellaneous Food
2093 Preparations Dessicated Coconut
7559 2525
7534 5342
7557 1425
21 Beverages - -
22 Tobacco Products 221 Cigars Cigarettes and
related Products 8038 7899 8092 23 Textiles 4871 100 2869
231 Textile Mill Products 4653 7990 3351 2311 Hemp Mill Products 3871 6392 2887 2313 Narrow Fabrics and
Small Wares 4025 6210 3172 2314 Cotton Textile Mill
2316 Products Jute Mill Products
4641 5307
8264 8082
3226 4224
232 Knitting Mill Products 5500 7214 4830 239 Other Textiles 1948 1872 1978
24 Footwear and Other Wearing Apparel and 3089 5433 2174 Made Up Textiles
241 Footwear (Shoes amp Slipshypers except Rubber) 2794 5662 1675
243 Wearing Apparel except Footwear 2871 5205 1960
245 Embroideries Hand or Machine Made 4769 6310 4171
24 Table 4 (continued)
25 Wood and Cork Products 4525 8127 3119 Except Furniture
251 2521 2551
Sawmill and Planning Mill Veneer and Plywood Sawah Nipa and Bamboo
4641 4576
3051
8127 8584
6712
3279 3012
1622 26
2611 2621
2631
2641
2661
Furniture and Fixtures Rattan Furniture except Wood Furniture except Upholstered Venetian Blinds and Other Screens Metal Furniture except Upholstered Mattresses and Bedshy
4217 2294
3384
4500
4102
7397 4931
7351
8310
8401
2976 1264
1836
3012
2424
Springs 6743 7579 6417
27 Paper and Paper Products 28 Printed and Published
2821 Materials (mainly) Books and Pamphlets 8987 9771 8680
29 Leather Products
2911
2921
except Footwear Leather Tanned or Finished Luggage Handbags and Small Leathergoods
4961
5076
5205
7534
7945
7214
3957
3957
4420
30 3011 309
Rubber Products (mainly)Rubber Shoes and Slippers Miscellaneous Rubber
6384 10000 4973
Products 5987 10365 4278
31 Chemicals and Chemical
3121 Products (mainly)Vegetables Oils 7705 10182 6737
32 Products of Petroleum and Coal (combined with ISIC 39 of Miscellaneous)
33 Non-Metallic Mineral
331
Products (mainly) except Products of Petroshyleum and Coal Strictural Clay Products 5487 8082 4474
339 Other Non-Metallic Mineral Products such as statuary conshycrete lime statuary
8995 6269 5204
25
Table 4 (continued)
art goods and cut stone products
34 3412
Basic Metal Products (mainly) Iron and steel FoundryProducts 6346 9223 5222
35
351
Metal Products Except Machinery and Transport Equipment Tin and Aluminum Ware
352 356
3561
3563
3594
36
(except household and hospital utensils)
Cutlery and Hand Tools Heating Cooking and Plumbing Equipment Heating and Cooking Appashyratus Metal Plumbing Fixtures and Fittings Needles Pins and Fasteners Machinery Except electrishy
6192
4769
5217
3628
6820
6347
9041
9315
8401
9817
6131
3101
3618
1764
5650
364 3641
365
369
cal (mainly)Special Industry Machinery Food Products Machinery and Euipment General Industrial Machinery amp Equipment Other Machinery
5230
4282
3282 5487
9452
9269
7853 10228
3582
2335
1497 3636
37
371
Electrical Machinery Apparatus Appliance and Supplies Electrical Industrial
8474 10410 7718
3711 3712
Apparatus Motors and Generators Electrical Distribution
6269 3461
7808 7260
5668 1978
3722
3741
3749
and Control Apparatus 7641 Household Radios Phonogrpahs amp TV Sets 6769 Household Cooking amp Heating Equipment 3858 Other Household Electrical
8036
9817
7990
7486
5579
2245
Appliances 7346 9908 6345 38
381 3832
3841
3851
Transportation EquipmentShipbuilding and Repairing Motor Vehicle Engines Parts amp Bodies Motor Vehicles Repair shop Products Bicycles
3333
4858
5730 5384
10000
8767
10365 9132
730
3333
3921 3921
26
Table 4 (continued)
39 Miscellaneous Manufactures 3923 Eye Glasses and Spectacles 6000 7899 5258 397 Buttons 3067 8538 986
3991 Stationers Artist amp Office 8500 10228 7825 Supplies
3992 Fabricated Platted Products 9935 10045 5721 3997 Sporting and Athletic Goods 4448 8127 3012 3998 Brooms Brushed and Fans 6064 8173 5240
Source Data calculated from Bureau of the Census and Statistics Annual Survey of Manufactures 1960 Volume V (Manila Philippines 1962)
27
Table 5
Manufactures Satisfying Low Value-Added Per Employee Criteria in the State of Malaysia
Value Wages and Non Wage Added Salaries Value Added Per Full- Per Full- Per Full-Time Paid Time Paid Time Paid
IS IC Employee Employee Employee
Total Off-Estate Manufacturing Industries B Processing of Estate Type Agricultural
10000 10000 10000
Products in Factories Off Estates 1121 Rubber Remilling 7233 8730 6416 1122 Rubber Smoke Houses 6915 7989 66329
C Other Manufacturing Industries
30 Foods 3032 3051 3054 3055 3061 3062 3080 3091 3093
Pickles andSauces Factories Small Rice Mills Sago and Tapioca Factories Large Rice Mills Biscuit Factories Bakeries Chocolate and Confectionery Factories Meehoom and Noodles Factories Spice and Curry Powder Grinding Mills
9364 7607 8448 8803 6392 7420 7289 6878 6205
9100 7301 9663 9629 7566 6613 5343 6296 5026
9508 7774 8612 7352 5851 7861 8352 7196 6899
31 Beverages
3110) Distillations and Wine Manufactures 8598 8412 8699 3120)
32 Tobacco Products
33 Textiles 6598 6772 6502 (Includes Spinning and WeavingKnitting Mills Cordage Rope Net amp Twine and Other Miscellaneous)
34 Footwear (Except Rubber) Other WearingApparel and Made Up Textiles 8149 6084 9277
3411 Footwear (except rubber amp wooden)3412 Wooden Clogs and Sandals 3432 Clothing Factories 3420) Other Wearing Apparel (such _j repair
7831 7738 8448 8766
6666 5873 5079 7354
8468 8757 10289 9537
3433) of footwear hats and made-up 3440) textiles)
28
Table 5 (continued)
Value Added Per Full-
Wages and Salaries Per Full-
Non Wage Value Added Per Full-
ISIC Time Paid Employee
Time Paid Employee
Time Paid Employee
35 Wood Rattan Mena and Cork
Kuang Attap
3531 3591
Wooden Boxes Cases and Crates Carpentary Shops Other Wood Products (such as Wood Preserved Rattan Processing Basketware Attap Products and other wood and Cork Products
5700 8485
7345
7195 5978
9841
4884 9855
5982
36 Furniture and Fixtures includes
6728 7513 6300
361) Household Furniture 362) Office and Connercial Furniture 367) Furniture Finishing and Repairing 364) Mattress Manufacturing 369) Other Miscellaneous Manufacture of
Furniture
37 Paper and Paper Products
38 Printing and Publishing 382 Job Printing Bookbinding amp Printing
Service 7289 8730 6502
39 Leather and Leather Products except Footwear and Wearing Apparel 7570 5291 8815
40 Rubber Products 4010) Rubber Products except Retreading and 4021) Vulcanizing of Tires and Tubes (inshy
cludes 4030) rubber footwear tires and tubes
foam
6485 8095 5606
4090) rubber products amp other Miscellaneous
41 4195
Chemicals and Chemical Products Matches
6093 9084 6300
42 Coal and Petroleum Products (included Under All Other Industries)
29
Table 5 (continued)
Value Added Per Full-
Wages and Salaries Per Full-
Non Wage Value Added Per Full-
ISIC Timc Paid Time Paid Time Paid Employee Employee Employee
43 Non-Metallic Mineral Products
4310 4320 4330
4350
(except Petroleum and Coal) Structural Clay Products Glass Products Pottery China amp Earthenware Structural Cement amp ConcreteProducts
6168 7009 6467
8835 7883 7142
4710 6531 6387
10317 10115 10433 44 BasicMetal Industries
4421
45
Iron Foundries
Metal Products Except Machinery amp Transport
7906
8523 10264
9523 6618
7976
4520 Architectural Metal Products 4530 Wire and Wire Products 454 Harware Tools and Cutlery
4561 Tin Cans and Metal Boxes 4563 Brass Copper Pewter and AluminumProducts
7794 7775 9158 7757
8941 7460 6402 8571
7167 7947
10664 7312
4581
46 4620
4630
Blacksmithing and welding Machinery (Except Electrical) RepairsIndustrial Machinery and Parts General Engineering amp MachineryRepair Shop
8915 9196
6915 6579
6971
9047 8465
10582 10211
9470
8843 9595
9913 4595
5606 47 Electrical Machinery Apparatus
Appliances and Supplies 48 Transport Equipment amp Repairs4834 Motor Vehicle Parts amp Accessories
4332 Bicycle Tricycle and Trishaw Parts4813) Other Transport Equipment (such as 4851) Marine Engines Bicycles Tricycles4890) Trishaws and other nes
5289 6345 7588
6931 5555 9629
3493 8323 6473
49 Miscellaneous Manufactures4940 Plastic Products nes 7757 7195 8063 Source Data calculated from Department of Statistics of Malaysia
Census of Manufacturing Industries in the StatesofMalaya1963(Kuala Lumpur Malaysia 1965)
30
2 Implications Export Performance
For the purpose of estimating comparative advantage possibilities available data suffer sharply from their aggregation--that isthey suffer from the heterogeneity of products included under a given classification Guidance is needed for very specific kinds of specialization But aggregated data lead only to rough guidelines and if the rules of behavior and parashymeter shifts of individual segments happen to combine malevolently aggregated data can lead to generalizations inverse to the real facts
The problem we face in trade matters stems from definitions of products that are heterogeneous with respect to factor requirements We should be on guard LDCs in general and Southeast Asian countries in particular may be able to specialize efficLently in the production of a large variety of manushyfactures that are labor intensive and require only modest skills irrespective of the general group within which they fall
Greater awareness of this diversity would free policy in thesecountries toward a wider area of choice and greater degree of adaptability It would also enable them to take advantage of favorable export prospects among the more numerous plausible sub-groups of manufactures
It is a major complaint of LDCs that world demand for their traditional primary exports is unpromising Preoccupation with only a few manufactures which alone are supposed to have export potential risks earning the same disappointment There are valid factor-supply reasons for considering a wide range of industries and sub-industries and of course also on tle demand side their long-run demand prospects
A study of future prospects of world trade in manufactures by Maizels1 has projected a declining share of textiles and clothing2 and other miscellshyaneous manufactures for industrial semi-industrial and non-industrial
IAlfred Maizels Industrial Growth and World Trade (Cambridge CambridgeUniversity Press 1963) pp 402-406
2The share of textile and clothing exports as a percentage of world trade in manufactures declined from 20 in 1937 to 10 in 1959 and is projected todecline further to only 5 by 1970-75
31
countries between the years 1959 and 1970-75 At the same time capital goods and chemical products were projected to attain an increasing share of total imports of virtually all countriesI
A survey of the export(1) performance of nine Asian countries -Singapore Malaya Philippines Hong Kong Taiwan India Pakistan Thailand and also the Republic of Korea - tends to support the arguments so advanced The ast general tendency is that although primary products still constitute the highest percentage of total exports they are a declining share As is shown in Table 6 the percentage share of SITC groups (0-2) that is food beverages tobacco and crude materials has declined from 59 percent of the value of total exports of the nine countries in 1962 to 53 percent in 1965 The largest decline has been for SITC 2 (crude materials) partially as a result of the decline in the export prices of such products as natural rubber Expanding products in this group are oil seeds nuts and kernels wood lumber and cork and crude fertilizers SITC group 0 (food and live animals) has almost maintained its share of total exports between 1962 and 1965 at 22 percent This is partly a result of the high rates of growth of the exports of such processed food products as fish and preparations cereals and preparashytions fruits and vegetables (almost half of its export proceeds from canned and preserved fruits and vegetables) and animal feeding stuff Such products as sugar coffee and tea have shown either very low rates of increase or a declining trend
SITC groups 3-5 (animal and vegtable oils and fats chemical proshyducts and petroleum and coal products) have remained stable maintaining a 7 percent share of the value of total exports with petroleum and its products contributing almost 4 percent The most rapidly growing was SITC 4 (vegetable oils and fats) rising by 455 percent between 1962 and 1965 Exports of chemical products increased by 345 percent and petroleum and products by 14 percent
1Harry Johnson includes such goods among others as manufactures ofexport interest to less developed countries Harry G Johnson EconomicPoliciesTowardLess Developed Countries (New York Frederick A Praeger1967) pp 174-75
(1)From United Nations Commodity Trade Statistics 1965 and UnitedNations Foreign Trade Statistics of Asia and the Far East 1962
32
Table 6
Export Performance of Nine Asian Countries 1962-65
SITC Composition Z Rate of Growth
1962 1965 1962-1965
(0 1 amp 2) 5900 5336 1421
0 Food and Live Animals 2258 2187 2227
1 Beverages and Tobacco 152 136 1314
2 Crude Materials 3489 3012 905
(3 4 amp 5) 708 707 2605
3 Mineral Fuels 386 349 1415
4 Animal and Vegetable 170 196 4553
5 Chemicals 151 161 3453
(6 7 amp 8) 3287 3778 4517
6 Basic Manufactures 2184 2384 3786
7 Machinery and Transport 304 334 3873
8 Miscellaneous Manufactures 798 1059 6763
33
SITC groups 6 7 and 8 encompassing the bulk of manufactured exports-shybasic manufactures machinery and transport equipment and miscellaneous manufactures have gained an increasing share rising from 33 percent in 1962 to 38 percent in 1965 The largest contribution is made by SITC group 6 (basic manufactures) which accounted for 238 percent of total exports in 1965 The most important product under this group is textile yarn and fabshyrics (14) with India Pakistan and Hong Kong followed by Taiwan and Singashypore supplying the largest proportion of its exports SITC 68 of nonferrous metals is the second in significance (45) with tin mainly originating from Malaysia Other important products are wood manufactures mainly suppliedby Philippines Taiwan Korea and Singapore Ocnmetal mineral manufactures mainly originating from India Singapore Taiwan Hong Kong and Thailand iron and steel products from India Singapore Korea and Taiwan leather products basically from India and Pakistan metal products from Hong KongSingapore India Taiwan and Malaya and rubber manufactures from Malaya India and Singapore
SITC group 7 (machinery and transport equipment) constituted 33 pershycent in 1965 and increased by 387 percent between 1962 and 1965 with exshyports of electrical and nonelectrical machinery rising at a higher rate than exports of transport equipment Exports of SITC 8 (iniscellaneous manushyfactures) exhibited the highest rate of growth 676 percent betweeki the two years and contributed 106 percent of total exports in 1965 The most important product in this group was clothing followed by toys and sportinggoods footwear plumbing heating and lighting equipment furniture printshyed ratter and articles of plastic Most of the exports of this group origshyinated from Hong Kong
The following table (7) lists goods with rapid export growth It shows rates of growth and percentage composition of the above products and
other manufactured and semi-manufactured goods of dynamic charactertwo and three SITC digit classifications
in
1Indicating rates of increase above that of total exports (26 percent)
--
34
It is interesting to note that the list to a very large extent consists of manufactures that were shown to be labor intensive by examination of these countries data Most worthy of noting is also the fact that rapidshyly growing manufactured exports from Southeast Asian countries though still concentrated in origin are spread over almost all manufactured groups and extend far beyond the traditional products to which analysis of LDCs comshyparative advantage in manufactures has often been restricted
We should emphasize in conclusion that the right choice of potentiallysuccessful manufacturing industries needs to be complemented by a right mix of policies for promoting exports including conspicuously reasonable exchange rates We need to hope also that the HDCs adopt favorable import policies
It is important for LDCs to maintain price competition in the production of the manufactures in which they specialize a matter of the domestic pricelevel exchange rates and of specific policies There are indications that it is basically those LDCs with favorable export policies that are more successful in their general development efforts
Another important implication involves the skill composition of the labor force Skills including organization and administrative capacity are a scarce resource They should be considered soalong with quantity of capital natural resources and foreign exchange in planning for industrial development Skill availability over the course of time has relevance to the appropriate product mix of individual countries It directly influences the levd of current productivity and productivity potentials for the future
As development proceeds successfully the importance of industries low in skill and capital requirements will subside relative to those more demanding in their requirements
A final caution is relevant Experience in the United States indicates that the kind of industry or sub-industry that a business is in a poor guide to its individual success or failure Expanding fields which on the average are doing well have a built-in check the individual business faces increased competition from expansion of others and new entrants Its fortunes dependcrucially on its management which can cause it to sink in calm seas or sail sturdily through rough weather
35
Table 7 Manufactured Exports of Dynamic Character for
Selected Southeast Asian Countries SITC Product Composition Z Rate of Growth
1965 1962-1965 03 Fish and preparations 110 3884
04 Cereals and Preparatiens 526 4010042 Rice 417 3191046 Wheat meal or flour 16 6360
053 Fruits preserved and prepared 100 7309055 Vegetables preserved and prepared 53 7857
081 Animal feeding stuff 162 3251
24 Wood lumber and cork 338 4879242 Wood rough 4565243 Wood shaped
249 87 8331
27 Crude fertilizers 64 2822
332 Petroleum products 330 2615
422 Fixed vegetables oils nonsoft 189 6434
51 Chemical elements and oxides 4582512 Organic chemicals 30 15 2865513 Inorganic elements and oxides 07 7198
53 Dyes tanning and coloring products 15 3567
541 Medicinal etc products 27 6403
55 Perfumes and cleaning products 45 16748554 Soaps cleaning materials etc 14 12163
561 Fertilizers manufactured 13 6021
581 Plastic materials 08 2629
61 Leather manufactures 106 4276
62 Rubber manufactures nes 24 11773621 Materials of rubber 04 5909629 Rubber articles nes 19 6243
63 Wood and cork manufactures 121 13865
36
65 Textile and yarn fabric 1419 3115 651 Textile yarn and thread 141 5297 652 Cotton fabrics woven 438 4881 657 Floorcoverings tapestry etc 041 2986
66 Non metal mineral manufactures 110 8027 664-5 Glass and glassware 010 2682 667 Pearls precious and semi precious stones 063 16681
67 Iron and steel products 107 13889 673 Iron and steel shapes 036 9259 674 Iron and steel universals plates sheets 025 17618 678 Iron and steel tubes pipes etc 018 12802
68 Non ferrous metals 449 4950 684 Aluminum 010 7169 687 Tin 429 4874
69 Metal Products nes 093 2669 695 Tools 004 3038 696 Cutlery 007 20298
71 Machinery non electric 095 2647 711 Power machinery non electric 020 4657 715 Metal working machinery 003 6400
72 Electrical machinery 130 10064 723 Electrical distributing machinery 006 4267 724 Telecommunication equipment 055 24230 729 Electrical machinery nes 045 5440
812 Plumbing heating and lighting equipment 0301 5133
831 Travel goods handbags 0131 3885
841 Clothing 539 7050
851 Footwear 072 5320
861 Instruments and apparatus 0121 4482 89 Miscellaneous manufactured goods nes 354 8052 892 Printed matter 028 3318 893 Articles of plastic 024 11654 894 Toys and sporting goods 108 12341 896 Works of art etc 013 6475 897 Gold silverware and jewelry 015 4686
Source Calculated from United Nations Commodity Trade Statistics 1965 United Nations Foreign Trade Statistics of Asia and the Far East 1962 and United Nations Yearbook of International Trade Statisshytics 1965
1India not included
37
B - Export Patterns and Trends of Comparative Advantage
The need of Asian countries for sustained export expansion has been much emphasized in recent years These countries have in general experienced slow growth compared to their import and servicing-of-loans requirements As means of meeting the need regional cooperation and integration have been proposed as possible courses of action
But although the export growth of the region has been slow differences in performance among the countries are considerable Differences in export performance would affect the outcome of any preferential scheme that might be adopted and also the willingness of the countries to integrate or to move toward economic integration
This section examines the export performance and the trends of comshypetitiveness of individual Southeast Asian countries Problems of transport costs are treated in C Some implications for regional cooperation are drawn in this section a fuller analysis is given later on An analysis of the accuracy of Asian trade and income statistics on which we must rely throughshyout are presented in III below
This section is divided into
1-Asian performance in world trade 2- Trade with more developed countries (MDCs)
3- Intra-regional trade 1-Asian Performance inWorld Trade
Exports of less developed Asia have grown slowly compared to those of most other world regions (Table 8 ) Its exports to within the region have fallen somewhat (from 29 between 1955-56 and 1965-66) at the same time its exports to more developed countries have remained about stable Asias exports to high income countries are a much larger share of its total exports than its exports to any other region But all the other less developed regions export to high income countries a higher proportion of their total exports than does Asia
In two respects less developed Asia is unique among the worlds lower income regions All the other less developed countries export to the more developed countries (MDCs) a higher proportion of their total exports than does Asia (60 recently) Also Asia has a much larger share of its trade flow to within the region (25 recently) than does any other LDC region
TABLE 8
Export Directions by Regions
A-Less Developed
Asia Exports Less Latin Less Less
Developed America Developed Developed Middle
East More
Developed All
The
Exports of less developed Countries Asia Africa Countries World
Asia to the indicated regions (in $s million FOB) 1955-56 $2535 $140 $2020 $190 $143 $4020 $6870
1965-66 3080 116 2345 308 240 5690 9520
Share of total exports from less developed Asia going to the indicated regions (in ) 1955-56 37 2 29 3 2 59 1007
1965-66 32 12 25 3 3 60 100
B-Exports from the Regions Listed
Exports to more developed countries from the indicated 1938 72 80 7(r 84 68 69 region (in of total exports 1955-56 72 79 59 82 68 67 of the region) 1965-66 72 73 60 80 74 75
Exports to within the same 1938 22 6 1 6 14 69 region (as of total exports 1955-56 24 9 6729 10 13 of each region) 1965-66 21 10 25 7 6 75
C-Exports of the indicated 1938 25 7 5 4 2 41 100Region as of total 1955-56 24 8 7 5 3 65World Exports 1965-66 18 6
100 5 4 3 69 100
Definitions and coverage make 1938 figures not strictly comparable with later data Part of the table is notcarried back to 1938 because of lack of comparability All percentages are rounded to the nearest whole percent We estimate that the accuracy of the data does not warrant putting down fractions of a per cent
Sources United Nations Yearbook nf International Trade Statistics 1966 pp 20-31 op cit 1962 various pages
39
The lagging growth of the regions exports slower than that of Africa and the Middle East is usually explained by the extremely high concentrashytion of exports of traditional primary products combined with a progressively smaller export surplus of food and raw materials Primary commodities (SITC 0 through 4) are three-fourths of the regions total exports We will examine data relevant to this usual explanation below
2- Exports to More Developed Countries
The regions share of total world exports has been falling (7 in 1956shy57 and 5 in 1965-66) But the share of its total exports going to MDCs appears not to have changed greatly the share was 60 in 1965-66 and seems to have been only moderately higher before World War II
The share varies widely for individual countries ranging in 1965 from 95 for the Philippines to 46 for Thailand and 31 for Burma
In evaluating the pattern of individual countries we analyze the extent to which export growth has been affected by two interrelated factors
(1) the compositional effect showing the changing proportion ofworld exports consisting of goods exported by a given regional country
and (2) the competitive effect denoting the changing proportion of world exports of a given commodity that the country provides
To find quantitative values for these effects the hypothetical export growth (h) of a given Asian country (J) is first computed This growth is based on the assumption that the country is able to maintain the same share in each commodity for each export market in the second period as in the first In notational form Js hypothetical export growth (HJ) is as follows
c
Hj =
c i xji where X refers to Js exports to another country i and Mi to is total imports Superscript c indicates the commodity and 1 and 2 refer to periods
The competitive effect ismeasured as the actual export growth (A)of the country minus its hypothetical growth (H) The compositional effect isdefined as H minus D which is the weighted average import growth of its trading partshyners The sum of these effects (A - -H + H D) is the difference between growth rate of the countrys exports and its partners imports (A - D)
40
In computing these effects with respect to the MDCs two periods have been selected Period I (1956 and 1957) and Period II (1964 and 1965) In
each period the average of the two years is used to minimize the yearly
fluctuation of trade values The country-by-coumodity trade data on Asian countries are not readily available especially for the earlier period
(except Malaya-Singapore) To overcome the scarcity-of-data problem the export patterns of Asian countries are approximated from the import data of
their trading partners
The growth rate of the regions as well as individual countries exports to the selected MDCs in terms of the compositional and competitive effects
is given in Table 91 As shown in the last row the region has labged for both composition ind competitive reasons Exports grew only 28 while
total imports of the MDCs rose by 76 from 1956-57 to 1964-65 -- a lag
of 482
The low growth rate for exports of the region is partly due to regional concentration on primary products that have been expanding slowly in the world market This negative compositional effect is not surprising The emphasis
on and effort in Asian countries toward export diversification and toward industrialization is partly a reaction to slowly growing world markets for
primary products
The remainder of the export lag the (negative) competitive effect of 16 or one-third the total export lag of -48 (A-D) is unexpectedly large Even when the unfavorable compositional effect is taken into account the position of the regions exports in various commodities vis-a-vis other world
exporters has declined
l1n computing these effects SITC Group r (Unclassified Goods) ia
excluded The group makes up an almost neglIgible proportion of total exports
2Also see Seiji Nayas Project Research Paper The Commodity Pattern and Export Performance of Developing Asian Countries to the Developed Areaspublished in Economic Development and Cultural Change (July 1967) in which the regions but not individual countries exports to various developed countries are analyzed employing the same method used here with 1962-63 as the terminal period
Table 9 The Compositional and Competitive Effects of Exports to More Developed Countries
by Asian Countries Averages of 1956-57 and 1964-65
Country Exports(in $1000) Growth of Exports Competitive() CompositionalEffect (Z) Difference inEffect (Z)1956-57 Growth ( )1964-65 Actual(A) Hypothetical(H) (A-H) (H-D) (A-D)Burma 67617 63284 -64 793 -857 35 -822 Ceylon 194219 215434 109 265 -156 -493 -649 India 914833 1060360 159 436 -277 -322 -599 Indonesia 592632 590476 - 3 385 -387 -374 -761 Pakistan 266064 244609 -81 315 -396 -443 -839 Philippines 461731 750468 626 408 219 -350 -132 Taiwan 72097 274361 2805 1835 970 1077 2047 Thailand 152747 277069 814 368 446 -391 56
TOTAL 2721940 3477059 277 438 -161 -320 -481
Average growth of more developed countries imports (D) is 7581
42
Within this over-all picture of the region considerable variation exists
in the performance of individual countries Striking differences are revealed
the increase in exports of Taiwan(281) Thailand (81) and the Philippines
(63) is outstandingly high compared with that of other countries some of
whose export values fell absolutely (Indonesia -028 Burma -6 Pakistan-8)
A negative compositional effect is common to most countries considered
reflecting unfavorable commodity shifts in MDC markets for these countries
goods (Taiwan is the main exception)1
But there is a distinctive difference in competitive effects The
countries with fast-rising exports (Taiwan Thailand and the Philippines)
show positive competitive effects Countries with relatively stagnant exports
(Burma Ceylon Pakistan Indonesia and India) show negative effects Furthershy
more the relative sizes of the negative competitive effects (as well as unshy
favorable compositional effects) that have hindered export expansion are large
in some cases more than or close to one-half the total lag (A-D) However
the Philippines was able to offset her unfavorable compositional change conshy
siderably and Thailand more than sufficiently What is implied in Table 11
then is the importance of the competitive effect in influencing relative
export performance
1The country-by-commodity trade data for Malaya and Singapore are most ready available since these countries were the only reporting developingAsian countries in Commodity Trade Statistics until the latter part of the 1950s But they are excluded in Tables 11 and 12 and Appendix Table 17 since the trade data for these two countries are reported together for early years but separately for recent years other reporting countries (MDCs) do not consistently use the same definitiofi of these countries from year to year there are large reporting differences especially in Singapores trade figures probably because of its entrepot trade See Seiji Naya and Theodore Morgans project research paper The Accuracy of International Trade Data The Case of Southeast Asian Countries Journal of the American Statistical Association July 1969
The results based on combined figures for these two countries and which should be interpreted cautiously for the above reasons are as follows 919 (A) 4381 (H) -3661 (A-H) -3001 (H-D) and -4807 (A-D) Comparable results on the intra-regional trade pattern for the two countries are given separately in Table 16
43
In order to determine which commodity groups are responsible for this effect the same computation was made for each comnodity group The results are given in Table 10 together with the commodity composition of exports1
The differences again are striking For Thailand the Philippines and Taiwan positive competitive effects are shown in a relatively large number of comshymodity groups The reverse is true for the other countries although numershyical values differ from commodity to commodity and country to country Furthershy
more in relating Tables 9 and 10 the negative (or positive) competitive effect of a countrys exports (Table 9 ) is shown to be largely due to the negative (or positive) values in primary products especially those that comprise a relatively large proportion of total exports (SITC Groups 0 and 2) That is given the slow expansion of these products in MDC markets the lag in export growth of many Asian countries can be attributed to their inability to maintain even this low growth rate of primary exports
Changes in commodity compositions and export increases by two broad categories primary and manufactured are shown in Table 10 together with total exports of Thailand the Philippines and Taiwan The experience of these countries stands in clear contrast to stagnation for the other countries The commonly held view that countries with high concentrations in primary exports perform poorly is not supported Thailand and the Philippines have done remarkably well and they have a high degree of specialization in primary
exports
1The hypothetical export growth for a given commodity used for this purpose is computed from the formula (page 39)
2The sluggish expansion of primary products inMDC markets (comparedto manufactured products) is reflected in low hypothetical increases (H) ofthese exports Numerical values of the increases for individual commodity groups are not shown in Table 10 They can be found by subtracting competshyitive effect from actual growth A - (A-H) - H
3Examinations of the three-digit commodity exports reveals that these two countries have been able to diversify within primary commodities therebyoff setting the decline of some traditional primary exports by increases ofothers (eg maize and kenaf in the case of Thailand lumber and minerals in the case of the Philippines)
Table 10
The Composition and Competitive Effect of Exports of Asian Countries by Commodity Groups
Averages of 1956-57 (I) and 1964-65 (I1) In PercentagesC - Commodity Composition of Exports
A = Actual Growth of Exports A-H = Competitive Effect
Burma Ceylon India
SITC1 C(I) C(nI) A A-H C(I) C(II) A A-H C(I) C(II) A A-H
0 673 510 -292 -1324 781 798 132 -155 326- 3081 0 0 99 1300 - 206 0 0 02 295 0 25 25 143 -150416 321 85 164 1513 20 -162 320 259 - 607 -46411 426 32 2 0 0 -402 74 4 -374 -8500 0 0 1 39 37 39 200 39 55 -845 -9060 0 0 -2000 6 6 142 -9586 23 60 8 9 217 -12521469 535 8 216 -758 2647 2 4 1300 911 7 374 646 -1191 1 2045 -215 2 68 1986 -1800 0 0 -2900 1 0 0 -3301 10 10 161 -3006
Primary 975 936 -102 986 985 108 716 602 -26(0-4)Manufactured 25 64 1411 14 15 213 284 398 626
(5-8)
TOTAL2 1000 1000 - 64 1000 1000 109 1000 1000 159
Table 10 continued
C Commodity Composition of Exports A = Actual Growth of Exports
A-H - Competitive Effect
SITC1
C(I) Indonesia
C(II) A A-H C(I) Pakistan C(II) A A-H C(I)
Philippines
C(II) A A-i
0 1 2 3 4 5 6 7
8
127 44
553 207 49
6 14 1
0
150 22
393 378 43
9
5
0
0
174 -486 -291 822
-136 520
-623 -494
387
-581 -602 -555 347
-338 -1194 -1891 -2622
-2877
55 1
890 0 0 2
41 3
9
51 0
699 1 0 2
221 8
19
-147 0
-279 +
0 - 53 3928 1241
2918
-430 -618 -541 +
- 19 -1524 3185 - 701
- 234
294 6
600 0
47 3
11 0
39
273 16
541 0
76 2
49 0
43
510 3351 465
+ 1621 435 6398
0
793
304 2505
81 +
1445 513
5761 -2285
-1604
Primary 980 986 3 945 750 -270 948 906 555 (0-4)
Manufactured 20 15 -292 55 250 3199 53 94 1915 (5-8)
TOTAL2 1000 1000 - 3 1000 1000 - 81 1000 1000 626
CONTINUED
TABLE Io continued
=C Comodity Composition of Exports A = Actual Growth of Exports
A-H - Competitive Effect
Taiwan Thailand SITC C(I) C(II) A A-H C(I) C(II) A A-H
0 778 678 2317 303 232 424 2324 1315 1 0 3 + + 8 13 2072 1735 2 110 81 1800 722 751 515 244 88 3 9 2 -307 -1169 0 0 + + 4 1 1 1724 1333 0 0 0 0 5 70 31 653 - 685 3 5 2055 898 6 18 124 25057 24228 5 39 14026 13177 7 0 11 + + 1 0 40 -2488 8 15 71 17002 14738 2 4 2852 59
Primary 897 763 2240 990 953 745 (0-4)
Manufactured 103 237 7701 10 48 7699
TOTAL2 1000 1000 2805 1000 1000 814
1SITC Commodity Groups 0 (Food and Live Animals) 1 ( Beverages and Tobacco) 2 (Crude Materials excluding Fuels) 3(Mineral Fuels etc) 4 (Animal and Vegetable Oils and Fats) 5 (Chemicals 6 (Basic Manufactures) 7(Machines and Transport Equipment) 8 (Miscellaneous Manufactures)
2Total may not add up to 10000 due to rounding For dollar values of exports see Table 2
- denotes positive actual growth of exports and competitive effect (no exports in Period I but positive exports in Period II)
47
In contrast to the varied performances of primary exports the rapid rise in exports of manufactures common to almost all countries is very encouraging (A notable exception is Indonesia with an absolute decline of 29 which is however understandable in view of the countrys political difficulties during the period covered) Some groups of manufactured goods have grown at rates even higher than the relevant import growth of the MDCs indicating positive competitive effects It is worth noting that those countries with expanding primary products tend to perform better in manufactured exports as well
Examination of commodity detail shows that much of manufactured exports are suitable to the factor endowments of this region Among these are textile products footwear plywood and leather These exports have expanded rapidly despite high import protection (especially high effective rates of protectshyion) generally accorded by MDCs on commodities of this type
3- Intra-Rexional Trade
Intra-regional trade (which is strikingly larger than that of other LDC regions) is analyzed here although the record is handicapped by lack of availability of adequate data
The share of intra-Asian trade of the individual countries varies widely ranging from 79 for Laos to 57 for Singapore and 50 for Burma to 6 for Ceylon and 4 for the Philippines (in 196465 Table 11) Most countries show a decline in this trade evident in the Lowered shares from 1956-57 to 1964-65 The large absolute decline of intra-regional shares for Hon- Kong and Indonesia stands out Deviating from this trend are Pakisttn Korea and the Philippines who have had rapid increases in their intra-regional
trade shares
Of course using intra-regional trade shares alone can be misleading A share may be kept fairly constant simply as a reflection of low growth of both total and regional exports as for Burma Or a share may fall at the same time regional trade rises rapidly ie exports to the rest of the world grow faster than intra-regional trade as for Taiwan Cambodia and Thailand The latter pattern is more encouraging than the former
The close association of the relative expansion of intra-regional exports with the export growth to the HDCs is interesting Intra-regional export growth rates for Burma and Indonesia(India also) are extremely low compared with those for the Philippines Taiwan and Thailand That is the latter
48
Table 11 Export Growth and Shares of Intra-Regional Exports Averages of 1956-57
and 1964-65
Country Total Exports (millions ofdollars)
Intra-Regional Ex-ports as of total
Percent Change in Value of
Total Intra-Regional
1956-57 1964-65 1956-57 1964-65 Exports Exports
Burma 2398 2315 518 505 -35 -60 Cambodia 445 965 358 316 1171 915 Ceylon 3587 4015 55 58 119 179 Hong Kong 5461 10775 510 220 973 -148 India 13252 17155 110 97 295 133 Indonesia 9257 6830 332 105 -262 -766 Korea 234 1470 137 234 5282 10734 Laos 12 12 833 792 0 -50 Pakistan 3493 5105 52 198 411 538 Philippines 4355 7545 26 37 732 1451 Taiwan 1333 4415 332 289 2312 1885 Thailand 3495 6100 542 466 745 501 Vietnam 628 420 134 151 -331 -244 Malaya 7260 9610 na 270 324 na Singapore 11285 9434 na 571 -164 na
Sources Data are taken from Direction of Trade for 1956 and 1957 and Direction of Trade A Supplement to International FinancialStatistics for 1964-65 except data for Malaya and Singaporewhich are taken from Yearbook of International Statistics for 1964-65
Note na means not available
49
countries perform well in export markets of both the MDCs and the regionand consequently in total exports the reverse is true for the former countries
Pakistan offers a contrast intra-regional and total exports have grownfast compared to its sluggish exports to MDCs indicating a directional changetowards intra-regional trade
A pronounced directional change away from intra-regional trade (thereverse of Pakistans) is clear for Hong Kong (Table 11) Its total exportsincreased 97 in contrast to the fall of its intra-regional exports by 15 from 1956-57 to 1964-65
The export and import commodity composition and shares of intra-regionaltrade are given together with the total trade of the region in Tables 12 andfor the years 1962 and 196515 Both tables show a considerable differencebetween the compostion of total trade and that of intra-regional trade
Intra-regional exports lean towards manufactured products more than do totalexports (Table 12) a surprisingly large proportion of total manufacturedproducts about 50 go to other countries of the region ( Of course theintra-regional trade share of manufactured products comprises only a small proportion of total imports of manufactures)
Primary commodities make up the largest share of both intra-regionalexports and intra-regional imports 63 and 73 respectively in 1965 Butrelatively small shares of total exports and imports of these primary productsgo to and come from regional countries (24 and 38 respectively in 1965)1
Although not shown here considerable differences exist in the tradecompositon for individual countries The intra-regicnal exports of CambodiaCeylon the Philippines and Thailand (also Burma Indonesia) are relativelyconcentrated in primary products Exports of Malaya Singapore Pakistanand Taiwan (also India and Hong Kong) are less concentrated2
1The pattern varies from commodity to commoditypattern is food trade One example of thisthere are considerable net imports for the regionsas a whole yet more than one-third of rice exports go outside the region
2The countries given in parentheses are not included in Tables14 and15 For Burma India and Pakistan 1965 trade data are not availableHong Kong is excluded because of its typical export structure (primarygoods are less than one-tenth its total exports in 1965)
50
Table 12
Commodity Composition of Total and Intra-Regional Expors of Selected Asian Countries 1962 and 1965
SITC Comnodity Groups Commodity Composition Intra-regional 2 ExportsCode
Total Intra-regional2 ( of Total) 1962 19653 1962 19653 1962 1965
0 Food amp Live Animals 260 281 280 279 326 287
1 Beverages amp Tobacco 9 8 8 5 279 166
2 Crude Materials excl Fuels 449 391 233 235 157 175
3 Mineral Fuels etc 50 47 92 91 557 568
4 Animals amp Veg Oils amp Fats 24 31 21 20 262 180
5 Chemicals 15 17 38 46 780 783
6 Basic Manufactures 131 159 165 169 381 308
7 Machines amp Transport Equipment 33 31 102 95 921 887
8 Misc Manufactured Goods 17 24 38 39 673 484
9 Unclassified Goods 11 11 23 22 606 571
0- 4 793 758 635 629 242 241
5 - 8 196 231 343 373 528 439
Total in 1000 1000 1000 1000 305 292
in $1000000 4011748249 1213114001
Source United Nations Commodity Trade Statistics various issues of 1962 and 1965
NotesN Countries included are the Philippines Singapore Thailand Taiwan Cambodia Ceylon Malaya and Pakistan
2 Intra-regional trade refers to exports of these above countries to countries listed under Other Asia in Commodity Trade Statistics
3 For the Philippines only 1964 figures are used
51
Table 13 Comuodity Composition of Total and Intra-regional Imports of Selected
Asian Countries 1962 and 1965
Commodity Composition Intra-regional
Code Commodity Groups Imports Total intraregiona 2 s Of tot)
1962 19653 1962 19653 1962 1965 0 Food amp Live Animals 164 165 239 281 4021 Beverages amp Tobacco
332 13 12 8 6 160 1032 Crude Materials excl Fuels 137 99 374 297 757 582
3 Minerals Fuels etc 103 83 163 121 4394 Animal amp Veg Oils amp Fats 284
14 15 14 23 276 2875 Chemicals
78 87 26 31 93 706 Basic Manufactures 204 209 88 131 120 1227 Machines amp Transport Equip 227 265 24 36 29 278 Misc Manufactured Goods 46 46 46 51 272 2169 Unclassified Goods 14 18 19 24 389 241
0 -4 431 374 797 728 522 3795 -8 556 608 184 250 91 80
Total in 1000 1000 1000 1000 287 195 in $1000000 4739 0 57966 13106 11204
Source United Nations Commodity Trade Statistics various issues of1962 and 1965
Notes 1 Countries included are the Philippines Singapore ThailandTaiwan Cambodia Ceylon Malaya and Pakistan2 Intra-regional imports are imports from those countries listedunder Other Asia in Commodity Trade Statistics3 For the Philippines only 1964 figures are used
52
The period from 1962 to 1965 is short Nonetheless the intra-regional
trade pattern points to a trend of declining intra-regional trade and to
relatively fast-rising manufactures and stagnant primary products In order
to better analyze intra-regional trade the export performance of individual
countries is discussed here with respect to the two effects competitive and 1compositional The results are summarized in Table 14 (The computational
method employed for this table is the same as that for Table 9 with the
growth rate of total imports of Asia S corresponding to D in Table 9)
The intra-regional export perforimances of Burma Indonesia India Hong
Kong and Singapore are extremely poor in comparison with those of Pakistan
the Philippines Korea Taiwan and Thailand A few qualifications are
however in order Because of the short period for which we have data the
results shown may be due to random fluctuations rather than to trends though
the results conform very closely to those for the longer period of Table 11
The results are also generally similar to those shown for these countries
traue with MDCs in Table 9
The different competitive effects provide implications for intra-regional
trade The countries performing poorly in intra-regional trade are generally
those with negative competitive effects (eg Burma India Indonesia Hong
Kong but not Singapore) Furthermore the negative competitive effects far
exceed the positive compositional effects In contrast the countries that
have been expanding their regional exports (Taiwan Korea the Philippines
Pakistan Thailand and Malaya) have positive competitive effects For Malaya
Pakistan and Thailand negative compositional effects have been more than
offset by positive competitive effects
The comodity breakdown of individual countries indicates that the positive
(or negative) competitive effects are due in large measure to the relative exshy
pansion (or decline) of intra-regional primary exports Furthermore as indishy
cated in Table 13 the intra-regional imports of primary goods declined absolutely
while total imports of these goods were rising The decline of the intrashy
regional primary trade of a few countries had a large dampening effect on total
intra-regional trade
IAs an example figures given for India are for the actual and hypothetical
growth of exports from India to Asia
53
Table 14
Competitive and Compositional Effects of Intra-Asian Trade by Country 1962-65 (in percentages)
Country Growth Rate of Growth Competi- Compo Differ-C yt es tive sitional ences in Export to Asia hsa EffectEffect Growth Rates
AsnActual Hypothe- Countries (A) tical (H) (S) (A-H) (H-S) (A-S)
Burma -439 58 125 -497 - 67 -564 Hong Kong 5 173 177 -168 - 1 -169 India -101 75 174 -176 98 -274 Indonesia -825 - 55 281 -770 -1106-336
Korea 2204 154 103257 1947 2050
Malaya 257 -163 64 420 -227 193 Singapore 157 52 281 106 -229 -124
Pakistan 1275 29 122 1246 - 93 1153 Philippines 1130 768 205 563362 925
Taiwan 702 125 62187 515 577 Thailand 197 142 -185-44 241 55
Notes Data are taken from United Nations Commodity Trade Statistics various
issues of 1962 and 1965 All figures listed are based on import of Asian countries which include
(1) Ceylon (2) Cambodia (3) Malaya (4) Singapore (5) Pakistan (6)Taiwan and (7)Thailand Asian countries which in some cases do not clearly break down imports from particular countries by SITC one-digit codes are excluded for the listed countries concerned The following gives (inparentheses) those Asian countries considered for each of the listed countries
Burma (1 3 4 5 7 above) Malaya (1 2 4 5 6 7)Hong Kong (1 3 4 5 6 7) Singapore (1 2 3 5 6 7)India (1 through 7) Pakistan (1 2 3 4 5 6 7)Indonesia (1 2 3 5 6 7) Philippines (3 4 5 6 7)Korea (3 4 6 7) Thailand (1 3 4 5 6)
54 The negative compositional effects shown for many countries suggest that
Some intra-regional trade decline is due to the small proportion of manufactured goods exports set against the large import requirements of thosm products by countries of the region This trade-reducing effect is likely to continue in the future at a declining rate since most regional counties have been expandshying their manufactured goods exports rapidly
The trend is significant because it is to these very fields that importsubstitution policies are directed and so high protection is accorded The strength of comparative advantage in manufactured goods for the regional counshytries is much greater than it is generally diagnosed And in time a tendency toward more economic cooperation among the countries of the region may facilishytate the exchange of manufactured goods1
The pattern of Asian country exports to MDCs and to their intra-regional neighbors is similar We have not found any significant association between the high concentration of countries such as the Philippines and Thailand and the stagnant performance of other countries such as Burma Indonesia and India A shift increasing the share of manufactured exports is taking placeand should be encouraged to offset the relative stagnation of primary exports The latter has probably been caused in part by heavy industrialization programspursued by many countries in the region tending to divert resources away from production of primary commodities and to push aside the difficult but necessary problems of improving the agricultural sector
The material above has been mainly based on descriptive trade data Ascertaining why these Asian countries perform as differently as they do is another range of inquiry But it is likely that more favorable export pershyformances are largely due to the relatively outward looking economic and
IA greater exchange of commodities especially manufactured goods isentral to the existing and proposed plans for economic cooperation among Asiancountries although progress in this direction so far seems more apparent thanreal --see Theodore Morgan and Nyle Spoelstra eds Economic Interdependencein Southeast Asia (Madison University of Wisconsin Press)
55
trade policies of certain countries (eg Thailand the Philippines Taiwan)and poorer performances tc_the inward looking policies of other countries (eg Burma Ceylon India) In the former countries economic planning is generally adopted to maintain the framework in which economic activilies arepursued by individuals and private firms with a minimum of government intershyvention in the latter countries economic activities are more directly conshytrolled by government
Import substitution policies have in various forms been common to all these countries But outward-looking countries have been more selective in the application of the policy than inward-looking countries Outwardshylooking countries have also exhibited greater concern for economic efficiencyand a tendency toward de-control (ie away from exchange and import control as in the Philippines and Korea in recent years) In Taiwan for a product to be eligible for the import control list the domestic producer has had to show that his factory cost would not be more than 15 above the cif import priceof a similar product 2 Variations in export performance seem in part to be explained by built-in-bias against exports in large-scale import substitution3 programs
1Cf Hla Myint The Inward and Outward Looking Countries of SoutheastAsia and the Economic Future of the Region Research paper 7 February 1966K C Sen The Inward-Looking and Outward-Looking in Southeast Asia Projectpaper of January 1965 Cf also Barend A DeVries The Export Experience ofDeveloping Countries World Bank Staff Occasional Papers 3 InternationalBank for Reconstruction and Development 1967 esp pp 11-15 60-63 43-47 2IMF Annual Report on Exchange Restrictions 19643It is interesting to note that even some of the strong advocates ofprotection have recently expressed considerable disenchantment with the disshytorting effects of excessive protection Mr Raul Prebisch for examplecautions that customs protection has been indulged in excessively and bylimiting competition from abroad has frequently given rise to internal reshystrictive practices or monopolistic combines that weaken the incentive toobtain satisfactory levels of productivity (Raul Prebisch SurmountingObstacles to a Latin American Common Market pp 141-142 in MS Wiconezeked Latin American Economic Integration Frederick A Praeger Inc 1966)
------------------------------------------------------------------------------------------------
Table 15
THE COMPOSITIONAL AND COMPETITIVE EFFECTS OF LESS DEVELOPED ASIAS EXPORT TO MORE DEVELOPED AREAS 1956-57 to 1964-65
(in percentages)
Growth Rate of Actual Growth Southeast Asias Rate of Developed
Developed Countries
Exports to the Developed Areas
Areas Total Imports
Composi-tional Effects
Compe-titive Effects
Differenre in Growth Rates
Actual Hyposhythetical
(A) (H) (D) (H-D) (A-H) (A-D)
US 2913 2494 5633 -3139 419 -2720 UK 603 1852 4100 -2248 -2455 -4703 EEC 2038 4439 9532 -5093 -2401 -7494 Japan 8672 9344 11427 -2083 - 672 -2755 Australia 3271 7494 8519 -1025 -4223 -5248
TOTAL 2774 4381 7581 -3200 -1607 -4807
--
57
C- Cutting transportation costs
Transportation costs like administrative blocks to the movement of goods reduce the potential gains from regional specialization Goods that are relashytively heavy and bulky compared to their value -- which are most goods moving across national boundaries in Southeast Asia -- move by water Is there much room for reducing the costs of ocean transportation in the region
Water transportation costs can be divided into tjo types The first is the expenditures most governments make in providing for waterway and port facilities These costs are indirect as far as the ship owner is concerned The second type is the costs incurred by the carriers directly This cost category consists of two components the capital costs of acquiring equipment and operating costs Permanently reduced freight rates are primarily dependent
on lower costs of operation
Most of the operating costs are port costs Sixty to seventy percent of the cost of transporting cargo at sea is accounted for by what takes place while the ship is at the dock and not by steaming time 1 From the frequent surcharges imposed on shipments to and from Southeast Asia it seems highly probable that a figure near the upper limit is relevant to that area For example a recent study found that delays that could be controlled or avoided
waiting time for pilots tugs barges berths stores and clearance of customs papers --were responsible for more lost time than unavoidable delays such as those due to adverse weather and tides2 There appears to be much scope for improvement
Insurance for the ship and crew is to some extent affected by the degree of congestion of the ports the ships call at and a country can lower the insurance premium paid by the carriers through port improvements Although this part of cost reduction is small compared to other cost reductions achieveable through port improvements from the shipowners viewpoint there may be implication in vigorous action here of other government action to lower port costF that are likely to have a greater final effect on the carriers
costs structies
1DC MacMillan and TB Westfall Competitive General Cargo Ships
(Society of Naval Architects and Marine Engineers November 1960) p2
2NewYork Times (February 21 1965) reviewing a study by the Socony
Oil Company
58 Measures to lower operating costs can also be taken by ship owners
The scope for government action is wider than that for the carriers But there is close relationship between actions taken by the two parties a change by one will have repercussions on the other For example technoshylogical innovations in shipping equipment that require facilities other than those currently available in ports will encourage installation of such facilshyities or else the innovation will not be generally adopted
There is no unique cause-effect relationship between port improvementand carrier innovation However a good case can be made for the portsbeing the major causal factor Ports require huge long-term investments At the time that investment is made the port facilities are adapted to the existing or immediately foreseeable shipping technology The ships on the other hand while requiring large capital investments and having a life of twenty to thirty years are relative to ports short-term investments A ship owner who builds a new ship adapts his ships design to the expected ports
Another means of reducing operating costs is the introduction of largerand more efficient equipment by shipowners This policy is generally limited at present to tanker operations Possible cost reductions are large a tanker of say 65000 tons can operate profitably at rates that would drive a 20000 ton tanker into bankruptcy But tankers cannot carry dry cargoand a dry-cargo ship requires dock space and depth Unless the major portsof the world undertake dredging and enlarge berths dry-cargo ships as large as the modern tankers will be restricted to a very few ports
Innovation by carriers in the field of cargo stowage appears to be thebest cost reducing action they can take Increased use of pallets and conshytainers has been the most important development in this area
Pallets and containers reduce cargo handling and make possible the useof smaller gangs It has been estimated that the use of containers can cut terminal costs by fifty percent on the average and that US ship operatorsin coastwise trade have reduced this costs to one third of the costs faced in the break-bulk system used previously1 An additional advantage of conshytainers is the protection they give against pilfering and rough handlingSuch losses are greater where labor is unskilled and illiterate The gainsin this respect would be particularly great in LDCs
ISee Times (London) January 3-4 1962 quoted in JL Eyre The UnhappyMarriage paper delivered at the American University School of BusinessAdministration (Washington DC May 22 1963) p 5
59
Despite the advantages of using pallets and containers their rate of adoption has been slow Income is lost by many of the participants in marishytime transportation services stevedores forwarders truckers and the port authority Customs procedures are insufficiently flexible for container shipments since ordinary procedures require inspection at the pier rather than at ultimate destinati n A further problem is the balancing of inward and outward use by individual carriers container pools such as those found in Europ can reduce this potential cost
In addition to institutional blocks and delays the use of containers in Southeast Asia has been hampered by the costs of acquiring containers redesigning stowage space and the heavy port installations required Further internal transportation facilities to move the containers are inadequate in most countries of the region In consequence the region is only in the early stages of considering pallet and container port facilities Increased capashycity of ships and quicker turn-around time in more efficient ports like Singapore and Hong Kong seem to be compensating for the extra some five days required now that Suez is closed to sail around the Cape of Good Hope The sharply competitive tramp-shipping trade is expanding
The issues of containerization are therefore being uncertainly antishycipated and faced Hong Kong is cautious Colombo has already one container berth Singapore has built one wharf for bulk cargo There is general rather rapid expansion in port tonnages handled with sharp decline during the past several years in Burma a sharp exception to the trend1
In summary reduced port congestion and innovation in cargo stowage and handling appear to be promising avenues to lower operating costs and hence lower freight rates The scope for governmental action here is wide Futhermore regional cooperation in developing more efficient ports and providing the facilities for containers and container pools on a common standard could bear considerable fruit In these ways the countries of Southshyeast Asia can benefit from a reduced freight bill on their trade both intrashyregionally and with the rest of the world
1Some data on recent shipping volume policies and problems are givenin Far Eastern Review Oct 31 1968
60
D- Asian commercial policies and the possibilities of expanding regional trade
1 Introduction
Tariffs and quantitative restrictions restrict international tradeand administrative practices can do so This section seeks to ascertain the Asian countries that are most likely to cooperate toward expanding their trade by changing their conercial policies To make such a selection we must have a set of criteria in mind for predicting the most likely candidates for
cooperation
In part 2 we examine some recent theoretical contributions on commercial policy bargaining and customs union formation First to be considered is the orthodox approach developed by Viner and extended by Lipsey Meade and Vanek which focuses on the effects of a customs union on welfare derived from personal consumption A second approach to the problem developed by Johnson Copper and Massel will then be presented It defines welfare more broadly to include a collective preference for industrial production Finally the view of trade expansion problems of the developing countries themselves expressed in the UNCTAD document Trade Expansion and Economic Co-operation among Developing Countries will be presented as evidence for emphasizing the selection criteria implied by the second approach
In part 3 of this section the status of quantitative restrictions in nine Asian countries are examined and recent trends defined Part 3 will
- examine tariff schedules primarily of the countries that make the least use of quantitative restrictions Quantitative restrictions are usually more important in checking and blocking trade flows than are tariffs Hence there is considerable presumption that countries making the least use of quantitashytive checks on trade (the most use of tariffs) are the most likely candidates for regional cooperation to facilitate trade flows
2 Theory
(a) The potential gains from freer trade are well known They are assuming unrealistically no influence on the rate of change of technology
skills and organization
61
i - increased specialization according to (even assuming unchanged averagecosts) comparative efficiency
ii - increased realization of economies of scale andiii shy increased efficiency through more specialization among the resources
used -- labor and other resources
If countries have different factor endowments (which includes the subtleshyties of skill and organization differences) and hence different relative cost structures each country can raise its real income through fuller participation in international trade By specializing in the products that can be produced domestically relatively most cheaply and trading a part of these products for other products produced relatively most cheaply by othercountries each country can transform its given factor endowment into a greater quantity of output than it could otherwise
Economies of scale can be achieved by expanding the size of the market Domestic markets especially in LDCs may not be large enough to permit existshying firms to take advantage of the fact that costs can decline as output inshycreases or to permit the building of new plants whose scale is optimal in the sense that they have the lowest possible unit costs
External economies may also be realized by expansion of the market The expansion of one firm in an expanding market can induce the expansion of others if the expanding firm either produces more cheaply an input for other firms or provides a market for the output of the other firms Other external economies such as increased diffusion of technical knowledge and organizational ability can result from non-market inter-action among industshyries To the extent that commercial policies especially administrative practices are applied arbitrarily or on an ad hoc basis the freeing of trade can produce external economies by reducing the risk and uncertainty of international transactions
Where commercial policies protect inefficient firms an increase in competition brought about by freer trade forces a more efficient allocation of resources in all trading countries Increased efficiency may also result from the increased specialization of labor that freer trade makes possible
62Having briefly described the gains that can result from a reduction intrade barriers we move to a discussion of the methods countries can use to
bring about a reduction in barriers to trade The most obvious method for reducing trade barriers is for a countryunilaterally to remove its restrictions on foreign products Governments
are often reluctant to take such steps because they fear that they will losetheir bargaining power in future attempts to induce other countries to lowertheir barriers Or if restrictive commercial practices were originallyinitiated to improve a countrys terms of trade by exploiting monopoly powerunilateral reductions are unlikely Where commercial policies are used toinfluence the domestic distribution of income and employment so as to favor a particular factor of production or power group uncompensated or unilateralreductions in restrictions are not to be expected A final reason why unishylateral reductions in restrictions are unlikely is the infant industry argushyment which has special appeal to less developed countries
Reductions in trade barriers are therefore more likely to be achievedby negotiation than by unilateral action Negotiations under the rules ofGATT should be based on the principles of non-discrimination and reciprocityThe direction of negotiations under these limitations is likely to be shapedby the advanced internationally competitive countries who can offer access to a large well-protected market in return for concessions granted
International negotiations have therefore tended to focus on productsof particular interest to the relatively advuaced countries indirectly disshycriminating against third parties especially less developed nations Forexample the Kennedy Round negotiations were dominated by the products ofspecial interest to the United States and the EEC countries GATT rulesthrough anti-dumping provisions also prohibit the subsidization of exportsLess developed nations faced with balance of payments problems limiteddomestic markets and infant export industries are likely to find export subsidization particularly attractive
GATT rules do sanction customs unions free trade areas and commonmarkets all of them exceptions to the principles of non-discrimination andreciprocity Regional integration schemes are attractive means for lessdeveloped nations to expand exports and to negotiate trade barrier reductions on products of mutual interest so evading the GATT limitations on exportsubsidization and the general requirements of non-discrimination and reciprocity
63
(b) (i) Much of the discussion of regional integration has been in terms of static effects on the allocation of resources that is of increases in specialization according to comparative advantage Viner Meade Lipseyand Johnson have used the traditional definition of welfare based on the pershysonal consumption of goods and services to analyze the effects of changes in the allocation of resources caused by the formation of a customs union Their analysis reduced to barest essentials concludes that there will be gains in welfare for the countries forming a customs union to the extent that the reduction in protection within the union permits a shift toward lower cost sources of supply ie trade creation There will be losses in welfare for the countries of a customs union to the extent that a high external tariff causes the substitution of a higher cost source of supply for a lower cost source of supply from outside the union ie trade diversion
However Lipsey points out that the possibility of substitution in conshysumption qualifies the claim that a trade-diverting customs union alwayslowers welfare By providing the members of the customs union with a wider choice of consumers goods the union can permit a consumer shift to higher utility goods that is the relevant domestic price ratios may diverge more from the union-wide price ratios than from the previous international price ratios
(ii) To go more in detail From the trade-creation-trade-diversion analysis a number of causes can be identified that shape the size of the gains or losses resulting from a customs union (i) The gains from trade creation are larger th greater the differences in relative cost ratios of the countries considering union This is true because the greater the differences in relative cost ratios the greater the scope for specialization according to comparativeadvantage (ii)the losses from trade diversion to the countries forming a customs union are smaller the more competitive and the more similar the goodsthey produce as compared with non-union economies The more these conshyditions hold true the less likely are substitutions of high cost sources of supplies within the union for supplies previously obtained from outside (iii) A customs union moves prices toward the relative price pattern (rates of transportation) of partners and away from the relative price pattern(rates of transformation) in the world outside We therefore expect gainsfrom customs union formation to be larger the greater the proportion of preshy
64
union trade among the prospective members and the smaller the unions volume
of world trade relative to internal production Pre-union trade is evidence
that potential partners are efficient producers whose costs do not exceed world
costs The smaller the ratio of world trade to domestic production the smallshy
er will be the share of supplies from outside the union whose prices are reshy
latively low
Harry Johnson supplements the above reasoning Among his points A
country is more likely to gain from trade creation the higher the initial
level of its tariffs the more elastic is domestic demand for the partners
goods and the more elastic the supply of goods that the partners export A
country is less likely to lose from trade diversion the less elastic are the partners supplies and the less elastic the worlds supplies the less the subshy
stitutability between goods from partner and foreign sources and the lower the tariff on foreign sources after union is formed relative to the pre-union
level
(iii) The preceding analysis is weak as a guide to policy on two grounds
First LDCs are likely to be concerned with their balance of payments position unemployment repercussions inflation implications redistribution
of domestic income and social and political implications of the structural
changes expected in the economy
Second the static orthodox analysis is too limited It employs a defshy
inition of welfare -- the current utility derived from personal consumption of
goods and services -- that is too narrow Loss from trade diversion is normal
among LDCs (that is they are likely to have higher costs in many products
than the outside-of-union MDCs) But they can often and reasonably hope for
offsetting long-run gains through the dynamic improvements mentioned above
feedbacks toward eventual higher skills better organization and the like
Any losses to HDCs may earn a lower emphasis in the total calculation
The static analysis ignores the possible gains from economies external
to the firms that expand (or losses from external die-economies to the firms that contract) Possible economies of scale within the firms need emphasis
and possible business cumulative (business cycle) effects should be considered
The business cycle effects alone can be more important than all the static
effects
65
Dynamic effects primarily the effects on efficiency over time are crucial Long periods of time are necessary to work out the effects of cuts in trade restrictions (How much gain was there immediately from eliminating tariffs among the fledgllmg colonies that formed the United States) Expectations are shifted for the pattern of trade in the years ahead and the impact of those shifts are eventually fundamental The shaping of trade toward a regional network isa basic change
These long-run dynamic effects in outline to be predicted only unshycertainly and in detail usually impossible to predict can easily comshypletely swamp effects predicted in the static kinds of reasoning The static analysis can be nearly irrelevant and if its predictions are taken as indicating the direction of dynamic change it will often be misleading
The rate and pattern of growth of the LDC economies in a union over 1020 and more years after the union is formed are the crucial questions Clues May be found in the static analyses they may also be found more uncertainly and vaguely and also more relevantly in the wide range of other economic and non-economic considerations
(c) Concern with their mixed objectives in addition to the level of income at a point in time has led less developed nations to view industrishyalization as a very desirable goal They argue that external economies especially those arising from the diffusion of technological knowledge are most likely to be found in the manufacturing sector The fact that manushyfactured goods tend to make up a large proportion of imports in less develshyoped countries makes them likely to believe that import substitution which will also improve their countrys balance of payments position is desirable (cf Chenerys view) The terms of trade of primary products compared to manufactured goods are often asserted to be deteriorating (Prebisch) To the extent that foreign factors are concentrated in the export sectors
ISee R F Mikesell The Theory of Conmnon Markets as applied to RegionalArrangements among Developing Countries in International Trade Theoryina Developing World R Harrod and D Hague eds Macmillan London 1963also Organization for Economic Cooperation and Development InternationalEconomic Integration among Development Countries mimeo Paris May 1968 esp pp 3-28
66
the desire to minimize the leakage abroad of future earnings or to maximize the re-investment of future earnings will cause the industrial sector to be preferred over the traditional section (Levin) Finally the historic experience of most of the advanced countries confirms a pattern of developshyment led by rapid growth of the industrial sections (Kuznets)
Cooper Masseland Harry Johnson have developed approaches to the analysis of commercial policy formation that take explicit account of the existence of a collective preference for industrial production Johnson points out that the orthodox approach which focuses on the gains in personal consumption arising from the trade creating effects and the losses from trade diverting effects of a union always leads to advocacy of free trade which is attainable by unilateral action Cooper and Massel point out that the total effects of a customs union results from two processes a tariff lowering trade and income creating step and a tariff raising trade and income diverting step Since unilateral action can achieve gains from the first effect without suffering losses from the second customs union formation according to the orthodox analysis would always be inferior to a unilateral reduction in barriers to trade
To explain such real world phenomena as conercial policies tariff bargaining and the limited conditions under which countries are likely to begin customs union negotiations these authors employ a broader definition of welfare They recognize an association between welfare and personal conshysumption similar to that of the orthodox analysis but in addition they posit that people enjoy increased welfare derived from the collective consumption of domestic industrial production Trade restrictions provide resources to satisfy collective preferences fcr industrial production by placing a tax on the consumer the proceeds of which are transferred to the industrial proshyducer who is unable to compete in the world market
Protective commercial policies can be thought of as an additional resource which the economy uses efficiently when the marginal collective utility from industrial production is equated to the marginal private cost of protection In such a formulation we can not make judgments about the goodness and the badness of orthodox trade creation and trade diversion Trade creation within a customs union results in gain in consumer welfare since consumers obtain goods at a lower cost however trade creation means a decrease in
67
welfare to the extent that a country loses industrial production Trade
diversion results in a loss in consumer welfare through increased costs of
goods and services but in gains by increasing domestic industrial production
This formulation helps account for the facts of tariff bargaining and of
estimates of advantages of customs unions among less developed nations A
reduction in protection implies a reduction in psychic income (through losses
in industrial production) which can be compensated for by less protection
among partners (allowing a rise in industrial production) Countries with
strong competitive positions would be likely to seek such partner concessions
on a multi-national basis But countries with weak comparative advantage in
industrial production could expect to gain little from increased industrial
exports within the union and would suffer from increased competition from
within the union
Discrimination in the guise of a customs union offers a fairly efficient
country a chance to increase industrial exports without suffering losses in
its own industrial production That is countries find that they can satisfy
their preference for industrial production more cheaply than they could in
isolation Each encourages the others exports through granting preferential
entry within the customs union
We have been stressing the factors affecting gains and losses to welfare
when there are changes in industrial production In so far as industrial
production is a goal the most likely candidates to gain industrial productshy
ion by establishing a customs union are countries
i) with a strong and nearly equal preference for industrial production
ii) with weak comparative advantage in industrial production compared to the world
iii) whose comparative advantage ratios differ so that they will each have a profitable basis on which to exchange industrial production and
iv) whose kinds of products are complementary rather than competitive
68
The Coopfr Hassel and Johnson approach does not replace the orthodox approach They have presented reasoning that only qualifies gains and losses
to personal consumption as ordinarily defined
(d) We conclude our discussion of the theory of comnercial policy
formation by listing problems that were broi ht before the 1968 Delhi meetshy
ing of UNCTAD by the less developed nations (UNCTAD Trade Expansion and
Economic Co-operation among Developing Countries 1968)
The UNCTAD document presents the less-developed economy view of the gains from trade Trade is seen not as an end in itself but as a means to foster development Increased exports are needed to pay for the increased imports that usually Rccompany a development effort A market widened by trade is desirable because it enables economies of scale to be captured Greater speshy
cialization of labor and a certain amount of external competition increases
efficiency in line with the general objective of industrialization and
development
Nowhere in the discussion of the gains from trade is increased specialshyization according to the existing pattern of comparative advantage presented as gain Trade is viewed as means of securing industrial development more
effectively Increases in income from a more efficient allocation of resources in the more traditional sectors of the Pconomy are not a concern
UNCTAD discusses a number of influences on the rate of development which therefore should be considerations in the negotiating process
i) The more severe the balance of payments problems of a countrythe more sensitive it is to a possible greater increase in imports than in exports
ii) The greater the disparity in tariff structure before negotiations the greater the problem of establishing an external tariff
iii) The more the reliance on commercial policies to earn government revenue the greater is the readjustment in fiscal policy necessitated by a customs union
iv) The more rapid a countrys rate of inflation the more difficult are payments adjustments within a union
v) The greater the disparity between levels of development the more sensitive a country is to unequal gains in industrial production resulting from the union and the more importantis the problem of compensation within the union
69
vi) The greater the preference for industrial production ofpotential members the more important will be the need forcompensation to insure equitable distribution of economies of scale and external economies arising from the union
3-Quantitative Restrictions
Below is a subnary of a survey of quantitative restrictions in nine Asian countries from 1961 to 1967 Part a contains an overview of the kinds of comercial policies followed by these nine countries A comshyparison of the two years 1961 and 1967 is made and important trends
noted
Next specific restrictions on current account in 1967 are compared to restrictions in 1961 On the basis of their 1967 position the nine countries are divided into three categories relatively unrestrictive moderately restrictshyive and severely restrictive Next an attempt is made to determine the relative positions of these countries within a particular category A rather detailed schedule of changes in current account restrictions for the nine countries is made On the basis of this schedule the countries are divided into those movshying toward freer trade and those having made changes in both directions
Then the nine countries are surveyed as to their treatment of foreign capital in 1967 Policies toward inflow and outflow are noted
When examining comercial policies one is confronted with maze of specific details pertaining to a myriad of international transaction The form the sumshymary below has taken is dictated by the two aims of this survey to present a survey of commercial policies in developing Asia today and to assess the directshyion of change in these policies over the years covered Numerous details concerning the policies of particular countries are excluded
(a) A Survey of Asian Counercial Policies 1961-1967 In Table 16 an assessment of the 1967 position of Asian countries is made
with respect to particular commercial policies and important trends toward the changes in the use of particular commercial policies are noted Where given restrictions or characteristics exist they are marked by an X
Fixed exchange rates usually based on the par value of a countrys currency as established with the IDW have been maintained by five of the countries
surveyed
Table 16
Asian Commercial Policies
67 61 67 61 67 61 7 61 67 61 67 61 67 61 67 61 67 61
0 to 0 -4 0
94
Exchange Rate Agreed Par Value x x x x x x x Par Value Applied x X x x x xx
Unitary Effective Rate Fixed x x x Free x x x Pegged x x x
Special Rates for Capital Transactions x x x Import Rates diff from Export Rates x x x x x Multiple Import Rates x x x x Multiple Export Rates x x x x x
Trade Restrictions On Current Account x x x x x x x xx x x xx x x On Capital Account x x x x x x x x x x x x x x x x
Preecriptions of Currency x x x x x x x x x x x x x x x x
Bilateral Payment Agreements x x x x x x x
Import Surcharges x xx x Advanced Deposit x x x x x x Surrender of Export Proceeds x x x x x x x x x x x x x x x x xx
Part of a Monetary Area x x x x x x Participates in Economic Cooperation x I -
Source INF Annual Report on Exchange Restrictions 1961 1967
71
In the period 1961 to 1967 there has been a movement toward fixed exshy
change rates and the establishment of par values with the IlF The former
British colonies of Burma Ceylon and Malaysia replaced exchange rates pegged
to the British pound Thailand replaced its freely fluctuating exchange rate
and the Philippines replaced its system of multiple exchange rates Contrary
to this trend Burma and Indonesia have moved from their application of a
fixed rate toward the use of multiple exchange rates Pakistan uses multiple
exchange rates to subsidize some exports and to encourage some capital imports
Korea has freely fluctuating rates
Among these countries restrictions on current account range from extensive
state trading in Burma to the absence of any quantitative restrictions in the
Philippines (A detailed survey of current account restrictions will be made
in the next section below)
All Asian countries except the Philippines have restrictions on capital
movements Most countries especially former colonies discriminate between old and new or approved investments Repatriation of old capital is
considered on an individual basis while new capital is in general treated
much more liberally (A detail survey of capital account restrictions will
be made in sections c below)
All countries except Thailand list prescribed currencies with which intershy
national transactions must be made In the last seven years this list has
been widened considerably usually to include the currencies of European countshy
ries All countries require the surrender of export proceeds
Import surcharges have been increasingly used to counteract balance of
payments problems or to raise revenue for defense purposes They are now in
effect in Indonesia Pakistan Ceylon and Taiwan No trend in the use of
advance deposits is apparent for Asian countries as a whole Three countries
have introduced them two countries have abandoned them
There has been a general trend toward bilateral payments agreements
reflecting increased trade between Asian and Communist Bloc countries Ceylon
Pakistan and Malaysia are members of a larger monetary area the Sterling
Area Pakistan participates with Turkey and Iran in a program of regional
cooperation
72
(b) Quantitative Restrictions on Current Account
With the aid of Table 17 the present level of import restriction in
various Asian countries can be evaluated The Philippines Thailand and
Malaysia are the most free of import restrictions although no country
allows completely unrestricted imports The Philippines prohibits imports
of some agricultural products for protective purposes Thailand had in
1967 quantitative restrictions on ten items and Malaysia has prohibited
certain agricultural and industrial products and has recently imposed a
number of quantitative restrictions pending an increase in tariff rates to
protect pioneer industries
The imports of Korea Pakistan Taiwan and Ceylon face more regulation
than do the imports of the Philippines Thailand and Malaysia In lorea
and Pakistan most imports are free or subject to open general licensing
In Korea 87 of imports are made under open general licensing 142 items
require approval and 362 items are prohibited for protective reasons In
Pakistan most items are on the free list and may be imported without quantishy
tative restrictions Licenses for other items are allocated to industries
on the basis of the industrys importance in the nations development program
An industrys ability to earn foreign exchange is considered when import
licenses are issued Importation of some items is prohibited for protective
reasons
Taiwan requires specific licenses for all imports Import quotas are
allocated to industries on the basis of their importance in the overall
development program and their ability to earn foreign exchange In 1964
Taiwan declared that to be eligible for protection an industry had to show
that its costs were not more than 15 above the products import price
Ceylon requires a specific license for all imports A state monopoly
imports forty items Most luxury imports are prohibited
Indonesia and Burma have the most restrictive import regulations Burma
practices state trading and private importers are generally not permitted
In Indonesia most imports have been subject to quantitative restrictions and
sharply differentiated multiple exchange rates
73
Table 17
Current Account Restrictions
67 61 Go 61 67 61 67 ol67 61 67 61 67 61 67 61 67 61
4 0
-4 00 V-4
0d
IMPORTS Open generally or automatishycally approved x x x x x
Free x x x x
Specific licensing and quota xi x4 x x x x x x x x x x
2 3 Prohibited x x x x x
With export vouchers only x
6 State trader x x x
Multiple exchange rates to allocate iLejrts x x
EXPORTS 5 Approval or license required x xx x x x x x x x x
Free x x x x x x x x
Prohibited x
State trader x x
Notes 1 Import of sugar and wheat flour are restricted for protective reasons 2 Import of textiles and most other light manufactured goods from
Communist China are prohibited 3 A few agricultural products are prohibited for protective reasons 4 Ten items still require licenses In 1961 72 items required licenses 5 Rice export is subject to government approval 6 The statecontrols the import and export of about 40 items 7 Korea permits the import of 2984 items on open general license 142 items
required individual licensing 362 items are prohibited The export of a number of raw materials is prohibited
8 Pakistan requires import licenses for most important industrial input 9 Those goods on the free list as well as those which require licensing
are subject to multiple exchange rates
Source Annual Report or Exchange Restrictions International Monetary Fund 1961-1967
Table 18
SIGNIFICANT CHANGES IN CURRENT ACCOUNT POLICY
1961 1962 1963 1964 1965 1966
Government requir- Quotas establighed ed to purchase for TVs table locally goods fans rice mift
Rice import Licensing of Quota on Thai Central govern- whose imported machines bicy -oa
control scheme Soviet Bloc poultry removed ment places price less than and certain tightened sugar removed quotas on 101 107 below the chemicals
MALAYSIA items domestic price Wheat flour im-Licenses are re- port prohibited quired for the Quota removed for import of iron tires and copper and steel bars wire
Registration fee of 504m per ton for ru~de export
Requirement that
PHILIPPINES
Importers of decontrolleditems permitted
Quantitative restrictionsremoved from None None
20 of export -ceeds be surrendb ed at the offi- Export licensing
to use own en
importsoFree
cial rate removed market rateabolished
by Central Bank abolished
Par value export rate established
Export of eggs Cigarettes gunny Prior approval Export control Duties raised rice require bags and timber for export of Import control over sorghum on 10 items specific licens- subject to import large quantity over nickel amp Import license quantity res~L-1 in license of rice required paper established for rice milling tions on 15 items Import of steel Rice price sta- Import restric- machines enamel Export license drumbs fish bilization plan tion on tires ware amp cotton for rice chemicals and establish and tubes yarn discontinued motor vehicles require specific license
Source Survey of Commnercial Policies International Monetary Fund 1961-1967
75
These countries can be ranked according to the degree of current account
restriction they practice The Philippines is the least restrictive followed by Malaysia and Thailand Then come Korea and Pakistan Taiwan comes next followed by Ceylon which practices a great deal of import restriction
Indonesia and Burma are the most restrictive countries surveyed
The pattern of export control is like the pattern of import control Exshyports are in general free of restriction in Malaysia the Philippines Thailand
Korea and Pakistan Exceptions are government control of rice export in Thailand and prohibitions against the export of a few essential products in Pakistan and
Korea China Ceylon Indonesia and Burma require approval for all exports No approval for private exports has been granted in Burma since 1963
Table 20 illustrates the most important changes affecting the current account position of three countries From this kind of table trends toward
increasing or decreasing control can be ascertained which may forecast a countrys
future position on quantitative restrictions
Burma and the Philippines have undergone the most radical though opposite
changes in the use of quantitative controls Between 1963 and 1964 Burma nationalized all international trade Beginning in 1960 the Philippines in contrast gradually abandoned all quantitative restrictions and multiple exchange rates By 1967 the Philippines had become the least restrictive country in Asia
Pakistan and Korea have gradually moved away from quota restrictions
Thailand Ceylon and Malaysia have moved toward increased restrictions Ceylon made the greatest change moving from the application of open general licensing for most categories of imports in 1961 to quantitative restrictions and state
monopoly in 1967 Malaysia temporarily increased quantitative restrictions to protect pioneer industries while tariff increases were being considered
Indonesia although remaining in the most restrictive category liberalized its position considerably moving from a position of 80 state trading in 1961 to the position of issuing licenses to private importers on a quota basis in 1967
These countries can be classified as to whether or not they have been inshycreasing or decreasing current account controls Burma and Ceylon have inshycreased restrictions the most Malaysia and Thailand have made moderate inshycreases in quantitative restrictions Indonesia Pakistan Korea Taiwan and the Philippines have made substantial reductions in quantitative restrictions
on current account transactions
Table 19 - Restrictions on Current Account
1961 1962
Taiwan China
11Z devaluationof None official exchange rate
Ceylon Imports of 45itans Customs duties placed under quit raised by 20 on license from open all items except license food amp pet Imports of tires and tubes pro-
hibited
Korea Retention of ex- None port earning scheme blocked Specid customs duties imposed on luxury goods
Pakistan The list of auto- None matically imported goods doubled to include 62 items 11 items placedm open gen license Export of cotton garments to UK subject to licens
1963 1964 1965
Exchange certi- Decontrolledaoco- None ficate system nut coffee syn-abolished and fix- thetic fibres ed rate set
Pet subject to import license fish amp most other commodities
Restrictions im-
cement fibres unfinished motor cycles frames Quantitative resshytriction would be limited to 3 year To be eligible fo control a product cost less than 15 import price
All products made Imports of Petr subject to indivi products news-dual import lice- print cotton
1966
Controls reshylaxed for a large number of itelub
_
State control of textiles imports was
nse yarn corn fodder announced caustic soda under needed state trading
_
A number of spe- The number of Imports from ports removed frod cial taxes on im- items imported countries with number of items ports were abol-
ished Most goods brought under automatic approval pro-
cedure Number of items imported only byend user reduced
None Restrictions on trade with India established A defense sur-charge of 25 levied on all imports
was doubled whom Korea had favorable B of r were given preshyference
The number of items autoshymatically apshy
up t 3000__oed
Items of free list Govern conad doubled 31 to 66 over import Number industries iron amp steel allowed to apply shy
for import license finished 128-258 64 import Zed4 euro r of metal from US chemicalsput liberalized between on free list raw materials amp Tariff struL
ture revised
_J 8fr 8fdWUX2
-- 1961
Indonesia Import taxes on certain goods eased
Burma Licenses were in-creased to export-ers 27 raw mater-ials could be imported freely from anywhere
1962
Import Quotas sharply reduced
Tires amp tubes removed from open general license petr products chemicals placed on open general license
1963
Effective exchane rates depreciated sharply State monopolies on number of goods ended private importers lic-ensed
All foreign firms prohibited making imports Govern assumed control over all imports amp most exports
1964 1965
New appreciated ex- Withdrew change rate estab from amp all exchange taxei fund that existed abol-ished
Govern would allow importers to bring in any
product but most use own resourm 5 tax imposed on all imports A levy of 1350 Rps per $US was imposed on all imports()
Govern completed none nationalization of export trade
1966
A surcharge of 50 introshyduced for less essential imports
none
78
(c) Quantitative restrictions on foreign capital
Only the Philippines has no restrictions on foreign capital inflows or
outflows The Philippines does however require that at least sixty percent
of the capital invested in extractive industries be of domestic origin Pakistan allows free inflow of foreign capital Malaysia allows free inflow of foreign
capital into a list of approved industries Thailand Ceylon Korea and Indonesi
have no list of approved industries and negotiate terms of entry of foreign capshy
ital completely
Malaysia Ceylon Pakistan and Indonesia distinguish between old foreign
capital and new or approved foreign capital In all these countries except Indonesia repatriation of approved capital is guaranteed although Ceylon and Pakistan limit repatriation in any one year to prevent disturbance of the balshy
ance of payments Indonesia requires prior approval before any capital can be
repatriated
Malaysia Ceylon Pakistan and Indonesia define foreign capital that was in the country before independence as old capital Its repatriation is subshy
ject to individual approval in Ceylon Pakistan and Indonesia Malaysia permits
free repatriation of old capital within the Sterling Area repatriation outshy
side the Sterling Area requires individual approval
Thailand and Burma generally allow free repatriation but both reserve the right to limit repatriation of capital in any one year for particularly large
transactions Korea requires prior approval for any repatriation
There have been relatively few changes in restrictions on foreign capital
over the last seven years The Philippines has undergone the greatest change moving from a position in 1961 of prohibiting all repatriation and of severely
limiting remittance of dividends to a position of permitting the unrestricted
remittance of both in 1963 Other changes of note in the countries surveyed include the establishment in 1964 of blocked Malayan dollar accounts for firms
desiring to remit outside the Sterling Area a moratorium on all remittances
declared by Ceylon in 1964 and the nationalization of all foreign firms in
Burma during 1963 and 1964
79
4- The pattern of tariff protection In evaluating tariff protection and in making international comparisons
one needs to take account of two qualifications One is the uncertainty varying between countries and the times concerned as to valuation of imports and so the rates of duties actually imposed The evidence summarized below on pervasive error in Asian trade data indicates that this worry is no minor one The second is that effective protection not nominal protection is what is important Effective protection is measured by the percentage change in valueshyadded or alternatively in net earnings of the producer in the protected product Suppose a 10 duty is levied on imports of a good for which the doshymestic producer pays out 80 of the former price for his raw materials so that his value-added is 207of the former price When domestic price is raiseshyed by 10 (a simple result that does not always hold) value-added rises (from 20 to 30) by 50
If net earnings (profits) of the producer were half of value added or 10 of the previous price then effective protection defined in relation to net earnings rises (from 10 to 20) by 100
If the cost of raw materials rises as a result of the complete schedule of protection effective protection will be different and is likely to shift surprisingly even to negative levels (which means that cost of raw materials rises by more than does price of final product)
Effective protection has had high success in theoretical tTade discusshysions in recent years and has come to be actively used in practical trade negotiations Its success is justified It offers a much closer approximashytion to measuring the influences on production decisions than does the nomshyinal protection reported in the tariff code books But effective protection is difficult to calculate it requires data on average industry inputs and costs and sometimes firm costs that we do not have in Asian countries in adequate reliability and detail (We have experimented in such a calculashytion for one of our countries which we do not reproduce here) In most countries effective rates are higher and erraticaily higher than nominal rates and that generalization appears to hold for Southeast Asian countries
Bela Balassa does attempt such estimates for four high income countriesand the Common Market Trade Liberalization among Industrial Countries McGraw-Hill 1967 pp 178-184
80
The following samples briefly tariff rates for the four countries of region that rely on tariffs relatively most and on quantitative controls
least
With few exceptions Philippine duties are higher than those of other three countries Philippine duties also seem more consistently graduated to tax more heavily products with a high degree of fabrication The aim is evishydently to protect domestic processing and assembling Effective protection of processing and assembling must be very much greater than the reported nomshy
inal protection
The contrast between the Philippines and the other countries is espeshycially great for such luxury and semi-luxury things as processed foods pershyfumes consumer durables and such import-substitution candidates as cotton yarn and fabrics cement and glass products processed fertilizer and paper
board
Although lower than those of the Philippines Thailands duties are genshyerally high and show little graduation by degree of processing The pattern reflects a heavy reliance on import duties for revenue purposes rather than the aim of protecting domestic industry or controlling consumption
Halaysiasduties on non-consumer goods are generally much lower than those of Thailand and the Philippines Their pattern is closer to that of the Philippines than that of Thailand indicating the ruling purpose of domestic protection rather than revenue Duties are 0 to 5 on investment goods and low for intermediate goods save some of special interest (lumber rubber and tires glass and textile products) which are relatively highly protected Consumer goods are subject to a uniform rate of 25 suggesting the implicit purpose of revenue
Singapore has in general the lowest level of duties Except for rvenue producers such as alcoholic beverages tobacco processed foods cement and a few consumer durables all other items are free Singapore is constrained against raising duties on consumer products because of its over-riding aim of luring a swelling tourist trade through low prices on a wide range of standard consumer goods When it raises duties as in the budget speech of December 1968 it does so cautiously and modestly
--
81
In conclusion the tariff structures of these four countries differ wideshyly in their heights and considerably in the apparent purposes of the levies to raise revenue to check luxury consumption to protect the balance of payments to stimulate domestic industry or some combination of the four
The quantitative and qualitative differences in these tariff schedules and the different commercial and political purposes that the schedules reshyflect are likely to be stubborn obstacles to lowering tariffs in a regional cooperation scheme Reform mongering is possible especially if the goals are modest but it will be difficult
Table 20 - Tariffs-Major Categories
Consumer Goods
Food products
Cereal amp Preparations
Dairy Products
Meats and Preparations
Fish amp Preparations
Sugar
Non-Durables
Coffee and Tea
Alcoholic Beverages
Tobacco
Soap
Essentials Oils amp Perfumes
Pharmaceuticals
Footwear
Garmets
Durables
Refrigerators
Air Conditions
Appliance amp Uandtools
Automobiles
Bicycles
Radio amp TV
Malaysia
0
89
0-20
0-25
40
10
100-200
250
20
0
25 or $12
25
20
20
15-20
0
$14
25
Singapore
0
10
0
0
50
0
60-100
200
20
0
40
0
207
0
0
10
0
0-25
Thailand Philippinea
220 Bakg 10-30 P100kg
Milk Butter 30 5 - 70
25 Bakg 15
307 75
65 25-10 Pkg
25-55 30-75
25-10OBalit 100-2007
40 100 + 8-200Pkg
75OBakg 40
0-80 0-307
30 50-1007
30-40 90-110
60 120-150
60 100
30-55 10-25
60 40-160 Assem 20-30 Unassem
25 80
35 80-100
83
Table 20 (continued)
Intermediate Products I Malaysia ThailandSingapore Philippines
Crude Oil 0 0 0 5
Crude Material including Wood 0-25 0 30 5-10
Thread and Yarn 15 0 lOOBa-220 Cotton Wool Bakg 707 25
Intermediate Products II
Diesel Gasoline Fuels amp Lubricants 3 40 30-40 12-8OBalit 8-257
Chemicals 0 0 30 10-25
Rubber Manufacture 50 50 30 Bel -1 00 Foam Tires 70 140lb 15 30-60 Cement 10 20 150BaMet 60
ton Glass 25 0 50-70 50-70
Iron amp Steel pig and ingots 0 100 0
Metal Manufacture 0-25 0 22-150 10-80 Bakg
Paper amp Paperboard 15 0 10 40-69
Fabrics 25 25-300 50-100
Investment goods amp agriculture imports
Railroad 0 0 5 10
Trucks 0 0 207 15-20
Electric Equipment motors and generators 0-5 0-5 15 10-20 Other 0-5 0-5 80 10-20 Machinery 0 15-250 10-30 Fertilizer 7 0 0 Guano Potassic
0 20 Tractors 0 0 5 10
84
Table 21 Sample Commodities Duties
(Ad Valorem or Specifics Equivalent)
Code Product Malaysia Singapore Thailand Philippines
0 Food and live animals
00 Live animals 0 0 25Bakg 0
01 Meat amp Heat 0-20 0 25Bakg 15 Preparations 0 Milk Butter
02 Dairy Products 8 10 30 5 - 70
03 Fish amp Fish in cans Preparations 0 25 0 30 75
Rice 0 0 22OBakg lO-20P100kg Maise 0 0 220Bakg 15P100kg Flour 0 0 220Bakg 20-30PlO0kg
05 Fruits amp Vege- 60-100 0 50 15-40PlO0kg tables 45 Prefshy
erence raw refined 06 07
Sugar Preparations Coffee Tea
40 107
50 0
65 Coffee Tea
25 -Coffee
1OPkg Tea
25 55 30-40 75 11 Beverages
Beer 100 100 165OBalit 75 Spirits 200 and up 60 24-10OBalit 100-200
12 Tobacco 250 2007 40 or 25-55kg lO0+8-20Pkg
2 Crude Materials 0-25 0 30 5-107 inedible
85
Table 21 (continued)
Code Product Malaysia Singapore Thailand Philippines
3 Mineral Vuel 4 Lubricants
33 Petroleum amp Products
Gasoline 40 $130 gal 80Balit 25 or 40
Kerosene Diesel Residential
2 3
307
30 30 30
33Balit
12Balit
25Balit
87 8
15 Fuels
Crude Oil Lubricating Oil
0 $1gal
0 $1gal
0 66Balit
5 10r
4 Animal amp Vegetable Oils
0 0 44OBakg
or 25 5Pkg
5 Chemicals Sulphuric Acid 0 0 307 25 Nitric Acid 0 0 307 107 Sodium U 0 307 lOPkg Hydroxide
Pharmaceuticals 0 0 0-80 0-30 Soap 207 207 75OBakg 40 Paints 20 25 30 15 Essential Oils 50 0 50 50 Perfumes 50 0 80 200
86
Table 21 (continued)
Code Product Malaysia Singapore Thailand Philippines
6 Manufactured goods
61 Leather goods 25 or rubber 40 or $12 30 50-100 sole rubber sole Belts Foam
85 Rubber Manu- 50 50 30 10 shy 100 facture
Tires 70 140lb 33-132 Ba 30-65
65 Textile Products or 15 ea
grey bleached Yarn cotton 15 0 100-220 707
Bakg
Fabrics cotton 25 or 0 25-30 50-1007 10 cts
Silk Hemp Yarn Fabric Man Made Textile 0-25 0 30-40 25 - 75
products
84 Garments 25 0 30-407 90-110
66 Non Metallic MinerAX Manufacture
Cement 107 20 150Bametton 60
Glassware 25 0 50-70 50-70
67 Iron and Steel
Ingots or Pig 0 0 107 0
Rods Plates Shapes 0 0 10-30 10-307
68 Non Ferrous Metals 0-30 0 30 0-20
69 Manufactures of Metals 0-25 0 22-15OBakg 10-807 most 20
70 Machinery 0 0 15-25 10-30
Refrigerators 20 20 60 120-150
Air cenditioners 20 0 60 100
87
Table 21 (coatinued)
Code Product Halaysia Singapore Thailand Philippines
72 Electrical Equipment
Motors amp generators 0-5 0-5 15 10-20 Other Elect equipment 0-5 0-5 30 10-207 Bulbs 0 0-200 ea 30 10 Batteries amp Cells 25-30 5cent ea 30 20 Radio amp Television 25 Radio T V
0 2 35 80-100Appliances amp Tools 15-20 0 30-55 10-25
73 Transport Equipment Rail 0 0 5 10 Tractors 0 0 5 10 Buses 0 0 20 15-20 Trucks 0 0 20 15-20 Automobiles 0 10 60 40-160 Assem
20-30 UnassemBicycles $14 ($11 0 25 80 prefer)
Fertilizer 7 Guano Potassic0 0 0 20
Source Recent Tariff Codes of the four countries
88
e- Customs Revenue Loss in a Southeast Asian Customs Union
One of the economic deterrents to governments considering the formation of a customs union among LDCs is the possible loss of customs revenue It is
often casually assumed that since governments normally place great reliance on import duties as a source of revenue a customs union would substantially reshy
1duce national revenues The purpose of this note is to examine briefly the significance of the problem as a deterrent to a Southeast Asian customs union
The national governments in Southeast Asia have been obtaining 13 to 30 of their total revenues from import duties (Table 22) By means of a simplified
model we will attempt to indicate how much of this would have to be given up
presumably be replaced from some other revenue source if a customs union were
Table 22 - Import Duties as a Percent of Total National Government
Revenues Selected Southeast Asian Countries 1963-65
Country 1963 19651964
Ceylon 272 297 302
India 133 149 157
Federation of Malaya 297 NA NA
Pakistan 256 160 183
Philippines 219 226 236
Taiwan 172 175 190
Thailand 318 299 226
Source Statistical Office of the UN Statistical Yearbook 1965 for all except Taiwan from Monthly Statistics of the Republic of China Taipei December 1966
Note 1965 figures represent latest available estimates
1Some governments also obtain substantial revenues from export dutieshowever on the assumption that these apply mainly to goods sold outside the region we are ignoring them
89-90 formed We will then present a case study an estimate of the consequences for the Federation of Malaya of a free trade area with the Philippines and Thailand
(1)The Model Consider a typical country with the following pattern of import duties (a) Competitive and luxury imports subject to extremely high duties
(1) For most the rates are prohibitive and hence not
revenue-producing (2) A few luxuries however continue to enter There
is some revenue
(b) Non-competitive imports (1) Near-zero duties are on imports required as inputs for
domestic production and thus negligible revenue generated (2) Moderate to high duties are on non-competitive imports for
final consumption providing almost the entire import duty
revenue Descriptions of such a pattern can be found in a variety of sources
The Overseas Business Reports of the US Department of Commerce containfrequent references to such tariff structures In Taiwan for example the duties under 20 percent apply to books raw materials certain machinery and fuels those between 20 and 40 to products essential to education and healththose between 40 and 80 to most manufactured articles and those above 80 to luxuries and certain textiles2 This structure of tariffs combined with an import licensing system that grants licenses liberally for raw materials capital equipment and essential consumer goods but sharply limits imports of luxuries and of goods produced domestically3 is the frequent and nearshytypical pattern
IUS Department of Commerce Overseas Business Reports (Washington DC)irregular
20BR 64-89 Foreign Trade Regulations of Taiwan September 1964 p 1 31bid p 6
91
Similarly the Thai customs tariff is being used increasingly to protect new industries Luxury items are dutiable at higher rates imports of manushyfactures which are not produced locally are dutiable at lower rates and essenshy
tial materials are often duty free1
The Malayan import tariff automatically provides many Malayan industries with a measure of protection against competing imports In addition a Tariff Advisory Committee has been set up by the Malayan Government to consider applishy
cations of manufacturers for tariff protection the reduction of import duties on raw materials or any application for other assistance or concesshysions involving tariff policy
2
Finally the ECAFE study of import substitution notes the same pattern A brief examination of the tariff rates shows that there are two broad cateshygories of tariffs which may relate to two basic aims of tariff policy One aim is to influence the pattern of domestic consumption by levying high duties on luxuries and semi-luxuries The other aim is to protect domestic industries Essential goods would normally be expected to carry a low tariff(but) the higher rates of import duty are obviously imposed for protection Thus there seems to be a blending of these two basic aims of tariff policy higher duties on non-essentials and essentiala produced adequately or likely to be produced adequately at home lower duties on essentials which cannot be met by domestic
production at present or in the very near future3
A customs union would alter the typical picture just described by eliminashyting duties on intra-union trade but would probably retain approximately the existing pattern of external duties Customs revenue would thus continue to accrue to our typical national government from luxury imports and from nonshycompetitive imports for final consumption coming from outside the union but not from within the union The crucial question then is what proportion of
10BR_ 66-52 Market Factors in Thailand July 1966 p1
2OBR 65-18 Foreign Trade Regulations of Malaya March 1965 p 2
3ECAFE Economic Survey of Asia and the Far East 1963 pp 46-47
92
the value of existing imports in these two categories would be purchased from within the union The answer depends in part on whether one is speaking of the short-run with the existing industrial structures constantor of the longshyrun with time allowed for the establishment of new industries
In the short-run the high degree of similarity in the productive structures and outputs of the economies of the region suggests the following impact on the
revenue-producing imports of a typical country (a) luxury imports would be obtained from outside the union and thus
continue to provide the same revenue (b) A small proportion say (the probably excessive proportion of) 10
or 15 of the value of existing non-competitive consumption imports would be available from within the union Altogether then let us assume that in the short-run union would place 10 of current revenue-producing imports in the duty-free category
The revenue loss in the short-run would be the tariff rate times the value of those imports that will come duty-free from within the union but now pay
duty Assuming a tariff rate of 50 on affected imports 1 then 50 of 10 that is 5 of current national import tariff revenues would be lost by a cusshytoms union This in turn amounts to a normal maximum of 15 of total govshyernment revenue The preceeding (alternative) and similar calculations are presented in tabular form in Table 23
In the long-run union should accelerate the broadening of import substishytution with the tariff wall to include more and more of currently non-competishytive consumption imports from outside the region This would mean a further reduction of revenue-producing imports for our typical country Although it is difficult to determine exactly how much of such structural changes would be attributable to union let us make the extreme assumption that in total 50 of current revenue-producing imports are either eliminated or are obtained
1The assumption of a 50 rate on non-competitive consumption imports isprobably an overstatement Even import substitution items on the average are subject to nominal rates lower than 50
Table 23 Hypothetical Calculations of Revenue
Losses
Alter- Import duties Percent of non- Non-compet- Percent of Tariff Rate Percent of Percent ofnative as a of competitive im- itive imports revenue- on revenue- current total currentnational re- ports available as of rev- producing producing tariff re- national reshyvenue within union enue-producing imports to imports to venue to be venues to be imports be admitted be admitted lost by lost by union
duty-free duty free union
(1) (2) (3) (2)x(3)=(4) (5) (4)x(5)=(6) (1)x(6)=(7)
A 25 125 80 10 50 5 125 B 25 125 80 10 1007 10 250 C 25 125 80 10 25 25 0625 D 20 125 80 10 50 5 10 E 307 125 80 10 50 5 15
94 from within the union Thus again assuming a tariff rate of 50 and that import duties account for 25 of government revenues the government would have to adjust to a loss of (50 times 50) 25 of current import tariff revenues or a maximum of 75 of government revenues (tariff revenues assumed 30 of total revenues) Alternative calculations can be made in the manner of Table 14 above for other long-run assumptions
(2) Example
To illustrate the foregoing analysis consider the impact on the revenues of the Federation of Mlqnta of a hypothetical free trade arrangement with the Philippines and Thailand
The Federation of MalayWa is highly dependent on import duties for revshyenue and would be hard-pressed to replace them completely in a short period(See Table 24) However we will show that the effect on revenues of the assumed free trade arrangement is very small
Table 24 Federation of Masl~sa Revenues of Federal and State Governments (millions of Malay dollars)
1961 1962 1963 1961-63 Taxes on income and
wealth 2396 2351 1964 2237 Export duties 1920 1784 1524 1743 Import duties 3579 3592 3341 3504 Other direct taxes 1178 1202 1584 1321 Other receipts 2654 2755 2819 2743
Total 11727 11684 11232 11548
Source UN National Accounts Yearbook 1963 New York 1964 Estimates forfor 1962 and 1963
95
The minimum loss to theMOIatian government would be the duty collected
on imports from the partner countries Thus inte figure belw ifthe foreign
supply price is Op and the duty rate is pp then the total revenue is
measured by the rectangle pedp If the partner countries supply the quantity
aamp then the revenue collected on imports from the partner countries amounts
to b h k c We calculate this value by applying the scheduled Mak6sim tariff1
to each commodity imported2 in 1963 from the two assumed partner countries
the Philippines and Thailand The results are given in Table 23
Pf
II
a Q
1The Malayan tariff schedule is contained in Malaysia Trade Classificashytion and Customs Tariff (Kuala Lumpur 1964)
2 mport data were taken from Department of Statistics States of Malaya Annual Statistics of External Trade 1963 Vol I Imports
3These results are in summary form The Ml4sysin tariff schedule is at the six-digit level of detail and the calculations therefore were carried out at the six-digit level In this and the subsequent calulation any item generating lecs than M$100 duty was omitted
96 Table 25 Malaysian Revenue Collected on Imports from Two Partner
Countries 1963
SITC Section Duty (in thousand M$)
0 15765 1 25819 2 9840 3 46 4 17 5 36 6 1240 7 00 8 2373
Total 55439
Note Items do not add exactly to total because of rounding
97
The total duty collected on imports from the two partners amounts to only 158 of the duty collected on imports from all sources in 1963
Free trade however will cause a shift of Mmlaysian imports away from traditional sources and towards the partners The crucial question ishow much of the quantity of a f on page 95 would the partners supply in the shortshyrun As a hypothetical extreme we assumed that for each good the partner countries would replace other suppliers in the M aysan market up the amount of their (the partner countries) total exports of that good 1 This procedure assumes that exports of the partner countries are perfect substitutes for the Masysianimports within each SITC six-digit grouping Further we assume that there would be no substitution between SITC six-digit groupings and hence no loss of revenue on other imports The revenue loss calculated on this basis
bullis summarized inTable 26
1Only those goods currently imported from the partner countries are considerud on the ground that the partner countries products are not subshystitutes for the goods of other suppliers if they do not sell currently in the Malayan market These calculations were also carried out at the sixshydigit level using the Philippine export statistics for 1963 (Bureau of Census and Statistics Foreign Trade Statistics of the Philippines 1963Manila) Thai export statistics were for 1964 (Thailand Department of Customs Foreign Trade of Thailand 1964 Vol IIExports and Re-exports)These figures were used because 1963 was not available to us There were a few difficulties encountered in matching items but such cases all inshyvolved small amounts of trade and therefore any inaccuracies arising from this source should have little effect on the result
2No attempt was made to separate out Commonwealth and non-Commonwealth imports that would be eliminated Consequently the full rate was appliedThis assumption yields an upward bias in the calculated duty loss
98
Table 26 Potential Revenue Loss
SITC Section Loss Th M$
0 78626 1 1111649 2 11916 3 46 4 209 5 1332 6 16582 7 00 8 9189
Total 1229550
Total except 1 11 7901
The total potential revenue loss amounts to 3503 of Malayan customs
revenue in 1963 However this is concentrated in Section 1 beverages and
tobacco If one omits the duty loss on Section 1 which could readily be
recouped by imposing equivalent excise taxes the total revenue loss is only1
336 of Malayan import duty revenue in 1963 or approximately 1 of total
Malayan government revenue
Finally we should add that duties collected on-exports to the two
hypothetical partner countries in 1963 was 0105 and of tin 03012 of
total customs revenue
1Further Section 0 includes an assumed Philippine switch of exports of refined sugar from the US to Malaya which is unlikely in view of the high US price paid If this is omitted along with all of Section 1 the revenue loss amounts to 174 of import duty revenue in 1963
2The variable leviT export duty made it impossible for us to calculate the revenue collected on rubber and tin The ad valorem duties on other exports to the partners yielded revenues of less than M$10000
99
The conclusion is clear Both from general reasoning and from the
case example we conclude that government revenue of a typical Southeast
Asian country entering a regional customs union would be reduced very
little in the short-run Long-run structural changes would cause greater
lossbut since intra-union tariff reductions would occur over a period
of a few years adjustment to the loss of revenues should not prove a
major impediment to union
f- Protectionism and the growth of productive efficiency
Let us suwmarize and extend the above and develop policy implications
Trade barriers within the region and internationally are a major qualificashy
tion on the possibilities of achieving comparative advantage growth and of
expanding in the fields where feed-back effects toward still higher efficiency
are most promising They are higher than they seem modest rates on the custshy
oms books (above Section D4) say 10 or 40$ can in fact mean 80 or 200
change in the returns left to the producer when his local business costs are
paid and even more change in his net profits
Modest quotas also can be surprisingly protective to final processors
In addition protective effects are erratic A modest duty on final
output can be transformed when tariffs on inputs into the production process
are counted into a heavy net tax rather than the subsidy innocently intended
by lawmakers High and erratic protection means that the distortion to world
patterns of specialization and the injury to regional and world efficiency
are much greater than have been traditionally thought
Protection in DCs and LDCs alike is relatively high on manufactures
and specially high on more complex manufactures Hence less developed countshy
ries are especially handicapped in trying to expand sales abroad of manufactshy
ures which they judge have feedback and dynamic advantages to them in trainshy
ing of skills improvement of organization and capital formation
These feedback and dynamic effects justify much attention They are
the mainly important potentialities from a regional preference or freershy
trade arrangement
100
In such an arrangement export markets will expand for the proshy
ducts of the most efficient regional countries Domestic markets for their
products are small often very small As the size of the market and the
volume of production expand average costs in many industries can fall sharply
through a considerable range handicraft and small-scale production is outshy
competed by mechanization use of power equipment specialization in subshy
processes and assembly line fabrication Expansion of the market develops
other economies feedback effects in their broadest sense skills and entreshy
preneuring abilities in one industry that are useful also in others better
communications (a road or railroad developed for one business can be used by
others) simplifications and standarization encouraged through producing for
a large market emergence of new industries out of the specialization encourshy
aged by producing for a large market and from more contacts and growth of
a sense of momentum and confidence in economic possibilities
Industries differ in their extent of feedbacks toward higher efficiency
It is sensible in any regional or broader scheme for increased trade to
stimulate those that have the most
The trend of world trade since 1900 and more recently reinforces the
urgency of the argument that LDCs should aim diligently to up-grade their
skills organization and technology and do so as rapidly as they can In
world trade as a whole commodities with low skill-and-capital requirements
have been making up a falling proportion and those with high skill-andshy
capital requirements a rapidly rising proportion The value of food and raw
materials has been rising recently at less than one-fifth the rate of growth
of manufactures Exports of LDCs to high income countries show this same
pattern foodstuffs and agricultural raw materials exports have been rising
recently at the rates of 20 and 14 a year respectively In contrast
manufactures and base metals have been growing recently (1960 to 1964) at
the surprisin rate of 14 a year faster even than petroleum exports
Among manufactures the highest growth rates among exports have been for
machinery and equipment followed by other manufactures textiles
and chemicals
Low income countries have been gaining new markets within the manushy
factures class in the less complex types of producers goods and machine
parts such as electric generators diesel engines locomotives steel frames
101
for furniture and the like 1 These have a high labor content and require
less elaborate marketing than consumer goods especially consumer durables
Tariffs and other restrictionist measures within the region have thereshy
for three reinforcing injurious aspects (1) they are much more distorting to
the efficient static flow of resource use than the nominal rates imply since
it is the effective (not the nominal) rates that count (2) They bear most
heavily on manufactures and the more technical manufactures in which feedshy
back effects toward higher productivity are often most promising (3) They
limit trade in that segment of international commerce the higher skill-andshy
czpital requirement group which are often manufactures in which market opshy
portunities have been growing specially fast
In addition (4) lowered trade barriers within the region and generally
have a special advantage to the smaller LDCs for a reason not often highlightshy
ed LDC economies are typically thin subject to sporadic scarcities and surshy
pluses of particular products due to crop failure or abundance to transport
breakdown to industrial difficulties or successes where suppliers are few and
to failures of central planning There is therefore especially large gain
to their economic life from opening up freer trade channels for supplies and
markets and for this reason they ought to be devout supporters of freer trade
On the other hand because most low-income countries are hIeavily depenshy
dent on government revenues for customs receipts they are inAined to move
cautiously--probably excessively cautiously (see the analysis above)--in lowershy
ing customs levies even though lower rates need not mean lower receipts2
1United Nations World Economic Survey 1962 vol I pp 14 65 T Morgan Economic Relationships among Nations the Pattern of Comodity Trade ch 5 in B Hoselitz ed Economics and the Idea of Mankind pp 156 174
2The subject matter of this section is discussed more in detail in the research paper of the Project entitled Preferences Revisited
102
g- The variety of economic and non-economic cooperation
This section has been centered on the possibilities of regional tradeshy
increasing cooperation with its implications for increased economic efficiency
This is the usual focus of studies of regional cooperation But there are in
addition many other kinds of economic cooperation and many kinds of cooperashy
tion that are not primarily economic
These will be referred to in various contexts in the later sections We
list below four groups to suggest their range and variety Among them are
--informal and formal consultations on economic and other matters
--agreements to undertake cooperative administrative action on economic and other problems of joint concern (eg health measures)
--agreement among two or more countries to commit resources for joint purposes (eg river valley development cooperative deep sea fishing)
--arrangements with international organizations and with countries outside the region to undertake notions of regional benefit (ECAFE and Asian Development Bank activities the Colombo Plan)
Regional advantage as distinct from advantage to one country can come
through (a)measures that benefitting one country can have their advantages
spread to other countries without added cost (eg research and health measures)
(b) projects where there are economies of scale of substantial amount (eg
a regional market can enable output to rise to a level where average costs
are substantially lower) (c) projects and activities that in addition to
their direct effects can stimulate and catalyze across national boundariesshy
broaden peoples horizons encourage them with evidence of possibilities
extend their perspectives raise their usable skills
Potential gains are large The evaluation of their realized amount turns
on the kinds of projects undertaken the conditions under which they are carried
out and the energy and perception applied to them
The acceptance or rejection of any one project proposal rests on the outshy
come of a specific cost-benefit analysis Priority goes to those projects
that rank highest in such analyses up to the limit of the resources available-shy
which is itself a variable depending on the estimated productivity of the reshy
sources at the margin
103
One general presumption gives a useful rule-of-thumb for policy decisions
Projects that expand production andor productivity have an obvious presumption
in their favor Conversely projects that seek high money returns through
checking production andor productivity are suspect The latter of course
deny the basic nature of economic progress which consists of increasing
production or real income The latter are likely also to involve specially
burdensome administrative problems--and administrative efficiency is a major
LDC bottleneck Finallytheir intent is apt to be frustrated by the obvious
the subtle and the manifold inroads of competition both from the same proshy
duct and from substitutes both in the short run and the long run
104
II -Foreign Exchange Constraints and Regional Cooperation in Southeast Asia
One of the most vivid and persistent contraints on economic development is that of scarcity of foreign exchange The Minister of Finance and the Chairman of the Development Board must in the Lypical LDC ask themselves whenever any attractive growth project is proposed Do we iave or can we obtain enough foreign exchange to meet its external costs
In one sense the concern is no more than the inevitable not enough
money image of the resource scarcity permanently faced by any group and anyindividual In another sense if the LDC economy is composed of private maxishymizing units and of government bodies that behave as if they were it reflects disequilibrium exchange rates the exchange rate overvalues domestic currency But the survival power of disequilibrium exchange rates is very great they
1 are chronically with us
A - A Regional payments union
Hence proposals for that form of regional cooperation called a regional payments union continuouslyinvite attention The basic idea is that among the national members of the union a large part of their payments falling due can be offset and cancelled against claims in the oppositedirection Hence an advantage (1) foreign exchange will be economized and there will be a larger value of trade made possible both within the union and between the union members and the outside world A larger volume of trade means that specialization along the lines of comparative advantage can be carried further with its direct (static) and indirect (static and dynamic) advantages to the rate of growth
A payments union can operate in one of several ways Simply lengthening the period over which international payments are made will conserve foreign exchange ordinarily importers must pay their debts in foreign morey on demand or within a limited specified period Instead member countries can designate central authorities to keep accounts in which importers pay and exporters receive domestic money and in which foreign transactions are offset and the
ISee the reasoning of CP Kindleberger Liberal Policies vs Controlsin the Foreign Trade of Developing Countries AID Discussion Paper 14 April 1967
105
net foreign balance settled at the end of some agreed-on-period -- a week or
month for example The national clearing houses are an easy variation on
the exchange control offices with which most LDCs are familiar The latter
are already in fact extending credit across national boundaries as part of
their functioning They grow to extend credit explicitly if member countries
agree to give each other swing credits for say three or more months
Such swing credits function most effectively if changes in bilateral balances
tend to average out over the settlement period
If a regional clearing office is set up the bookkeeping can be done
more efficiently 1regional clearing house can by joint agreement grow
into a central authority with specified powers among which may be the estabshy
lishment of common unit of account for settling balances Such accounting
units permit still greater foreign exchange economizing the credits of a
persistent creditor can be used to finance negative balances of a persistent
debtor country -- up to agreed-on amountis and time periods
Two additional advantages are sometimes claimed for a payments union
among LDCs (2) Through regional cooperation it may be possible to avoid
some of the ordinary financial charges on international transactions Proshy
ponentsof financial cooperation for Central American have made such of the 1
savings that would result from by-passing New York as a financial center
In the past for example payment for an export from Guatemala to Nicaragua
had to pass through New York banks and thus was subject to a maximum of two
financial charges one when the importers cordobas were converted into dollars
for payment and again when the exporter took payment in quetzales The same
kind of economy -- not large but something -- would be obtained in Asia
through a regional payments union to the extent obligations can be settled
directly in rupiah or baht or pesos rather than indirectly into pounds or 2
dollars and out again
1John Parke Young Central American Monetary Union United States Department of State Agency for International Development RCCAP 1965
2This economy is advocated cautiously by RobertTriffin in a intershy
esting symposium with disbelievers in an Asian Payments Union Japan and the Development of Asia The Oriental Economist Nov 1968 pp 26-38
106
(3)A third claimed advantage stems from the fact I that currencies of
LDCs are usually overvalued and often inconvertible By clearing through the
union member countries avoid paying the premia in local currency that would
otherwise be required to obtain hard currencies needed to finance intrashy
regional trade Some further saving in charges may therefore result
(4)Finally there are the advantages of more home rule Decisions on
credits and other payment terms are made less in London or New York and to a
greater extent within the region Nationalist sentiments are favored and governments grow more into the habit of considering regional incerost and of
cooperating with their neighbors in the joint interest This advantage may be
the most important of all those claimed
One of two conditions must be met in order for a payments union to be successful The totals of existing and incremental intra-regional trade may or may not be fairly evenly offset among countries If persistent creditors
and debtors become conspicuous the union is threatened with breakdown But
it can still survive if the persistent creditors are willing to lend at long term to cover the deficits of the persistent debtors within the region We
illustrate with concrete examples
The most conspicuous payments union of the post-war period is the Euroshy
pean Payments Union (EPU) in operation from 1950 to 1958 The EPU structure provided for a se tlement period of one month with swing credits allowed over a longer period European trade and financial flows tended to be unbalanced
but the EPU was able to function effectively because the nations that became
persistent creditors (especially Germany) were willing ultimately to convert the short term balances of the persistent debtors (Greece and Italy) into long
term loans
The EPU operated under unique historical circumstances the economies
and trade network of Europe had been disrupted by World War II and were afflictshy
ed in the early 1950s by what was called partly misleadingly the dollar
shortage Thus the EPU helped provide liquidity and time for the European
Countries to rebuild already proven industrial structures and reconstruct old patterns of intra-regional trade With the successful recovery of Europe the
basically discriminatory payments arrangements could be abandoned A return
to convertibility was possible by 1958
1Jaroslav Vanek Payments Unions Among the Less Developed Countries and Their Economic Integration Journal of Common Market Studies(Dec 1966)
107
In partial contrast with EPU the Central American experiment began as
a clearing-house with minimal credit provisions progressed through a stage of bilateral credit arrangements and has evolved to a stage where liabilities
and claims within the Union are stated in a common unit of account--the Central
American peso The success of the organization owes much to strong support by the authorities of the countries involved In addition the initially balanced trade pattern of Central American and especially the balanced growth of regional trade must also have contributed And the balanced growth of trade has to be
attributed to factors and policies other than the payments union itself (eg
to the program of integration industries)
The situation in Southeast Asia is different from those just described
in important respects
We have examined the possibilities for a payments union among six counshytries of Southeast Asia proper Burma Cambodia Indonesia Malaysia-Singapore
the Philippines and Thailand The calculation is necessarily based only on
reported trade and is therefore subject to uncertainties surrounding trade data (see below Section III) But the data indicate that the benefits from creation
of a payment union among these six while positive would be small
The main reason for this conclusion is shown in Table 27 which lists bilateral trade balances among the six countries on the right with imports of the country (-) subtracted from exports (+) The bilateral negative balshy
ances are subtracted from the bilateral positive balances to give the net poshysition gross claims have no such subtraction Both totals are given with
and without Burma and Cambodia which are special cases
The pattern of trade so measured has remained very stable and it is
clearly unbalanced Simple debt pooling would promptly lead to the appearance of heavy creditors and heavy debtors both between pairs of trading countries
and between a given country and the region as a whole There is little reason
to expect the regional creditor nations (Thailand Indonesia and Cambodia who are caught up in their own development problems to be willing to advance long term credits to the persistent regional debtors (the Philippines and
Malaysia-Singapore)
But because--as we shall see--this debtor-creditor problem can be overshy
come in various other ways we should inquire as to whether or not at least
savings in foreign exchange would be possible Quarterly trade balances
Table 27
INTRAREGIONAL BILATERAL BALANCES OF TRADE 1958-1965
(recorded exports in millions of US dollars)
Trade Net Net Gross Claims
ofwith Burma Cambodia Indonesia Malaysia Philippines Thailand Position Position ClaimswithoutBurmaampBurmaBurma amp
without ampCambodia
Cambodia
Burma
1965 x - - - + 69 + 76 +310 -17 + 438 + 455 1964 x - - - +316 + 94 + 91 -01 + 500 + 501 1963 x - - shy +312 +169 +126 -05 + 602 + 602 1962 x - - shy +310 +146 - 01 -13 + 442 + 456 1961 x - - - +306 +152 + 04 -12 + 450 + 462 1960 x - - - +411 + 76 - - - -03 + 484 + 487 1959 x - - - +352 + 71 - - - +06 + 429 + 435 1958 x - - - +249 +161 + 32 -08 + 434 + 447
TOTAL +3779 +3845
Cambodia 1965 - - - x - 32 +124 + 57 - - - + 149 + 181 1964 - - - x - 21 +107 + 08 - - - + 95 + 115 1963 - - - x - 58 + 93 - - - - + 35 + 93 1962 - - - x + 01 -22 - -- - - - - 21 + 01 1961 - - - x - 02 -08 - - - - 10 - - -
1960 - - - x + 05 + 64 - - - - - - + 69 + 69 1959 - - - x - - - + 43 - - - - - - + 34 + 34 1958 - - - x - - - + 72 - - - - - - + 72 + 72
TOTAL + 423 + 565
Indonesia
1965 - 69 + 32 x - - - + 173 + 29 + 165 + 202 + 234 + 202 1964 -316 + 21 x - - - + 213 -285 - 367 - 72 + 234 + 213 1963 -312 + 58 x - 162 + 189 - 34 - 261 - 07 + 247 + 189
0-
- - -
- - -
Trade ofwith
Indonesia
1962
1961
1960
1959
1958
TOTAL
Burma
-310
-306
-411
-352
-249
Cambodia
- 01
+ 02
- 05
Table 27 (cont)
INTRAREGIONAL BILATErAL BALANCES OF TRADE 1958-65
(recorded exports in millions of US dollars)
Net NetPosiion Indonesia Malaysia Philippines Thailand Position Position
Without Burma amp Cambodia
x - 414 + 239 + 53 - 433 - 122
x +1348 + 192 -112 +1473 +1777
x +2001 + 191 - 90 +1686 +2102
x +1777 + 184 + 08 +1617 +1969
x + 954 + 290 - 76 + 919 +1168
44849 +7261
Gross Claims
+ 292
+1891
+2192
+1969
+1244
+8303
GrossGrs Claims Without Burma amp Cambodia
+ 292
+1889
+2192
+1969
+1244
+8190
Table 27 (cont)INTRAREGIONAL BILATERAL BALANCES OF TRADE 1958-1965 (recorded exports in millions of US dollars)
Trade of
Burma Cambodia Indonesia Malaysia Philippines Thailand Net Position
Net Position
Gross Claims
Gross Claims
with without without Burma amp Burma amp
Subject Countries
Cambodia Cambodia
Malaysia 1965 - 76 -124 - - shy x + 113 -1163 -1255 -1055 + 113 + 113 1964 - 94 -107 - - shy x + 79 -1119 -1241 -1040 + 79 + 79 1963 -169 - 93 + 162 x + 114 -1029 -1055 - 753 + 276 + 276 1962 1961
-146 -152
+ +
22 08
+ 414 -1348
x x
+ +
86 68
-1051 - 747
- 675 -2171
- 551 -2027
+ 522 + 76
+ +
50z 68
1960 - 76 - 64 -2001 x + 193 - 606 -2554 -2413 + 193 + 193 1959 - 71 - 34 -1777 x + 189 - 679 -2372 -2267 + 189 + 189 1958 -161 - 72 - 954 x + 174 - 553 -1566 -1333 + 174 + 174
TOTAL -12849 -11439 +1622 + 1594
Philippines 1965 -310 - 57 - 173 - 113 x - 145 - 798 - 431 - - - - - -1964 - 91 - 08 - 213 - 79 x - 133 - 524 - 425 - - - - - -1963 -126 - - - - 189 - 104 x - 72 - 491 - 365 - - shy - - -1962 + 01 - - - - 239 - 86 x - 06 - 330 - 331 + 01 - - -1961 - 04 - - - - 192 - 68 x - 164 - 428 - 424 - - - - - -1960 - - - - - - - 191 - 194 x - 04 - 389 - 389 - shy - - - -1959 - - - - - - - 184 - 189 x + 02 - 371 - 371 + 02 + 02 1958 - 32 - - - - 290 - 174 x - 59 - 555 - 523
TOTAL -3886 -3259 + 03 + 02
Thailand 1965 + 17 - - - - 29 +1168 + 145 x +1301 +1283 +1312 + 1295 1964 + 01 - - shy + 285 +1119 + 133 x +1538 +1537 +1538 + 1537 1963 + 05 - - shy + 34 +1029 + 72 x +1140 +1135 +1140 + 1135 1962 + 13 - - - - 53 +1051 + 06 x +1017 +1004 +1070 + 1052 1961 + 12 - - shy + 112 + 747 + 164 x +1035 +1023 +1035 + 1023 1960 + 03 - - - + 90 + 606 + 04 x + 703 + 700 + 703 + 70v 1959 - 06 - - - - 08 + 679 - 02 x + 663 + 669 + 679 + 673 1958 + 08 - - - + 76 + 553 + 59 x + 696 + 688 + 696 + 688
TOTAL +8093 +8039 +8173 + 8108
for these countries for the years 1962-1)65 have been calculated The
quarterly pattern indicates that a payments union based on quarterly
swing credits would not save appreciable (added) amounts of foreign exshy
there are very few swings in quarterly bilateral balanceschange
Nevertheless a simple clearing union would lead to some saving of
foreign exchange simply because weekly r longer clearing periods would
We have been unable to determineallow some transaction to be offset
substantial savings in the administrative costs of makingwhether net
Partly for his reason we have made no attempttransactions would result
the actual monetary costs of operating a to determine whether or not
regional payments union in Southeast Asia would exceed the monetary beneshy
fits (measured in foreign exchange)
Although the detailed study was made for six countries might there
be some other group of countries in the region that could form a viable
payments union Professor Nurul Islam I has suggested that Pakistan and
India might benefit considerably from a payments union with other countries
But from the data we have available we conclude there isin the region
that otherlittle in the pattern of bilateral trade balances Lo indicate
groups of the region larger or smaller could form a viable payments union
There would still be persistent and extreme creditors and debtors for whatshy
ever plausible set of countries one selects
re-The above analysis is based on the existirg pattern of trade and
Let us approachgretably but necessarily on an uncertain statistical base
the problem in a different way
A relevant question is whether or not the existing low levels of inshy
the lack of bilatoral or multilateral balancetraregional trade as well as
a result of a past histury ofin the region may nut to some z be
1Nurul Islem Comment in T Morgan and N Spoelstra eds
in Southeast Asia University of Wisconsin PressEconomic Interdependence
Madison 1969
112
regional payments problems For example the regions Sterling bloc
countries (Ceylon Burma and Malaysia-Singapore) adjusted the direction
and composition of their foreign trade during the 1950s to cooperate
with the requirements of the entire Sterling bloc 1 But the Asian case
on the whole does not seem to be one of regaining a past pattern of
regional trade Froe the evidence on trade and economic structure preshy
sented earlier we judge that the present pattern of regional trade is
primarily due to fundamental structural economic characteristics of the
region Analogies between Europe in the 1950s and Southeast Asia at
present are not appropriate
There are it is true incipient changes in the structure of Asian
production and trade that may prove to be a basic for meaningful cooperashy
tion in the future And an Asian payments union may have indirect effects
of the type that apparently were important for Central America facilishy
tating and accelerating other forces for change But a payments union for
Asia (as for Central America) is more likely to be a permissive or passive
factor than an initiating or active force We find little evidence that a
payments union will by itself do much to increase the volume of Asian
regional trade
In addition to these considerations we should report a minus that
stems from a fundamental reality of the region In recent years several
countries -- notably Thailand Malaysia Singapore and the Philippines shy
have enjoyed absence of pressure on their exchange rates as well as a
favorable basic international reserve position Other countries -- Pakistan
India Burma Indonesia and Ceylon -- have operated under often extreme
foreign exchange pressures with the familiar accompanying features of
overvalued rates complicated systems of exchange control and bilateral
trading arrangements
Professor Islams point about the potential benefit of a payments
union to deficit countries like Pakistan is well taken But it is not
clear that countries in the first (surplus) group have much incentive to
enter into payments arrangements with the second (deficit) group The
countries with comfortable reserve positions and reasonable exchange rates
1American Trade with Asia and the Far East Robert J Barr ed
Marquette University Press 1959
113
have maintained satisfactory export performance and they have been free
to import the commodities they choose from any source they choose
Because their participation in a regional arrangement with the deficit
group might require purchases of less-desirable products from within
the region and because there might be some planned or unplanned poolshy
ing of regional foreign exchange reserves countries in the first group
would probably suffer a clear loss from being cooperators They would
do better by acting alone
If in anticipation of economic benefits or for other policy reasons
a payments union should be established in Southeast Asia there are cershy
tain policies that might be adopted to maximize short run and long run
benefits Nurul Islam suggests one possibility1
The credit facilities would be extended to
the deficits and surpluses arising not out of total trade but from incremental trade among the member countries Thevolume of trade taken as the base for estimating increments could be a moving base which can
be taken to increase by a given percentage per year
Instead of an incremental trade or payments union suggested by Islam
a complete payments union would be possible despite the presence of exshy
treme creditors and debtors if the problem of extending regional long
term credits could be solved One possible solution would be to use
external foreign aid to support the net positions of debtor countries
with the rest of region Of course adequate safeguards would have to
be employed so that debtor countries would not be able to run up excesshy
sive obligations A general infusion of long term capital into the
region through the payments union is preferable to bilateral aid to the
extent that a payments union (1) allows more scope for the price mechanshy
ism to operate to fix the patterns of intraregional trade and of regional
location of industry and (2) introduces useful regional disciplines
against low-efficiency uses of foreign aid
1 Nurul Islam Comment in T Morgan and N Spoelstra op cit
114
In view of the above arguments an obvious institutional arrangeshyment for regional cooperation might be a regional payments union combined in some way with a regional development bank One of the functions of the development bank would be to finance by long term investment the net
regional trade deficits of slow growing countries
B - The end of the Vietnam War
The hoped-for and prospective easing off and perhaps ending of the Vietnam war offers an obvious opportunity for useful regional cooperation The present payments flows within the Region are influenced by direct and indirect spending for the War Continuing studies of these payments flows by countries kinds and amounts can be helpful in envisaging what is likely once the War ends and what compensating policies on a regional basis are most feasible AID can be helpfu in such studies the Asian Development Bank at Manila will naturally carry them on other organizashy
tions may assist
C - Two gaps saving and foreign exchange
as checks on regional growth
In the growth literature of the past several years attention has often been directed to the concept of a double gap -- a domestic savshyings gap and a foreign exchange gap -- that checks economic growth The argument is that LDCs are generally deficient in the ability to finance domestic capital formation (the domestic savings gap) and that this capishytal deficiency can be met only through kinds of goods and skills that must be imported in excess of what can be paid for by prospective exports (the foreign exchange gap)
This approach assumes a division of income between consumption which does not contribute to real income growth and nationai -- accounts-shydefinition savings (identical in total to investment) which does A target rate of growth of GNP is accepted and a constant incremental capitalshyoutput ratio assumed (dKdO equals a fixed value) Hence a minimum sufshyficient rate of savings (investment) is implied Part of those investment goods may have to be imported because of domestic production lacks
115
If resources can be shifted readily between domestic investment use
and exports abroad then no distinction need be drawn between the savshy
ings gap and the foreign exchange gap The question of the two gaps
arises in this model when resources cannot be so shifted
The two-gap approach has the inconvenience of diverting attention
from the accounting fact that a savings-investment relation is not someshy
thing separate but is implicit in the balance of payments A surplus
of imports over exports is necessarily equal to the surplus of products
utilized by the economy over products created by it or the excess of
investment over saving1
More savings that is less consumption if income and domestic conshy
sumption are constant is a condition for closing the foreign exchange 2
gap
1Harry Johnson Economic Policies toward Less Developed Countries Allen amp Unwin London 1967 pp 53-54
2This is the Absorption Approach to the balance of payments which
states that an improvement in a countrys balance of payments implies an increase in savings a decline in domestic investment or some combination of the two In this approach the balance of payments is generally deshyfined in terms of B-Y-E where Y is total income from home production and E is total domestic expenditure This can be derived from the usual foreign trade definition as follows
Let M be total imports X the total production of exportables of which Xh is consumed at home and Xf exported so that
X = Xh + Xf
Y be total income derived from production of exportshyables X and of goods sold at home only H so that
Y - X + H
E be total domestic expenditure both for consumption C and investment I so that
E - C + I H + M + Xh
116
Foreign exchange earnings are a constraint on the process of 1
economic growth if (a) the elesticity of demand for the countrys
exports is close to unity or is less than unity so that a rise in the
quantity of exports cannot (much or at all) raise foreign exchange
earnings or if additional resources cannot be freed to flow into export
uses and if (b) the growth of the economy is dependent on the import of
strategic goods and services including capital goods intermediate inshy
puts and raw materials and also goods conventionally classed as conshy
sumer goods that are nonetheless necessary for growth Foreign exshy
change is assumed not to be significantly available through external
assistance
(continued from page 115)
Then the balance of payments (surplus or deficit)
B X - M
X-Xh-M
(Y-H)- (E - H) Y- E
But also total income is (conventially) defined as distributed between savings S and consumption C so that
Y = S + C and E I + C
So that B (S + C) - (I + C) or
B S - I
1Ronald I McKinnon Foreign Exchange Constraints in Economic Devshylopment and Efficient Aid Allocation The Economic Journal June 1964 pp 388-409 JoiFei and Douglas Paauw Foreign Assistance and Self-Help A Reappraisal of Development Finance The Review of Economics and Statistics August 1965 pp 251-267 Hollis B Chenery and AM Strout Foreign Assistance and Economic Development American Economic Review September 1966 pp 679-733
117
Domestic savings are said to be a constraint on the process of
growth if required (national-accounts-definition) investments are not
created by the economy in adequate quantity (Savings are not of
course a cowtaint on growth to the extent specific kinds of consumpshy
tion needed for growth are bottlenecks or institutional or other blocks
limit the usefulness of more capital goods These are major qualifications)1
There is no unique sequence of the two constraints nor is there any
a prior reason why either of the two constraints must have a finite termshy
ination data It may be that for some countries only one constraint is
binding then the other is never relevant
Limits on the availability of foreign exchange are (1) demand
oriented if the elasticity or position of the foreign demand curve for
the LDC countrys exports is the block The elasticity of demand for
the countrys exports may be near one or be less than one so that no
amount of output increase will increase foreign exchange earnings There
may be a problem of secular stagnant demand Price instability may be
the problem the prices of a countrys exports can fall for a number of
crucial years Technological change abroad sometimes threateas the sales
of LDC exports There may also be institutional barriers to trade -shy
tariff or non-tariff restrictions that prevent the LDCs from exploiting
fully their comparative advantage
A frequent cause of sluggish foreign demand is simply that exports
are priced too high in foreign markets The problem is a combination
of the exchange rate and of domestic price trends -- so that eventually
given the current domestic price level the exchange rate ove(-alues the
currency The policies involved may be forced by political considerations
or they may be unintentional or the result of inaction We assume what
is usually the case that demand for the exports of the given country is
reasonably elastic Then a rise in price to foreign buyers will decrease
foreign exchange earnings
1See our Research Paper 11 Investment Versus Growth summarized in part below in III-B
118
Alternately limits on the availability of foreign exchange are
(2) supply oriented if (a) the supply of exports cannot be readily exshy
panded or if (b) the supply of exports is so erratic or the quality so
poor that foreign markets find them unattractive
1 - Empirical Studies
All the specific causes of export earnings lag listed above are
relevant to Southeast Asian experience Three of the papers of this
Project relate to the over-pricing of exports I -- which appears to be a
thoroughly important possible error of policy or of omission of policy
We have surveyed above (Section I-B) the study in the Project2 of the
export lag of Southeast Asian countries in terms of compositional
effect and competitive effect We summarize briefly
We saw in Section I-B that the compositional effect is a measure
of demand deficiency the competitive effect is a measure of supply
deficiency or maladaptation The compositional effect is defined statisshy
tically as the difference between the growth rate for the Southeast Asia
kind of mix of exports into the More Developed Areas and the growth rate
of total imports into those areas The compositional effect therefore
indicates the extent to which Southeast Asia exports to MDCs are helped
or injured because they are like or unlike what the MDCs are importing
1Hla Myint The Inward and Outward Looking Countries of Southeast Asia and the Economic Future of the Region Research Paper 7 Feb 1966 KC Sen The Inward-Looking and the Outward-Looking in Southeast Asia Jan 1965 KC Sen Economic Growth and the Price Level -- an Analysis of Some Asian Data Research Paper 13 Mar 1966
2Seiji Naya The Commodity Pattern and Performance of Southeast Asias Exports to the Developed AreasResearch Paper 10 May 1966 The Southeast Asian countries include Burma Ceylon India Malaysia Singashypore Laos the Republic of Vietnam Cambodia the Philippines Thailand China (Taiwan) Hong Kong and the Republic of South Korea The developed countries consist of 20 countries in seven areas the US Canada Japan Australia the EEC the UK and other Europe Cf also the findings of Barend A DeVries The Export Experience of Developing Countries World Bank Staff Occasional Papers 3 1967
119
The competitive effect is the difference between the actual growth rate
of Southeast Asia exports to the MDCs (A below) and the growth rate of the
Southeast Asia kind of mix of exports to the NDCs (H below) The competitive
effect so defined is due to one or more of price quality and supply disshy
advantages or advantages as compared to MDC imports of the same kinds
The evidence is that Southeast Asia has been lagging behind in export
growth to the MDCs because of both effects Between 1956-57 and 1964-65
exports of the eight Southeast Asian countries covered fell behind the average
import growth of the more developed countries by 48 The competitive effect
contributed 16 to this lag the compositional effect 32
Exports of the Southeast Asian countries lagged partly because the
region was not on the average able to maintain its base year export share
of the various commodity groups even when the unfavorable commodity composishy
tion of its exports--mainly primary goods particularly foodstuffs and other
agricultural products--is allowed for Some countries did very well with
traditional primary commodity exports
The above study therefore denies the importance of demand deficiency
as a unique explanation of the regions relatively slow export growth
(2)Doubt has been cast on the hypothesis of demand deficiency to che
exclusion of supply considerations by other writers
Commenting on Haizels attempt 1 to demonstrate the demand deficiency
hypothesis Bieda maintains that the actual world trade figures reflect the
Supply effect and the Demand effect together and the two are inextricably
fused in the amount traded 2 He rejects Maizels thesis that the
process of industrialization per se did not have a retarding effect on
1A Maizels The Effect of Industrialization on Exports of Primary Producing Countries KYKLOS Vol xiv 1961 Fasc 1
2K Bieda The Causes of the Export Lag of the Industrializing
Countries A comment KY1OS Vol xv 1962 Fasc 2 pp 485-95
120
the development of exports from the semi-industrial countries He
gives two reasons for this rejection first resources can be diverted
industry as a result of forced industrializashyaway from agriculture to
tion reducing the exportable surplus of agricultural commodities and
second the protectionist policies of the LDCs might divert resources
in general toward the domestic market adversely affecting thcir exports
The generally more rapid inflation in the LDCs as compared to the MDCs
has tended to discourage production for export since domestic demand has
been strong and price competition abroad has been keen
(3) Manmohan Singh has provided data suggesting that for India the
important factor in explaining the behavior ofsupply lag has been an
He ascribes the lag to defective government policies with respectexports
to export duties and export controls that the Indian government followed
Table 28
Growth of World and Indian Exports
A B
Growth of Exports Growth of Exports
1948-50 to 1958-60 1951-53 to 1958-60
Tea World280
Indian110
World133
Indian26
Cotton textiles 179 45 148 97
Tobacco 372 113 252 - 28
Pepper 1444 287 718 157
Castor 200 287 45 22
iCf W Arthur Lewis in a Note (on an article by R W Lindholm)
in Social and Economic Studies March 1960
2Manmohan Singh Indias Export Trends and the Prospects for Selfshy
sustaining Growth Clarendon Press Oxford 1964 p 153
121
during this period Indices of gross profit in Indian industries
(Table 32) show that the large and flourishing domestic demand for new
manufactures stands in the way of exports
Table 29
INDICIES OF GROSS PROFITS IN INDIAN INDUSTRIES
(1950-100)
1951 1952 1953 1954 1955 1956 1957 1958
Engineering 1173 1249 1159 15714 2552 3052 3357 3539
Chemicals 1134 1059862 1066 1519 1764 2127 2355
Cement 1280 1289 1245 1501 1689 1549 1605 1775
Singhs general conclusion is that though there were adverse trends
in world demand it is fair to stress also overvalued exchange rates
export controls and increased domestic absorption as being in part responshy
sible for the lagging exports over the three plan periods (1950-51 to
1965-66)
The empirical evidence above supports one point clearly causes of
foreign exchange shortage may lie on the supply side as well as on the
demand side There is not reason to regard the supply deficiency as less
significant than demand deficiency in explaining the foreign exchange
bottleneck to growth in the LDCs
1Export controls were exercised on jute manufactures tea cotton textiles vegetables oilseeds and oils raw cotton raw wool coffee manganese ore export duties were levied on jute manufactures tea raw cotton raw wool black pepper cotton cloth manganese ore groundnut oil linseed oil cottonseed oil The period covered is 1950-60
122
(4) In a recent study Hollis Chenery and A M Strout examine the performance of 31 LDCs between 1957 and 1962 in terms of three
criteria investment saving and trade They define these criteria
as follows
Investment criterion Initially the rate of growth of investment must be greater than the target growth rate of GNP Thereafter the investment rate must be adequate to sustain the target GNP growth rate
Saving criterion The marginal savings rate must be greater than the target investment rate unless the average rate of saving is alreadyabove this level
Trade criterion Either export growth must exceed the growth tarshyget for GNP or the marginal import ratio must be substantially less than the initial average ratio 2
Of 31 countries studies 12 meet both and 10 meet neither of the Saving and Trade criteria for approaching self-sustaining growth (at a rate of 5 a year in GNP) Failure on the trade side seems to be at least as important as deficiencies in domestic saving and investment A
number of these countries --India Greece Turkey Chile Columbia
Costa Rica Boliva Guatemala and Honduras -- have been characterized by import shortages substantial excess capacity and in some even falling
saving rates
In the 12 countries that satisfy both the savings and trade critshyeria exports play a predominant role Of these 10 have export rates of 5 or more Conversely one of the most significant aspects of the
unsatisfactory performance of countries meeting neither of the two critshyeria is the stagnation of their exports Finally there is almost no example of a country that has for a long period sustained a growth rate
1Over this period Indias share of world exports has declined from 21 in 1950 to 12 in 1960 to 10 in 1966 The export-import ratio was 834 during the first five year plan 562 in the second and 580 in the third See Fourth Five year Plan of India (A Draft Outline)Government of India Planning Commission New Delhi 1966 pp 92-105
2Hollis B Chenery and AM Strout Forign Assistance and Economic Development American Economic Review September 1966 pp 679-733
123
substantially higher than its growth rate of exports through continuing
import substitution In the past Brazil Colombia Turkey and India
have done so for considerable periods but each has run into severe balance
of payments difficulties in recent years1
(5)There is no necessary reason why either the Savings gap or the
Exchange gap should have a termination date though that is of course
desirable for both Fei and Paauw analyze this problem at length
Fei-Paauw model of Foreign assistance and self-help consists of 2 3
five primary parameters and two scale factors They estimate these
values for 31 countries that received over 70 of United States developshy
ment assistance in recent years They observe that the termination date
for foreign assistance (as a proof of foreign exchange gap) is finite for
only 8 out of 31 countries The absence of a finite termination date for
foreign assistance is in most cases associated with a low per capita
marginal savings ratio Their final conclusion is as follows relatively
high values of the per capita marginal savings ratio are associated with
a finite termination date for foreign assistance In other wordr the
inductive evidence seems to indicate that with reasonable realistic values
of other parameters domestic austerity efforts involving a per capita
marginal savings ratio of about 35 are essential for fulfilling the selfshy
help criteria 4
1Ibid p 710
2Primary parameters (1) the initial average saving rate -- so) (2) the per capita marginal savings ratio -- (u) (3) the capital rate of population growth -- (r)
3Scale Factors (1) initial population and (2) initial gross national product
John Fei and Douglas Paauw Foreign Assistance and Self-Help A Reappraisal of Development Finance The Review of Economics and Statistics August 1965 Also Douglas Paauw and Forrest E Cookson Planning Capital Flows for Southeast Asia National Planning Association 1966 esp pp 38 follows Application to Southeast Asia
4 Ibid p 263
124
From the above it follows that first even if the per capita marshyginal savings ratio is high it will not help in narrowing the domestic savings gap if the values of other parameters are not realistic and
second that adequate domestic savings are a prerequisite to reducing
the foreign exchange gap
(6) In another study1 Paauw and Cookson find that of the six countshyries studied by them (Burma Indonesia Malaya the Philippines Thailand and Taiwan) the first two have no termination date for either the domestic savings gap or the foreign exchange gap the next two have a termination date for the domestic savings gap only while the last two have termination dates for both The period of projection covered by them is 1965-1975 and
beyond
In summary the studies above suggest that foreign exchange can be a binding constraint on economic growth In actual practice factors behind emergence of the foreign exchange constraint might lie in the overshyall absorptioi of the economy that is in its capacity to save The implication is that it would be of interest to study the effects of specific
growth-promoting policies of the LDCs on the domestic savings and foreign exchange gaps Regional cooperation in such studies can be useful
2 - Criticism
These savings-gap exchange-gap studies are valiant and commendable efforts to attach numerical tags to conditions for growth But the studies
have sharp deficiencies
Specifically (la) Some of the data are influenced by post-War II and by other war and crisis phenomena affecting prices and production The hope is that these aberrations will average out even though they certainly
Douglas S Paauw and Forrest E Cookson Planning Foreign CapitalRequirements in Southeast Asia The Savings and the Foreign Exchange GapCentre for Development Planning National Planning Association May 1965 (mimeographed)
125
misrepresent the secular trends for individual countries Earlier studies based on data from the first years of the 50s clearly had distortion
built in
(lb) Statistical errors in trade data are large (We discuss this matter in III A below) Errors in trade data for other LDCs must be also
substantial and errors where data have as partial basis financial flows
across borders are likely to be very large Errors in the estimates for
GNP are likely to be larger than those for trade flows and variations of GNP can be substantial for the most of the LDCs where agriculture is a major sector and can be affected for a year or several years by climate
pests and disease Unreliable data are used they are aggregated invalidly
(2) Even if the social accounts data were precisely accurate they measure variables that are related only partially to the causes and conshy
comitants of growth Part of investment as measured in national income accounts does not contribute to economic growth or does not contribute
within the time period under consideration parts of consumption are or
can be critical determinants of growth some growth does not require inputs
of economic resources at all (Our Research Paper 11 Investment vershysus Growth discusses these issues Some of its material is given in
Section III - B below)
In summary these studies use data that have d wide margin of error and whose concepts are only partially adapted to their purpose They anshyalyze only a modest part of the total determinants of growth and so require
implausible assumptions of other things being equal and other things
changing appropriately When the necessary qualifications are added the
significance of these diligent studies becomes very uncertain
126
III - Major Cautions on the Statistics
A - Inaccuracies in Southeast Asian Trade Data
1 The problem procedure
For a number of reasons trade statistics are considered to be among various LDC economic data the most reliable Foreign trade is a well-defined area in which goods move under the noses of customs offishycers Goods are supposed to be counted andor measured systematically for such purposes as the imposition of tariffs subsidies and other regulations In LDCs where foreign exchange is scarce particular attention is focused to the trade rector the single largest source of
demand and supply of foreign exchange
A check on accuracy is presented in the records kept by both trading partners which can be compared side by side Comparable double accounts are not usually available for domestic economic transactions
One countrys exports to another country should be roughly equal in values and identical in typesywith the imports of the receiving country In practice modest differences will result due to transport and other service charges timing lags differences and inconsistencies of classishyfication and transit trading The amounts of these divergence are rarely measured quantitatively Instead any differences in two records are usually assumed away or considered to be caused by the obvious factors especially the transport margin (cif imports and fob exports) For example M Michaely assumes away the discrepancy between two recordings in computing a given countrys geographically-weighted share in world exports The likely discrpoancy is recognized but dismissed
from casual observation one gets the impression that the element of error introduced by differences between the records of the exporting and impoitshying country is not very large2
IM Michaely Concentation of International Trade (Amsterdam North Holland Publishing Co 1962) p 135
21bid
127
For our region in a trade projection study made by ECAFE adjustshy
ment is made for the differences between values of intra-regional exports
and imports by attributing the difference to shipping and insurance 1
charges between the region and outside The freight and insurance acshy
counts in the balance of payments of a given country are often derived
simply by taking some percentage margin of its imports eg Malaya
used 89 and 65 of the cif imports from sterling and non-sterling
areas respectively2
For a study of the accuracy of the regions trade statistics we
selected data from Burma Ceylon Indonesia Malaysia the Philippines
Singapore and Thailand For each of these countries two ratios were
computed
1) Mij (is imports from J) to Xji (Js exports to i)
and 2) Mji (Js imports from i) to Xij (is exports to J)
where j is a given Southeast Asian country and i is js trading partner
The trading partner countries include both Asian and Developed Western
countries (approximately 30 in all) 1 and 2 are defined respectively
as the export and the import ratios of j country For most of these bishy
lateral or pairwise comparisons the average value of 1962 and 1963 trade
figures is used in order to minimize differences that can result from time
lags in the reports of any two trading countries3 For Indonesias exports
(import figures not available) and some minor cases of other Southeast
Asian countries only 1962 figures are used due to the lack of suitable
figures and comparable data for 1963
1United Nations Review of Long Term Economic Projections for Countries
in the ECAFE Region 1964 p 199
2Department of Statistics States of Malaya States of Malaya Statistics
of External Trade 1963 Vol 1 p 11
3The trade data are taken primarily from 1962 and 1963 issues of the
United Nations Commodity Trade Statistics and partly from the United
Nations Yearbook(s) of International Trade Statistics Data for some
minor cases are from the International Monetary Fund and International Bank
for Reconstruction and Development Direction of Trade a Supplement to
International Financial Statistics Annual 1961-1965
128
Standard deviations and t statistics were computed (Section 2
below) to assess the probability of a systematic bias in each of js
ratios Then F statistics measure whether or not there exists a
significant difference between the variance of js intra-regional trade
ratios and Js trade ratios with more developed countries In section
3 below the discrepancy in trade data is observed again after trade
values of each country are adjusted by the difference between official
exchange rate and the free or black market exchange rate Examshy
ination of the pattern of individual commodity trade statistics follows
in section 4
2 The Errors
The ratios of all pairs of recordings for every Southeast Asian
countrys exports (JjXji) and imports (MjiXij) are plotted in Charts 1
and 2 respectively Each ratio is marked by a lower case letter which is
the initial of J the Southeast Asian country Corresponding trading
partners are given on the horizontal axis (Absolute values of each
paired recording and the ratios for individual Southeast Asian countries
are given in Table 33) A dotted horizontal line is drawn on
each chart to indicate indentical values (the ratios = 10) of paired
recordings If bilateral pairs of recordings are accurate then the
ratios should be slightly above this line (perhaps usually 106 to 114)
since imports are typically valued at cif The diversion of the ratios
from the line measures the influences of obvious causes such as transshy
portation and other charges and of uncertain factors such as errors and
deliberate falsification
Conspicuous in both charts (and especially Chart 1) are the wide
dispersion and variation of the ratios Transport margins do not adeshy
quately explain the discrepancies Many ratios demonstrate flagrant
discrepancy with the higher figure of a pair 100 or more above the
lower figure Ratios for Indonesia reach as high as 4800 A surprising
number of ratios fall well below the dotted line in both charts--a
deviation in the reverse direction from what the transport cost margin
could explain for the region as a whole almost one-third of the total ratios
129
lie below 10 The discrepancy in these pair records that have ratios
less than one is larger than it seems on the chart The overstatement of Xji (or Xij) in relation to Mij (or Mj ) is proportional to the recipshy
rocal of ratios of MijXj (or MjiXij) between 10 and 0
Most of Singapores MijXj ratios can be piausibly explained Out
of 25 ratios (Chart 1) 22 are below 10 The plausible qualitative
implication of these low ratios is difference in labels not statistical
error Singapores entrepot trade is large and much of such exports
are not recorded as being from Singapore by her trading partners Simshy
ilarly Singapores import ratios MjiXij (Chart 2) are generally much
greater than one suggesting that countries exporting via Singapore as
antrepot often list those exports as going to the ultimate destination
while Singapore customs enter the goods simply as an import (only 2 out
of 26 ratios fall below one)
In Direction of Trade export and import figures for a non-reporting
country are derived by using a 10 margin as a norm that is if ratio
values for MX of 110 are accepted as reasonable a significance test
(the t test) can be applied to judge whether or not the average ratio
of each Southeast Asian country can be explained by normal statistical
error Data for each j country were evaluated separately since there is
considerable variation from country to counry We have assigned et~ual
weight to ratios of all paired recordings but have excluded ratios
involving absolute values less than $20000 in either X or M on the
grounds that small absolute errors can in these cases lead to large proshy
portionate errors The exclusions have eliminated most of the extreme
ratios Results of the significance test are given in Tables 33 and
34 for exports and imports respectively
A survey of Column 2 in both Table 33 and Table 34 shows that the
average ratios of HijIXji and MjiXij usually differ considerably from
the assumed norm ratio of 110 For half the ratios the deviation is
significant using the t test with the 5 criterion of significance
as the watershed the other half fail the criterion
Even for the former cases however it is difficult to accept the
notion that the average and the expected ratios belong to the same unishy
verse with differences due only to normal statistical errors A large
130
value for the computed probability (associated with a low t value) might
have resulted either from a small difference or from a large estimate of
the standard error--or both For example relatively satisfactory t
values shown for Burma Ceylon and the Philippines seem to have resulted
mainly from high values of the computed standard errors Espectally for
Indonesia little statistical meaning can be inferred from its t value in
view of the wild implications of the other two sets of statistics
Two exceptional cases out of 13 in all are consistent with aggreshy
gative trustworthy data Thailands export ratio and the Philippines imshy
port ratio I indicate satisfactory and acceptable results in terms of both
the average ratio and the estimated standard error (But for Thailands
import ratio and the Philippines export ratio the consistency does not
exist) Save for the two exceptions we can reasonably regard the
MijXjis and MjiXijs of these countries as random samples with respect
to the expected value of 110
1The use of the 10difference for the Philippines is not correct
since this country reports its imports at fob value (which is reflected in the low average import ratio 98)
i(4bO) CHART 1U568-7)16 (10 i9) patio of Trading Partners
(69) (9- 3) -(5-9) a- (68) Imports from Southeast Asia36) A 0 ) i36) i(4) Countries(I-) to Corresshy32)( 5
pond ing Exports of Southshy(-4 east Asian Countries(Xji+)a( -(3o0) p 3L(29) 1962-1963 Averages
b
iXj forp = biupb m
b Ceylon = t2bullo t pFed of
i halaya =M
= iIndonesia m Philippines = p
Thailand tm p tn tSingapore =s in~ t rb
0+ p t tb0n deg tPb
00 t --- ---------
--------------Op PC b
b pt t t
t
t____ tao __p___ r e1 )0
Countries(i)E D
c(661O)CHAIRT 2
2
t(36)
0(6o)
s(2L2)
b(60)t64l M(4) t-
os(22)Countries
) (28) m(30)
(7) b(27)
Ratio of Southeast AsianImports (M )
to Corresponding Expors of Trading Partners (Xi)1962-63 Averages
m(28)
2
On
at
b
P
9p
m
s
14s am
p
s
et
S
0
sPhilippin6s
8 b t
as
c mso8
MjiXij for
Burma CeylonFed of
laya
Thailand Singapore
= =
= = = =
b c
M
pt s
0
o 8P tb bullt 0
so S
P ~
b S
-f 8
a
go OP bba t i a t a t n t I
OC b t b brnb M- - 9
am OP R
Op Op
0
vi W
r
0 ca9 1A
+ ID 4shy
0 6
Trading Partner Countries~i)
133
A Test of Average Export Ratios (MijXji)Table 30
Assumming an Expected Value of 110
Average Ratio Computed Computed Value ofNo of
StandardTrading Part- (MXji) Standard
ners (i) Compared 1 Deviation Error
(5)(3) (4)Country (1) (2)
2081 Burma 20 1433 716 160
283 121221 1443 1295Ceylon 25 1143 405 081 531
Thailand 417 43082105 2165Malaya 27 085 -752942625 460Singapore 125 188861324 1336Philippines 5635 16952768110470Indonesia 24
Assumming an ExpectedTable 31 A Test of Average Import Ratios (MjiXij)
Value of 110
No of Trading Average Computed Computed Value of tStandardStandardRatioPartners (i)
Compared (MijXji) Deviation Error
(4) (5)(1) (2) (3)
254 1083121723 1375Burma 232 86622 1301 1086Ceylon 237326 1463 778 153
Thailand 150 2725 Malaya 28 1509 796
105 366752425 1485Singapore -110124 991 485 099
Philippines
134
The assumption of the 10 margin used above though plausible is
arbitry Transport and other service costs vary according to such inshy
fluences as value volume and type of goods traded and distance Accurate
information on these costs is not available But these costs even if
available and accurate could not explain the violence and directions of
the deviations shown in Charts 1 and 2 and the results of Tables 30 and 31
Our tests of trade data of Southeast Asian countries indicate frequent
and large errors But conclusions are less gloomy if we divide the MX
ratios into two groups
(a) their trade with other countries in the region and
(b) their trade with more developed countries (MDCs) including Japan
A statistical measure of the dispersion in terms of variance and F ratio
for individual Southeast Asian countries is given in Table 32
The import ratios for Table 32 show variances for intra-regional trade
(Column 1) uniformly higher than those with the MDCs (Column 2) Also
the import ratio values of F indicate that the probability of obtaining
values of F as large as those observed fails at the 5 criterion of
significance We conclude that the variances of import ratios for the two
groups of countries differ significantly
For the export ratios the result is slightly different Values of
variance and F for the intra-regional trade of Indonesia Burma Malaya
and Singapore are larger than those values for their trade with MDCs But
for Ceylon Thailand and the Philippines the variance with developed
countries is larger than that with Asian countries The F ratio for the
two latter countries is small enough however so that we can judge no
significant difference exists between the variances of the two sets of data
Ceylons F value indicates that the variance of its MDC trade is signifishy
cantly larger than that of its intra-regional trade But this high varishy
ance with the MDCs is to a great extent illusory since it is largely the
result of one untypically high MijXj ratio 6810 with Sweden When
Sweden is excluded Ceylons variance with the MDCs is 048 and is signishy
ficantly smaller than that with Asian countries
135
We conclude that data on Southeast Asian countries intra-regional
trade suffers from much more of discrepancies than data for their trade 1
with developed countries This finding encourages the use of MDCs trade
data to measure Southeast Asias trade with them especially whenever
data from Southeast Asian countries are not directly available
There has in recent years been rising interest in regional coopershy
ation among ECAFE countries The analysis presented so far implies that
studies of the benefits and costs of any integration scheme for the region
must rest on the shaky foundation of conspicuously wrong trade data The
shares of intra-regional trade surprisingly high for these countries save
for the Philippines vary substantially depending on which trade data are
used For example the percentage figure for Indonesias exports to less
developed Asian countries is 4142 according to the countrys data and
5436 according to that of its trading partners Similarly intrashy
regional import shares of Malaysia are 43807 according to Malaysia data
and 6432 according to partners data There also are many vexing cases
where a trade surplus (or deficit) in one recording reverses itself and
becomes a trade deficit (or surplus) in the other recording
1That MDC trade data show smaller discrepancies is evident in a frequency distribution we have made of bilateral ratios of exports and imports of the US Canada the UK the Common Market countriep and Japan with 14 MDC trading partners For almost all countries in our sample period 75 or more of export and import ratios for pairs of countries fall within the 90 to 129 range Most of the remaining ratios do not diverge much from that range Some error is suggested most clearly in the range below about 106 but not the wide errors of our LDCs
136
Table 32 A Test on Variability of Export and Import Ratios of Southeast
Asian Countries with Asian and More Developed Country partners
ImportRatio (M Xi) Export Ratio (Mi1X i)
Variance F Ratio Variance F Ratio
Asian Developed 1 2
12 Asian Developed 3 4
34 or 43
Burma 2798 295 9471 907 154 5874
(11) (12) (10) (10)
Ceylon 2581 (10)
033 (12)
78147 252 (9)
2861 (12)
13385
Thailand 1031 053 19505 148 160 1080
(14) (12) (13) (12)
Malaya 931 (16)
265 12)
3507 7722 (15)
379 (12)
20367
Singapore 417 (14)
076 (11)
5465 250 (15)
052 (10)
4801
Philippines 483 (12)
008 (12)
57003 284 (12)
484 (12)
1706
Indonesia - - - 1353010 2878 470136
(13) (11)
Note Computations are based on data given in Table 33 Ratios inshy
volving absolute values less than $20000 in either X or M are excluded
The numbers in parentheses denote the number of trading partners (i) considered
Each F ratio is computed by placing the larger variance in the numerator
137
3 Effect of Adjusting Trade Data by the Exchange Rate
The trade data of Asian countries (except Korea and the Philippines)
initially reported to world institutions such as the UN and IMF in domshy
estic currencies are converted by these institutions into dollar equishy
valents according to each countrys official exchange rate The conversion
though convenient may be a source of discrepancy since the official exshy
change rates of many Asian countries are over-valued The rates are mainshy
tained by exchange controls and trade regulations that encourage individual
exporters and importers to overstate or understate their reporting The
controls also encourage black market transactions
In order to observe how discrepancies are modified by the use of
more realistic exchange rates the trade figures of each country have
been adjusted by using the free or black market exchange rate of the
particular country Selection of the free or black market rate has
been determined by data availability -- this and the official rate genershy
ally are the only exchange rate information available Since the proshy
portions of free and official rates in which reported trade is initially
transacted are not known using the free or black market rate does
not by itself eliminate the arbitrariness in the exchange rate adjustshy
ment made here In the adjustment the conversion factor of the country
or the ratio of its official exchange rate to its free or black
market rate (average of monthly figures) has been multiplied by the dollar 1
value of the countrys trade Application of this adjustment is made to
all Southeast Asian countries and their trading partners (except the US)
1The monthly exchange rates as well as official rates have been
taken from 1966 Picks Currency Yearbook (New York Pick Publishing Co 1965) A 24-month average (1962-63) is used for the free or black market rate and a 12-month average where trade figures are available for only one year
138
The conversion factor that measures the extent of over-valuation of a countrys exchange rate varies--estimated as the ratio of the official rate to the free or black market rate--substantially in 1962-63 among Asian counshytries ranging from nearly I for Hong Kong Malaysia the Philippines and Thailand to low values for India (670) Ceylon (503) Burma (434) and Indonesia (118) for 1962 and 1963 For all MDCs there is some deviation from one the range being from 1090 to 915 (to 996 if Japan is excluded) 1
In general the ratios of bilateral recordings derived from the adjusted trade figures reveal a deviation from one greater than that of the unadjusted ratios Little difference from unadjusted figures is shown for the bilateral ratios of Malaysia the Philippines Singapore and Thailand with MDCs The results reflect the likeness of conversion ratios of the two groups of counshytries Greater discrepancies from the unadjusted ratios are observed in the ratios of Burmas Ceylons and Indonesias trade with developed countries For intra-regional trade deviation is greater compared to unadjusted results for every Southeast Asian country
Table 33 presents averages standard deviations and coefficients of variation for both export and import ratios using the adjusted data On the whole both averages and standard deviations are considerably greater than those given earlier in Tables 30 and 31 And all import and export ratios of the adjusted data (except with Singapores exports) are more widely dispersed around the average ratios than are those of unadjusted data as shown by the coshyefficients of variation This result holds especially for the import ratios (The unadjusted data coefficients are given in parentheses in Table 33)
1US data are not adjusted because the exchange rate of other countries is given as the price of dollars in terms of their currencies
Table 33 Averages of Export and Import Ratios Standard Deviations and Coefficients of Variation on the Basis of Adjusted Data
Export Ratio Import Ratio M X Xij
Country j Average Ratio
Computed Std Deviation
Coefficient of Variation
Average Ratio
Computed Std Deviation
Coefficient of Variation
1 2 3 (21) 4 5 6 (54)
Burma 3288 2189 666 (500) 1568 4758 3034 ( 885) Ceylon 2722 2632 967 (897) 756 661 874 ( 835) Thailand 1027 457 445 (354) 2939 6383 22172 ( 532) Malaya 1908 2090 1095 (1029) 2320 2500 1076 ( 528) Singapore 371 296 798 (926) 2401 2851 1187 ( 353) Philippines 1218 664 545 (459) 1860 3664 1970 ( 489) Indonesia 175195 221050 2940 (2664)
Notes The dumber of trading partners (i) is the same as that given in Tables 33 and 34 for each j countryCoefficients of variation given in parentheses are those based on unadjusted trade data and derived from average ratios and standard deviations given here and in Table 34
Ishy
140
4 Commodity Trade Statistics in Detail
The analysis so far has dealt only with totals for exports and imports
of given countries not with individual commodities One can expect the
discrepancies in data to be larger and more dispersed on a finer scale than
when we deal with totals Large differences in totals eg Xji and Mij
prove marked discrepancies in individual commodity items that make up the
totals But small differences in paired recordings do not necessarily reshy
flect similarity they may be due to the cancelling out of opposing errors
in the data for individual commodities
The Philippines is selected for two reasons to illustrate the discrepshy
ancies in commodity data For one reason this country is the only Asian
country that reports fob values of its imports in US dollars (theoreticshy
alli Mji should be equal toor very close to Xij) thus eliminating the proshy
blem of transport costs Also discrepancies in the countrys total exports
and imports are small compared with those of other Southeast Asian countries
(except Thailand) --- thus presenting a limiting case of only modest error
The commodities considered are nine groups of the one-digit Standard
International Trade Classification (SITC) excluding Goods Not Classified by
Kind Bilateral ratios of the countrys exports and imports with the four
largest trading partners are given by commodity groups in Table 34 Also
shown in Table 34 are the weighted ratios (SMjiSXij) and (SMijSXji) with
all trading partners (the four largest plus all others)
In bilateral comparisons of ratios for all totals that of the grand
total as well as of the major trading partners ratios are usually not far
from 1 (last column of Table 34) The individual commodity ratioshowever
exhibit wide variation The Philippines-US export ratios by commodities
for example vary from 1524 for SITC-8 to 0 for SITC-3 and SITC-7 (no values
recorded by the US positive values by the Philippines) whereas total
MijXji is a plausible 106 And when SMijSXji is 111 the commodity ratios
range from 1445 to 43 Similar dispersions hold for import ratios
Out of 178 bilateral export ratios of country-commodity recordings
(not shown here) 78 are less than 5 and 35 are greater than 20---uiider or
overstatement of XJi by more than 100 compared to Mij Similarly for import
ratios 70 out of 191 total are less than 50 and 26 are greater than 20
Philippine Export Ratios and Import Ratios by commodities withTable 34 I
the Four Largest and with all Partner Countries
6 7 8 0 R Countryi 3 SITC 2 0 1 2 3 4 5
Ratio Conr
93 98 105 0 1524 106109 126 85 0Export US
99 127 13957 181 125(MijXji) Japan 126 422 124 52 151
0 4009 - 030 122 41 0
49 0 0 126 Netherland
W Germany 139 1311 125 0 73
66 101 69 9698 500 204 114 125 100
Import US 71 82(MjiXij) Japan 97 26 101 121 91 82 74 87
93 W Germany 261 167 174 100 92 92 58
76 103667 125 120 105 101 102UK 107 72
43 90 128 106 426 1445 111110 148 108Export
(M ij5Xji)
All Partner 4
Countries
98 15 157 209 133 101 74 97 72 94 Import
(IMji AXij)
Computed from trade data for 1962 and 1963 given in United Nations ECAFE Foreign Trade Statistics of Asia and
the Far East Vol I No 1 and Vol II No 1 1965 and 1966 for the ECAFE countries and various issues of United
Nations Commodity Trade Statistics for other countries
2SITC commodities are Food and Live Animals (0) Beverages and Tobacco (1) crude materials excluding Fuels
(3) Animal Oils and Fats (4) Chemicals (5) Basic Manufactures (6) Machines and (2) Mineral Fuels etc Transport Equipment (7) and Miscellaneous Manufactures (8) 3For both ratios the countries are listed in descending order of Xji and Mji
4Twenty-six countries are included
142
5 Concluding Comment
There are a number of possible reasons for errors in trade data
1) Transport costs will as we have seen create a discrepancy between fob
export and cif import values 2) Different recording definitions are 1
used by different countries The entrepot trade of Singapore with other
countries of the region is as we have also seen not treated congruently
in their respective records And for specific trade commodities sub-items
may be differently defined and so be entered under different aggregated
headings Customs officers may have considerable discretion as where among
several plausible categories a given item should be listed
But the discrepancies are often so large that these innocent explanashy
tions plainly fail 3) There may be simple error in counting and recording
4) Countries with considerable tariffs and other trade barriers and with
poorly policed boundaries on land or extensive shorelines on the ocean
invite attempts to smuggle Smuggling enterprises in the Philippines are
said to be notably successful and Indonesia was like England made by
heaven for free trade 5) Customs officers may be encouraged by suitable
tokens of friendship to understate quantity and quality of imports where
these are taxed similarly for exports where these are taxed 6) The
major channel for illegal transfer of wealth between countries is undershy
invoicing of exports and over-invoicing of imports
The purposes of capital flight may be (a) avoiding taxation and legal
seizure of ill-gotten gains (b) avoiding the risk of taxation or confiscashy
tion of legally-gotten property (as of the Chinese in Indonesia in 1959-61
and later) (c) avoiding property destruction from domestic disorder or
from war (d) avoiding loss of value of liquid assets through inflation
(e) transferring funds for the care of relatives abroad or to meet debts
accruing abroad or to provide for ones retirement abroad These transfers
may be illegal under exchange control laws or difficult or likely to
lead to unpleasant questions about the source of the funds and whether all
taxes had been paid or simply to uncomfortable knowledge by the authorities
about ones asiets
1See R G D Allen and J Edward Ely eds International Trade Statistics (New York John Wiley and Sons Inc 1963) for detailed appraisal of international trade statistics and definitions
143
Much can be done by energetic customs administrations to correct the
causes of discrepancies numbered 2 and 3 above But 4 5 and 6 are
more resistant They will be less serious sources of error if tariffs and
other trade restrictions are lowered if exchange controls wane and a
economic development in general progresses and so probity and efficiency
improve 6 is a major source of error though the error will not be
visible in the statistics unless different documents are entered in the
exporting and importing countries It is said that in some countries a
10 to 20 percent misrepresentation of the quantity andor quality of traded
goods is normal In one case that has come to our attention a large export
from a Southeast Asian country was under-invoiced by 90
Errors in trade data are substantial and plainly can be overwhelmingly
large Of our original MX ratios imports and exports taken together
62 per cent well over half are in a range that is prima facie evidence 1
of error
For countries with high tariffs or equivalent bars to the international
movement of goods and with legal or other bars to the export or import of
capital substantial errors in trade data are likely to continue For some
countries -- those with inviting boundaries high hurdles to the movements
of goods or of capital and lakadaisical administration--the best guess
of an informed and conscientious outside student can be more trustworthy 2
than the official figures
1Taking 130 and 90 as tolerable limits to discrepancies 198 out
of 318 observations fall outside the range Difference in origin-classshy
ification is the only other significant explanation as not due to error
and may well explain descrepancies for Singapore
2Detailed statistics relevant to much of the discussion of the abive
pages are available in our full study
144
B Inaccuracies and misleading concepts in the standard national income statistics
We have been very concerned that in these pages conventional and misshy
leading interpretations of national social accounts and their sub-categories
should not creep in as they can so easily do to distort analysis and
conclusions
1-Errors in LDC social accounts
It is a truism that the social accounts of LDCs are less accurate
than those of MDCs The reasons partly lie in scarcities of skills and of
time a measure of the pressure of economic realities on the statistics
offices of the various countries governments give higher priority to other
uses of their funds and training resources (In one country of our region
the basic social accounts reported to the UN were developed in two weeks
by an available non-specialist) The methods of estimation and the diffishy
culties of estimation of macro-totals vary widely The accuracy of results
therefore varies considerably A general rule is that where there is inshy
centive to misrepresent the figures will be biased and where difficulties
of estimation are great random errors will be large
In most countries government reported tax and expenditure data are
quite accurate In other sectors errors increase Simon Kuznets a long
time research worker in the US on national income data some years ago
with his fellow workers once put down estimates of the estimated -ange
of error in three classes With an estimated error of under 15 basic
manufacturing and public utilities -- With estimated errors above 15
but below 30 agriculture mining manufactured gas pipelines trade
banking insurance and government -- With errors of 30 or more construcshy
tion water transport real estate direct service industries and miscelshy
laneous
What is the implication of Kuznets estimates of error for the range
of-error to be expected in LDC income data
Kuznets found the least error in manufacturing and public utilities
The first produces normally a small segment of total production in LDCs
and usually the second also Relatively large segments of productive
activity in lower income countries are in agriculture construction and
service industries All these lie in the 15 or more error clas3es
145
Where data are not written down accuracy suffers because respondents
genuinely do not know what the facts are Often accuracy suffers because
respondents are uncertain of the meaning of inquiries or because of the
demands of courtesy The average farmer knows only roughly what the yield
has been of crops not grown for sale His uncertainty may have a bias
added by suspicion that his answer will in some way influence the taxes
he must pay
It is difficult also to value output that is not sold in the market
In the LDCs much of what is produced especially in agriculture goes into
home consumption and not the market At the market place part of the goods
brought in may be bartered not sold for money
-- givenBut improvements in the accuracy of the national accounts
their concepts and detailed definitions -- have been proceeding steadily
And to some extent one can diminish the inevitable errorsin recent years
by averaging (as Kuznets does) using the average of 2 years or 5 to 10
One should avoid using as base periods years that are clearly abnormal
like the late 1940s and the early 1950s when adjustments to the ending
of World War II were incomplete or the early 1950s again when the Korean
War was causing sharp rises in primary product prices Studies of Southshy
east Asia trade and incomes are becoming more significant as these years
recede into perspective
the LDCs and specific-The application of the national accounts to
ally those of Southeast Asia involves special problems of interpretation
There is in LDCs more fusing of economics and social activities than in
the higher income countries for which the accounts were primarily designed
Separating out economics from the blur requires rule-of-thumb decisions
arbitrary at the margin
Also averages and aggregates in the social accounts can move mis-
They may for example rise because of higher production inleadingly
a few export industries while nearly all the population live as before
back in the bush away from port cities mines and plantations Still
worse as in Africa the indexca may rise as male workers migrate into
mining employment while back in the villages farming deteriorates -shy
-- and wives and children find family lifeunmeasured in the indexes
disrupted Some of this disruptive movement to employment and away from
families exists also in Southeast Asia
146
2 - Misleading categories for LDC growth analysis
But a further and more important worry inhibits our use of the national
accounts in Southeast Asia and in other LDCs as a measure and guide
for social policy and so as a guide to the economic effects of regional
integration
The basic concepts of the social accounts are astray from the purposes
of growth analysis The accounts were formulated and defined in the 1930s
and 1940s and are still dominated by the interests of those two decades
The over-riding interests of the times were the desire to interpret and
to shape policy on business cycles (the Great Depression and the World War II
and postwar inflations were concerns) and to classify production
(especially during the war years)
The particular special-purpose of social accounts is due in surprising
measure to Keynes and other economists with interest in cycle analysis in
the late 30s and in the 40s1 Keynes was unworried about the division
in the national accounts between consumption and investment because he
was concerned with the motives of groups of spenders Any reasonable
definition of the line between consumer-purchasers and investor purchasers 2
will serve us equally well provided it is consistently applied His
purpose was the analysis of unemployment and the business cycle
His light-hearted view on the social accouns is inappropriate if
ones aim is instead to understand the process of economic growth The
standard accounts were not focussed on and turn out to be ill adapted co
interpreting the growth problems of less developed countries The basic
categories of consumption and investment are misleading and partial when
applied to growth problems It is more usual than not for reasoning and
policy to go astray through assuming that one can analyse growth issues
in terms of the conventional national income categories
1General Theory Macmillan London 1960 p 61
2Edward F Denison Report on Tripartite Discussions of National Income Measurement Studies in Income and Wealth vol 10 Conference on Research in Income and Wealth National Bureau of Economic Research
New York 1947 Referred to in John W Kendrick Restructuring the
National Income Accounts for Investment and Growth Analysis Statististisk Tidskrift No 5 1966 p 354
147
For example the central problem of growth is conventionally portrayed
as extracting more (national income concept) savings out of an economy in
order that there can be more (national income concept) investment The
majority of academic and official discussions take this framework for
granted But in all economies this is sharply imperfect reasoning and
in LDCs it can be flagrantly wrong In low income societies a very large
proportion of the population possibly the great majority live at consumpshy
tion levels that closely determine the health and energy that in turn detershy
mine productivity Carl Shoup concludes there is a range of consumption
where the ratio of marginal products to increased consumption reaches the 1
order of 20-to-i to 80-to-l Increased food supplies -- calories and
protective elements both -- can be the critical requisite for increased
production More consumption can also offer necessary incentives
To the extent this effect is important cutting consumption in an
LDC economy (for example by higher taxes) in order to have more savings
for conventional investment can have the effect of reducing production
not increasing it
The crucial matters of the general health energy skills and incenshy
tives of the working population are completely neglected in the traditional
analyses focussing on national income consumption versus investment that
is they neglect human capital and various forms of social capital
nourished by consumption outlays
Nor is national income investment either locally or empirically
necessarily to be closely associated with growth Conventional capital
includes public buildings and luxury housing and prestige-orientated public
buildings Capital may stand idle or be used only one shift a day due to
lack of demand and effective organization There may be frequent holidays
and long weekends and frequent absences from work due to debility sickshy
ness and lack of incentives Scarcity of conventional capital need not
be an important bottleneck at allAnd sometimes a high priority route
to higher production does not draw on real resources at all for example
leisure time can be used productively
Where absenteeism from illness is due to too little consumption
and where childrens low consumption forces down their future productivity Carl S Shoup Production from Consumption Public Finance vol xx no 1-21965 pp 173-202
148
Our concern in this research project to avoid the conventional and
misleading uses of the standard national accounts in reasoning on economic
growth and its relation to regional cooperation suggests the possibility
of useful future research to improve the regional accounts so that they
can be more useful
A model that could be productively followed in improving the national
accounts of the region is offered in the work of John Kendrick of the Natshy
ional Bureau of Economic Research in New York Using US data Kendrick
has been experimenting with redefining social accounts categories so that
they interpret growth more effectively He does not go so far as to
estimate non-economic inputs that raise production He does add to
convenlional investment other uses of resources that increase productive
capacity
Parts of these are purchases of durable goods plus inventory change
of consumers and of government The rest consists of intangible outlays
(1) education and training
(2) medical and health outlays
(3) research and development
(4) mobility costs and perhaps--an optional item-shy
(5) costs of rearing children to working age
Much under these headings is usually classified as consumption
Kendricks total investment turns out to diverge widely from official
investment estimates This total investment is much larger its share of
GNP has grown as GNP has grown and it is more stable cyclically In 1965 1
his total investment is $422 billions or 380 of higher than the official
(gross) investment figure of $111 billions
1Excluding rearing costs If they are included total investment is $476 billions In the present official estimates gross investment is 16 of GNP Kendricks total investment is 47 or 53 of adjusted GNP dependshying on whether rearing costs are excluded or included
149
Kendricks work is a major advance toward shaping national accounts
so that they interpret better the process of economic growth Similar
work in LDCs specifically in Southeast Asia should be very fruitful
toward better reasoning on growth and so toward better policy Such efforts
could well be supported by international or national aid programs
To our knowledge it has not been attempted in LDCs save for a small
study in Singapore
Continued from page 148
Total investment as a share of adjusted GNP has risen from 38 in 1929 to 47 in 1965 The contrast suggests reasonably enough that the share of income a society devotes to future growth rises when income rises
A summary of this experiment-in-progress is given in John W Kendrick Studies in the National Income Accounts Forty-seventh Annual Report National Bureau of Economic Research June 1967 pp 9-15 An earlier fulshyler report is his Restructuring the National Income Accounts for Investshyment and Growth Analysis in Statistisk Tidskrift No 5 1966 pp 353shy365
See also our fuller analysis of this basic problem Research Paper 11 shyInvestment vs Growth published in Economic Development and Cultural Change April 1969
150
IV - NATIONAL PLANS AND REGIONAL INTEGRATION IN SOUTHEAST ASIA
To what extent have national plans had implications for economic inshytegration in Southeast Asia And to what extent have successes and failshyures in plan implementation had systematic relation to regional economic interest We seek to shed light on these questions in this summary section
A - Planning Patterns
Planning as a means accelerating economic growth has become a catchshyword and an orthodoxy 1 Whether a national plan is formal or eclectic its inevitable characteristic is multiplicity of goals all associated in
2some sense with nation building In those countries where formal
1At the national level the most striking event of the early nineshyteen sixties has been the widespread adoption of planning as a tool ofeconomic and social policy In the nineteen fifties relatively few deshyveloping countries had national plans for economic and social developmentthough numerous countries had elaborate medium term programmes for specificsectors or regions of the economy Since the turn of the decade howeveralmost all of the developing countries--often with the encouragement of national multi-lateral agencies concerned with international developmentassistance--have undertaken the formulation of medium-term or long-termplans as a means of guiding their current policy decisions Two majorevents occasioning this upsurge in planning activity were the achievementof independence by many African countries and the launching of the Alliance for Progress in Latin America A more fundamental and general cause howshyever was the widespread realization that the acceleration of economic andsocial development requires a more long-sighted approach to policy formushylation it has come to be understood that current policy decisions can nolonger be made simply in response to the circumstances of the moment buthave to contribute actively to bringing about the structural and institushytional changes which underlie economic development United Nations World Economic Survey 1964 pp 3-4
2As one strong instance of this we may quote the following We are neglecting our wealth purposefully because we are concentrating on nationshybuilding said Dr Subandrio ex-Foreign Minister and Deputy Prime Minister of Indonesia Straits Times December 7 1963 Quoted in Clair WilcoxThe Planning Straits and Execution of Economic Development in SoutheastAsia Harvard University Center for International Affairs Occasional Papers 10 January 1965 Economic development has not been the central concern of any government in Southast Asia ibid p 43
151
plans have been instituted--countries like India Pakistan and Malaysia-shy
the measurable role of the public sector in direct economic decision making
has been increasing over time1 In other countries where no formal plans
have been instituted the State systematically assumes responsibility for
promoting private enterprise In both cases the role of the State in the
economic life of the people has been increasing
1 Two Directions of Policy in LDCs
The two over-riding popular aims of economic policy making in the
LDCs are (a) diversification of exports and (b) import substitution2
Diversification of exports has seemed necessary to LDC policy makers
(in part wrongly - see Section I) because of alleged inelastic demands
for primary products in the world markets Import substitution has been
partly the result of foreign exchange difficulties and partly--this is
crucial--it is the expression of the urge to nation-building itself In
short planning for economic development has meant in the LDCs in large 3
part planning for industrialization
1For instance The share of the public sector (ie the government sector) has steadily grown in the Fourth Plan about three-fifths of all investments will be in the public sector Fourth Five Year Plan of India 1966-1971 Planning Commission Government of India p22
2R id development cannot be achieved in the future simply by conshy
tinuing the traditional pattern of economic growth The twin pillars of the Malayan economy rubber and tin will remain important for some time to come but they cannot be expected to contribute significantly to income growth First Malaysian Plan 1966-1970 Juala Lumpur 1965 p 6 The most important of the long term objectives (in Malaysia) is the need for economic diversification and industrialization Ibid p 15 although attempts will be made wherever possible to promote the growth of exports efforts to solve the problem (of foreign exchange) will probshyably have to rely mainly on import substitution Ibid p 16 If industrialization and diversification of the economy are to be rapid enough the country must aim at developing basic industries and industries which make the machines needed for further development Third Five Year Plan of India Chapter 2 p 27
3Both countries (India and Pakistan) tended to identify economic development with industrialization achieved principally through import substitution and without significant regard for considerations of comparashytive advantage Edward Mason Economic Development in India and Pakistan
152 2 Two Patterns of Growth in Southeast Asia
Two distinct patterns of growth are observable in Southeast Asia the Inward Looking and the Outward Looking The Inward Looking pattern--that ofBurma Ceylon India Pakistan Indonesia--has been generally characterized by() strict control of resource allocation through formal planning (ii)strict trade and capital flow controls and (iii) some disposition to nationalize foreign enterprises Recently Ceylon to some extent and Indonesia more emphatshyically have retreated from this pattern The Outward Looking pattern--that ofthe Philippines Malaysia Thailand Taiwan--has these characteristics in milddegree or not at all The Outward Looking group has followed relatively liberal trade policies and their exchange rates have been adjusted where needed to achieve equilibrium1
continued from page 151 (Center for International Affairs1966) p 12
Harvard University Press SeptemberReporting in 1960 the Food Agricultural Commission of Pakistannoted It is essential to appreciate how very recent is the sense of anyurgency for increased agricultural production Report of The Food andAgriculture Commission (Karachi Pakistan 1960) p 150
IPT Ellsworth has observed In the Philippines the price levelshowed no net upward movement until after 1959 from then to 1963 it advancedat an annual rate of about 4 percent A 60 percent devaluation in 1962 seemsto have been effective in overcoming any currency overvaluation that may havepersisted from World War II for exports responded vigorously in the followingyear Thailands inflation rate was approximately 5 percent per annum sinceexports increased at 64 percent a year (at about the same rate as GNP)there would appear to be little reason to believe the haht was overvaluedeven with a virtually stable exchange rate In Taiwan where inflation wasat an average rate of some 9 percen- a year exports were buoyant partlybecause any tendency for overvaluatin to appear was quickly offset by recurshyrent and substantial devaluation (1951 1953 1954 1957 and 1958) andpartly because import substitution or industrialization succeeded in openshying up lines of production that expanded from import substitution into exportmarkets Import Substitution Growth and the Balance of Payments SomeComparisons June 1967 Madison Wisconsin mimeographed
153
The Outward Looking group of countries have in the 1950s and 1960s
shown a better record than the Inward Looking Group with respect to rates
of growth of GNP productivity increases increase in import capacity (ie
income terms of trade) price level stability import substitution1
3 A Recent Trend
Recently there has been a growing awareness among the countries of
Southeast Asia--particularly the Inward Looking group--of t - importance of
the market mechanism in efficient resource allocation 2 Increasing reliance
is being placed on the following
1) Exchange rates not too far from equilibrium
2) Moderation of tariff rates and equivalent bars to imports
3) Selective encouragement of import competing industries and
4) Encouragement of exports
IHly Myint The Inward and Outward Looking Countrics of Southeast Asia and the Economic Future of the Region Research Paper 7 February 1966 K C Sen The Inward and Outward-Looking in Southeast Asia working paper January 1965
2The Plan places greater reliance on the mrket mechanism and fiscal and monetary policies instead of on direct consumption and discourage production so that over the longer run economic development is adversely affected Where it is necessary to retain controls their rationalization and simplification will be necessary Controls which restrict imports must be continued but the form of controls may be modified and heavier reliance placed on market forces The Second Five Year Plan of Pakistan 1960-1965 Planning Commission Government of Pakistan It must be remembered that excessive (exchange) rates could provoke undervaluation of imports dumping and smuggling defeating the very purpose of developshyment and growth Socio-Economic Development Program for FY 1966-67 to FY 1969-70 of the Philippines Manila Philippines May 1966 Indeed in the long run import substitution and export promotion will become harmshyonizing policies since new industries which spring up in response to local demand can later expand if they are efficient (our underlining) into export markets First Malaysia Plan 1966-1970 p 16 Similarly the Third Plan of Pakistan calls for a revision of the present tariff policy (which is highly protective and discriminatory) reexamination of the current interest rate structure and use of shadow prices for Lhe appraisal of at least the major projects in the Plan p 135
154
Several reasons may be given for this evolution in thinking overshy
valued currencies have discouraged exports while subsidizing imports
leading to adverse balance of payments restrictive import policies-shy
through tariff and non-tariff protection--have encouraged indiscriminate
import substitution preoccupation with foreign exchange saving as against1
foreign exchange earning has resulted in the neglect of exports excess
capacity in export industries has been a comnmon phenomenon
the attempt to save foreign exchange at any cost has led to a wasteful
use of domestic resources in the import-competing industries the total
real resource cost of every unit of foreign exchange saved is extremely
high the protectionist environment in which import substitution policy
is followed has contributed to inflation
This list of reasons for change implies disillusionment with past
policy but not a clear reversal The policy objectives in the LDCs remain
the same but there seems to have been a perceptible shift toward policy
instruments that depend less on bureaucratic discretion and more on the
market
It is being realized that import policy invariably affects the export
sector that the net effect on balance of payments is the result of import
savings and export earnings not just the former The importance of the
opportunity cost of resources is now being emphasized more than before
These changes of emphasis improve the prospects for regional cooperation
B- Planning in Five Countries A Summary
The following material summarizes briefly trends in planning as
indicated mainly in the published plans--which means there is a publicity
and political aspect--of five countries in Southeast Asia2
IThe Indian Third Five Year Plan document somewhat ruefully observed in 1961 that one of the main drawbacks in the past has been that the proshygram for exports has not been regarded as an integral part of the countrys development effort under the Five Year Plans Quoted in Mason opcit p 31
2Among the compact evaluations of planning in this area attention should be drawn to Clair Wilcoxs perceptive The Planning and Execution of Economic Development in Southeast Asia referred to above and also to the series of empirical reports in late 1968 and early 1969 by Hermann Hatzfeldt and mimeographed by the Ford Foundation regional office Thai Farmers Bank Building Bangkok See also our own Research Paper 5 Economic Planning--poiits of Success and Failure
155
1 Indonesia
Indonesia was not able during the early 1950s and emphatically during
the Sukarno regime to formulate and implement an effective development
plan In 1951 the government adopted an Economic Urgency Program the
objectives of which were to raise production of consumer goods to increase
the processing of domestic raw materials and to mechanize small firms
Some new factories were built but few continued to operate and few of the
small plants received or used new equipment A second plan was formulated
in 1956 It emphasized long-run economic goals calling for substantial
capital formation and projecting sources of financing However the plan
foundered on economic and political disorder Funds for development were
diverted to current expenditures Against this background the Eight Year
Development Plan covering the years 1961-1968 was drawn up
The new plan was a product of the National Planning Council an ad
hoc committee of representatives of regional and functional groups No
professional economists sat on the committee there was little of supporting
statistics or economic justification for the recommended projects in the
Plan It was intended to achieve several sometimes conflicting goals
There seems to have been little effort to weigh the costs and benefits of
such objectives as self-sufficiency in food and clothing which conflict
with the objective of efficient allocation of resources
The Plan was divided into A and B projects The former were to
contribute directly to national development the latter to provide domshy
estic revenues and foreign exchange to finance the A projects Some
recognition was given to the need to balance outlays and resources Howshy
ever the plan was confined to the public sector alone an economy-wide
balance was not attempted The needs for imports were understated proshy
jected exports were overstated the effects of inflation were ignored
Many of the A projects clearly represent undertakings that would be deshy
sirable for economic development Yet the failure adequately to analyze
their costs in terms of construction maintenance inventory replenishment
and resource allocation casts doubt on the micro-economic aspects of the
plan
156
No attempt was made to program outlays in such a way that output and
expenditure would increase together in order to reduce the rate of inflation
In 1967 and later under the new Suharto government Indonesia again
leaned to the West sought to check the rate of inflation and enlist the
energies of private enterprises in the service of economic growth The
new planning groun has drawn on able local economists a number of whom
were trained at Berkeley and Wisconsin and several groups of foreign
specialists In agriculture hopeful plans are being made to introduce highshy
yielding varieties of plants -- especially rice strains developed in the
Philippines that preliminary trials indicated can be adapted to
Indonesia The new varieties are very responsive to fertilizer inputs
and require an appropriate mix of other inputs and conditions including
adequate incentives to farmers It is likely that by 1973 the agriculshy1
tural picture in Indonesia will be widely improved over recent years
Planning in Indonesia is hobbled by shortage of reliable statistical
data and by excessive centralization rather than reliance on needed comshy
petent planning groups of high status within the Ministries and in the
regions of the far-flung and diverse cou- Land reform issues in
Java are important for the longer run so are those of cooperation between
the regions and the central government and between the technicians and the
military The possibilities of steadily improving the effectiveness of
the public administration are crucial2 Given these major constraints
the present plan seems to be a very good one
2 - Thailand
Most efforts of the Thai planning authorities have been concentrated
on the analysis of specific projects The development plan is still a
ISee Leon A Mears Guidelines to an Agricultural Strategy for Indonesia Discussion paper 68-27 Institute of Economic Development and Research School of Economics University of the Philippines August 1968 Also Everett D Hawkins and John A Richards Too Little and Too Much Rice Center for Development Working Paper University of Wisconsin August 1968
2Cf Hatzfeldt a cit esp pp 66-80
157
combination of sectoral programs and projects rather than an over-all plan that would balance the outputs of one sector with the requirements of another It also suffers like other plans of these countries from inadequate integration and from lack of tying together planning and governshy
ment financing
Thailand formulated its first National Economic Development Plan for the years 1961-66 a second for 1967-71 There was no attempt to achieve balance in development outlays and resources for the whole economy but an estimated balance of expenditures and revenues in the public sector was presented for each of the plan years In the first phase of the plan deveshylopment funds often had to be held in reserve due to a shoctage of approved projects More recently the staff of the Economic Planning Office of the National Economic Development Board has been increased
In both the 1961-66 and 1967-71 plans the government concentrates on provision of the basic infra-structure and maintenance of a favorable inshyvestment climate Emphasis is placed on rural development and on manpower training Regional planning and an attempt at achieving balance in econoshymic growth on a regional basis are undertaken The development nf manushyfacturing industry is left to private investment
The second plan provides for a Private Sector Planning Committee composed of representatives of private manufacturing trade and services which will identify investment areas of national significance to be conshytained in the Plan and recommend appropriate government policies Governshyment policy will shift emphasis from investment in state enterprises to provision of analysis and research services establishment of industrial standards and aid to small industry In this way the planning process will be broadened to include the private sector
Since its beginning in 1960 Thai central planning has become more comprehensive and more relevant to national possibilities It is technicshyally competent The deficiencies lie in the political sphere the planning
lacks authority its recommendations are in the main not carried out The need is for serious commitment to growth by the national political leaders
158
- Singapore
Singapore is a city-state so heavily dependent on foreign trade (and ou flexibility and efficiency in that trade) that any tight aggregashytive targets of GNP and export growth are unrealistic The government aims at infrastructure to increase efficiency and ability to adapt to changing circumstances and at social outlays to increase welfare and maintain polishytical stability There has been formal Planning with a planning group attached to the Prime Ministers office But the effort was not important and has been abolished Nevertheless Singapore has not like Hong Kong its parallel in many respects taken pride in non-planning and in nonshycollection of statistics
The Economic Development Board is the chief government agency focusshysing on the problems of economic growth It gives loans to encourage prishyvate industrial projects and participates directly in such projects The large Jurong Industrial Estate developed by the Board on built-up land west of the city contains many private firms in pioneer status encourshyaged by tax and other concessions The Estate is an impressive success all of its scores of industrial plots have been committed and more land is to be cleared for future expansion
The already considerable unemployment ia Singapore -- about 9 -- will be increased through withdrawal of British military forces by the end of 1971 The government is very concerned about the problem its strategy is major encouragement of foreign investment with some emphasis on the tourist industry which is labor intensive In general the tone of governshyment policy is eclectic and energetic there is reliance on encouraging private enterprise and on social welfare measures -- education municipal housing and other The government is committed to improving economic
research and statistics
Singapores eclectic approach leads to risk of inconsistency between the implications of the total of individual projects and over-all purposes and to risk of lack of vision on long run trends
159
4 - Philippines
There have been a succession of planning agencies and development plans
in the Philippines since the end of World War II But the plans have not been
put into effect
Responsibility for planning lies with the National Economic Council
The current plan the Socio-Economic Development Program for fiscal years
1966-67 to 1969-70 covers detailed government programs in agriculture and
in the development of infra-structure There is also detailed planning for
industrial development although principal reliance is placed on free entershy
prise The plan takes into account the effects of expansion in one industshy
ry on another Attempts are made to balance government developmental exshy
and to establish foreign exchange requirements forpenditures with revenues
sectoral programs and individual projects Timing of construction rated
capacity and financing of individual projects are specified
The industrial development program is designed to achieve the estabshy
lishment and expansion of basic industries such as iron steel and alumishy
nium chemicals wood pulp and paper food processing and wood product
industries Promotion of industrial research development of small-scale
industries and increased capacity utilization are also to be pursued The
goals are to be achieved through use of the governments direct allocative
powers and through public policies to channel private investment This
plan is said to enjoy more official support than have the previous deveshy
lopment plans But responsibility for implementing the plan still rests
with the individual ministries If there is not firm executive support
for the plan it -- like its predecessors -- is little more than a wishing
book
5 - Malaysia
Malaysian development planning is unlike that of the other nations
of Southeast Asia determined in large degree by the choices of people
throughout the cities and countryside The plans built on this solid
foundation have been carried out with considerable success Clair Wilcox
in hs summary of planning experience in Southeast Asia concludes Only
in Malaysia has (plan execution) been thorough and sustained
op cit p 33
160
Malaysian planning dates back to the two Malayan plans for 1956shy
1960 and 1961-1965 The latter describes general goals of development
growth targets and general programs bic gives little information on
specific projects Outlays for development are balances against the
resources available Industrial development is left to private entershy
prise with provision for public encouragement Public expenditures ace
made among broad programs with principal emphasis on agriculture
The Plan for 1966-70 continues the policies of the earlier Malayan plans extending these policies to Sabah and Sarawak Provision is made
in the new plan for substantial developmental expenditures in the latter
areas for government buildings survey and transport and communications
The government continues to leave the operational aspects of industrializashy
tion to private enterprise seeking to encourage both domestic and foreign
private investment This is to be done through manpower training policies
general stabilization of the economy development of infra-structure and
the provision of incentives
The Economic Planning Unit itself recommends capital expenditures so that the Plan and the budget are more closely related than in many countshy
ries The central planning agency has more influence on the capital budget
than does the Ministry of Finance Implementation is through the Ministry
of Rural Development headed by the vigorous Deputy Prime Minister to
whom full authority for development planning has been delegated Someshy
times the Rural Development Department has gotten ahead of the Plan and
inadequate pre-investment studies have led to difficulty in securing
foreign funds Few programming units (but more than in most LDCs)are
found in the operating departments Waterston praises the quality of
operations flow and the operations room approach for evaluation and reshy
porting (but attributes success mainly to executive pressure) Resources
available rather than requirements are emphasized as the starting point-shy
which may have resulted in a failure to stretch resources to the utmost
Resources for the planners include protective tariffs tax incentives
medium and long-term industrial credits loans to small industries indusshy
trial site development establishment of industrial standards and the undershy
taking of industrial research and apprenticeship and training programs
1Albert Waterston Development Planning--Lessons of Experience Johns Hopkins Press 1965 Malaysias experience is referred to at many places in this excellent volume
161
Development projects are proposed in the villages and municipalities
aggregated into district proposals screened at the state and federal level
and forwarded to the Economic Planning Unit which is responsible for formushy
lating the national plan Detailed reporting on the progress of approved
projects is required and frequent inspection trips are made to insure that
the plan is carried out Thus local participation and a combat-like operashy
tions procedure are combined
C - Multiple Objectives
1- Difficulties as seen by the planners
At the Bangkok conference of Asian Economic Planners in 1963 the
delegates were frank in citing difficulties they faced and the deficiencies
in their governments efforts to meet growth problems The external diffishy
culties they specified were unfavorable changes in terms of trade and in
the availability of external assistance As to domestic faults in economic
planning they cited (1) inadequate statistical data (2) poor coordination
among government planning and implementing agencies (3) lack of coordination
between government agencies and the community (4) unrealistic planning goals
and (5) failure to set priorities among sectors and projects
With respect to execution of programs they listed (6) scarcity of
adequately trained and motivated administrators and technical people (7) inshy
effective mobilization of domestic savings and (8) failure to stimnlat
private business and the conimunity to make their best contributioll to planned
development
These are then the conscious points of failure in economic platinin
in the minds of these knowledgeable planners The natural moral is Odat the
concerned administrator and technician should study how to correct tile Faults
and then do the correcting
An air of unreality hangs over such an analysis It assumes
that governments have maximum or at least rapid economic growth as
their central goal Neither the one nor the other is necessarily true
Economic growth is one only among a number of goals of government It
sometimes is not a serious goal at all Second any large organizashy
tion like a government or government department is subject to
162
administrative and ideological constraints on behavior that force it systemshyatically askew from efficiently achieving Its goals This theory of orror of large organizations holds for laissez-faire and communist governments and large private businesses alike and for their large departments and divisions also The existence of such systematic error is far from implying that government economic activities are not useful and necessary or that small private businesses are not subject to their own patterns of error
As soon as we accept the facts that governments have multiple goals and that bureaucracies function in their own characteristic patterns the evaluation of success versus failure in economic planning becomes a complex
problem
2 - The purposes of planning
We list and comment on briefly below first the economic goals and second the political and social goals of economic planning The latter turn out to be normally of major often of overwhelming importance The question then arises third of the extent to which the two goals are normally
coincident or in conflict
(a) Economic goals include the following
(I) Maximum rapidity of growth to be achieved within some given time horizon
(2) Minimum pressure on the standard of living
(3) Minimum unemployment and under-employment
(4) Minimum instability in economic life (5) Maximum shift of the rate of population change toward
an estimated ideal level in order to maximize income per capita
These economic goals are in competition with one another There is an administrative opportunity cost to each in that limited administrative resources devoted to one mean less available for the others They are also in more fundamental conflict Maximizing the standard of living is in conflict with maximizing the rate of economic growth higher consumption means less inshyvestment which often means a lower rate of growth Maximizing employment forces a choice of techniques that both immediately and through feedback
163
effects will diminish the rate of growth To maximize income one must seize
technical market and organizational opportunities as they appear but this
means more instability Effective policies to check the growth of population
may not be consistent with the location and occupation trends that will maxishy
mize total economic growth
Economic success must therefore be measured by a weighted index of the
subgoals
(b) As to the political goals The usual central preoccupation of any
governing group is keeping itself in power swelling its power if possible
The threat of loss of power may be remote permitshyand checking any decline
or it may be pressing leadingting considerable short-run freedom of action
tc urgent or desperate measures for survival
Means to the goal of maximizing political power involve strategically
(1) control of the military and police authority over taxation and the money
supply and control of general government and party administration (2) making
effective use of nationalist sentiments and (3) the weakening and dividing
winning over or possibly repressing and silencing of political opposition We
comment on each of these in turn
(1) Not much need be said about the first The functions of the milishy
tary are external defense and domestic order that is to achieve a credible
external posture and to put down the threat and fact of domestic disorder and
The threat of the military itself is parallel it may turninsurrections
against its own sponsors Complete control of taxation and the creation of
money is normally achieved with independence
(2) The implications of nationalism are more interesting Nationalism
is a major asset for nearly all governing groups and above all for those newly
The desire of governing groups to use thisindependent through force of arms
power for their own political advantage tempts them to oppose the foreigner in
They are impelled also to cater toconspicuous ways that are not too risky
They are likely specificallylocal religions customs and patterns of value
to support local economic orthodoxy whatever it is--private enterprise socialshy
ist communist cooperative or state-directed isolationist
(3)As to the political opposition governments that are insecure are
tempted--above all where the example of history is that of autocracy--to reshy
press expressions of dissent and independent criticism The governing group
may move abruptly or patiently and subtly toward the one-party state Illshy
fortune may more and more clearly await those who are discontented and show
164
it For those who accept the going orthodoxies and support the regime there will be the chance of political success and influence social success and
perhaps economic good fortune as well
Such a pragmatic listing has an unsympathetic air But it is meant to be only descriptive The desire for power and status is one of the deepshyest human drives found in all societies in all periods of history And party leaders may feel a non-selfish responsibility to their followers whose status incomes and perhaps personal safety depend on the continued strength of the regime Finally no economic or other program in fact focussed toward the welfare of the people of the state has much chance of success unless it is carried out over a considerable period of time--which means government
stability
In Indonesia in the early years after independence in the Philippines in recent years and in many another country effective economic planning has been vitiated by maneuvering for power among political leaders and frequent shifts of faces and policies Such government instability makes economic planning a frivolous exercise Whether one calls the pattern a failure of planning or a failure of direction is a matter of words
D - Spill-overs Plan Harmonization and Bilateral Agreements
1- The Spill-over Effect
The achievement of any kind of regional cooperation agreement or customs or payments union has deeper implications for the national economic policies monetary and fiscal of the member countries There is what Schmitt has called the spill-over effect of integration I whereby as in the case of the European Economic Community each step toward integration creates new needs and fresh demands to proceed in the same direction Thus with the OEEC as a beginning the Customs Union created pressures to integrate capital markets which in turn may eventually require currency unification for effectshyive functioning Currency unification in turn may imply pooling of sovershyeignties with a concomitant destruction of the separate identies of the partshy
icipating countries
IHans 0 Schmitt The Integration of Capital Markets in EuropeA Step Towards Political Unification World Politics 1968 Oesearch paper 6 in this Project)
165
There is no inevitability about this succession Rather the spillshy
over process implies the ultimate inconsistency of a customs union and the
political sovereignty of member countries In view of the resurgence of
nationalism both political and economic the less formal such cooperative
efforts are initially the more successful they are likely to be--which is
an implication for policy
The ECAFE proposal of the regional harmonization of national deveshy
lopment plans deserves specific discussion
2- The Regional Harmonization Proposal
The plan harmonization approach to integration is regarded by its 1
authors as an alternative to the classical prescription of free trade
It is defined as partial or comprehensive extension of national economic
planning to a regional or sub-regional plan for the allocation of productive
resources Sooner or later it should lead to the formulation of an investshy
ment and production program and policy from the point of view of the region
as a whole Trade liberalization is a permissive circumstance of plan
harmonization so that commodity movements will be a dictated rather than 2
a dictating factor in plan harmonization The plan harmonization approach
would replace national import substitution policies by regional or sub-regional
1Approaches to Regional Harmonization of National Development Plans in ECAFE Economic Bulletin for Asia and the Far East (December 1964) pp 33-81 Hiroshi Kitamura and Ajit N Bhagat Aspects of Regional Harmonizashytion of National Development Plans in T Morgan and N Spoelstra eds Economic Interdependence in Southeast Asia University of Wisconsin Press 1969 pp 39-58
2Two reasons are given one economic and the other institutional first it is said that liberalization by itself would increase trade only on the assumption of some elasticity of supply of internal resources in particular uses -- a condition that is often only dubiously satisfied in LDCs and second since almost all countries in Asia have resorted to some sort of planned approach to economic development a negotiated father than a spontaneous coordination of policies will be me meaningful Approaches op cit pp 37-39
166
import substitution policies that should have more specialization and larger1
scale and so greater chances of success Locational factors though imporshy
tant2 are subsidiary to the main elements in the harmonization approach the
widening of the size of the market and the avoidance of duplication of proshy
ductive activity 3 It is suggested also that in its earlier phases the
approach should emphasize the sectoral or the commodity approach on a
sub-regional basis 4 When once resource allocation over agreedareas of
specialization has been made and trade liberalization has taken place the
evils of nationally-based import substitution policies would be prevented
The focus of the plan harmonization approach therefore is the estabshy
lishment of a single region-wide investment and industrialization program
requiring deliberate changes in the production structure of individual
countries Such changes would be pursued along lines of specialization
jointly agreed on through negotiation The Approach is an ingenious and
highly institutionalized attempt to overcome foreign exchange shortages
to alter the existing pattern of the regions foreign trade and to accelshy
erate industrialization of the region as quickly as possible
IThe Approach warns against the possible dangers of non-operation of market forces of competition It suggests that appropriate safeguards will have to be devised to prevent the emergence of state monopolies and stateshyowned cartels and the loss of economic efficiency Furthermore suitable accounting and pricing procedures criteria for choice of techniques incenshy
tives to improve production techniques are relevant factors that will need to be examined Approaches2 p 43
2The location of the industries will be based on considerations
relating to the availability of material power techniques servicing facilities etc as to an equitable distribution of the industries among participating countries Economic Survey of Asia and the Far East 1963 pp 115-116
3It should not be difficult to devise joining industrial ventures at any (our underlining) location on the basis of some market-sharing agreeshyments Approaches op cit p 38
4The ECAFE Secretariat has in fact made some feasibilityor preshyinvestment studies in the fields of iron and steel fertilizers aluminum pulp and paper rubber jute and allied fibers and rice Approaches ibid pp 44-81
167
The Approach rejects free or freer trade among participating coutitries
as a means of ensuring efficient allocation of existing and future producshy
tive resources It is argued that enlargement of the market by a mere liftshy
ing of trade barriers is insufficien to expand intra-regional trade because
of the lack of complementarity of economic structure among the countries of
the region and because of the import substitution policies currently being
followed by those countries The countries require therefore radical
changes of resource allocation in a desirable direction which is assumed to
be one that would lead to an increase of new (rather than traditional) lines
of economic activity and to significant economies-of-scale It is contended
that the mere enlargement of the market need not lead toward new lines of
activity
Underlying the Approach seems to be an assumption that political hurshy
dles can be overcome by the lure of the considerable economic gain that the
venture will bring to individual countries--a gain achieved by cost reducshy
tions flowing from the growth of large-scale industries Furthermore it is
argued that in reaping the benefits of the economies-of-scale the location
of key industries does not really matter as long as the market is large
enough to absorb the increased production--only a larger market makes it posshy
sible to exploit the best technology
Several questions come to mind (1) It has been reasoned in a preceding
section of this paper that regional integration is accompanied by some trade
diversion from low cost to higher cost sources of imports It has also been
reasoned that such short-run losses would be offset by long-run gains arising
from dynamic elements such as internal and external economies and structural
changes This in fact is the implication of the Approach But it remains
uncertain that the Approach will bring about the necessary structural changes
(2) A number of pertinent problems such as the structure of industry
(competitive versus monopolistic forms) in member countries and their pricing
policies are hardly touched upon The relative absence of competitive
forces--in for example government controled operations and private cartels-shy
within the integrated industries may considerably reduce the economic gain
otherwise made possible A competitive environment is in part inconsistent
with the Harmonization Approach Nevertheless competition is imperative for
168
economic efficiency as even the champions of import substitution policies
eg Prebisch and Linder agree
(3) Besides the inter-country coordination of development plans there
is another problem of no less importance That is the unavoidable need for
bringing about changes in the monetary and fiscal policies of the member
countries consistent with regional policies in investment and trade
(4) For such a far-reaching proposal one would expect meaningful emshy
pirical work substantiating the economic arguments and spelling out a basic
set of formulas for the agreed specialization This work is conspicuous by
its absence The proposal does contain exploratory studies of seven indusshy
tries iron and steel fertilizer aluminum pulp and paper rubber jute
and allied fibers and rice Evidence of economies-of-scale comes from data
on other countries such as the US and France But due to difference in
the economic technical and social conditions of these countries as compared
with less developed Asian countries the comparisons may not always be jusshy
tified It is not surprising therefore to come across repeated references
to the unavailability of necessary data and to the need for further empirshy
ical research A positive proposal such as this needs more solid ground
to stand upon Once such an institutionalized arrangement is launched on
scale steering it in another direction would be difficult
(5) The harmonization of development plans is said to be feasible beshy
cause most countries rely on planning in solving problems of economic deshy
velopment This reasoning however seems oversimplified Planning means
something different from country to country In Malaya and Taiwan for exshy
ample economic planning is generally adopted to maintain the framework in
which economic activities are pursued by individuals and firms with a minishy
mum of government intervention In India Burma and Ceylon more of direct
control of economic activity is carried out by the government The fornmer
countries in view of the comparative success to date of their private enshy
terprise orientation may be extremely skeptical of an approach demanding
detailed and joint planning Also for Malaya Taiwan and Thailand the
foreign exchange gap has not been a critical problem the Approach directly
oriented toward region-wide saving of foreign exchange will not be espeshy
cially attractive to them
169
(6) Finally an obvious problem with the harmonization approach is
that it is likely to give rise to sensitive bargaining by member countries
for allocation to them of desirable industries--those with prestige and
those conferring military advantage Since trade liberalization follows
rather than precedes resource allocation the criteria of resource allocation are in constant danger of being distorted by national pressure
groups and national lobbying This risk exists in spite of pre-investment
and feasibility studies that will be made prior to settling upon the agreed
areas of specialization
One possible way out of the predicament is that institutional pressure
might be put on the prospective beneficiaries of a scheme through agencies
like the Asian Development Bank and the ECAFE Secretariat that are directly
involved in extending technical and financial help to promote two or three
nations or regional joint concerns International donor agencies involved
might make their help conditional on the recipient countries adherence
to the various criteria suggested in feasibility studies A certain degree
of institutional pressure within the framework of an obviously sound econoshy
mic rational should be suspected neither of partisanship nor of arbitrariness
3- Bilateral agreements
Quite a few countries in Asia have entered into bilateral agreements
with other Asian and non-Asian countries 1
1 For instance India has entered into bilateral trade agreements with Burma Ceylon Indonesia Nepal and Afshanistan See Sunanda Son Indias Bilateral Payments a nd Trade Agreeme nts (Calcutta Bookland Private Limited1965) Ceylon has similarly extensively used this technique for expandshying her trade During the 15 years period--between 1950 and l9i4--Ceylon entered into trade agreements with 24 countries including China India Burma Ceylon Egypt Australia Austria Japan See Karunatilkae fINSThe Impact of Import and Exchange Controls and Bilateral Trade AreenentS on Trade and Production in Ceylon in T Morgan and N Spoelstra eds Economic Interdependence in Southeast Asia University of Wisconsin Press 1969 pp 285-304
170
Bilateral trade and payments agreements are not in general a desirable
They are not a substitute for multilateral trade1
form of trade expansion
Though flexible between the contracting parties bilateral agreements reshy
strict the scope of trade especially when non-transferable bilateral credits
are granted This limitation however is not an unmixed evil in so Ear as
bilateral trade and payments agreements help toward utilizing surplus capashy
city in specific industries as well toward avoiding unnecessary duplication
of production By bringing into emphasis the possibilities of resource
and demand complementarity among contracting parties such agreements can
serve as guides for future action The detailed pricing and credit clauses
the integral parts of such agreements need not be far removed 2 wcrked out as
from prevailing conditions in the world market Trade preferences of which
bilateral trade and payments agreements are special case are potentially
as important among the LDCs as they are between them and the MDCs--but
in both cases the hope is that they are steps toward general freer trade
E - Some Conclusions 3
Despite their heterogenity the countries of Southeast Asia do share
a common aspiration they all want to build for themselves
IOften bilateral agreements are a symptom Df the inability of the contracting parties to sell in the open market
21n the case of the Regional Cooperation for Economic Development among Pakistan Turkey and Iran (July 1964) three commodities viz aluminum (to be supplied by Iran) banknote paper (to be supplied by Pakistan) and carbon black (to be supplied by Turkey) will be supplied at world market prices This would ensure markets without putting the buyers to any price disadvantage Kitamura and Bhagat 2p cit pp 26-27
3It is clear then that Southeast Asia does not constitute an economic region in the sense that all the countries in the region are more like each other than any of them is like countries in other regions in terms of the usual indicators of economic performance Benjamin Higgins Dominant Problems in Southeast Asia Planning A Western View The Philippine Economic Journal (Second Semester 1965) p 430
--
171
self-sufficient and politically viable nation states Realization of this fact is important in any move toward economic interdependence Economic
and political nationalism can be a friend of and stimulus to regional econoshy
mic cooperation
The accepted role of the State in planning economic development is therefore an asset of much potential value Realities of the situation
demand that regional cooperative endeavors promote national felt interests
Often this promoting will prove a subtle exercise in compromise along the pattern of the superb efforts of JeanMonnet in the earlier days of the
integrated-Europe movement
Pressure from international institutions is likely to be far more
effective than pressure exerted by individual countries from outside the
experience of political colonialism in the past has made countries wary
of economic neo-colonialism The external and regional framework necesshysary for objective and impersonal pressure does exist in the area already
ECAFE the Asian Development Bank and perhaps other regional organizations
that can render service And from the outside the International Bank group
and other United Nations organizations can be helpful
In no one of the national development plans of the countries of Southshy
east Asia however is there a mention -- direct or indirect -- of the
possibility of improving development efforts through the formation of reshy
gional groupings Nevertheless as evidenced from various inter-government
conferences held under the auspices of the ECAFE Secretariat there seems
to be an increasing awareness of the possible advantages of multi-national
efforts toward economic growth in the hope of avoiding the pitfalls of
autarchic policies
A proposal forcibly made by Benjamin Higgins is that there should be
set up associations of recipient nations to evaluate jointly the promise
of national and regional proposals and once proposals are underway to follow and check on their progress and efficiency There are political
advantages in having technicians from neighboring countries on committees
to evaluate costs and benefits-- in addition to technicians of donor countshy
ries and of regional organizations like ECAFE and the Asian Development Bank
172
V - Regional Cooperation in Southeast Asia --
Forms Policy
A - Taxonomy
I - Degree of formality and government commitment
Measures for regional cooperation can be classified by degree of
formality and government commitment Cooperative activity can go on
under either private or government auspices (a) The most informal are
occasional meetings of private societies in various countries and exshy
change of information advice and published documents Examples are
meetings of and exchange between technical and professional societies
literary groups cooperatives and political groups
(b) Occasional ad hoc meetings of government officials and groups
are a bit more formal These meet special problems as they arise
(c) There may be understandings or agreements to consult or regushy
lar meetings on matters of joint interest The Association of Southeast
Asia (ASA) composed of Malaya Thailand and the Philippines during its
active period 1961-1963 both held ad hoc consultations and maintained
continuing joint committees and working parties
(d) There may be commitments to take cooperative action on matters
of a public service type where provisions by one state of a service
useful also to others causes no decreased supply of the service domesticshy
ally Among these are research activities technical exchanges exchange
and television programs films artistic exhibit exchanges exchange
visits of specialists and of groups ASA carried on such exchanges The
173
UNs Economic Commission for Asia and the Far East (ECAFE) carries on
research in regional economic problems The Southeast Asia Treaty Organishy
zation (SEATO) has carried on research in tropical medicine ASA also
initiated some studies of the possibilities of such research The Associshy
ation of Southeast Asian Nations (ASEAN) set up by 5 nations in 1967
proposes many forms of regional cooperation Technical advice has been
supplied and programs of technical education undertaken by ECAFE SEATO
and also by the Colombo Plan (CP) and the Asian Productivity Organization
(APO) ASA again has done some planning in the areas The Asian and
Pacific Council (ASPAC) a regional group of nine countries set up in 1966
also proposes to carry on cooperative activities
(e) There may be significant commitment of resources in the joint
interest (I) of contiguous countries in individual fields like road or
river valley development The Committee for Coordination of Investigations
of the Lower Mekong Basin on which four bordering states are represented
(Thailand Laos Cambodia and South Vietnam) envisages this kind of joint
commitment (2) Resources may be contributed for regional purposes Coshy
operative deep-sea fishing and fish canning and the setting up of regional
air and shipping lines have been discussed by several organizations inshy
cluding ASA and ECAFE Several years ago ECAFE recommended setting up a
regional development bank now solidly in operation as the Asian Development
Bank at Manila There can be regional joint effort to conduct research and
explore the market for products like rubber coconuts and fiber and to
increase tourism ASA carried on some investigations in this area There
may be agreements to market cooperatively including cartel policies to
limit sales and raise prices In late 1968 seven Asian nations agreed to
form an Asian Coconut Community to improve production and marketing Standshy
ardization of products production research training of technicians and
market research were all included
In the meetings at Delhi of the UNs second Conference on Trade and
Development (UNCTAD) in early 1968 a common bargaining position was sought
by the trade union of countries from the different underdeveloped regions
on trade policies and commodity marketing agreements shipping rates and
the like The aim was to face the high income countries in a better barshy
gaining position
174
In the list above none of the forms of cooperation require abrogashytion of sovereignity that is there isno appreciable commitment to change domestic government policies
(f) But domestic policies may be altered by regional cooperation (1)There can be agreement to limit production of export crops in order to raise market prices as under the Stevenson Rubber Agreement of the 1920s Sanitary regulations may be agreed to be enforced in two or more countries (2) Trade can be encouraged between two or more countries of the region by joint simplifying and standardizing of customs regulations ECAFE has recommended such measures and ASA to some extent undertook to carry customs liberalization measures into effect (3) Trade can be encouraged within the region by lowering or eliminating tariffs and other trade barriers In 1963 ASA urged study of the possibility of setting up a regional free-trade area Several such proposals were made in 1968 (4) Would a free trade area in part or all of the region imply the need for agreement on the locashytion of given industries The argument for such a need is that duplicating investment should be avoided and so also excess capacity and high average costs because of small scale of production This line of reasoning in turn implies that major investments will be decided within countries in the main by government policy and that private decisions and competitive pressures should not or will not be effective in determining location growth and contraction ECAFE has been in the forefront in urging this kind of policy A 1963 ministerial meeting responded to an earlier economists report by accepting as an aim of policy the establishment of a customs union or free trade area within the region and agreed that national development plans should be harmonized in order to achieve rational location and size of new industries The 1966 Kojima and Miki plans proposed patterns for achieving regional free trade (5) There may be agreement for a regional payments union to cut the need for restrictions on intra-regional trade by deficit countries (6) The desire for stable trade and payments relationships exerts pressure toward coordinating monetary and tax policies so that prices will be stable or change at similar rates (7) There may be coordination of other economic policies and regulations There may even be mutually adjustshyed policies for political change
175
(g) Finally there may more or less be complete political union as
exemplified in the assimilation of West New Guines by Indonesia and in
the checkered history of Malaysia and Singapore
2 - Cooperation within the region only
Cooperation can exist only within the region ASA has fitted this
category So does the Lower Mekong Committee and so did Maphalindo
(Malaysia the Philippines Indonesia) Or cooperation can exist between
one or more countries of the region and countries outside The Asian
Development Bank set up in Manila fits this category The
Asian Productivity Organization has its nine members in Southeast Asia
and outside from Pakistan to Japan ECAFE has 23 Asian members in
Southeast Asia and beyond SEATO has Thailand and the Philippines and
also Pakistan and non-Asian members CP has 15 Asian members Afghanistan
to South Korea plus countries outside
3 - Other categories
The range of regional cooperation measures listed above in accordance
with their formality and degree of official commitment is only one pattern
useful for setting up alternatives One may list disregarding overlapping
(a) Regional projects that require the agreement of two or more
regional countries versus those that dont such as regionally useful
enterprises set up by one government perhaps with support from the UN
or other international organizations the US or other governments or
by private foundations
(b) Regional physical investment projects (the Asian Highway the
Mekong River Project) versus educational and technical projects (the Los
Banos Rice Institute APO the UNs Economic Research Institute at Bangkok
technician exchange agreements any well-thought-of educational or reshy
search program that attracts students from other countries of the region
This division parallels the economic theory issue over emphasis on conshy
ventional physical investment versus emphasis on human and non-material
resources for growth1
(c) Purely economic inter-government agreements (trade and payments
treaties) versus other agreements -- political cultural educational
research
1See Research Paper 11
176
(d) Arrangements with invidfous conoInic andor military implications
(SEATO trade or investment agreements leading to national location of iron and steel metalworking electronic chemical and like industries)
versus those that dont have them (eg educational and research projects with entry open to students from other countries and research findings
freely available)
(e) Organizations that have functioned (ECAFE SEATO ASA CP APO
versus regional proposals advanced (and broken up) for domestic or foreign political effect with little or no fur tion Sukarnos NEFO-- Neuly
Emerging Forces-- is an example of the Latter Maphalindo (Malaysia Indonesia and the Philippines) was hardly more than a slogan and senLishyment and was ended with Sukarnos campaign of confrontasi against malaysia
including Singapore ASA the Association of Southeast Asia composed of Thailand Malaysia and the Philippines carried on for a time after its founding in 1961 a number of modest and useful cooperative activities It was broken up by a Philippine claim to Sabah in North Borneo a part of
East ialaysia Its successor ASEAN the Association of Southeast Aian
Nations (Thailand the Philippines Malaysia Sip apore and IndoneiJa) launched in 1968 seems to be weathering a crisis over the same Philippine
claim
B - The Political Hurdles The bars to mutually useful regional cooperation in Southeast- Aia
have been much as elsewhere in the world primarily political And in large part the causes of such cooperation as has onc on have also ctin
conspi cuots1y poliical
h1aphalindo a purely politi cal vehicle died gclting born ASAs
imaginative efforis were halted by political [allin out Itetween Ma lyasia and th e Philippincs SEATO survives mainly because of its poliiica1shymiilary implications ()her organization (ECAFE AP3 CU) survive and ar effe Liv in large part because oF Con tinul Ollits ide support---ich is partly political-economic in motivation and only partly disinterested
177
There are here and there among countries of the region persisting
suspicions and antagonisms that cause them to be acutely sensitive to the
political and military aspects of regionalism These sensitivities will
continue in varying degrees into future years New sensitivities may arise
And basic policies differ Burma and Indonesia (and India to the
west) have been inward looking relying on direct controls and checking
trade Indonesia after its 1965 crisis has become less inward Malaysia
Thailand the Philippines (and Taiwan) have been outward looking
choosing to rely more on private enterprise and relatively free trade
The political differences and sensitivities imply a moral Outside
encouragement to regional cooperation measures have the best chance of sucshy
cess when they achieve a net maximum from two goals contribution to the
obvious economic and other advantage of the region and intra-regional polishy
tical neutrality and colorlessness The avoidance of political suspicions
and antagonisms is an absolute requisite
In the list at the beginning of this section effective measures
listed under (a) (b) (c) and (d) informal and requiring little resources
and frequently politically colorless are a better bet for survival than
equally effective measures listed under (e) (f) and (g)
C - Guidelines for Policy
Unqualified conclusions cannot validly be drawn from facts analyses
and evaluations with as many aspects of uncertainty as those surveyed in
this study But we do need guidelines for policy--guidelines that are
neither unduly vtgue in view of what we know nor unduly positive in view
of what we dont
The United States concerned with encouraging for their own benefit
cooperation among the countries of Southeast Asia could do worse than conshy
sider seriously as a guide to policy the two key provisions of the highly
successful Marshall Plan of 23 years ago (1) International cooperation was
proposed for planning and carrying through programs to solve some one obshy
vious problem while the nations concerned could remain at odds on other
matters that were to be set aside for the time (2) The US would pledge
good will cooperation and a share of goods and capital to make the plan
work
178
The countries of Southeast Asia have a diversity of background and of
experience with economic development Any meaningful approach to cooperashy
tion must be based on and proceed from their backgrounds and experiences
Among the domestic political aims that have first priority nation buildshy
ing takes high place It may be a costly goal and dream but it is highly
cherished Nationalism is a central fact Hence any attempts at regional
cooperation must bo viewed as subordinate to the major theme of nation
building How can nations and their elites consciously gain as individual
units through regional cooperation
The more formal proposals would compel the countries of Southeast Asia
to redefine some of their national goals and modify some national policies
The viability of such proposals is therefore very doubtful
In contrast less formal attempts and partial measures may soften
the edge of nationalism And in time the experience of varied individual
forms of cooperation and we hope the discipline imposed on diverse ecoshy
nomic policies by success and failure causing convergence of those policies
can lead to a deepening sense of regional identity and hence willingness to
deepen and broaden regional cooperative ventures
179
VI - Summary and Implications (Implications for foreign assistance policy are starred)
1 - Southeast Asia like other LDC areas should have comparative adshy
vantage in manufactures with relatively low levels of productivity per
employee and with relatively low value added both from labor and capital
components These manufactures are in general textiles and clothing wood
products furniture leather products miscellaneous and other narrowly
defined groups Exceptions to this generalization arise significantly from
management and local skills differences Also climate soil mineral deposshy
its and other local resources can give advantage in special primary products
and other local resources can give advantage in special primary products and
to rubber wood and cork manufactures and iron and steel products
2 - The region as a whole has been doing badly in its exports to MDCs
While 1956-7 to 1964-5 total imports of MDCs rose by 76 the regions
exports to them rose only 28 Two-thirds of this lag is due to a negative
composition effect--that is the region has a high concentration in primary
product exports that have been expanding slowly in the world market One
third of the lag is due to a negative competitive effect--that is the
region was being outcompeted in the kinds of goods it did export
3 - The best performers with respect to export sales are Taiwan (+281
in this period) Thailand (+82) and the Philippines (+63) The poorest
performers were Indonesia (+3) Burma (-6) and Pakistan (-8) The main
explanation of this wide divergence in performance is the competitive effect
Good performers typically did well in a wide variety of commodities and vice
versa The commonly held view that countries with concentration in primary
exports perform poorly is not supported in our data Thailand and the Philshy
ippines have done very well despite high specialization in primary products
4 - One tentative induction or hypothesis to be drawn from these
data is that export success and failure which is closely correlated with
general economic growth trends is influenced in major degree by the extent
of over-valuation equilibrium or under-valuation of the exchange rate of
a country Furthermore it is implied that efforts to compensate for the
frequent over-valuation (by various forms of export subsidies and import
price adjustments) are inadequate because of administrative costs and adminshy
istrative weaknesses that are characteristic of LDCs and political presshy
sures and uncertainties that are characteristic of all countries
180 5 - The confirmation of this hypothesis would imply that regional coshy
operation to shift disequilibrium exchange rates toward agreed-on equilibshyrium levels could have highly beneficial effects toward speeding up economic
growth
6 -The share of intra-regional trade of these countries varies widelyfrom 79 for Laos to 57 for Singapore and 507 for Burma to 6 for Ceylonand 4 for the Philippines Most countries show a recent decline in this share (for Hong Kong because its external trade has been growing fast) Pakshyistan Korea and the Philippines have had rapid increases in their intrashyregional trade The countries performing poorly in intra-regional trade are those with negative competitive effects
7 - Protectionism in the region as it is in the world generally is relatively high on manufactures and specially high on more complex manushyfactures Hence less developed countries are specially handicapped in trying to expand sales abroad of manufactures which they judge to have feedback and dynamic advantages to them in training of skills improvement of organishyzation and capital formation These dynamic effects justify much attention (14 below) Though not amenable to quantitative estimation they are the mainly important potentialities from a regional preference or freer-trade
arrangement
8 -The effects of quantitative restrictions and of tariffs toward checking trade and distorting the structure of production is best measured not by the nominal in-the-books tariffs and equivalent levies but by theeffective protection the restrictions produce Effective protection reshyfers to the effect of the regulation or duty on (a) net value added by the producing firm or alternately on (b) its rate of profit
In general in this region quantitative restrictions appear to be moreimportant than tariffs There is a wide range in the amounts of restrictionshyism among the countries The Philippines was recently the least restrictive administratively but often imposes the highest tariff duties of all the
countries
9 - Protectionism is a much sharper bar to economic growth than it seems effective protection is erratic and is in general far larger than the rates in the tariff codes The chance therefore of gains in efficiency from lowered trade barriers is great this goal might well be approached on a regional basis
181
10 - Our analysis and sample calculation indicate that a typical Southshy
east Asian country would suffer little reduction in tariff receipts from
entering a regional free trade area Tariff reductions would probably occur
gradually over some years so that any revenue loss would be similarly spaced
out
11 - Major candidates for attention in Southeast Asia as promising prodshy
ucts for negotiating lower trade barriers are a long list of manufuctures
that have recently been showing very rapid growth rates (from 14 to 49 a
year) in lower income countries Among them are aluminum musical instruments
watches and clocks sanitary plumbing heating and lighting fixtures travel
goods handbags glassware toys games scientific etc measuring and conshy
trolling equipment and food preparations
12 - Among these are many products for which economies of scale are imshy
portant Hence efficient producers might well be able to compete and expand
successfully in a regional market though they could not survive save with
burdensome protection in one (small) country market Here is logical space
for regional agreement toward freeing trade
13 - It is sometimes argued that regiLnal LDC trade is a will-of-the
wisp because ey all produce the same ching This view is mistaken Sucshy
cessful economic growth is characterized by the opening up of small but
swelling niches of comparative advantage which can gradually build into a
large and complex network of Lxchange
14 - Among the potential dynamic gains from regional or wider-area
shifts toward freer trade the effects on resource supplies and productive
efficiency are crucial for example simplification and standardization enshy
couraged through producing for a larger market emergence of new industries
out of the specialization encouraged by large scale production and from more
contacts development of skills and entrepreneuring abilities in one industry
that are useful in others and better commvnications (a road or railroad deshy
veloped for one business can be used by others)
A regional scheme should be specially solicitous toward freeing trade
in kinds of production that have the most feedbacks Attempts to secure
these efficiencies by protectionism invite the blockage through rising costs
that has been weighing down import-substitution policies in recent years in
Latin America and elsewhere
182
15 - The trend of world trade since 1900 and also recently reinforces
the argument that LDCs should seek to up-grade their skills organization
and technology as urgently as they can Commodities with low skill-andshy
capital requirements have been making up a falling proportion and those with
high skill-and-capital requirements a rapidly rising proportion of world
trade as a whole The value of food and raw materials exports of LDCs has recently been riming at less than one-fifth the rate of growths of manufacshy
tures
The relatively rapid growth of LDC and Southeast Asian manufactures exshyports despite relatively high tariff protectionisms against them in the world
offers a useful opyortunity With less protectionisms through regional or
other agreements manufactures exports would grow still more rapidly
16 - One specific form of US encouragement to regional freer trade
measures might take the form of trade preferences extended by - US on conshydition of reciprocal lowering of Southeast Asian barriers within the region
The extension of such pieferences by the more developed countries especially
the US would meet the official and emphatic wish of the LDCs--which is
more firmly rooted in fact and analysis than the usual arguments have conveyshy ed The United States has already formally accepted the general concept It
might well be in the forefront of exploring the practical issues invclved as a step toward lower regional trade barriers and perhaps lower trade )arriers
generally
17 - Useful research contributions to regional cooperation can be made through continuous studies of comparative advantage within the region The
effort would be to discover what products promise the best stimulus to growth
through contributions both of current efficiency and of dynamic feed-back
effects that traditional exports often have failed to provide
In our own research we have made a modest venture in this direction
External assistance could support such studies
But even this policy is limited and hobbled by uncertainties of data Without correction of existing sometimes flagrant errors standardization
more appropriate definitions and further refinement in the regional economic
data now collected assessment of the consequences of any specific industry
expansions is very uncertain (See 19 and 20 below)
183 18 -A regional payments union though in general attractive as a means
of economizing foreign exchange offers only very modest gains in Southeast Asia The reason is that trade within the region is highly unbalanced there are heavy creditors and heavy debtors The unbalance exists both in the short-run (in quarterly data) and in the longer run (over a recent 8-year period) There is little reason to expect that the regional creditors (Thaishyland Indonesia Cambodia Burma) will be willing to extend long-term credits to the regional debtors (the Philippines and Malaysia-Singapore)
However the payments slumps that will result from the prospective endshying of the Vietnam War offers a useful opportunity for regional cooperation in forecasting the dislocation problems by countries kinds and amounts and for proposing offsets External assistance could support such studies and the formulation of proposals perhaps assisting other regional organizations like the Asian Development Bank in that work
19 - All quantitative judgments on the effects on trade in Southeast Asia of policy changes cooperative measures and normal growth rest on the foundation of existing statistics We have tested the accuracy of trade statistics of seven countries Burma Ceylon Indonesia Malaysia the Philshyippines Singapore and Thailand The basic method is to compare total imshyports reported by each of these countries for the years 1962-63 with exports from it reported by its trading partners The partners were 29 countries within the region and developed Western countries Similarly exports reportshyed by each of the seven were compared with imports reported by its trading
partners
The import-to-export ratios vary widely Many display flagrant disshycrepancy with the higher figure of a pair twice or more the value of the lower Of the ratios for total bilateral trade 62 per cent have a discrepshyancy wide enough (taken as below 9or above 13 where 11 is in the neighshyborhood of a normal expectation) to present a firm presumption of error The use of free or black market exchange rates does not alter these findings
We conclude that quantitative conclusions resting on available trade statistics even with the special cases of entreport economies (Hong Kong Singapore) and of Indonesia allowed for are resting on feet of clay For countries with high tariff or other barriers to trade or with legal or
184
other barriers to the flow of capital substantial errors are likely to conshytinue Since the statistics will emphatically not sustain much of quantitashytive conclusions we are compelled mainly to qualitative judgments
20 - Even more basic worries pertain to the national income statistics including specifically their savings and investment components (a) Their margin of error is probably large (but not checkable as with trade data) for one main reason because agriculture is a major sector of the LDC econoshymies and because the uncertainty inherent in estimates of farm production is greater than that for most other economic sectors (b)More important the concepts of the standard national income accounts have been shaped especially in the 1930s and 40s primarily for business cycles and classification-ofshyfinal-product purposes--and not for separating out the uses of resources that do and do not lead to economic growth
A major effort toward redefining national income aggregates especially consumption savings and investment so that they fit more adequately the purposes of economic development analysis carried out for US data by John Kendrick of the National Bureau gives an estimate of total investment
nearly four times the official estimates
This more useful approach from the conditions-of-growth point of view when applied to the national accounts of Southeast Asian LDCs implies that the effects of regional cooperation measures on for example savings and investment would shed only modest light on the probable changed rate of growth We do not attempt such estimates
It would be highly useful to re-estimate Southeast Asia national income accounts along the lines pioneered by Kendrick AID might well support such
efforts in the various countries of the region
21 -National economic plans inevitably have multiple goals of which economic growth is only one Two policy patterns exist in the region the Inward Looking countries (Burma Ceylon India Pakistan Indonesia until recentshyly) tend to plan strict resource allocation control trade and capital flows and often nationalize foreign enterprises The Outward Looking countries (the Philippines Malaysia Thailand Hong Kong and Taiwan) have these charshyacteristics in milder degree or not at all The latter group have had a better record in growth of GNP productivity increase import capacity growth price level stability and import substitution
185
22 - Plans in the region often suffer from lack of government firm inshy
tention to execute them and from shifts of government faces and poi1ies
The Malaysian effort alone has won praise for its evoking of felt wants in the villages and towns incorporation of plans in the government budget and
vigorous execution
23 - In none of the Southeast Asian national development plans is there
reference to the possibility of accelerating development through regional cooperation Outside agencies foundations and donor governments can often
be helpful through directing attention to regional group activities and polishy
cies that can further national aims
24 - The planned harmonization of national investments and economic policies into a regional pattern faces di ficult and sensitive negotiation
problems on the location of prestigious and militarily iiportant industries
The proposal suffers so far from lack of emphasis on competitive efficiency and from knowledge of the amount of economies of scale that can be relied on
(data used have come primarily from distant high income countries) Detailed
studies of local economies of scale could be useful and might be supported
from outside the countries
25 - The range of kinds of regional cooperation is very wide varying by degree of formality and of government commitment by the extent to which
they may involve countries outside the region by the extent to which real resources are involved and external economies to one nation are present by the extent to which non-economic matters are involved and specifically by the extent to which there are political and military implications
26 - The bars to continuing mutually-useful regional cooperation in Southeast Asia even more than elsewhere in the world are primarily politishycal The problem is shown most vividly in the Maphalindo ASA ASEAN sucshy
cession of attempts at co-operative activities Fairly basic policy differshy
ences are likely to continue and also to appear and disappear at intervals An election in the offing can persuade candidates for office to stir up
nationalistic sentiments joint danger can draw countries together
27 - Individual proposals for regional activities require individual
cost-benefit analyses--whichpwith all their difficulties and inherent unshycertainties of valuation are indispensable International agencies and
national donors can usefully support such cost-benefit analyses
186
Ad hoc and continuing groups of technicians of countries of the Region
might well be set up to evaluate the promise of national and regional proshy
posals including those that could be financed by individual donors and by
the ADB etc and to follow and check on the efficiency of projects once
they are started Such coiittees or associations might be supported by
AID Any cost-benefit studies of regional industrial possibilities need to
consider both current efficiency (comparative advantage) the dynamic feedshy
back effects on skills organization values and social changes and
capital formation
28 - One general presumption gives a useful rule-of-thumb for initisl
evaluation of proposals Projects that expand production andor productivity
have an obvious presumption in their favor Projects that seek higher money
returns through checking production andor productivity (for example comshy
modity agreements to limit output) are highly suspect They of course deny
the basic nature of economic progress which consists of increasing producshy
tion (- real income) They carry inevitable administrative burdens--and
administrative efficiency is a major LDC problem Their intent is apt to be
frustrated 5y the obvious the subtle and the manifold inroads of competishy
tion both from other producers of the same product and from substitutes
both in the short run and the long run
29 - Regional cooperation measures may well have their greatest beneshy
fits through an indirect influence Southeast Asia appears to distant peoples
to be a tolerably homogeneous area It is in fact widely heterogeneous in
the relevant aspects of history culture mineral resources soil fertility
population density exposure to the West and to modern technical methods
and local patriotisms and antagonisms
Such contrasts have historically proved to be opportunities the coshy
operative mixing of peoples of diverse backgrounds has repeatedly in various
parts of the world been a mutual stimulus to practical achievements The
potential gain is great
30 - Diversities within the region and the uncertainties of benefits
from existing proposals for formal integration both suggest that external
assistance should in the main be directed to informal partial politically
neutral measures of obvious joint benefit
187
Outside encouragement of major integration projects should be cautious
More emphasis needs to be placed on research and on mutual education through
discussion of going problems and possibilities Until potential participants
see clearly that there is a problem that the problem requires regional coshy
operation and that the net benefits will be significant pressure from outshy
side the region is unlikely to achieve a continuing effect
31 -A modest one-thing-at-a-time policy is desirable focusing on some
one obvious problem whose solution is in the unmistakable joint interest-shy
about which nations can cooperate while other matters they are at odds on can
be put aside for the time
32 -External support to regional cooperation measures has the best
chance of success when it achieves a joint maximum from two goals obvious
contribution to the economic and other advantage of the regions and intrashy
regional political neutrality and colorlessness The avoidance of political
suspicions and antagonisms is an absolute requisite
33 -Nationalism is a central fact Any attempts at regional cooperashy
tion in Southeast Asia must be viewed as subordinate to the major theme of
nation-building How can nations and their elites consciously gain as indishy
vidual units through regional cooperation
Formal cooperation plans that would compel nations of Southeast Asia
to modify their national goals or their national policies have a highly dushy
bious viability
Less formal and partial measures may soften the edge of nationalism
In time the experience of various forms of cooperation and the disciplines
imposed on diverse economic policies by success and failure (so causing conshy
vergence of those policies) can lead to a deepening sense of regional common
interest and hence willingness to deepen and broaden regional cooperative
ventures
188
Papers Written In The AID-University of Wisconsin Research Project on
Economic Interdependence in Southeast Asia
Abrahamsson Bernhard1 - Developing Nations and Ocean TransportationAn Analysis of Price and Cost of Ocean Transportation the Balance of Payments and the Case for National Merchant Marines with Special Reference to Southeast Asia September 1967
2 - Alwan Dorra Development Criteria in the IBBD Survey Mission Reports January 1966
3 - Baldwin Robert E The Case Against the Infant Industry ArgumentSeptember 1966 in Journal of Political Economy MayJune 1969
4 - Bell Peter F A Quantitative Study of Entrepreneurship and Socio-Economic Determinants of Development in Asia Research Paper 14 February 1967
5 - Bell Peter F Small Industry Socio-Economic Aspects of its Proshymotion in Asia Research Paper 16 March 1967
6 - Bhagat A N A Regional Payments Union for South and Southeast Asia (draft) July 1965
7 - Bilkey Angela A Brief Analysis of the Intra-regional Trade of the Central American Common Market Countries - Some Consideration Regarding their Total Trade (draft) July 1967
8 - Castro Amado A Philippine Export Development 1950-65 Nov 1966
9 - Chou K R Hong Kongs Changing Pattern of Trade and Economic Interdependence in Southeast Asia November 1966
10 - Devoretz Don J PL 480 and Southeast Asia September 1965
11 - Ellsworth P T Import Substitution in Pakistan--a Comment Research Paper 9 June 1966
12 - Ellsworth P T Import Substitution Growth and the Balance of Payshyments Some Comparisons June 1967
13 - Fag El Nour Nawal Comparative Advantage Versus Economic Development State of the Debate July 1967
14 - Hawkins Everett D Job Inflation in Indonesia Asian Survey May 1966 Research Paper 4
15 - Havkins Everett D Demographic Trends and Problems in Indonesia 1966published as Indonesias Population Problem Ch 5 in S ChandrasekharAsias Population Problems Allen amp Unwin London 1967
189
16-- Hawkins Everett D and John A Richards Too Little and Too Much Rice June 1968
17 - Higgins Benjamin Prospects for Southeast Asian Development May 1967
18 - Huang Kai-Loo A Nucleus for Developing a Common Market in Southshyeast Asia April 1966
19 - Huang Kai-Loo Factors Discouraging Savings in Asia May 1966
20 - Huang Kai-Loo Capital Flight in Southeast Asia July 1966
21 - Islam Nurul Tariff Protection Comparative Costs and Industriashylization in Pakistan
22 - Karunatilake H N S The Impact of Import and Exchanges Controls and Bilateral Trade Agreements on Trade and Production in Ceylon December 1966
23 - Kelley Allen C Demographic Change and Economic Growth Australia 1861-1911 Part I 1967
24 - Kelley Allen C Regional Integration Demographic Change and Patterns of Industrial Growth Research Paper 19 May 1967
25 - Kelley Allen C and James C Knowles Trade Theory Regional Inteshygration and National Economic Development The Case of Southshyeast Asia August 1967
26 - Kelley Allen C and Jeffrey G Williamson The Prospects for Regional Economic Co-operation and the Rate of Household Savings in the LDCs Research Paper 15 March 1967
27 - Kitamura Hiroshi and Ajit N Bhagat Regional Harmonization of National Development Plans and Trade Co-operation Appriaches to Economic Integration in the Developing ECAFE Region January 1967
28 - Lakdawala D T and R H Patil Prospects of Indias Foreign Trade with ECAFE Countries December 1966
29 - Leith J C The Specification of Nominal Tariff Rates in Effective Protection Estimates The Philippine Economic Journal Vol VI 1967 Research Paper 12
30 - Leith J Clark Tariff Structures and Protection A Background Paper March 1966
31 - Leith J Clark Non-Traded Imputs and Substitution in Calculating the Effective Protective Rate June 1967
190
32 - Lim Chong Yah West Malaysia External Trade 1947-65
33 - Morgan Theodore Theory of Error in Centrally-Directed Economic Systems Quarterly Journal of Economics (August 1964)
Research Paper 2
34 - Morgan Theodore A Theory of Economic Growth in Newly Settled as Contrasted with Old-Settled Areas October 1964 In A H
Whiteford ed A Re-appraisal of Economic Development Aldine 1967
35 - Morgan Theodore Investment Versus Economic Growth Research Paper 11 August 1966 Economic Development and Cultural Change January 1969
36 - Morgan Theodore Trade Preferences as a United States Policy with Special Reference to Southeast Asia August 1967 Malayan Economic Review Nov 1968 Research Paper 18
37 - Morgan Theodore Economic Planning--Points of Success and Failure Philippine Economic Journal Feb 1966 Research Paper 5
38 - Myint Hla Economic Theory and the Underdeveloped Countries Research Paper 3 March 1965
39 - Myint Hla The Inward and Outward Looking Countries of Southeast Asia and the Economic Future of the Region Research Paper 7
February 1966
40 - Naya Seiji The Commodity Pattern and Performance of Southeast Asias Exports to the Developed Areas Economic Development
and Cultural Change (forthcoming) Research Paper 10
41 - Naya Seiji Some Comments on Trade Projections for Developing Asian
Countries A Background Paper March 1966
42 - Naya Seiji Natural Resources Factor Mix and Factor Reversal in
International Trade June 1966
43 - Naya Seiji and Theodore Morgan The Accuracy of International Trade Data The Case of Southeast Asian Countries August 1967 in Journal of American Statistical Association June 1969
44 - Naya Seiji and Nyle Spoelstra Commodity Trade Patterns Among Southeast Asia Japan India and the United States 962
Preliminary Data March 26 1965
45 - Panglaykim J and Kenneth D Thomas Indonesian Exports Performance and Prospects
46 - Stephen E Reynolds Customs Unions among Developing Countries April 1968
191
47 - DV Ramana and Kenichi Odawara Deficit Financing and Import Substitution India 1951-65 January 1967
48 - Schmitt Hans 0 The Integration of Capital Markets in Europe A Step Towards Political Unification World Politics 1968 Research Paper 6
49 - Sen K C The Inward-Looking and the Ouward-Looking in Southeast Asia January 1965
50 - Sen K C Convergence in Planned Economies Research in Paper 1 June 1965
51 - Sen K C Economic Growth and the Price Level--An Analysis of Some Asian Data Research Paper 13 March 1966
52 - Sen K C Nation-Building and Regional Integration Research
Paper 8 May 1966
53 - IJ Singh Agriculture and Development June 1965
54 - Sun I - Shuan Trade Policies and Economic Development in Taiwan
55 - Staff Economic Interdependence in Southeast Asia prepared for SEADAG Conference Honolulu March 1967
56 - Suparb Yossundara and Yune Huntrakoon Some Salient Aspects of Thailands Trade during 1955-64 January 1967
57 - Ta-Yeh Wu Problems and Prospects of Economic Co-operation in Southeast Asia March 1967
Longer and Summary Papers
58 - (Book) T Morgan and N Spoelstra eds Economic Interdependence in Southeast Asia Univ of Wisconsin Press Nov 1969 (based on a Bangkok Conference of Feb 1967 and the work of the group) 480 pp
59 - Staff Economic interdependence in Southeast Asia (pamphlet) interim paper prepared for Southeast Asia Development Advisory Group conference at Honolulu March 12-14 1967 49 pp
60 - Theodore Morgan and staff Regional Economic Cooperation in Southeast Asia--Problems and Prospects (pamphlet) a paper prepared for a Southeast Asia Development Advisory Group Rural Development Seminar Honolulu June 19-21 1969 21 pp published by the Asia Society May 1970
192
61 - Staff Final Report on Economic Interdependence in Southeast Asia (a summary of research findings) December 1969 192 pp
62 - Benjamin Higgins Trade Versus Aid in the Reconstruction and Development of Southeast Asia 450 pp August 1967