Embed Size (px)
Citation preview

Cornell University ILR SchoolDigitalCommons@ILR
Articles and Chapters ILR Collection
2012
Bias in White: A Longitudinal Natural ExperimentMeasuring Changes in DiscriminationBrian RubineauCornell University, [email protected]
Yoon KangCornell University, [email protected]
Follow this and additional works at: http://digitalcommons.ilr.cornell.edu/articles
Part of the Civil Rights and Discrimination Commons, Labor Relations Commons, and the Raceand Ethnicity CommonsThank you for downloading an article from [email protected] this valuable resource today!
This Article is brought to you for free and open access by the ILR Collection at DigitalCommons@ILR. It has been accepted for inclusion in Articlesand Chapters by an authorized administrator of DigitalCommons@ILR. For more information, please contact [email protected].
Bias in White: A Longitudinal Natural Experiment Measuring Changes inDiscrimination
AbstractMany professions are plagued by disparities in service delivery. Racial disparities in policing, mortgagelending, and healthcare are some notable examples. Because disparities can result from a myriad ofmechanisms, crafting effective disparity mitigation policies requires knowing which mechanisms are activeand which are not. In this study we can distinguish whether one mechanism—statistical discrimination—is aprimary explanation for racial disparities in physicians’ treatment of patients. In a longitudinal naturalexperiment using repeated quasi-audit studies of medical students, we test for within-cohort changes indisparities from medical student behaviors as they interact with white and black patient actors. We findsignificant increases in medical students’ disparate behaviors by patient race between their first and secondyears of medical school. This finding is inconsistent with statistical discrimination predictions and challengesthe idea that statistical discrimination is primarily responsible for racial disparities in patient care.
Keywordshealthcare, treatment, professional, education systems, organizational studies, effectiveness–performance,behavior
DisciplinesCivil Rights and Discrimination | Labor Relations | Race and Ethnicity
CommentsSuggested CitationRubineau, B. & Kang, Y. (2012). Bias in white: A longitudinal natural experiment measuring changes indiscrimination [Electronic version]. Management Science, 58(4), 660-677.
Required Publisher’s Statement© INFORMS. Reprinted with permission. All rights reserved.
This article is available at DigitalCommons@ILR: http://digitalcommons.ilr.cornell.edu/articles/797

MANAGEMENT SCIENCEVol. 58, No. 4, April 2012, pp. 660–677ISSN 0025-1909 (print) � ISSN 1526-5501 (online) http://dx.doi.org/10.1287/mnsc.1110.1439
© 2012 INFORMS
Bias in White: A Longitudinal Natural ExperimentMeasuring Changes in Discrimination
Brian RubineauILR School, Cornell University, Ithaca, New York 14853, [email protected]
Yoon KangWeill Cornell Medical College, Cornell University, New York, New York 10021, [email protected]
Many professions are plagued by disparities in service delivery. Racial disparities in policing, mortgagelending, and healthcare are some notable examples. Because disparities can result from a myriad of mecha-
nisms, crafting effective disparity mitigation policies requires knowing which mechanisms are active and whichare not. In this study we can distinguish whether one mechanism—statistical discrimination—is a primaryexplanation for racial disparities in physicians’ treatment of patients. In a longitudinal natural experiment usingrepeated quasi-audit studies of medical students, we test for within-cohort changes in disparities from medicalstudent behaviors as they interact with white and black patient actors. We find significant increases in medicalstudents’ disparate behaviors by patient race between their first and second years of medical school. This findingis inconsistent with statistical discrimination predictions and challenges the idea that statistical discriminationis primarily responsible for racial disparities in patient care.
Key words : healthcare; treatment; professional; education systems; organizational studies;effectiveness–performance; behavior
History : Received November 29, 2010; accepted July 31, 2011, by Jesper Sørensen, organizations. Publishedonline in Articles in Advance November 4, 2011.
IntroductionFor a wide range of occupational and professionalroles, research has documented consistent and sig-nificant disparities arising from professionals’ inter-actions with their clients. Examples of include racialprofiling by police officers (Knowles et al. 2001), red-lining trends by real estate brokers (Yinger 1996) and-mortgage lenders (Ladd 1998), foul calls by basketballreferees (Price and Wolfers 2007), negotiated car saleprices (Ayres and Siegelman 1995), and, critically forthis study, racial disparities in the patient care deliv-ered by physicians (Institute of Medicine 2003). Oncesuch disparities are identified, professions may worktoward their mitigation. However, without an under-standing of the mechanisms giving rise to disparities,professions are unlikely to design effective interven-tion strategies.
A diverse set of theorized mechanisms may all con-tribute to disparities, and empirically disentanglingthe active mechanisms from the inert is a difficultand challenging area of active research (e.g., Altonjiand Pierret 2001, Chandra and Staiger 2010). Theseresearch efforts are crucial for informing effectivedisparity-reducing policies. Using a uniquely suitedlongitudinal natural experiment in the form of arepeated quasi-audit study of medical students, thispaper reports on the elimination of one theorized
mechanism, statistical discrimination, as a primaryexplanation for a very consequential disparity—racialdisparities in physicians’ treatment of patients.
The natural experiment of this study comes in theform of medical students “treating” race-varying stan-dardized patients (SPs)—actors trained to portray a spe-cific medical case. This common pedagogical practiceyields a quasi-audit study. Medical student cohortsparticipate in repeated SP case encounters duringtheir medical school training, generating longitudinalpanel data of these quasi audits. Audit studies are oneof the best ways to measure disparities arising fromdiscriminatory decision making (National ResearchCouncil (NRC) 2004, Quillian 2006), but until now,these studies have been entirely cross-sectional. Thislongitudinal study allows greater elucidation of thegenerative mechanisms for racial disparities resultingfrom professionals’ behavior than available via theprevious cross-sectional approaches.
Statistical DiscriminationThe theory of statistical discrimination was originallyput forth as an economic explanation for enduringdisparities within labor markets (Arrow 1972, Phelps1972). This theory helped to explain how disparateoutcomes could endure in a market of rational actors,where previous theory suggested that disparities from
660

Rubineau and Kang: Bias in White: Measuring Changes in DiscriminationManagement Science 58(4), pp. 660–677, © 2012 INFORMS 661
discrimination should be competed away (Becker1971). The appeal of a theory of discrimination basedin rational behavior rather than bias may help toexplain why statistical discrimination has often beenadopted as an explanation for disparate outcomes incontexts beyond the labor market. Statistical discrim-ination has been enlisted to explain racial dispari-ties in outcomes from policing (Knowles et al. 2001),housing (Ross and Turner 2005), mortgage lending(Ladd 1998), customer service (Lee 2000), automo-bile markets (Ayres and Siegelman 1995), and health-care (Balsa and McGuire 2001). These cited exam-ples invoke statistical discrimination to explain racialdisparities generated by the behavior of workers orprofessionals while acting in their occupational orprofessional roles.
Despite the compelling nature of the statistical dis-crimination explanation for the endurance of manyobserved societal disparities, little positive evidencesupports this explanation (Correll and Benard 2006).The dearth of positive evidence for statistical dis-crimination may result from its relative unimportanceamong the many mechanisms contributing to dis-parate outcomes (for reviews of the multiple mech-anisms underlying racial disparities, see NRC 2004,Pager and Shephard 2008), or simply result from thedifficulty involved in empirically disentangling sta-tistical discrimination from these other mechanisms.This difficulty is hardly surprising, given that differ-ent theorized mechanisms of discrimination are dif-ferent attempts at explaining the same observablephenomena.
In the well-documented case of racial disparities inpatient treatment by physicians, statistical discrimi-nation is seen as a “potent source” (McGuire et al.2008, p. 2) for those disparities. Several studies ofdisparate care document findings consistent with sta-tistical discrimination explanations (e.g., Lutfey andKetcham 2005, McGuire et al. 2008). The researchdesigns of these studies, however, are not able to dis-tinguish statistical discrimination from other mech-anisms, and their findings are also consistent withother disparity-generating mechanisms such as preju-dice (e.g., Fennell 2005, p. 1714). This study attemptsto falsify the statistical discrimination explanationfor racial disparities in patient care by physicians.To be clear, this falsification cannot and does notshow that statistical discrimination never contributesto disparities in care. Rather, we show that statisti-cal discrimination is unlikely to be either the sole orprimary mechanism responsible for racial disparitiesin patient care.
Our approach toward falsifying the statistical dis-crimination explanation for racial disparities in careis logically akin to the approach of someone whowishes to falsify the theory that human babies come
from storks. The falsification of stork theory, and thusa demonstration of the existence and importance ofother baby-generating mechanisms, can be accom-plished by empirically documenting a context wherethere are no storks but where an increase in newhuman babies is nonetheless observed. We examine asetting where statistical discrimination would predicteither static or decreasing levels of racial disparitiesand find instead significant increases in racial dispar-ities. This finding, disconsonant with statistical dis-crimination, shows the existence and importance ofother mechanisms for generating racial disparities inpatient care.
Defining Statistical Discrimination. Before at-tempting to falsify the statistical discrimination expla-nation for racial disparities in care, a clear definitionof the mechanism is needed. If a particular impor-tant characteristic (e.g., productivity) is both hardto observe directly and has different distributions(i.e., in the means or variances) across more easilyobserved social categories within a population (e.g.,age), it may be rational to prefer to treat (e.g., hire)population members differently based on these moreeasily observed categories (for reviews, see Correlland Benard 2006; England 1994, pp. 60–63). Whena decision maker makes decisions resulting in dis-parate outcomes by social category based on thetrue distributional differences associated with cate-gory membership, that decision maker can be said tobe engaging in statistical discrimination (Aigner andCain 1977; Baumle and Fossett 2005, p. 1251; NRC2004, pp. 61–62).
In contrast, decisions based on prejudice or biasedor inaccurate perceptions of differences in the hard-to-observe characteristic by social category are notstatistical discrimination. Discriminatory behaviorthat is based on erroneous perceptions is indis-tinguishable from and definitionally equivalent todiscriminatory behavior from unfounded biases. Togeneralize Aigner and Cain’s (1977, p. 177) statement,“To interpret the ‘statistical theory of discrimination’as a theory of ‘erroneous’ or ‘mistaken’ behavior by[decision makers such as] employers, as have someeconomists, is therefore without foundation.”
This definition of statistical discrimination hasbeen described as the “strong version of the statis-tical discrimination hypothesis, typically associatedwith economists” (Tomaskovic-Devey and Skaggs1999, p. 424), compared to a weaker version, associ-ated with sociologists, allowing for erroneous beliefsand stereotypes to be included within the defi-nition of statistical discrimination. Illustrating thisweaker version, a recent sociological review definedstatistical discrimination as deriving from “knownor assumed differences in competencies betweengroups” (Stainback et al. 2010, p. 233). We use

Rubineau and Kang: Bias in White: Measuring Changes in Discrimination662 Management Science 58(4), pp. 660–677, © 2012 INFORMS
the strong version and concur with the panel ofscholars authoring the National Research Council’s(NRC’s) Measuring Racial Discrimination (NRC 2004)that allowing the definition of statistical discrimina-tion to include potentially biased perceptions andbeliefs renders the theory meaningless and empiri-cally indistinguishable from bias. The NRC scholarsemphasized this point in the following statement:
When beliefs about a group are based on racial stereo-types resulting from explicit prejudice or on some ofthe more subtle forms of ingroup-versus-outgroup per-ceptual biases, then discrimination on the basis of suchbeliefs is indistinguishable from the explicit [and non-statistical] prejudice discussed above. Statistical dis-crimination or profiling, properly defined, refers to sit-uations of discrimination on the basis of beliefs thatreflect the actual distributions of characteristics of dif-ferent groups. (NRC 2004, pp. 61–62)
Even scholars advocating statistical discriminationas an explanation for racial disparities in care acceptthis proper definition of statistical discrimination.McGuire et al. (2008, p. 532) recently defined statis-tical discrimination occurring only when “providersapply correct information about a group to reducetheir clinical uncertainty about an individual patient”(emphasis added).
Identifying Statistical Discrimination. Althoughthe above definition of statistical discrimination mayseem stringent to the point of making it unlikely thatthis mechanism could ever be positively identified,this is not the case. The key to identifying statisticaldiscrimination lies in scrutinizing its dynamic ratherthan static predictions. For a host of reasons, the staticprediction, that decision makers base their decisionson the true distributional characteristics of the socialcategories, is virtually impossible to verify empiricallyand conclusively. The dynamic predictions of statis-tical discrimination, that is, predictions about whenand how decision-maker behaviors would changeunder statistical discrimination, not only provide away to positively identify statistical discrimination,but have documented success at doing so.
Changes in disparate outcomes under statisticaldiscrimination may result from any of three processes.The first process is correctional changes, where the deci-sion makers’ initial erroneous (i.e., bias-based) deci-sions may be in the process of being corrected viacompetitive forces and coming into alignment withwhat is predicted by statistical discrimination. Thesecond process is population changes, where the meansor the variances of the hard-to-observe characteristicmay have changed for a group in the population. Thethird process is information changes, where there is achange in the availability of the hard-to-observe char-acteristics of the target population. For the first two
processes, the changes in disparities move toward thedisparities entailed by the true distributional differ-ences among groups. In the final process, the levelof disparity is related to the availability informationconcerning the hard-to-observe characteristic. We con-sider whether and how each of these change processesapplies to our empirical context.
Previous scholarship (described in more detailbelow) has successfully revealed positive evidencefor statistical discrimination using the informationchange process. This process is based on changes inthe hard-to-observe characteristic. Consider the impli-cations of having more direct information about thehard-to-observe but valued characteristic. If a deci-sion maker were to have accurate information aboutthe hard-to-observe characteristic for a particular setof individuals, then net of that hard-to-observe char-acteristic, group membership should have no associ-ation with treatment decisions. Even in the presenceof noise in the signal of the hard-to-observe charac-teristic, if a decision maker were to interact with a setof individuals who provided signals of their hard-to-observe characteristics with uniform noise (i.e., signalvariance was uncorrelated with group membership),then again group membership should have no neteffect on that decision maker’s decisions. When deci-sion makers have more direct information about thehard-to-observe characteristic, and when the signalabout that characteristic is presented in a manneruncorrelated with social category, then statistical dis-crimination predicts lower disparate outcomes netof the hard-to-observe characteristic. This relation-ship between information and disparate outcomes hasbeen the key to empirically testing for positive evi-dence of statistical discrimination.
For statistical discrimination in labor market out-comes, the hard-to-observe characteristic is usuallyconsidered to be some form of worker productivity(Correll and Benard 2006). If an employer were tohave more direct and less noisy (or more specifically,noise that is uncorrelated with social category) infor-mation about productivity, then net of that informa-tion, disparities in outcomes by social group shoulddiminish. The amount of relevant productivity infor-mation an employer has about an employee or poten-tial employee is lowest before hire and increaseswith employee tenure with the employer. Thus, if anemployer only engages in statistical discrimination,the association between race and wages, for exam-ple, should diminish with employee tenure. Startingwith this insight, Altonji and Pierret (2001) testedfor such a diminishment, but found the opposite—an increase in the association between race and wageswith employee tenure. They did find this diminish-ment in the effect of years of education, suggestingthat although statistical discrimination may explain

Rubineau and Kang: Bias in White: Measuring Changes in DiscriminationManagement Science 58(4), pp. 660–677, © 2012 INFORMS 663
unequal wages by years of education, it is unlikelyto explain unequal wages by race. This example ofpositive evidence for the operation of statistical dis-crimination in the labor market is for statistical dis-crimination by educational status and not by racialcategory. The racial disparities in wages are likely theresult of other nonstatistical mechanisms.
Clearly, statistical discrimination can be positivelyidentified with the appropriate research design. Cur-rently, there are few examples in the literature of suchdesigns. One of the obstacles to performing empiri-cal research using an appropriate research design torule out statistical discrimination is the need for lon-gitudinal data of disparate outcomes by the samedecision makers. Attributing disparate outcomes todecision-maker behaviors, rather than other mecha-nisms, is empirically difficult. Doing so over timefor the same decision makers is all the more diffi-cult. Thus, the dearth of positive evidence for statisti-cal discrimination is less an indictment of the theoryand more a testament to the difficulty of disentan-gling that mechanism from others also contributing todisparities.
To falsify statistical discrimination in explainingracial disparities in care, this paper leverages thepredictions of statistical discrimination regardingchanges in disparate outcomes under the three changeprocess described above. We test for changes in dis-criminatory behaviors in an empirical setting wherestatistical discrimination change processes would pre-dict only reductions in disparities. In this setting,any measurable increases in discriminatory behaviorscannot be attributable to statistical discrimination. Interms of our earlier metaphor, we test for changes inthe number of new babies in a setting without storks.The disparity we investigate is racial disparities inpatient care, and the empirical setting is the first twoyears of medical school training.
Racial Disparities in Patient CareU.S. health disparities by race, where whiteAmericans experience significantly better healthoutcomes than black Americans, are pervasive andenduring and have a myriad of complex causes(Agency for Healthcare Research and Quality 2008).One troubling contributor is that U.S. physicians treatpatients differently by race (Institute of Medicine2003). The existence of racial disparities in patientcare delivery by physicians has been well docu-mented and established (Institute of Medicine 2003,van Ryn 2002). Notably, these disparities are inde-pendent of the race of the physician; that is, bothblack and white physicians generate similar racialdisparities in care (Chen et al. 2001).
Unfortunately, these disparities have been dis-turbingly resistant to change despite more than a
decade of awareness and many efforts aimed ataddressing the issue (Devi 2008, Gross et al. 2008, Orsiet al. 2010, Pletcher et al. 2008, Vaccarino et al. 2005).The Institute of Medicine (2003) report Unequal Treat-ment identified three classes of mechanisms contribut-ing to physicians’ disparate treatment by patient race:physicians’ racial prejudices, physicians’ (explicit orimplicit) racial stereotypes, and uncertainty-based sta-tistical discrimination (Institute of Medicine 2003,pp. 9–12). The report noted the lack of scholar-ship distinguishing among these mechanisms andurged further research, but the causes of care dispar-ities have remained elusive (Klonoff 2009). Since thereport, scholarship positing statistical discriminationas an important, and possibly the primary, explana-tory mechanism for these disparities has grownconsiderably (e.g., Chandra and Staiger 2010, Chinand Humikowski 2002, Lutfey and Ketcham 2005,McGuire et al. 2008, Balsa and McGuire 2003). Thesestudies reveal associations consistent with statisticaldiscrimination, but also consistent with other mecha-nisms. They have neither provided unambiguous evi-dence for statistical discrimination nor demonstratedthe absence of other discriminatory mechanisms.1
We describe below the design of our study, aimedat being able to falsify the statistical discriminationexplanation for racial disparities in care.
Research DesignThis study uses a longitudinal quasi audit of medicalstudents during the first two years of medical schoolto show that statistical discrimination is unlikely tobe either the only or primary explanatory mechanismfor racial disparities in patient care. In this section,we describe the context of this empirical study—the first two years of medical school, the nature ofthe quasi audits, and statistical discrimination’s pre-dictions of first to second year changes in medicalstudent behavior as revealed by these quasi audits.Whereas constant or decreasing disparities betweenthe first and second years would be consistent withstatistical discrimination, increasing disparities wouldbe inconsistent.
A Strategic Research Site: The First Two Years ofMedical SchoolThe decision makers (potential discriminators) in ourstudy are medical students. The potential targets ofdiscriminatory behavior are SPs—actors trained topresent a scripted clinical case to medical students.The use of standardized patients in medical school
1 In a notable exception, Chandra and Staiger (2010) do falsify theBeckerian “taste” bias mechanism as an explanation for racial dis-parities in the treatment of Medicaid patients having experiencedheart attacks.

Rubineau and Kang: Bias in White: Measuring Changes in Discrimination664 Management Science 58(4), pp. 660–677, © 2012 INFORMS
is a long-established pedagogical technique (Barrows1971, 1993) that has grown significantly with the2004 addition of 10 clinical SP case encounters as apart of the U.S. Medical Licensing Exam (USMLE).Race-varying SPs presenting clinical cases that do notinvolve any race-relevant pathology create a natu-ral audit study, allowing a good measure of differ-ential treatment (NRC 2004; Quillian 2006, p. 303).Although physicians, not medical students, are thedecision makers contributing to actual care dispar-ities, studies using SP case encounters have docu-mented racial disparities in medical student outcomes(Colliver et al. 2001, Beach et al. 2007).
Medical school training in the United States followsa highly institutionalized four-year structure (Cookeet al. 2006). Whereas the first two years of medicalschool are characterized by strong cohort unity andtraditional classroom-based pedagogy, the last twoyears are independent and apprenticeship oriented.The first two years of the medical school curricu-lum focus on classroom-based and laboratory learn-ing, with a cohort of medical students taking almostall of the same classes in the same order. Duringthese first two years, medical students have limiteddirect clinical encounters with actual patients. Stu-dents in the final two years follow individualizedschedules and have individualized patient care expe-riences. Medical students’ limited direct clinical expe-riences during their first two years undermine claimsthat increases in disparities may be attributable to sta-tistical discrimination.
In addition to the limited exposure to clinicalexperiences, the formal curriculum of the first twoyears of medical school is also relevant. The medicalprofession has responded to the finding of physician-generated disparities by altering medical schoolcurricula. In 2002, the Liaison Committee on Medi-cal Education (2008) added the requirement that allmember medical schools include cultural competenceskills training (ED-21) and that all member medicalschools provide instruction on the existence of racialdisparities in diagnosis and treatment (ED-22). Onepurpose of these requirements is to reduce physician-generated disparities (Betancourt 2006, National Part-nership for Action 2010). The specific structure andformat by which medical schools meet these require-ments are left to the discretion of each individualmedical school. To keep their accreditation, medi-cal schools have worked to ensure that the explicitlessons provided during medical training do not leadto racial disparities in care.
Longitudinal Natural Experiment:Repeated Quasi AuditsThis study scrutinizes the changes in care disparitiesby three cohorts of medical students between theirfirst and second years of medical school. The unifor-
mity, short time span, lack of subject attrition, andlimited clinical exposures of the first two years ofmedical school, paired with the common practice ofperforming natural quasi-audit studies on the stu-dents, makes this setting a “strategic research site”(Merton 1987) for investigating changes in discrimi-natory behavior.
When black and white SPs are assigned randomlyto a cohort of medical students engaging in SP caseencounters, disparities may be measured in differ-ences in the encounter outcomes between black andwhite SPs. The random assignment creates the natu-ral experiment where medical student characteristicsare unlikely to be associated with whether they inter-act with a black or white SP. The black and white SPsportraying the same clinical case defines the quasi-audit study where race is an exogenous manipulationof otherwise identical stimuli presented to decisionmakers. We track the disparities revealed by this quasiaudit from the case encounters performed by all firstand second year medical students to test for changesin racial disparities in care in a longitudinal naturalexperiment.
The core distinguishing feature of audit studies ver-sus other methods of measuring disparities is theuse of paired testing (Fix and Turner 1998, p. 11).Paired testing allows an objective answer to the ques-tion of whether one or more manipulated dimen-sions (such as race (Yinger 1986), gender (Neumarket al. 1996), criminal history (Pager 2003)), ratherthan any other characteristic or trait, give rise to dis-parate treatment by a decision maker. These specificdimensions are scrutinized in isolation by exposingdecision makers with paired versions of the kind ofstimuli they experience during the normal course oftheir decision-making process. These paired stimuli,often actors but sometimes simpler stimuli such asresumes, are trained or designed to be observation-ally equivalent except along the manipulated dimen-sions. A great advantage of audit studies is that theyallow a measurement of discrimination by decisionmakers when they are making the actual decisionsthat result in the disparate outcomes being stud-ied. Examples include decisions to invite job appli-cants to be interviewed or hired to actual jobs forstudying job segregation (Bertrand and Mullainathan2004, Pager 2003), or decisions to show, rent, or sellactual available real estate for studying housing seg-regation (Yinger 1986). Audit studies are currentlyone of the best ways to measure actual racial dis-crimination (NRC 2004, Quillian 2006). Even criticsof the auditing method acknowledge that audits are“the only objective means of detecting discriminatorytreatment” (Siegelman via Fix and Turner 1998, p. 3).
Our study uses paired testing with actors, butdiffers from traditional audit studies in several
Rubineau and Kang: Bias in White: Measuring Changes in DiscriminationManagement Science 58(4), pp. 660–677, © 2012 INFORMS 665
important ways. First, the behavior of medical stu-dents during standardized patient encounters doesnot contribute to actual disparities in health. Relat-edly, the medical students—not yet being actualdoctors—know they are interacting with actors andnot actual patients, and that their performances inthese encounters are being graded. These differencesbehoove caution in drawing a direct line between ourfindings and the mechanisms underlying disparitiesin actual patient care.2
Some of the differences between the nature of ouraudit study and traditional audit studies make ourstudy a better and more conservative test of dispar-ities. One of the strongest critiques leveled againstaudit studies involving actors is that the actors areaware of the nature of the study and may subtlyor unintentionally engage in behaviors that makethe finding of differences more likely (Heckman andSiegelman 1993, Quillian 2006). However, our studyis a double-blind audit: neither the medical studentsnor the actors are aware that the data from theseencounters are used to investigate racial differencesin care. Thus, it is highly unlikely that the actorswork to confirm differences. In addition, the factthat students know that their performance in theseencounters affects their grades introduces a level ofaccountability not commonly present in traditionalaudit studies. When decision makers are aware thattheir decisions are being externally scrutinized, thisaccountability may reduce the biases manifest in theirdecisions (Russo et al. 2000, Tetlock and Mitchell2009). If this tendency holds in our study, then ourdesign would make it harder to detect disparities, andthus act as a conservative test for disparities.
Audit studies have known limitations in additionto self-fulfilling behaviors by actors (Heckman andSiegelman 1993; NRC 2004, pp. 108–114; Quillian2006, p. 04). Most of these limitations do not apply tothe current study. The accuracy concern about auditstudies (often for employment or housing settings) isthat the same target of study does not receive mul-tiple audits from both (or all) conditions. Our studyuses many audits by both black and white SPs of thesame cohort-year of medical students to measure dis-parities at that level. Similarly, our study is largelyimmune to the concern that audit studies’ measuresof bias are localized to a particular event (e.g., a jobinterview), which may represent only a small part ofthe phenomenon being studied (e.g., employment dis-crimination). We are explicitly focused on studyingracially biased outcomes from clinical encounters and
2 The USMLE added standardized patient encounters to the examsrequired to earn a medical degree in part because these encoun-ters increase the fidelity of assessments of medical students’ likelyperformance as a physician beyond the previous set of exams.
not other aspects of racial health disparities. Indeed,the fact that these encounters are a required part ofstudents’ formal medical training greatly enhancesthe ecological validity of our study relative to explic-itly lab-based studies of discrimination (cf. Tetlockand Mitchell 2008, p. 14). One concern about auditstudies is that measures of bias at a particular site(e.g., a firm conducting a job search or looking for arenter) may not generalize to the market or region.Our study is essentially a quantitative case study andshares the generalizability limitations of case stud-ies; that is, although we are able to discern withexquisite detail the changes in disparities revealed inour setting, we cannot make definitive claims thatsuch dynamics may be expected to occur in all suchsettings. That said, we also have no reason to believethe medical school under investigation to be an atyp-ical medical school in terms of how it affects the dis-criminatory behaviors of its students.
Even the significant concern of auditor heterogene-ity is only a minor concern of our study. Despite beingtrained to behave uniformly, the actors cannot behaveexactly alike. In this study, the actors are SPs, trainednot only to conduct the audit, but to evaluate the per-formance of the auditee, the medical student. If SPheterogeneity related to evaluations is also correlatedwith SP race, then measured racial disparities in carecould actually be the result of this correlated hetero-geneity. This explanation was the one given by Col-liver et al. (2001, p. 12) for their empirical finding ofconsistent and significant disparities in cross-sectionalstudies of fourth year medical students. Although theheterogeneity could contribute to findings of bias, ourmain concern is identifying changes in bias between thefirst and second years of medical school. For auditorheterogeneity to contribute to any identified trends, theheterogeneity effect would have to be different not asa function of the race and experience or tenure of theauditor, but as a function of tenure of the medical stu-dent the auditor is evaluating. So the concern wouldnot be that black SPs might evaluate medical studentsmore harshly than white SPs (which would have aneffect on a difference, but no effect on a trend), but thatblack SPs’ harshness of evaluations might increase (ordecrease) for second year medical students relative tothe evaluations given by white SPs.3
3 Although racial effects on changes in evaluation harshness mayseem unlikely, something of a similar nature has been found.Simons et al. (2007) found that black employees rated behavioralintegrity violations by their managers more harshly than did theirwhite counterparts. If some similar kind of violation (e.g., increas-ing emotional detachment by the medical student (Mizrahi 1986,Spiro 1992)) is more common among second year students thanfirst year students, then racial differences in responses to thosebehaviors could appear as a trend in disparities. We address theconcerns of auditor heterogeneity and racial difference responsesto first versus second year students directly in our analysis.

Rubineau and Kang: Bias in White: Measuring Changes in Discrimination666 Management Science 58(4), pp. 660–677, © 2012 INFORMS
Statistical Discrimination and Changes During theFirst Two Years of Medical SchoolAbove, we described three types of change processesconsistent with statistical discrimination (correctional,population, and information). Here, we take eachchange process in turn and consider their implicationsfor our research setting.
Correctional Changes. Correctional changes in dis-parities occur when perceptual errors and biases arecompeted away in the market. The result of cor-rectional changes under statistical discrimination ischanges toward treatment disparities entailed by theactual distributional differences among groups withinthe population. Although the precorrection level ofdisparities may be more or less extreme than the sta-tistically defined postcorrection levels, the end pointof such corrections is exactly the single statisticallydefined level.
For these correctional changes to occur, decisionmakers must be participants in a competitive market.Even advocates of statistical discrimination explana-tions of racial disparities in care acknowledge thathealthcare is not a good example of a competitivemarket (Balsa and McGuire 2003, pp. 95–96). For anycompetition in healthcare to change physician carevia correctional changes in statistical discrimination,physicians must experience some costs when treatingpatients in a manner that is not statistically justi-fied. These costs could derive from the misdirectionof scarce or expensive resources, negative patient out-comes, reputational costs, loss of patients to other(more statistically appropriate) physicians, or othercosts from treatment behaviors deviating from statisti-cal optima. These costs affect both the variance-basedand means-based forms of statistical discriminationin similar ways and with similar implications for thepurposes of this study.
If such changes occur at all, correctional changesrequire interaction over time with other informedactors in the competitive market. Even if such cor-rectional changes can occur, they are unlikely toexplain changes in the behavior of medical studentsbetween their first and second years of medicalschool. These students cannot be considered marketparticipants. Their limited observations of clinicalencounters rarely involve any repeated encounterswith the same patients. As a result, first and sec-ond year medical students do not directly observeor experience the kind of feedback required by thecorrectional change processes. Changes in disparitiesexhibited by medical students between their first andsecond years are unlikely to be explained by correc-tional changes under statistical discrimination.
Population Changes. Racial associations with themeans and variances of hard-to-observe character-istics may exist and may also change over time.
Any such changes would likely be very gradual.The chance that population change processes explainchanges in disparities from statistical discriminationbetween the first and second years of medical schoolis exceedingly low. This chance approaches zero if theobserved changes are consistent across cohorts in anoncontemporaneous multicohort study.
Information Changes. The process of informationchanges has slightly different implications for means-based and variance-based statistical discrimination inour setting. For means-based statistical discrimina-tion, information changes should yield changes indisparities. An important purpose of medical educa-tion is to train students to be effective caregivers. Itis reasonable to hope that medical schools improvemedical students’ abilities to detect and identify hard-to-observe patient characteristics that are diagnosti-cally relevant to the patient’s health. If such changesdo take place during medical training, then medi-cal students should have greater access to hard-to-observe characteristics with greater training. This isidentical to having more hard-to-observe informa-tion. As a result, net of those hard-to-observe char-acteristics, characteristics like race should have lessof an association with care outcomes. In our spe-cific setting of performance in standardized patientencounters, these hard-to-observe characteristics rele-vant to health and diagnosis are held constant acrossrace-varying standardized patients within each clin-ical case, and thus the effects of these characteris-tics are already accounted for by design. Throughthe information changes process, means-based statis-tical discrimination predicts that disparities should bereduced between the first and second years of medicaltraining.
For variance-based statistical discrimination, theinformation process may or may not yield changesin disparities in our setting. In variance-based sta-tistical discrimination, disparities come from race-specific differences in the variance of the healthsignals generated by patients. Given our use of stan-dardized patient encounters to measure disparities,it is unlikely disparities from variance-based statis-tical discrimination would be present at all. The SPtraining process ensures the SPs provide the med-ical students the same clinical information in thesame manner regardless of SP race. The fact that themedical students are aware that they are interact-ing with actors trained to present scripted symptomsand responses to physician questions further reducesany possible expectations of race-associated noise inthese signals. (It is worth reiterating that any physi-cian differences in expectations about or interpreta-tions of patient signals is a perceptual error that isinconsistent with the definition of statistical discrim-ination. Statistical discrimination is about the correct

Rubineau and Kang: Bias in White: Measuring Changes in DiscriminationManagement Science 58(4), pp. 660–677, © 2012 INFORMS 667
and true properties of the groups themselves, not howthose properties may be differently perceived or inter-preted.) Therefore, based on the characteristics of ourresearch setting, variance-based statistical discrimina-tion is unlikely to be present in either the first or sec-ond year, and thus, unlikely to change. If, for someother reason, there were variance-based statistical dis-crimination in this setting, disparities would be likelyto decrease between the first and second years ofmedical training for reasons similar to the decreasespredicted by the means-based variant of statisticaldiscrimination. Better trained students should becomebetter at eliciting health signals from their patients,and not be as subject to the “natural” variances ofdifferent groups in generating health signals. So theinformation change process would predict either nochange or a reduction in disparities between the firstand second years of medical school.
Implications. Considering the three processes bywhich statistical discrimination (in both its means-based and variance-based forms) would predictchanges in disparities (correctional, population, andinformation), there should be either no change or adecrease in the disparities measured via SP encountersfrom the first to the second year of medical school.As a corollary, if we were to observe any significantincrease in disparities between the first and second yearsof medical school, this increase cannot be due to statisticaldiscrimination.
Methods and DataEmpirical SettingThe Weill Cornell Medical College (WCMC) curricu-lum has each individual medical student completetwo similarly structured standardized patient caseencounters during their first two years of medicalschool. The first year case involves students takingthe medical history (Hx) of the SPs, and the secondyear case involves both a medical history and phys-ical exam (HxPE).4 Both the first and second yearcases were designed such that there is no medical rea-son for differential treatment based on patient’s race.The class size at WCMC is usually a little more than100 students.
4 The first year Hx case and the second year HxPE case are com-parable for the history-taking component present in both cases.To ensure valid comparisons in our analysis, we use only thoseoutcomes from the cases for which the same sets of behaviorsare evaluated in both settings: the history itself and the patient–physician interaction behaviors. We also include the overall subjec-tive rating of patient satisfaction, because it has been seen as animportant part of racial disparities in care (see Institute of Medicine2003, pp. 574–575; van Ryn 2002, p. I-146). WCMC provided theseoutcome measures. As discussed below, we also coded one cohort’sencounter videos to address validity concerns.
First and second year medical students at WCMCobserve physicians performing outpatient care forseveral hours once every two weeks. First-handstudent experiences with actual clinical encoun-ters and outcomes could conceivably affect studentbehaviors in a manner consistent with correctionalchanges under statistical discrimination. As discussedabove, correctional changes require participation inthe competitive market over time to observe andexperience the costs and benefits of statistically inap-propriate and appropriate care, respectively. The lowfrequency and duration of students’ clinical exposuresduring their first two years limits their exposureto individual patient follow-ups and their ability todetect the kinds of benefits and costs entailed bymore or less statistically appropriate care. Absentdirect experience with the (questionably; see Balsaand McGuire 2003, pp. 95–96) competitive healthcaremarket forces, there is no statistical basis for cor-rectional changes in clinical encounter behaviors bypatient race.
The data in this study were collected after cul-tural competency training became institutionalized asa requirement of medical education. At WCMC, cul-tural competency training takes place as a unit (in theform of several hours of lecture time) within one ofthe required first semester courses of the first year.After the successful completion of that unit, thereis no requirement for formalized follow-up or rein-forcement of cultural competency training during stu-dents’ remaining time at WCMC.
The first year WCMC students’ first SP caseencounters take place toward the end of the springsemester—well after they have all completed theircultural competency training. This temporal structureis a benefit to our research design. All SP case-encounter observations use students who have com-pleted the same school-required cultural competencytraining. Any effects of that training should be presentacross all observations.
Data SampleThis study uses data collected during the first andsecond year SP case encounters within the regularcurriculum at WCMC. Since 2006, WCMC has keptrecords of the specific student–SP pairings—a require-ment for our analyses. Our data come from threecohorts of students in WCMC’s M.D. program (theclasses of 2009–2011) with both first and second yearencounters taking place between 2006 and 2009.
For both the first and second year case encoun-ters, many SPs present an identical case to the entirecohort. For this reason, WCMC employs a varietyof actors of varying race/ethnicities to present eachcase. Actor schedules, and no characteristics relatedto the medical students, determine whether a partic-ular student sees a black or white SP. The structural

Rubineau and Kang: Bias in White: Measuring Changes in Discrimination668 Management Science 58(4), pp. 660–677, © 2012 INFORMS
Table 1 Observations by Cohort, Case, and Standardized Patient Raceand Available Cohort Demographic Characteristics
Class of Class of Class ofCase SP race 2009 2010 2011
Year 1: Hx White 81 90 85Black 14 8 18
Year 2: HxPE White 86 91 63Black 5 9 37
Cohort demographicsPercent female (%) 48 39 52Percent black (%) NA NA 14Percent white (%) NA NA 65
independence between student characteristics and SPrace provides the serendipitous randomization under-lying this natural experiment. We compare the stu-dent behaviors when interacting with black SPs tothose when interacting with white SPs. We excludecases where there were no SP race data, where the SPwas neither black nor white,5 or where the encounterwas a repeat of one already performed by the student(as is sometimes requested either by the student or themedical school). These constraints yield 582 SP caseencounters for our analysis. Table 1 details the num-ber of observations obtained from each cohort andcase used in this analysis. Forty-six actors (38 whiteand 8 black) presented the first and second year casesto the three medical student cohorts studied.
Based on the data from these SP encounters, wepresent two sets of analyses. The first set of analy-ses uses all three cohorts and the data provided byWCMC. The findings from these initial analyses areconfirmed in a second set of analyses performed onone cohort (the class of 2011) based on the resultsof independent coders who coded video recordingsof the encounters. The latter set of analyses addresssome of the design and data limitations otherwisepresent in the study.
A descriptive study using these data documentedthe increasing disparity trends for race, and a decreas-ing disparity trend for age in two of three gradedencounter outcomes (Rubineau et al. 2011), but didnot examine the underlying mechanisms for thesetrends. The current study presents a more thoroughanalysis of the potential role of statistical discrimina-tion as a mechanism underlying the observed trends,in part by augmenting the data with measures codedfrom video recordings of the SP encounters.
5 The actors hired as standardized patients self-identified the racialcategories they can portray in their acting roles. Very few stan-dardized patients identified as being neither white nor black. Werepeated our analyses with these excluded SPs grouped with theblack SPs (white/nonwhite) and with these excluded SPs groupedwith the white SPs (black/nonblack). We found no differences indirection or statistical significance of our results in these variations.
Three-Cohort Analysis Dependent Variables:Standardized Patient Encounter OutcomesFollowing each standardized patient case encounter,the medical student’s performance was evaluated bythe SP against a checklist of objective behaviors andactions. In addition, SPs were asked to rate subjec-tively the medical student’s performance in termsof their satisfaction as a patient. We use three out-come measures common to the two cases used forfirst and second year medical students. These out-come measures are as follows:
History. Did the medical student ask all thequestions necessary to assess the patient’s completemedical history? This measure is the percentage ofquestions asked from a checklist of approximately60 questions. Examples include that for every symp-tom the patient names, the medical student is sup-posed to ask about that symptom’s severity, the timeof day when it tended to occur, and the impact thesymptom had upon the patient’s life, among others.An example of this checklist is given in the appendix.
Patient–Physician Interaction (PPI). Did the medicalstudent enact the 14 behaviors emphasized in studenttraining and shown to support a successful clinicalencounter (e.g., introducing herself by name, callingthe patient by name, maintaining eye contact)? Thismeasure is the percentage of behaviors noticed bythe SP from a checklist of established behaviors.6 Thechecklist appears in the appendix.7
Patient Satisfaction. A two-item subjective evalua-tion by the SP of whether she or he would return tothe medical student for care and whether he or shewould recommend the medical student to a friendor family member seeking care. Both questions usea five-item Likert-type scale. These are coded 0–4,summed, and divided by 8 for an outcome that rangesfrom 0 to 1 in one-eighth increments.
Video Coding Analysis Dependent Variables: Non-verbal Behaviors and Demeanor. The outcomes pro-vided by WCMC for the two types of cases werethe students’ item scores from their entire encoun-ters. In the first year, the history-only encounters weretypically 20 minutes long, whereas in the second year,the history-plus-physical exam encounters were about
6 The patient–physician encounter is a highly institutionalized com-ponent of the caregiving process (Heritage and Maynard 2006,p. 363) and is studied extensively for behaviors associated withimproved medical outcomes (see a brief review in Heritage andMaynard 2006, p. 365; specific examples in Smith 2003).7 The response options on the PPI checklist for the second yearcase for the 2011 cohort were altered from binary yes/no to a four-item (1–4) Likert-type option. The same 14 items in the appendixappeared on all checklists. We test for effects from this scoringchange using the methods discussed below, including adding a newdummy variable PPIChange (equal to 1 for a second year case forthe 2011 cohort and 0 otherwise).
Rubineau and Kang: Bias in White: Measuring Changes in DiscriminationManagement Science 58(4), pp. 660–677, © 2012 INFORMS 669
an hour long. Even though we use comparable out-come measures for the two cases, the differences inthe cases themselves and the amount of time the stu-dents had to demonstrate the evaluated behaviors areproblematic confounders for our analysis. To addressthese and other design and data concerns of the study,we also analyze results from an independent codingof video recordings of the class of 2011’s SP encoun-ters from their first and second years.
Twelve coders, naïve to the study’s research ques-tion, were trained to code only the history-taking por-tion of video recordings of the SP case encountersfor both the first and second year case encounters—both approximately 20 minutes long. Each video wascoded by an average of three coders.8 Coders werescheduled so they would not code videos from thesame medical student more than once.
Because we could not use the same checklists asthe above analysis (which are based on the com-plete encounter), coding focused on nonverbal behav-iors and demeanor shown by previous scholarship tobe associated with expressions of racial bias and/orempathy in social interactions. These items includesmiling and leaning toward the SP (McConnell andLeibold 2001, p. 440), and a set of positive adjectivesdescribing the medical student’s apparent demeanor:likeable, warm, friendly, and pleasant (Richeson andShelton 2005).9 Each item was scored using seven-item Likert-type response options. The exact codinginstrument wording is provided in the appendix.
Confirmatory factor analysis showed the two non-verbal behaviors to be unique and the four demeanoradjectives loading onto a single factor, allowing themto be averaged into a single positive demeanorindex (Cronbach’s alpha, 0.92). Interrater reliability(ICC421 k5 (Shrout and Fleiss 1979), because we usethe average of the coders’ ratings) for these threeitems was large and strongly significant (smiling, 0.75;leaning, 0.73; positive demeanor, 0.75). We reversecoded each of these items so their 1 to 7 range cor-responded to “never occurred” to “always occurred,”respectively.
Independent Variables and Controls: Case, Actor,and Student Cohort Characteristics.
Case Characteristics. The first and second year en-counters use different clinical cases. The first year has
8 Coders self-identified their racial categories. Five self-identifiedas Asian, three as white, two as Hispanic or Latino/Latina, oneas black, and one as other. We scheduled coders so no video wascoded solely by white coders.9 The original instrument included other behaviors and adjectivesthat were excluded because the medical students either always(e.g., eye contact) or never (e.g., crossed arms) exhibited them.Details about the full set of items from this instrument are availableby request.
a shorter encounter, where the standardized patient’schief complaint is that of abdominal pain, and themedical students take a complete history of thepatient but do not perform a physical examination.The second year has a longer encounter, where thestandardized patient’s chief complaint is that of achronic cough, and the medical students conduct acomplete history and physical examination. We usea dummy variable for year of medical school (Year;0 for the first year and 1 for the second year) in ouranalysis. This dummy variable allows us to test foryear-specific associations with the outcome variables,whether such associations arise from observable orunobservable year characteristics. Because the yearvariable is identical to a dummy variable for the caseof medical SP encounter (the Hx or the HxPE case), italso controls for any case-specific effects on the meansof the outcomes. The Year variable serves as the basisfor our interaction term—the focus of our analysis.
Actor Characteristics. The race of the standardizedpatient is central to our analysis. Because we haverestricted our analysis to black and white standard-ized patients, a single binary variable (SPWhite; 0 forblack SPs and 1 for white SPs) codes standardizedpatient race. In addition to actor race, we have dataon actor sex (SPFemale), age (SPAge), and experienceas an SP (SPExperience) as measured by the count ofencounters they had performed at the time of theencounter. This latter set of actor characteristic vari-ables serve as controls for actor effects in some of ourestimation models. In other estimation models, weperform a fixed-effects analysis that essentially cre-ates a dummy variable for the standardized patientsto control for all standardized patient characteristics,whether observed or unobserved.10
The key variable of interest is the interaction be-tween year of medical school training (Year) and stan-dardized patient race (SPWhite). This interaction term(SPWhite × Year) measures the degree to which theeffect of standardized patient race changes betweenthe first and second years of medical school. Givenour definition of the case and SPWhite variables, asignificant and positive coefficient for our interactionterm would indicate a significant increase (decrease)in the outcomes of second year students when inter-acting with white (black) patients relative to thefirst year outcomes. Similarly, a significant and nega-tive coefficient would indicate a significant decrease(increase) in the outcomes of second year studentswhen interacting with white (black) patients. Such aneffect could indicate the growth or diminishment of
10 In the fixed-effect models, the SP race dummy, SPWhite, is nec-essarily omitted. This omission does not affect the identification ofthe key interaction term.

Rubineau and Kang: Bias in White: Measuring Changes in Discrimination670 Management Science 58(4), pp. 660–677, © 2012 INFORMS
disparities in outcomes between the first and secondyears of medical school.
Student Cohort Characteristics. A dummy variable(Cohort) for the three medical school cohorts controlsfor any observable or unobservable differences in thecohorts, such as effects of the composition of thecohort in terms of race, bias, or other characteristics.
Medical Student Characteristics. Student informationwas extremely limited in the extant data.11 Onlystudent sex was provided. Although the randomassignment of student to SP should obviate spuri-ous findings from student heterogeneity, we also testthis possibility directly in our analysis based on thecoded interaction videos. We used the class of 2011cohort videos to code medical student race to allow ananalysis of concordance (Cooper-Patrick et al. 1999).12
Because we have only black and white SPs in oursample, medical students were coded as black (14students), white (66 students), or other (21 students)for the purpose of analyzing the effects of concor-dance. The available student demographic informa-tion is summarized by cohort in the lower panel ofTable 1.
Student–Patient Concordance. Because sex and racemay interact in the production of disparities in patientcare (e.g., Schulman et al. 1999), we model concor-dance in a manner to account for this potential inter-action. There are four possible gender pairings ofmedical students and SPs. We model this using threebinary indicator variables: SPFemale, StudentFemale,and BothFemale. For racial concordance, because somemedical students are coded as neither black nor white,we include the following five binary indicator vari-ables: SPWhite, StudentWhite, StudentBlack, BothWhite,and BothBlack. Finally, to allow for interactions in thesex and race concordance effects, we add a Match-SexAndRace variable that is 1 when the student and SPmatch on both sex and race dimensions and 0 other-wise. We also include SP age and experience as before.Because we can analyze concordance effects in ourclass of 2011 cohort for any of our dependent vari-ables, we also perform a supplemental analysis of thehistory, PPI, and patient satisfaction outcomes withthis same model as a robustness check.
11 From schoolwide demographic data published by WCMC, weknow WCMC had a significantly larger composition of blackmedical students (10%–12%) than contemporaneous national aver-ages (7%), but a composition of white students (60%–64%) sim-ilar to contemporaneous national averages (61%–63%). Similarschoolwide statistics show WCMC as having a composition ofwomen (48%–50%) comparable to contemporaneous national aver-ages (48%–49%).12 To keep the 12 video coders naïve to our research question, othervideo coders performed the sex and race coding of the medicalstudents from the videos.
Estimation StrategyWe estimate changes in racial disparities in carebetween the first and second years of medical schoolusing linear regression and linear regression withfixed effects. The main advantage of the regressionapproach to estimating trends in disparities is theability to control for idiosyncratic effects from dif-ferent SPs, different cases, different medical schoolcohorts, gender concordance between the SP and themedical student, and, for the one cohort with codedvideos, racial concordance. Estimating effects withincohort obviates any cohort-specific effects, and ran-domization to exposure takes care of most of the con-cerns regarding individual differences among medicalschool students. The fixed-effects analysis is the mostconservative way to control for SP heterogeneity andidiosyncratic ratings.
The conservative nature of the fixed-effects anal-ysis means that estimates of some actual effects arepotentially attenuated by the many dummy vari-ables used to represent the 46 SPs. As the numberof groups in a fixed-effects analysis grows, estimatesmay become inconsistent (Nickell 1981). We also per-form a simpler regression using the actor-level con-trols described above.
A stylized version of the general regression modelwe use is as follows: Outcome = Year + SPWhite ×
Year + [Cohort] + [SP controls] + [Student controls] +
[Concordances]. The Cohort dummies are included foranalyses of the three cohorts, but not for the singlecohort. The SP controls include SPExperience (presentin all models), SPWhite, SPAge, and SPFemale, or SPfixed effects. Student controls include StudentFemale(in all models) and, for the class of 2011 cohort,StudentBlack and StudentWhite. Concordances includeBothFemale (in all models) and, for the class of 2011cohort, BothBlack, BothWhite, and MatchSexAndRace.When the outcome is the patient–physician interac-tion score, we include a PPIChange dummy variablefor the second year encounter of the class of 2011to control for the changing in the scoring for thatencounter.
Again, the key variable of interest for our study isthe interaction term WhiteSP×Year. A significant pos-itive (negative) coefficient for that variable indicatesthat the effect of the race of the SP on the outcomevariable increases (decreases) between the first andsecond years, that is, a significant increase (decrease)in racial disparities in care as measured by Outcome.A significant positive coefficient on this term wouldreveal a significant increase in disparities inconsistentwith statistical discrimination.
ResultsTable 2 provides the counts, mean scores, and stan-dard deviations for all the six outcomes (three gradedencounter outcomes and three video coding out-

Rubineau and Kang: Bias in White: Measuring Changes in DiscriminationManagement Science 58(4), pp. 660–677, © 2012 INFORMS 671
Table 2 Counts, Means, and Standard Deviations for SP Encounter Outcomes by Year and SP Race
White SP Black SP Difference (white–black)
N Mean (SD) N Mean (SD) ã (SE) Significant increase?
Graded encounter outcomes from all three cohortsHistory
First year 256 0077 (0.14) 40 0079 (0.12) −0002 (0.02) nsSecond year 240 0084 (0.13) 51 0085 (0.09) −0001 (0.02)
Patient satisfactionFirst year 256 0081 (0.20) 40 0080 (0.15) 0001 (0.03) ∗ ∗ ∗
Second year 240 0080 (0.22) 51 0065 (0.20) 0015 (0.03)Patient–physician interaction
First year 256 0085 (0.13) 40 0087 (0.10) −0002 (0.02) ∗ ∗ ∗
Second year 240 0084 (0.13) 51 0072 (0.14) 0013 (0.02)
Coded encounter videos of the class of 2011 cohortLeans toward SP
First year 83 3055 (1.37) 18 3062 (1.31) −0008 (0.35) ∗
Second year 62 4083 (1.59) 37 4011 (1.49) 0072 (0.32)Smiling
First year 83 3005 (1.03) 18 3025 (1.23) −0021 (0.28) ∗
Second year 62 3042 (1.08) 37 3005 (1.12) 0037 (0.22)Positive demeanor
First year 83 4070 (1.02) 18 4091 (0.94) −0021 (0.26) ∗∗
Second year 62 5019 (0.87) 37 4082 (0.79) 0037 (0.17)
Notes. The top panel reports the graded outcomes provided by WCMC for all three medical student cohorts. The bottom panel reports outcomes from the videocoding of the class of 2011 cohort encounters. White–black differences in outcomes by year are given in the “Difference” column, along with the significanceresults of a t-test (based on the pooled standard errors of the differences) testing whether the second year white–black difference is an increase relative to thefirst year white–black difference for each outcome. ns, not significant.
∗p < 0005; ∗∗p < 0001; ∗∗∗p < 00001 (two-tailed tests).
comes) by medical school year and the race of the SP.The “Difference” column in Table 2 provides the out-come means for white SPs minus those for the blackSPs for each year and the standard error for each dif-ference. The differences in these differences, dividedby their pooled standard errors, provide a t-statisticfor whether these differences are significantly differ-ent from each other. Five of six outcomes (all but his-tory taking) show significant increases in disparitiesbetween the first and second years of medical school.These increases challenge the statistical discriminationexplanation of racial disparities in care. In addition tothese means-based differences, our regression analysistests more rigorously whether disparities in medicalstudent behavior by the race of the patient increasesbetween the first and second years of medical school.
Table 3 presents estimated regression coefficientsfor both the SP controls and fixed-effects modelswith the available student controls and concordancevariables. The coefficient of the interaction termWhiteSP × Year estimates trends in disparities by year.We find no significant trend in disparities for History,but significant increasing trends in disparities for bothPatient Satisfaction (marginally significant in the fixed-effects model and strongly significant in the simplermodel) and PPI (strongly significant in both models).Both results again show that the effect of SP race issignificantly larger for second year medical students
than for first year medical students in the direction ofincreasing disparities.
Using these estimates, we calculated the predictedvalues for each of the three outcomes from first andsecond year medical students encountering white andblack standardized patients. The results are plotted inthe three panels in the left column of Figure 1—onepanel for each of the three outcomes. The lighter graylines reveal the first to second year trends in outcomesfrom encounters with white SPs, and the darker linesthe trends in outcomes from encounters with blackSPs. The top panel of Figure 1 illustrates these pre-dicted trends for the history outcome. Although thereis a general trend toward higher scores from the firstyear to the second, the lack of any difference in out-comes by SP race is apparent. The lower two panelslook very much like each other but very different fromthe top panel. The lower two panels show no outcomedifferences by SP race in the first year, but large dif-ferences appear in the second year. These differencescome from a significant decline in outcomes for sec-ond year medical students interacting with black SPs.
Examining the nonverbal outcomes derived fromindependently coded videos of the SP encounters forthe class of 2011 cohort, we find evidence of the sameincrease in disparate behaviors. This analysis providesthree main improvements to supplement the three-cohort analysis above. First, this analysis controls for

Rubineau and Kang: Bias in White: Measuring Changes in Discrimination672 Management Science 58(4), pp. 660–677, © 2012 INFORMS
Table 3 Regressions Estimating Trends Between Training and Disparities in Care Across Three Medical Student Cohorts Using Both Linear SP Controlsand SP Fixed-Effects Models (46 SPs)
History Patient satisfaction PPIa
SP controls SP fixed effects SP controls SP fixed effects SP controls SP fixed effects
SPWhite×Year −00005 −00023 00123∗∗ 00107† 00112∗∗∗ 00101∗∗
4000295 4000385 4000475 4000595 4000295 4000365Year 00072∗∗ 00088∗
−00134∗∗−00126∗
−00130∗∗∗−001266∗∗∗
4000275 4000355 4000435 4000555 4000295 4000345SPWhite −00022 — 00001 — −00023 —
4000215 4000355 4000215SPFemale −00020 — −00018 — −00018 —
4000155 4000255 4000155
SPAge −00008† — −00009 — −00005 —(in days/3652.5) 4000045 4000075 4000045
SPExperience 00003 −00073 −00015 −00212 −00406∗−00232
(in encounters/1000) 4001755 4002485 4002825 4003885 4001835 4002825
Class of 2010 −00053∗∗∗−00040† −00004 00016 −00035∗
−000244000155 4000225 4000245 4000355 4000155 4000215
Class of 2011 −00061∗∗∗−00055∗∗
−00066∗∗−00023 −00130∗∗∗
−00106∗∗∗
4000145 4000225 4000235 4000355 4000175 4000235
StudentFemale −00025† −00029† 00029 00012 −00009 −000114000155 4000165 4000245 4000255 4000145 4000155
BothFemale 00037† 00041† 00010 00027 00033 00039†
4000225 4000235 4000355 4000365 4000215 4000215PPIChange — — — — 00026 00000
4000245 4000305Constant 00882∗∗∗ 00809∗∗∗ 00869∗∗∗ 00803∗∗∗ 00971∗∗∗ 00906∗∗∗
4000345 4000175 4000555 4000265 4000335 4000165
Notes. Standard errors appear in parentheses. Shaded results are for the key variable, SPWhite×Year. N = 582. Significant coefficients in bold.aThe PPI scores in this table were the scores provided by WCMC. To ensure our results are robust to the PPI scoring change in the second year encounter
for the class of 2011 cohort, we also converted the individual 14 item scores to binary scores by rounding prior to calculating the PPI. In each of the twomodels with this reconstructed PPI measure, the magnitude and significance of the SPWhite×Year variable increased.
†p < 0010; ∗p < 0005; ∗∗p < 0001; ∗∗∗p < 00001 (two-tailed tests).
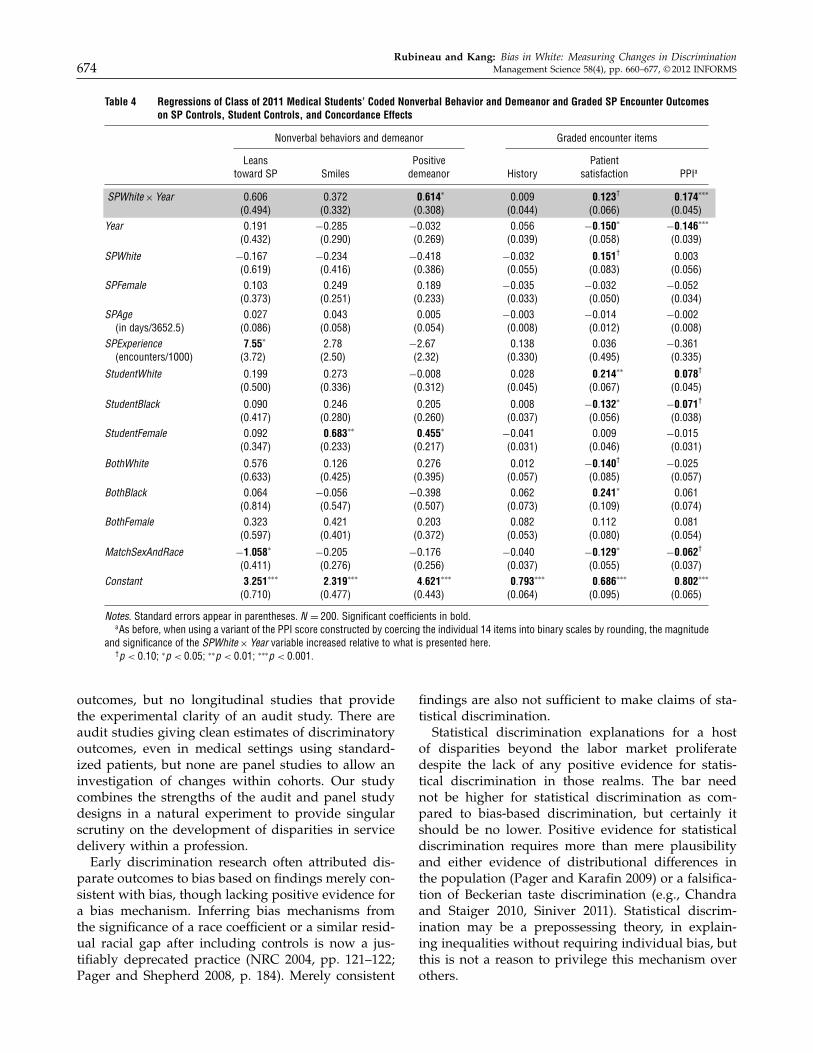
racial concordance effects between the SPs and themedical students, as well as the intersection of sexand race concordance. Second, this analysis uses out-comes based on the same initial 20-minute history-taking procedure that was common to both first andsecond year encounters (rather than scores based onbehavior over 20 minutes in the first year and overan hour in the second). Third, the outcome scores inthis analysis are based on the verifiably consistent rat-ings of a racially diverse team of independent judges,rather than the individual scores provided by the SPs.Table 4 reports the estimated coefficients for these out-comes. Although we do not find significant effectsfor all three outcomes, the WhiteSP × Year measure ofdisparity increase is significant for medical students’positive demeanor.
The three panels in the right column of Figure 1plot these models’ predicted outcomes. For all threeoutcomes, the slope of the change in medical stu-dent behavior when interacting with white SPs ispositive between their first and second years. Theslopes showing the change in medical student behav-ior when interacting with black SPs are always less
positive, and in two cases, negative. The patternis consistent across outcomes, and the differencesbetween the two slopes reaches significance for one ofthe three outcomes: medical students’ apparent pos-itive demeanor. The same pattern of increasing dis-parities in the graded encounter outcomes is evidentin the demeanor of medical students as coded bya team of racially diverse judges based only on theinitial 20-minute history-taking component of the SPencounters.
Because this class of 2011 analysis allows a moredetailed examination of concordance effects than wasavailable from our three-cohort analysis, we testwhether our findings from the three-cohort analysisare attributable to racial concordance by repeating theanalysis for the three graded encounter outcomes pro-vided by WCMC. The three rightmost columns ofTable 4 present our estimates. As before, the key vari-able, WhiteSP × Year, is positive and strongly signif-icant for the PPI outcome, marginally significant forthe Patient Satisfaction outcome, and not significantfor the History outcome. Consistent with previousresearch (e.g., Cooper et al. 2003, Cooper-Patrick et al.

Rubineau and Kang: Bias in White: Measuring Changes in DiscriminationManagement Science 58(4), pp. 660–677, © 2012 INFORMS 673
Figure 1 Predicted (from Fixed-Effects Models in Table 3) SP Encounter Outcomes by Medical School Year and SP Race, Based on Data fromAll Three Cohorts and Using Identical y-Axis Ranges (Left Column), and Predicted (from Models in Table 4) Nonverbal Behavior andDemeanor Outcomes Plotted Similarly for the Class of 2011 Cohort and Using 1.5-Unit Ranges of the 1 to 7 Valued Variables for they-Axis (Right Column)
3.50
3.75
4.00
4.25
4.50
4.75
5.00
1 2
2.25
2.50
2.75
3.00
3.25
3.50
3.75
1 2
Smiles
4.00
4.25
4.50
4.75
5.00
5.25
5.50
1 2
Positive demeanor
65
70
75
80
85
90
1 2
History
65
70
75
80
85
90
1 2
Patient satisfaction
65
(%)
(%)
(%)
70
75
80
85
90
1 2
Black
White
Leans toward patient
Patient–physician interaction
1999, LaViest and Nuru-Jeter 2002), black patients doreport higher satisfaction when interacting with blackphysicians. Also consistent with previous scholarship(e.g., Schnittker and Liang 2006), these concordanceeffects do not explain the disparate outcomes. Despitethe presence of concordance effects, the increasingdisparities we find are neither attributable to nordiminished by concordance in sex, race, or the inter-action between the two.
Discussion and ConclusionConsistently and robustly, we find a measureable in-crease in the disparities exhibited by medical students
from their first to second years. The three change pro-cesses consistent with statistical discrimination pre-dict either no changes or reductions in disparitiesbetween the first and second years of medical school.Therefore, the observed growth in disparities likelyderives from sources other than statistical discrimina-tion. We do not claim that statistical discriminationis wholly absent among the mechanisms underlyingracial disparities in care. We simply point out thatbased on our evidence, it is unlikely to be the only oreven the primary form of discrimination generatingthese disparities.
This study has a unique research design. There havebeen longitudinal studies of changes in discriminatory
Rubineau and Kang: Bias in White: Measuring Changes in Discrimination674 Management Science 58(4), pp. 660–677, © 2012 INFORMS
Table 4 Regressions of Class of 2011 Medical Students’ Coded Nonverbal Behavior and Demeanor and Graded SP Encounter Outcomeson SP Controls, Student Controls, and Concordance Effects
Nonverbal behaviors and demeanor Graded encounter items
Leans Positive Patienttoward SP Smiles demeanor History satisfaction PPIa
SPWhite×Year 00606 00372 00614∗ 00009 00123† 00174∗∗∗
4004945 4003325 4003085 4000445 4000665 4000455Year 00191 −00285 −00032 00056 −00150∗
−00146∗∗∗
4004325 4002905 4002695 4000395 4000585 4000395
SPWhite −00167 −00234 −00418 −00032 00151† 000034006195 4004165 4003865 4000555 4000835 4000565
SPFemale 00103 00249 00189 −00035 −00032 −000524003735 4002515 4002335 4000335 4000505 4000345
SPAge 00027 00043 00005 −00003 −00014 −00002(in days/3652.5) 4000865 4000585 4000545 4000085 4000125 4000085
SPExperience 7055∗ 2078 −2067 00138 00036 −00361(encounters/1000) 430725 420505 420325 4003305 4004955 4003355
StudentWhite 00199 00273 −00008 00028 00214∗∗ 00078†
4005005 4003365 4003125 4000455 4000675 4000455
StudentBlack 00090 00246 00205 00008 −00132∗−00071†
4004175 4002805 4002605 4000375 4000565 4000385StudentFemale 00092 00683∗∗ 00455∗
−00041 00009 −000154003475 4002335 4002175 4000315 4000465 4000315
BothWhite 00576 00126 00276 00012 −00140† −000254006335 4004255 4003955 4000575 4000855 4000575
BothBlack 00064 −00056 −00398 00062 00241∗ 000614008145 4005475 4005075 4000735 4001095 4000745
BothFemale 00323 00421 00203 00082 00112 000814005975 4004015 4003725 4000535 4000805 4000545
MatchSexAndRace −10058∗−00205 −00176 −00040 −00129∗
−00062†
4004115 4002765 4002565 4000375 4000555 4000375Constant 30251∗∗∗ 20319∗∗∗ 40621∗∗∗ 00793∗∗∗ 00686∗∗∗ 00802∗∗∗
4007105 4004775 4004435 4000645 4000955 4000655
Notes. Standard errors appear in parentheses. N = 200. Significant coefficients in bold.aAs before, when using a variant of the PPI score constructed by coercing the individual 14 items into binary scales by rounding, the magnitude
and significance of the SPWhite×Year variable increased relative to what is presented here.†p < 0010; ∗p < 0005; ∗∗p < 0001; ∗∗∗p < 00001.
outcomes, but no longitudinal studies that providethe experimental clarity of an audit study. There areaudit studies giving clean estimates of discriminatoryoutcomes, even in medical settings using standard-ized patients, but none are panel studies to allow aninvestigation of changes within cohorts. Our studycombines the strengths of the audit and panel studydesigns in a natural experiment to provide singularscrutiny on the development of disparities in servicedelivery within a profession.
Early discrimination research often attributed dis-parate outcomes to bias based on findings merely con-sistent with bias, though lacking positive evidence fora bias mechanism. Inferring bias mechanisms fromthe significance of a race coefficient or a similar resid-ual racial gap after including controls is now a jus-tifiably deprecated practice (NRC 2004, pp. 121–122;Pager and Shepherd 2008, p. 184). Merely consistent
findings are also not sufficient to make claims of sta-tistical discrimination.
Statistical discrimination explanations for a hostof disparities beyond the labor market proliferatedespite the lack of any positive evidence for statis-tical discrimination in those realms. The bar neednot be higher for statistical discrimination as com-pared to bias-based discrimination, but certainly itshould be no lower. Positive evidence for statisticaldiscrimination requires more than mere plausibilityand either evidence of distributional differences inthe population (Pager and Karafin 2009) or a falsifica-tion of Beckerian taste discrimination (e.g., Chandraand Staiger 2010, Siniver 2011). Statistical discrim-ination may be a prepossessing theory, in explain-ing inequalities without requiring individual bias, butthis is not a reason to privilege this mechanism overothers.

Rubineau and Kang: Bias in White: Measuring Changes in DiscriminationManagement Science 58(4), pp. 660–677, © 2012 INFORMS 675
In this environment, where there are many can-didate mechanisms for the generation of disparitiesby professionals, eliminating one candidate mecha-nism from consideration represents useful progress.Our study has ruled out statistical discriminationfrom consideration as the primary mechanism gen-erating racial disparities in patient care. The signifi-cant changes in disparities we document by first andsecond year medical students are inconsistent withstatistical discrimination explanations. What explana-tions are consistent with our findings? Our findingsare consistent with at least two explanations, althoughwe cannot positively identify whether either of thesetwo mechanisms is present.
One explanation is that the disparities are basedon cognitive biases present among the medical stu-dents. These biases, whether explicit or implicit (e.g.,Green et al. 2007, Sabin et al. 2008), affect care (fora recent study challenging the claim that implicitbias affects care, see Haider et al. 2011) and are rel-atively stable (Cunningham et al. 2001), and do notchange between the first and second years. Rather,the observed increase in disparities results from somecharacteristic of the second year encounter that trig-gers the manifestation of bias—a characteristic that isabsent in the first year encounter.
A second explanation is that the disparities arebased on cognitive biases that do change between thefirst and second years of medical school. Because ofthe general stability of such biases, this explanationrequires that medical students learn or acquire thesebiases between the first and second years of medicalschool. How might such biases be learned? Althoughfirst-hand experiential learning through observingeffects of treatment decisions on longer-term patientoutcomes and behaviors is rare and unlikely forthese medical students, learning through observationof actual physician behaviors is not. Students canand likely do learn clinical encounter behaviors byobserving the behaviors of physicians during theseclinical exposures. Adopting behaviors learned fromother physicians could potentially result in changesthat affect disparities in care. Existing scholarship hasdocumented institutional-level mechanisms such associalization into a professional culture with normsand practices affecting patient care (e.g., Becker et al.1961, DelVecchio Good et al. 2003, Merton 1957).
Although we can confidently rule out statistical dis-crimination, our findings are merely consistent withthe other two explanations above. Additional care-ful research is needed to further support or eliminatethese or other mechanisms. One possible approachis to assess medical students’ cognitive biases, bothimplicit and explicit (e.g., Sabin et al. 2008), overtime as they progress through medical education.
Answering the question of whether disparities in ser-vice delivery to clients by professionals derive fromlearned behaviors acquired during professional train-ing or manifestations of existing biases is critical foraddressing the pervasive and enduring disparitiesaffecting many professions.
AcknowledgmentsThe authors are grateful to Latasha Boston, Anne Connolly,Alan Moses, Sangchan Park, Evan Polman, Michael Slade,Joon Woo Sohn, Carol Storey-Johnson, and Lynne Vincentfor assistance in making this study possible; to the mem-bers of Cornell’s CITRA seminar, Carla Boutin-Foster, andMarty Wells for discussions and feedback as the researchwas being planned and conducted; and to Marya Besharov,Diane Burton, Emilio Castilla, Glen Dowell, Robin Ely,Roberto Fernandez, Olga Khessina, Jason Schnittker, TonySimons, Jesper Sørensen, Ezra Zuckerman, participantsof the ASQ Gender and Race in Organizations Workshop,and the anonymous reviewers. The authors are also grate-ful to the Cornell University Institute for Social Sciences fora generous grant supporting this study. All errors are theauthors’ responsibility.
Appendix. Outcome Measure Instruments
History TopicsAn abbreviated listing is provided here. The full instrumentis available upon request.
A. About any symptom I am having (history of presentillness)—7 questions for each symptom
B. Past medical problems—6 questionsC. Past surgical problems—4 questionsD. Medications—4 questionsE. Allergies—2 questionsF. Social and occupational history—7 questionsG. Family history—5 questionsH. Sexual history—7 questionsI. Review of systems—14 questionsJ. OB/GYN history (female only)—7 questions
Patient Physician InteractionDuring the encounter, the student did the following (selectYes or No):
1. Greeted me, introduced himself/herself2. Called me by name3 Used appropriate eye contact4. Showed interest/respect for me throughout the inter-
view (open body language, listened carefully, appropriatefacial expressions and tone of voice)
5. Used language that I could understand (avoided tech-nical terms)
6. Started with open-ended questions7. Progressed with specific questions8. Avoided presumptive/leading questions9. Allowed me to speak without interruption10. Checked to make sure that he/she understood what
I was saying11. Was organized in the order that he/she asked me
questions12. Summarized the information that he/she gathered13. Checked to make sure that I understood what he/she
was saying

Rubineau and Kang: Bias in White: Measuring Changes in Discrimination676 Management Science 58(4), pp. 660–677, © 2012 INFORMS
14. Closed the encounter by telling me his/her initialimpression of what was going on and described whathe/she thought needed to be done
Patient SatisfactionBased on your interaction with the student, please select thebest response:
1. I would come back to see this student doctor {defi-nitely not, probably not, might, probably would, definitelywould}
2. I would recommend this student doctor to a relative orfriend {definitely not, probably not, might, probably would,definitely would}
Nonverbal/Demanor Coding ItemsFor each of the following, score on a 1–7 scale (1 = all thetime, 4 = about half the time, 7 = never).
1. How frequently did the medical student lean towardthe patient?
2. How frequently did the medical student smile duringthe interaction?
For each of the following qualities, rate the degree towhich the medical student appeared to exhibit these qual-ities during their interaction with the patient. Medicalstudent seemed (1–7; 1 = extremely, 4 = somewhat, 7 = notat all):
3. Likeable4. Warm5. Friendly6. Pleasant
ReferencesAgency for Healthcare Research and Quality. 2008. 2007 national
healthcare disparities report. Agency for Healthcare Researchand Quality, Rockville, MD.
Aigner, D. J., G. G. Cain. 1977. Statistical theory of discriminationin labor markets. Indust. Labor Relations Rev. 30(2) 175–187.
Altonji, J. G., C. R. Pierret. 2001. Employer learning and statisticaldiscrimination. Quart. J. Econom. 116(1) 313–350.
Arrow, K. J. 1972. Some mathematical models of race discriminationin the labor market. A. H. Pascal, D. C. Heath, ed. Racial Dis-crimination in Economic Life. Lexington Books, Lexington, MA,187–204.
Ayres, I., P. Siegelman. 1995. Race and gender discrimination inbargaining for a new car. Amer. Econom. Rev. 85(3) 304–321.
Balsa, A. I., T. G. McGuire. 2001. Statistical discrimination in healthcare. J. Health Econom. 20(6) 881–907.
Balsa, A. I., T. G. McGuire. 2003. Prejudice, clinical uncertainty andstereotyping as sources of health disparities. J. Health Econom.22(1) 89–116.
Barrows, H. S. 1971. Simulated Patients (Programmed Patients): TheDevelopment and Use of a New Technique in Medical Education.Charles C. Thomas, Springfield, IL.
Barrows, H. S. 1993. An overview of the uses of standardizedpatients for teaching and evaluating clinical skills. AcademicMedicine 68(6) 443–453.
Baumle, A. K., M. Fossett. 2005. Statistical discrimination inemployment: Its practice, conceptualization, and implicationsfor public policy. Amer. Behavioral Scientist 48(9) 1250–1274.
Beach, M. C., M. Rosner, L. A. Cooper, P. S. Duggan, J. Shatzer.2007. Can patient-centered attitudes reduce racial and ethnicdisparities in care? Academic Medicine 82 193–198.
Becker, G. S. 1971. The Economics of Discrimination, 2nd ed. ChicagoUniversity Press, Chicago.
Becker, H. S., B. Geer, A. L. Strauss, E. C. Hughes. 1961. Boys inWhite: Student Culture in Medical School. University of ChicagoPress, Chicago.
Bertrand, M., S. Mullainathan. 2004. Are Emily and Greg moreemployable than Lakisha and Jamal? A field experiment onlabor market discrimination. Amer. Econom. Rev. 94(4) 991–1013.
Betancourt, J. R. 2006. Eliminating racial and ethnic disparities inhealth care: What is the role of academic medicine? AcademicMedicine 81(9) 788–792.
Chandra, A., D. O. Staiger. 2010. Identifying provider prejudice inhealthcare. Working Paper 16382, National Bureau of EconomicResearch, Cambridge, MA.
Chen, J., S. S. Rathore, M. J. Radford, Y. Wang, H. M. Krumholz.2001. Racial differences in the use of cardiac catheterizationafter acute myocardial infarction. New England J. Medicine344(19) 1443–1449.
Chin, M. H., C. A. Humikowski. 2002. When is risk stratification byrace or ethnicity justified in medical care? Academic Medicine77(3) 202–208.
Colliver, J. A., M. H. Swartz, R. S. Robbs. 2001. The effect of exami-nee and patient ethnicity in clinical-skills assessment with stan-dardized patients. Adv. Health Sci. Ed. 6(1) 5–13.
Cooke, M., D. M. Irby, W. Sullivan, K. M. Ludmerer. 2006. Ameri-can medical education 100 years after the Flexner report. NewEngland J. Medicine 355(13) 1339–1344.
Cooper, L. A., D. L. Roter, R. L. Johnson, D. E. Ford, D. M.Steinwachs, N. R. Powe. 2003. Patient-centered communica-tion, ratings of care, and concordance of patient and physicianrace. Ann. Internal Medicine 139(11) 907–915.
Cooper-Patrick, L., J. J. Gallo, J. J. Gonzales, H. T. Vu, N. R. Powe,C. Nelson, D. E. Ford. 1999. Race, gender, and partnership inthe patient-physician relationship. J. Amer. Medical Assoc. 282(6)583–589.
Correll, S. J., S. Benard. 2006. Biased estimators? Comparing sta-tus and statistical theories of gender discrimination. Soc. Psych.Workplace 23(1) 89–116.
Cunningham, W. A., K. J. Preacher, M. R. Banaji. 2001. Implicit atti-tude measures: Consistency, stability, and convergent validity.Psych. Sci. 12(2) 163–170.
DelVecchio Good, M. J., C. James, B. J. Good, A. E. Becker. 2003. Theculture of medicine and racial, ethnic, and class disparities inhealthcare. B. D. Smedley, A. Y. Stith, A. R. Nelson. eds. UnequalTreatment: Confronting Racial and Ethnic Disparities in Health Care.National Academies Press, Washington, DC, 594–625.
Devi, S. 2008. U.S. health care still failing ethnic minorities. Lancet371(9628) 1903–1904.
England, P. 1994. Neoclassical economists’ theories of discrimi-nation. P. Burnstein, ed. Equal Employment Opportunity: LaborMarket Discrimination and Public Policy. Aldine de Gruyter,Hawthorne, NY, 59–69.
Fennell, M. L. 2005. Racial disparities in care: Looking beyond theclinical encounter. Health Services Res. 40(6) 1713–1721.
Fix, M., M. A. Turner, eds. 1998. A National Report Card on Discrim-ination in America: The Role of Testing. Urban Institute Press,Washington, DC.
Green, A. R., D. R. Carney, D. J. Pallin, L. H. Ngo, K. L. Raymond,L. Iezzoni, M. R. Banaji. 2007. Implicit bias among physiciansand its prediction of thrombolysis decisions for black andwhite patients. J. General Internal Medicine 22(9) 1231–1238.
Gross, C. P., B. D. Smith, E. Wolf, M. Andersen. 2008. Racial dispar-ities in cancer therapy: Did the gap narrow between 1992 and2002? Cancer 112(4) 900–908.
Haider, A. H., J. Sexton, N. Sriram, L. A. Cooper, D. T. Efron,S. Swoboda, C. V. Villegas, et al. 2011. Association of uncon-scious race and social class bias with vignette-based clinicalassessments by medical students. J. Amer. Medical Assoc. 306(9)942–951.
Heckman, J. J., P. Siegelman. 1993. The urban institute audit studies:Their methods and findings: Response to comments by JohnYinger. M. Fix, R. J. Struyk, eds. Clear and Convincing Evidence:Measurement of Discrimination in America. Urban Institute Press,Washington, DC, 271–275.
Heritage, J., D. W. Maynard. 2006. Problems and prospects in thestudy of physician-patient interaction: 30 years of research.Annual Rev. Sociol. 32 351–374.

Rubineau and Kang: Bias in White: Measuring Changes in DiscriminationManagement Science 58(4), pp. 660–677, © 2012 INFORMS 677
Institute of Medicine. 2003. Unequal Treatment: Confronting Racialand Ethnic Disparities in Health Care. National Academies Press,Washington, DC.
Klonoff, E. A. 2009. Disparities in the provision of medical care:An outcome in search of an explanation. J. Behavioral Medicine32(1) 48–63.
Knowles, J., N. Persico, P. Todd. 2001. Racial bias in motor vehi-cle searches: Theory and evidence. J. Political Econom. 109(1)203–229.
Ladd, H. F. 1998. Evidence on discrimination in mortgage lending.J. Econom. Perspectives. 12(2) 41–62.
LaVeist, T. A., A. Nuru-Jeter. 2002. Is doctor-patient race concor-dance associated with greater satisfaction with care? J. HealthSoc. Behav. 43(3) 296–306.
Lee, J. 2000. The salience of race in everyday life: Black customers’shopping experiences in black and white neighborhoods. Workand Occupations 27(3) 353–376.
Liaison Committee on Medical Education. 2008. Functions and Struc-ture of a Medical School: Standards for Accreditation of Med-ical Education Programs Leading to the M.D. Degree. LCMESecretariat Association of American Medical Colleges, Wash-ington, DC.
Lutfey, K. E., J. D. Ketcham. 2005. Patient and provider assessmentsof adherence and the sources of disparities: Evidence from dia-betes care. Health Services Res. 40(1) 2–25.
McConnell, A. R., J. M. Leibold. 2001. Relations among the implicitassociation test, discriminatory behavior, and explicit measuresof racial attitudes. J. Experiment. Soc. Psych. 37 435–442.
McGuire, T. G., J. Z. Ayanian, D. E. Ford, R. E. M. Henke, K. M.Rost, A. M. Zaslavsky. 2008. Testing for statistical discrimina-tion by race/ethnicity in panel data for depression treatmentin primary care. Health Services Res. 43(2) 531–551.
Merton, R. K. 1957. Some preliminaries to a sociology of medicaleducation. R. K. Merton, G. G. Reader, P. L. Kendall, ed. TheStudent Physician: Introductory Studies in the Sociology of MedicalEducation. Harvard University Press, Cambridge, MA, 3–79.
Merton, R. K. 1987. Three fragments from a sociologist’s notebooks:Establishing the phenomenon, specified ignorance, and strate-gic research materials. Annual Rev. Sociol. 13 1–29.
Mizrahi, T. 1986. Getting Rid of Patients. Rutgers University Press,New Brunswick, NJ.
National Partnership for Action. 2010. Changing Outcomes—Achieving Health Equity, The National Plan for Action. NationalPartnership for Action (NPA) to End Health Disparities,Office of Minority Health, U.S. Department of Health andHuman Services. http://www.minorityhealth.hhs.gov/npa/images/plan/nationalplan.pdf.
National Research Council (NRC). 2004. Measuring Racial Discrimi-nation. National Academies Press, Washington, DC.
Neumark, D., R. J. Bank, K. D. Van Nort. 1996. Sex discriminationin restaurant hiring: An audit study. Quart. J. Econom. 111(3)915–942.
Nickell, S. 1981. Biases in dynamic models with fixed effects. Econo-metrica 49(6) 1417–1426.
Orsi, J. M., H. Margellos-Anast, S. Whitman. 2010. Black–whitehealth disparities in the united states and chicago: A 15-yearprogress analysis. Amer. J. Public Health. 100(2) 349–356.
Pager, D. 2003. The mark of a criminal record. Amer. J. Sociol. 108(5)937–975.
Pager, D., D. Karafin. 2009. Bayesian bigot? Statistical discrimina-tion, stereotypes, and employer decision making. Ann. Amer.Acad. Political Soc. Sci. 621(1) 70–93.
Pager, D., H. Shepard. 2008. The sociology of discrimination: Racialdiscrimination in employment, housing, credit, and consumermarkets. Annual Rev. Sociol. 34 181–209.
Phelps, E. S. 1972. The statistical theory of racism and sexism. Amer.Econom. Rev. 62(4) 659–661.
Pletcher, M. J., S. G. Kertesz, M. A. Kohn, R. Gonzales. 2008. Trendsin opioid prescribing by race/ethnicity for patients seekingcare in US emergency departments. J. Amer. Medical Assoc.299(1) 70–78.
Price, J., J. Wolfers. 2007. Racial discrimination among NBA refer-ees. Working paper, National Bureau of Economic Research,Cambridge, MA.
Quillian, L. 2006. New approaches to understanding racial preju-dice and discrimination. Annual Rev. Sociol. 32 299–328.
Richeson, J. A., J. N. Shelton. 2005. Brief report: Thin slices of racialbias. J. Nonverbal Behav. 29(1) 75–86.
Ross, S. L., M. A. Turner. 2005. Housing discrimination inmetropolitan America: Explaining changes between 1989 and2000. Soc. Problems 52(2) 152–180.
Rubineau, B., Y. Kang, C. Boutin-Foster, C. Storey-Johnson. 2011. Dothe effects of patient race and age on medical student perfor-mance change during early undergraduate medical education?Implications for remedying disparities in care. Poster presen-tation at the 50th Annual Conference on Research in MedicalEducation (RIME), November 4-9, Denver.
Russo, J. E., M. G. Meloy, T. J. Wilks. 2000. Predecisional distortionof information by auditors and salespersons. Management Sci.46(1) 13–27.
Sabin, J. A., F. P. Rivara, A. G. Greenwald. 2008. Physician implicitattitudes and stereotypes about race and quality of medicalcare. Medical Care 46(7) 678–685.
Schnittker, J., K. Liang. 2006. The promise and limits ofracial/ethnic concordance in physician-patient interaction.J. Health Politics, Policy Law 31(4) 811–838.
Schulman, K. A., J. A. Berlin, W. Harless, J. F. Kerner, S. Sistrunk,B. J. Gersh, R. Dubé, et al. 1999. The effect of race and sex onphysicians’ recommendations for cardiac catheterization. NewEngland J. Medicine 340(8) 618–626.
Shrout, P. E., J. L. Fleiss. 1979. Intraclass correlations: Uses in assess-ing rater reliability. Psych. Bull. 86(2) 420–428.
Simons, T., R. Friedman, L. A. Liu, J. McLean Parks. 2007. Racial dif-ferences in sensitivity to behavioral integrity: Attitudinal con-sequences, in-group effects, and “trickle down” among blackand non-black employees. J. Appl. Psych. 92(3) 650–665.
Siniver, E. 2011. Testing for statistical discrimination: The case ofimmigrant physicians in Israel. Labour 25(2) 155–166.
Smith, R. C. 2003. An evidence-based infrastructure for patient-cen-tered interviewing. R. M. Frankel, T. E. Quill, S. H. McDaniel,eds. The Biopsychosocial Approach: Past, Present, and Future. Uni-versity of Rochester, Rochester, NY, 148–163.
Spiro, H. 1992. What is empathy and can it be taught? Ann. InternalMedicine 116(10) 843–846.
Stainback, K., D. Tomaskovic-Devey, S. Skaggs. 2010. Organiza-tional approaches to inequality: Inertia, relative power, andenvironments. Annual Rev. Sociol. 36 225–247.
Tetlock, P. E., G. Mitchell. 2008. Calibrating prejudice in millisec-onds. Soc. Psych. Quart. 71(1) 12–16.
Tetlock, P. E., G. Mitchell. 2009. Implicit bias and accountability sys-tems: What must organizations do to prevent discrimination?Res. Organ. Behav. 29 3–38.
Tomaskovic-Devey, D., S. Skaggs. 1999. An establishment-level testof the statistical discrimination hypothesis. Work and Occupa-tions 26(4) 422–445.
Vaccarino, V., S. S. Rathore, N. K. Wenger, P. D. Frederick,J. L. Abramson, H. V. Barron, A. Manhapra, S. Mallik, H. M.Krumholz, National Registry of Myocardial Infarction Investi-gators. 2005. Sex and racial differences in the management ofacute myocardial infarction, 1994 through 2002. New England J.Medicine 353(7) 671–682.
van Ryn, M. 2002. Research on the provider contribution torace/ethnicity disparities in medical care. Medical Care 40(1,Supplement) I-140–I-151.
Yinger, J. 1986. Measuring racial discrimination with fair housingaudits: Caught in the act. Amer. Econom. Rev. 76(5) 881–893.
Yinger, J. 1996. Discrimination in Mortgage lending: A literaturereview. J. Goering, R. Wienk, eds. Mortgage Lending, Racial Dis-crimination, and Federal Policy. Urban Institute Press, Washing-ton, DC, 29–74.

Copyright 2012, by INFORMS, all rights reserved. Copyright of Management Science is the property of
INFORMS: Institute for Operations Research and its content may not be copied or emailed to multiple sites or
posted to a listserv without the copyright holder's express written permission. However, users may print,
download, or email articles for individual use.