Embed Size (px)
Citation preview


Biannual Multilingual
International Journal of Physical Education and Sports Sciences
ISSN: 2349- 3992 Volume 3, No.2 December, 2016
Peer Reviewed and Referred Journal
Editor
Dr. Sudhir Kumar Sharma
Swarnim Gujarat
Sports University
Sports Performance
Sports Culture
Experts
Teacher Education Program
High Performance
Training Program
Applied Sports Science
Education Program
Technical Official
Training Program
Coach Education Program
VyayamSetu
Volume: 3, Issue: 2, December2016 ISSN –2349- 3992
Vyayam Setu: International Journal of Physical Education and Sports Sciences ii
About University
The Gujarat Govt. has taken a praiseworthy initiative by establishing Swarnim Gujarat Sports
University (SGSU) in Gandhinagar for the bright future of the sporting world. A strong
andhealthy atmosphere for sports has been created in Gujarat through events like Khel
Mahakumbh and new sports schools/academies. The establishment of Swarnim Gujarat Sports
University has opened up doors for a wide range of opportunities for students of Physical
education and sports sciences for making career in sports industry. The greatest advantage of
studying sports is that alongside studying students get many opportunities of becoming a sports
person. Sports persons nowadays get great amount of financial help as well as international
reputation due to the encouraging policies of the government. Many renowned players have
established their own training academies and have succeeded in the professional field as well. At
SGSU a number of career oriented courses will be offered. Until now, the activities of sports and
physical education were limited only to school and colleges due to which sports coaches and
teachers could avail limited job opportunities. In recent times, there are several opportunities
both in public and private sectors. In private sectors, many recreation clubs, five star hotels,
entertainment theme parks, corporate societies, modern townships and private residential
buildings with world class facilities have come into existence wherein facilities for sporting
activities is accorded prime importance. As a result, new opportunities have arisen for building
careers as sports coordinator, swimming pool attendant, gym coach, recreation manager etc.
Besides, today many private international and national day schools have been established in
which there are requirements of sports coordinators and physical educators. There are some other
fields which are still unfamiliar and untried by the students such as Adventure Sports, Sports
Management, Sports Event Management, Sports Tourism, Sports Law, Sports Journalism, Sports
Nutrition, Sports Physiotherapy, Sports Massage etc. Career in these fields can earn name, fame
and money. SGSU will commence new courses like “P.G. Diploma in Sports Tourism” and
“P.G. Diploma in Adventure Sports Administration” so as to prepare experts who can organize
national and international level adventure sports activities. At present there is a lack of experts in
the aforementioned fields, as a result of which, programmes of international standards cannot be
organized. In fitness industry as well fields like Sports Physiotherapy, Sports Nutrition and
Medicine, Sports Massage and Sports Exercise therapy etc. lacks experts. SGSU will offer one
year course “P.G. Diploma in Disability Sports” to prepare experts in this field.
About the Journal
Vyayam Setu is a Referred Biannual and Multilingual International Journal of Physical
Education and Sports Sciences. It promotes interdisciplinary perspective to significant national
and international issues related to sports and physical education. Its regular features include
research book editorial correspondence. All the research papers are subject to a double – blind
referring process and published on the recommendations of referees and the editors. As far as the
research papers are concerned, the views or statements expressed in the research papers are
solely of the author and the editors are not responsible for the same.

Volume: 3, Issue: 2, December2016 ISSN –2349- 3992
Vyayam Setu: International Journal of Physical Education and Sports Sciences iii
Editorial Board
Patron
Prof. Jatin Soni
Vice Chancellor,
Swarnim Gujarat Sports University,
Editor
Dr. Sudhir Kumar Sharma
Co-Editor’s
Dr. Om Prakash Mishra
Ms. Smiti Padhi
Advisory Board
Dr. C. B. Kagthara
Dr. K. J. Gohil
Dr. J. K. Savalia
Dr. Dilip T. Jaiswal
Dr. Inder Mohan Datta
Dr. Nagendra Sharma
Dr. Sushma Ghildyal
Dr. Niraj Silavat
Mr. Ravindra Singh Rajpurohit
Mr. Y.L.Jethwa
Referee’s Board
Prof. R. Thirumalaisamy (India)
Prof. M Chandra Kumar (India)
Prof. Dr. G. L. Khanna (India)
Dr.(Mrs.) A. Shenbagavalli(India)
Dr. Youd Vir Singh (India)
Dr. Oleksandr Krasilshchikov (Malaysia)
Dr. D. Maniazhagu (India)
Dr. Nagendra Sharma (India)
Dr. J. K. Thakur (India)
Dr. Alia Sultangalie
Dr. G D Ghai
Dr. Deepak Mehta
Dr. Thirumalaikumar Subramanian
Dr. Y. Kishore
All correspondence related to the Journal should be addressed to:-
Editor,
Vyayam Setu,
Swarnim Gujarat Sports University,
Sector 15, Gandhinagar, 382015
Ph: 079-23288364, Mob: 08733934430
Website: www.sgsu.gujarat.gov.in
Email:[email protected]

Volume: 3, Issue: 2, December2016 ISSN –2349- 3992
Vyayam Setu: International Journal of Physical Education and Sports Sciences iv
GUIDELINES FOR AUTHORS
VYAYAM SETU welcomes articles of interest representing original work, analytical Papers and
papers based on review of extensive literature on Physical Education and Sports Sciences .All
communications should be addressed to the Editor, Vyayam Setu, Swarnim Gujarat Sports
University, Sector 15, Gandhinagar, Gujarat 382015.
Declaration: Each article should be accompanied with a declaration by all the authors that
I/They am/are the authors of the article in the order in which listed and the article is original, has
not been published or submitted for publication elsewhere. It is the author’s responsibility to
obtain permission in writing for the use of all previously published material, and not of the editor
or publisher.
Manuscript: Manuscripts should be type/written (double spacing) on one side of the white A4
paper. These should normally consist of five to eight thousand words. The length of the full
paper must be 4-6 single spaced (Books typed) pages. Please use Time New Roman Font with
12pt. size. (In adobe Page Maker), Papers in Hindi language should be typed in Krutidev 40,
12pt. size in adobe PageMaker (Book Styled), Papers in Gujarati language should be typed in
Shruti, 12 pt. Size in Adobe Page Maker (Book Styled). Abstract: The first page of the article
should contain an abstract of the article not exceeding 200 words. Reference: The author should
follow the APA style of reference writing. The reference list at the end should provide complete
information necessary to identify and retrieve each source. References cited in the text must
appear in the reference list; conversely, each entry in the reference list must be cited in the text,
both should be identical in spelling and year. Submission of Articles: Articles should be sent by
post or e-mail along with your brief bio-data and email Id. One hard copy along with the CD
should be sent. Review System: Every Article will be reviewed by a masked peer review by two
referees. The criteria used for acceptance of articles are contemporary relevance, contribution to
knowledge, clear and logical analysis, and sound methodology of research articles. The Editor
reserves the right to reject any manuscript as unsuitable in topic, style or form without requesting
external review. Copyright: The author owns the copyright of the article until it is accepted by
the Editor for publication. After the acceptance communication, the copyright of the article is
owned by the VYAYAM SETU, and should not be reproduced elsewhere without the written
permission of the Editor and the authors of the article.
Important Information
a) Acceptance of the paper will be sent through e-mail.
b) For getting the copies of “Reprints”, kindly inform before the publication of the Journal. In
this regard, the fees will be charged from the author.
c) Authors should submit their research paper/Article along with processing fee@ Rs.1,000/= per
paper. The editorial board has the power to wave the fee.
d) Research Papers will be reviewed and will be published on the recommendations of the
members of the referee Board, the advisory board and experts of the subjects and the discretion
of the editor.
Volume: 3, Issue: 2, December2016 ISSN –2349- 3992
Vyayam Setu: International Journal of Physical Education and Sports Sciences v
Editorial
“Sports can be expanded to mean:
S for Skill
P for Perseverance
O for Optimism
R for Resilience
T for Tenacity
S for Stamina
Sports Creates a spirit of sportsmanship,
which matters both on and off the field.
That is why I often say
“Jo Khele Vo Keile”
“જો ખલે ેવો ખીલ”ે, “जो खेले वो खखले” Those who play –shine.
Hon’ble Prime Minister Shri Narendra Modi Ji
Vyayam Setu is actively involved in supporting and assisting research scholars and professionals working in the fields of sport, leisure and recreation. The purpose of the Vyayam Setu is to promote, stimulate, and encourage study,
research, scholarly writing, and professional development in the area of Physical Education and allied sciences - both theoretical and applied aspects. Topics of
interest to Vyayam Setu members include Physical Education, Sport Management, leadership and Yogic Sciences. The second issue of the third volume of the Vyayam Setu has 4 papers in the
regional language dedicated in the field of the Physical Education Research going on in the Swarnim Gujarat Sports University. 6 papers are in English from various
parts of the country contributors has forwarded. The interest shown by the physical educationists in the Vyayam Setu is appreciable, with a little time span Vyayam Setu has got enough support from Physical Education Fraternity that it has been
included in the UGC list of Journals also. I wish it will touch heights and support from the contributors in future also.
Dr. Sudhir Kumar Sharma
Editor

Volume: 3, Issue: 2, December2016 ISSN –2349- 3992
Vyayam Setu: International Journal of Physical Education and Sports Sciences vi
CONTENTS Sr.
No.
Title Page
No.
1. કબડ્ડીના ખેલાડીઓનો તણાવ અને માનસિક સ્વાસ્્યનો તલુનાત્મક અભ્યાિ અલારખા ગ. કુરેશી અને ડૉ. જયકિશન સતંોષી
1-4
2 આિનઅને પ્રાણાયામની પ્રવસૃિઓ દ્વારા મેદસ્વીતા ધરાવતા બાળકોની રૂસધરાભિિરણ િહનશક્તત પર થતી અિરોનો અભ્યાિ
મોહસીનઆઝાદ કુરેશી અન ેડૉ. જગદીશચદં્ર ગોઠી
5-8
3 અમદાવાદ જજલ્લાની કેન્દ્રીય સવદ્યાલય અને ઉિર બસુનયાદી શાળાઓના સવદ્યાથીઓનો બદુ્ધિઆંકનો તલુનાત્મક અભ્યાિ
જીગર ર. આગજા અને ડૉ. િે. જે. ગોકહલ
9-12
4 કબડ્ડી અને વોલીબોલ રમતમાાં આંતર સવશ્વસવદ્યાલય કક્ષાએ પિાંદગી પામેલા ખેલાડીઓના શરીર પરરસમસતનો તલુનાત્મક અભ્યાિ
વિષ્ણ ુજ. ચૌધરી અન ેપ્રો. જગદીશચદં્ર િે. સાિલલયા
13-16
5 SPORTS: A VIGOROUS SCENARIO FOR EMPOWERING WOMEN IN
NORTH EAST INDIA
Deba Ranjan Duarah and Bhanu Pratap Prajapati
17-20
6 A STUDY OF EFFECT OF YOGA ON CHOICE VISUAL REACTION
TIME OF SOCCER PLAYERS
Dr. Parmod Kumar Sethi and Dr. Vikram Singh
21-26
7 A COMPARITIVE STUDY OF ANTHROPOMETRIC COMPONENTS
OF PLAYERS PARTICIPATED AT STATE LEVEL IN YOGA AND
MALLAKHAMBA IN KHEL MAHAKUMBH
Manishkumar V Patel and Dr. K. J. Gohil
27-28
8 EFFECT OF TRAINING WITH AEROBICS AND SPECIAL
EXERCISE ON ANTHROPOMETRIC MEASUREMNET OF
WORKING WOMEN
Meeta R. Vyas and Prof. Jamnadas K. Savaliya
29-39
9 COMPARATIVE EFFECTS OF DIFFERENT TRAINING PROGRAMS
ON PHYSICAL AND PHYSIOLOGICAL VARIABLES OF SCHOOL
BOYS
Ladhubhai Devabhai Mori and Dr. Kamleshkumar P. Patel
40-44
10 PERFORMANCE ENHANCING DRUGS IN ATHLETES - THE NEW
NORMAL
Sheetal Sheth
45-48

Volume: 3, Issue: 2, December 2016 ISSN –2349- 3992
Vyayam Setu: International Journal of Physical Education and Sports Sciences
1
કબડ્ડીના ખેલાડીઓનો તણાવ અને માનસિક સ્વાસ્્યનો તલુનાત્મક અભ્યાિ
અલારખા ગ. કુરેશી ડૉ. જયકકશન િતંોષી પીએચ.ડી. સ્કોલર એસોશિયેટ પ્રોફેસર
સ્વર્ણિમ ગજુરાત સ્પોટટસ યશુિવશસિટી, જ્યોશતબાફુલે ફફર્િકલ એજ્યકેુિિ કોલેજ, સેક્ટર ૧૫, ગાાંધીિગર ૩૮૨૦૧૬. િાગપરુ, મહારાષ્ટ્રI ૪૪૧૨૦૩. ટ ંકિાર: આ સાંિોધિ અભ્યાસિો હતે ુ કબડ્ડીિા ખેલાડીઓિા તણાવ અિે માિશસક સ્વાસ્્યિો તલુિાત્મક અભ્યાસ કરવાિો હતો .આ સાંિોધિ અભ્યાસ માટે આંતર કોલેજ કક્ષાએ કમાણી સાયન્સ અિે પ્રતાપરાય આટટસ કોલેજ ,અમરેલીિા 12 તથા કે .કે .પારેખ કોમસટ કોલેજ ,
અમરેલીિા 12 એમ કુલ 24 કબડ્ડી રમતમાાં ભાગ લીધેલ ખેલાડીઓિે જ શવષયપાત્રો તરીકે પસાંદ કરવામાાં આવ્યા હતા .તણાવિા માપિ માટે ડૉ .િમીમ કરીમ અિે રમા શતવારી રર્ચત પ્રશ્નાવર્લ
અિે માિશસક સ્વાસ્ ્ યિા માપિ માટે ડૉ . ડી .જી .ભટ્ટ અિે જી .આર .ગીડા રર્ચત પ્રશ્નાવર્લિો ઉપયોગ કરવામાાં આવ્યો હતો .તણાવ અિે માિશસક સ્વાસ્્યિી કસોટીિા આંકડાઓનુાં
એકત્રીકરણ કરી બાંિે જૂથાિ પ્રાપતાાંકો પર ‘t’ કસોટી લાગ ુપાડી 0.05 કક્ષાએ સાથટકતા ચકાસતા બાંિે જૂથોિા તણાવ અિે માિશસક સ્વાસ્્યમાાં સાથટક તફાવત જોવા મળ્યો િ હતો.
પ્રસ્તાવનાાઃ ૨૧મી સદીિા સાાંપ્રત યગુિા માિવીિે પોતાિી િારીફરક અિે માિશસક તાંદુરસ્તીિી જાળવણી અશિવાયટ થય પડી છે. આજે શવશવધ આધશુિક ભૌતીક સશુવધાઓ ( મોડટિ ડીવાઈિીંગ) જેવી કે મોટર ગાડી, લીફ્ટ, ઘરઘાંટી, વોટર પાંપ, મીક્ષર વગેરે ઉપલબ્ધ થતા માિવીિી િારીફરક ક્ષમતામાાં ઘટાડો થયો છે. જીવિ બેઠાડુાં અિે શિષ્ક્ષ્ટ્િય બિી જવાિે કારણે િારીફરક અિે માિશસક બીમારીઓનુાં પ્રમાણ વધતુાં જોવા મળે છે. વાસ્તવ માાં જોવા જઈએ તો શિયશમત કસરત કરિારા વ્યક્ક્ત પોતાિી સામાન્ય સિુબિુ િે કારણે પોતાિો િારીફરક અિે માિશસક શવકાસ યોગ્ય રીતે સાધી િકે છે.વતટમાિ કાળમાાં માિવ િારીફરક િક્ક્ત અિે તેિી યોગ્યતાનુાં મહત્વ સમજી પોતાિા િરીરિે સદુ્રઢ, ઘાટીલુાં અિે ઉપયોગી બિાવવા માટે કસરતો તરફ વળી રહ્યો છે. સાંિોધિિા સાંખ્યાબાંધ પરુાવા સાક્ષી પરેૂ છે કે િારીફરક ક્ષમતા ધરાવતી વ્યક્ક્ત લાાંબા સમય સધુી થાક્યા વગર કાયટ કરી િકે છે.ઉપરાાંત િરીરિા શવશવધ આંતફરક અવયવો જેવા કે રુશધરાર્ભસરણ, પાચિતાંત્ર, શ્વસિતાંત્ર વગેરેિે કાયટક્ષમ બિાવી િકે છે.આ ઉપરાાંત દ્રઢ મિોબળ કેળવી જીવિ માાંથી હતાિા – તિાવ અિે આવેગોિા અશતરેક િે અટકાવી માિશસક રીતે સક્ષમ બિાવે છે. બધી જ િારીફરક અિે ગત્યાત્મક િક્ક્તઓ જેવી કે સ્િાય ુિક્ક્ત, ગશતિક્ક્ત, સહિિક્ક્ત તેમજ શિયશમતતા અિે સાતત્ય

Volume: 3, Issue: 2, December 2016 ISSN –2349- 3992
Vyayam Setu: International Journal of Physical Education and Sports Sciences
2
જેવી સાંયોગ િક્ક્તઓ સધુારી શવકસાવી િકે છે. એટલુાં જ િફહ પરાંત ુવધતી જતી ઉમરે આંતફરક તાંત્રો િે આવતી શિશથલતા સાંતરુ્લત કરી િકે છે. માિશસક સ્વાસ્્ય એક એવી ક્સ્થશત શવિેષ છે કે આમાાં અંતગટત વ્યક્ક્તિા માિશસક, ભાવિાત્મક તથા િારીફરક સ્વાસ્્ય િી વચ્ચે સાંતલુિ હોય છે માિશસક સ્વાસ્્ય િી અંદર આનુાં જ્ઞાિ વધારે જરૂરી છે. માિશસક સાંતલુિ દ્વારા જ સમાજ સેવા કરવા આપિે સમથટ થાય િકીએ માિશસક સ્વાસ્્ય િા ઉત્પાદિ માાં અિે મિોરાંજિ માાં આત્મસાત માાં સહાય કરે છે. અભ્યાિનો હતેાુઃ
આ સાંિોધિ અભ્યાસિો હતે ુકબડ્ડી રમતિા ખેલાડીઓ વચ્ચે તણાવિી તલુિા કરવાિો હતો. આ સાંિોધિ અભ્યાસિો હતે ુકબડ્ડી રમતિા ખેલાડીઓ વચ્ચે માિશસક સ્વાસ્્યિી તલુિા
કરવાિો હતો. સવષપાત્રોની પિદંગીાઃ
આ સાંિોધિ અભ્યાસ માટે આંતર કોલેજ કક્ષાએ કમાણી સાયન્સ અિે પ્રતાપરાય આટટસ કોલેજ, અમરેલીિા 12 તથા કે. કે. પારેખ કોમસટ કોલેજ, અમરેલીિા 12 એમ કુલ 24 કબડ્ડી રમતમાાં ભાગ લીધેલ ખેલાડીઓિે જ શવષયપાત્રો તરીકે પસાંદ કરવામાાં આવ્યા હતા. માપનના ધોરણોાઃ
તણાવિા માપિ માટે ડૉ. િમીમ કરીમ અિે રમા શતવારી રર્ચત પ્રશ્નાવર્લ અિે માિશસક સ્વાસ્્યિા માપિ માટે ડૉ. ડી. જી. ભટ્ટ અિે જી. આર. ગીડા રર્ચત પ્રશ્નાવર્લિો ઉપયોગ કરવામાાં આવ્યો હતો. આંકડાકીય પ્રકિયાાઃ
તણાવ અિે માિશસક સ્વાસ્્યિી કસોટીિા આંકડાઓનુાં એકત્રીકરણ કરી બાંિે જૂથોિા પ્રાપતાાંકો પર ‘t’ કસોટી લાગ ુપાડી 0.05 કક્ષાએ સાથટકતા ચકાસવામાાં આવી હતી.

Volume: 3, Issue: 2, December 2016 ISSN –2349- 3992
Vyayam Setu: International Journal of Physical Education and Sports Sciences
3
અભ્યાિના પકરણામોાઃ િીચેિી સારણીઓ પરથી અભ્યાસિા પફરણામો સ્પષ્ટ્ટ થાય છે.
િારણી-1 કબડ્ડીના ખેલાડીઓના તણાવ કિોટીના મધ્યક, મધ્યક તફાવત અને ‘t’ રેસશયો દશાાવતી િારણી
જ થ સવષયપાત્રોની
િખં્યા મધ્યક
પ્રમાણણત સવચલન
મધ્યક તફાવત
‘t’
કમાણી સાયન્સ અિે પ્રતાપરાય આટટસ કોલેજ
12 91 41.713 14.583 1.009
કે. કે. પારેખ કોમસટ કોલેજ
12 76.417 27.668
*સાથટકતાનુાં ધોરણ 0.05 કક્ષાએ ‘t’ = (22) 2.074 સારણી-1 પરથી માલમુ પડે છે કે તણાવ કસોટીમાાં કમાણી સાયન્સ અિે પ્રતાપરાય આટટસ
કોલેજિા કબડ્ડી રમતિા ખેલાડીઓિો મધ્યક 91 અિે કે. કે. પારેખ કોમસટ કોલેજિા ખેલાડીઓિો મધ્યક 76.417 જોવા મળ્યો હતો. જેિો મધ્યક તફાવત 14.583 જોવા મળ્યો હતો. તેમજ પ્રાપત થયેલ ‘t’ રેશિયો 1.009 જોવા મળ્યો હતો. જે 0.05 કક્ષાએ સાથટક જોવા મળ્યો િ હતો. આથી સ્પષ્ટ્ટ થાય છે કે, કમાણી સાયન્સ અિે પ્રતાપરાય આટટસ કોલેજ અિે કે. કે. પારેખ કોમસટ કોલેજિા કબડ્ડી રમત સાથે જોડાયેલા ખલેાડીઓિા તણાવમાાં કોઈપણ પ્રકારિો તફાવત જોવા મળ્યો િ હતો. આથી બાંિે જૂથોિા તણાવમાાં સમાિતા જોવા મળી હતી. િારણી-2
કબડ્ડીના ખેલાડીઓના માનસિક સ્વાસ્્ય કિોટીના મધ્યક, મધ્યક તફાવત અને ‘t’ રેસશયો દશાાવતી િારણી
જ થ સવષયપાત્રોની
િખં્યા મધ્યક
પ્રમાણણત સવચલન
મધ્યક તફાવત
‘t’
કમાણી સાયન્સ અિે પ્રતાપરાય આટટસ કોલેજ
12 95 12.912 0.166 0.030
કે. કે. પારેખ કોમસટ કોલેજ
12 94.833 13.637
*સાથટકતાનુાં ધોરણ 0.05 કક્ષાએ ‘t’ = (22) 2.074

Volume: 3, Issue: 2, December 2016 ISSN –2349- 3992
Vyayam Setu: International Journal of Physical Education and Sports Sciences
4
સારણી-2 પરથી માલમુ પડે છે કે માિશસક સ્વાસ્્ય કસોટીમાાં કમાણી સાયન્સ અિે પ્રતાપરાય આટટસ કોલેજિા કબડ્ડી રમતિા ખેલાડીઓિો મધ્યક 95 અિે કે. કે. પારેખ કોમસટ કોલેજિા ખેલાડીઓિો મધ્યક 94.833 જોવા મળ્યો હતો. જેિો મધ્યક તફાવત 0.166 જોવા મળ્યો હતો. તેમજ પ્રાપત થયેલ ‘t’ રેશિયો 0.030 જોવા મળ્યો હતો. જે 0.05 કક્ષાએ સાથટક જોવા મળ્યો િ હતો. આથી સ્પષ્ટ્ટ થાય છે કે, કમાણી સાયન્સ અિે પ્રતાપરાય આટટસ કોલેજ અિે કે. કે. પારેખ કોમસટ કોલેજિા કબડ્ડી રમત સાથે જોડાયેલા ખેલાડીઓિા માિશસક સ્વાસ્્યમાાં કોઈપણ પ્રકારિો તફાવત જોવા મળ્યો િ હતો. આથી બાંિે જૂથોિા તણાવમાાં સમાિતા જોવા મળી હતી. િારાશંાઃ કમાણી સાયન્સ અિે પ્રતાપરાય આટટસ કોલેજ અિે કે. કે. પારેખ કોમસટ કોલેજિા કબડ્ડી
રમત સાથે જોડાયેલા ખેલાડીઓિા તણાવમાાં કોઈપણ પ્રકારિો તફાવત જોવા મળ્યો િ હતો. કમાણી સાયન્સ અિે પ્રતાપરાય આટટસ કોલેજ અિે કે. કે. પારેખ કોમસટ કોલેજિા કબડ્ડી
રમત સાથે જોડાયેલા ખેલાડીઓિા માિશસક સ્વાસ્્યમાાં કોઈપણ પ્રકારિો તફાવત જોવા મળ્યો િ હતો.
િદંર્ાગ્રથં
1. શપટર ,ડેવીડ ઈ.અિે કુઈ માટીિ એિ (૧૯૯૧) ,રેિીંગ ડીસ્ટન્સ રિીંગ ,ય.ુએસ.એ.: લેઈિયોર પ્રેસ ચેમ્પઈિ લીિોઈસ ,
2. વમાટ ,કે .કે .અિે વમાટ મોશિકા (૨૦૦૫) ,સ્વાસ્્ય શિક્ષા, િવી ફદલલીીઃ ફે્રન્ડિ પબ્બ્લકેિિ, 3. વમાટ, પ્રકાિ જે (2000). એ ટેક્ષબકુ ઓિ સ્પોટટસ સ્ટેટીસ્ટીક્સ, ગ્વાર્લયરીઃ શવિસ પબ્બ્લકેિિ.

Volume: 3, Issue: 2, December 2016 ISSN –2349- 3992
Vyayam Setu: International Journal of Physical Education and Sports Sciences
5
આસિ અિે પ્રાણાયામિી પ્રવશૃિઓ દ્વારા મેદસ્વીતા ધરાવતા બાળકોિી રૂશધરાર્ભસરણ સહિિક્ક્ત પર થતી અસરોિો અભ્યાસ
મોહિીનઆઝાદ કુરેશી ડૉ. જગદીશચદં્ર ગોઠી
(ફરસચટ સ્કોલર) (એસોશસયેટ પ્રોફેસર) િારીફરક શિક્ષણ અિે રમત શવજ્ઞાિશવદ્યાિાખા િારીફરક શિક્ષણ અિે રમત શવજ્ઞાિશવદ્યાિાખા સાદરા, ગાાંધીિગર -૩૮૨૩૨૦ સાદરા, ગાાંધીિગર -૩૮૨૩૨૦
ટ ંકિાર : આ સાંિોધિ અભ્યાસિો હતે ુ પ્રાયોર્ગક તાલીમ જુથ પર આસિ અિે પ્રાણાયામિી પ્રવશૃિઓ દ્વારા મેદસ્વીતા ધરાવતા બાળકોિી રૂશધરાર્ભસરણ સહિિક્ક્ત પર થતી અસરો ચકાસવાિો હતો .આ સાંિોધિ અભ્યાસ માટે એસ. એમ. જી. કે. હાઇસ્કુલિા 5 થી 8 ધોરણિા પ્રાયોર્ગક તાલીમ જુથિા 20 શવદ્યાથીઓ અિે શિયાંશત્રત જુથિા 20 શવદ્યાથીઓિે શવષયપાત્રો તરીકે પસાંદ કરી હાવડટ સ્ટેપ કસોટીિે માપિિા ધોરણ તરીકે પસાંદ કરી આંકડાઓનુાં એકત્રીકરણ કરી બાંિે જુથોિા પ્રાપતાાંકો પર શવચરણ સહ શવચરણ પ ૃ્ થકરણ કસોટી લાગ ુપાડી 0.05 કક્ષાએ સાથટકતા ચકાસતા પ્રાયોર્ગક તાલીમ જુથિી રુશધરા ર્ભસરણ સહિિક્ક્ત શિયાંશત્રત જુથ કરતા વધ ુસાથટક સાર્બત થઈ હતી.
પ્રસ્તાવના િારીફરક શિક્ષણનુાં સતૂ્ર PLAY FOR ALL MEN AND WOMEN િી જેમ આજે પરૂા શવશ્વમાાં
YOG FOR ALL MEN AND WOMEN પ્રમાણ ેયોગિો વ્યાપ થઈ રહ્યો છે .યોગ દ્વારા શવશ્વ એક થઈ રહ્ુાં છે .ત્યારે યોગ પર બિે તેટલાવધ ુસાંિોધિિી આવશ્યકતા લાગે છે. શ્રીમદભગવત ગીતાિા જણાવ્યા પ્રમાણ“ે કમટમાાં કુિળતા એ યોગ છે .”એ સતૂ્રિે શવશ્વમાાં અપિાવવામાાં આવ્યુાં છે .યોગ ફક્ત યોગીઓ માટે જ િહીં .પરાંત ુસામાન્ય વ્યક્ક્તઓ માટે પણ છે .તે જણાય આવે છે .ત્યારે યોગથી િારીફરક યોગ્યતા અિે િરીરિાસ્ત્ર શવજ્ઞાિિા ઘટકોિો પણ શવકાસ કરી િકાય .જેથી શવદ્યાથીઓએ પોતાિા દૈશિક જીવિિા કાયો સારી રીતે અિ ેયોગ્ય જોડાણ સાથે કરી િકે. આપણાાં ભતુપવૂટ મહામહીમ રાષ્ટ્રપશત શ્રી અબ્દુલ કલામએ ભારતિે ૨૦૨૦માાં મહાસિા બિાવવાનુાં સ્વપિ સેવ્યહુત ુ .ત્યારે ભારતીય પ્રાચીિ પરાંપરાિા આસિ અિે પ્રાણાયામિી શવદ્યાથીઓ પર િી અસર થાય છે .તે જાણવુાં આવશ્યક થઈ પડે છે .જેથી શવદ્યાથીઓ પોતાિો િારીફરક શવકાસ અિ ેમાિશસક શવકાસ જાણી િકે .

Volume: 3, Issue: 2, December 2016 ISSN –2349- 3992
Vyayam Setu: International Journal of Physical Education and Sports Sciences
6
આજે આધ્યાત્મ + શવજ્ઞાિ = 2020નુાં ભારતનુાં સ્વપિ સેવાઇ રહ્ુાં છે .ત્યારે યોગથી બાળકોિી િારીફરક યોગ્યતા અિે િરીરિાસ્ત્ર શવજ્ઞાિિા ઘટકો પર કેવા ફેરફાર થયા,તે જાણવુાં આવશ્યક થઈ પડે છે. યોર્ગક ફિયાઓ તથા સયૂટિમસ્કાર પણ ભારતીય સાંસ્કૃશતિો અમલૂય વારસો છે .યોગીક ફિયાઓન ુશિધાટફરત ધ્યેય આમ તો યોગ એટલ ેકે,ઈશ્વર સાથે જોડાણ શસધ્ધ કરવાનુાં છે .તે માટે “યમ, શિયમ, આસિ, પ્રાણાયામ, પ્રત્યાહાર, ધારણા, ધ્યાિ અિે સમાશધ”,આઠ પગશથયાાં છે .યોગિી આ પ્રફિયામાાં િરીરિે પાયારૂપ સાધિ તરીકે સ્વીકારી યોગસાધિા માટે િરીરિી અિ ેમિિી શવકાર રફહત સ્વસ્થ ક્સ્થશત અશિવાયટ માળખામાાં આવે છે.િરીર અિે મિ અરસપરસ ગાઢ રીતે સાંકળાયેલા છે .યોગ માટે જરૂરી િારીફરક તથા માિશસક સ્વાસ્્ય યમ, શિયમ, આસિ તથા પ્રાણાયમથી પ્રાપત થાય છે .ભારતીય િારીફરક કેળવણીિા કાયટિમમાાં આ કારણ ેઆસિ,પ્રાણાયામ વગેરે યૌર્ગક ફિયાઓિો પણ સમાવેિ કરવામાાં આવ્યો છે. અભ્યાિના હતેઓુ 1. આસિ અિે પ્રાણાયામિી પ્રવશૃિઓ દ્વારા મેદસ્વીતા ધરાવતા બાળકોિી રૂશધરાર્ભસરણ
સહિિક્ક્ત પર થતી અસરો ચકાસવાિો હતે.ુ માપનના ધોરણો
રૂશધરાર્ભસરણ સહિિક્ક્ત માટે હાવડટ સ્ટેપ કસોટીિે માપિિા ધોરણ તરીકે પસાંદ કરવામાાં આવી હતી. અભ્યાિની યોજના: આ સાંિોધિ અભ્યાસ માટે એસ. એમ. જી. કે. હાઇસ્કુલિા 5 થી 8 ધોરણિા કુલ 40 શવષયપાત્રોિે યાદચ્ચ્છક પદ્ધશતથી પસાંદ કરવામાાં આવ્યા હતા. એક જુથમાાં 20 શવષયપાત્રો પસાંદ કરવામાાં આવ્યા હતા. કુલ બે જૂથો બિાવવામાાં આવ્યા હતા. જેમાાં પ્રાયોર્ગક જુથ િે આસિ અિે પ્રાણાયામિી તાલીમ આપવામાાં આવી હતી જયારે શિયાંશત્રત જુથ િે આસિ અિે પ્રાણાયામિી તાલીમથી મકુ્ત રાખવામાાં આવ્યુાં હત ુાં. 8 અઠવાડીયાિા તાલીમ કાયટિમિી િરૂઆત કરતા પેહલા પવૂટ કસોટી અિે તાલીમ કાયટિમ પણૂટ થયા પછી અંશતમ કસોટી દ્વારા આંકડાઓનુાં એકશત્રકરણ કરવામાાં આવ્યુાં હત ુાં. આંકડાકીય પ્રકિયા આસિ અિે પ્રાણાયામ તાલીમિી શવષય પાત્રોિા રૂશધરાર્ભસરણ સહિિક્ક્ત પર થતી અસરો ચકાસવા શવચરણ સહશવચરણ પ ૃ્ થકરણ કસોટી લાગ ુપડી 0.05 કક્ષાએ સાથટકતા ચકાસતા િીચે મજુબિા પફરણામો પ્રાપત થયા હતા.

Volume: 3, Issue: 2, December 2016 ISSN –2349- 3992
Vyayam Setu: International Journal of Physical Education and Sports Sciences
7
િારણી-1 રૂસધરાણર્િરણ િહનશક્તતના પ્રાયોણગક અને સનયસંત્રત જુથનુ ંસવચરણ િહ સવચરણ પ ૃ્ થકરણ.
કસોટી
જુથ શવચરણ સહ શવચરણ પ ૃ્ થકરણ કોષ્ટ્ટક
પ્રાયોર્ગક જુથ (Practical Group)
શિયાંશત્રત જુથ (Control Group)
વગોિો સરવાળો (SS)
સ્વતાંત્ર માત્રા (df)
મધ્યક શવચરણ (MSS)
‘F’
પવૂટ કસોટી મધ્યક (Pre Test Mean)
28.25 27.8 B 2.025 1 2.025
0.060 W 1272.95 38 33.49868
અંશતમ કસોટી મધ્યક
(Post Test Mean) 42.8 32.3
B 1102.95 1 1102.5 12.956
* W 3233.4 38 85.08947
સધુારેલ મધ્યક (Adjusted Mean)
42.651 32.448 B
1039.4269
1 1039.427 14.349
* W
2680.1523
37 72.43655
*િાથાકતાનુ ંધોરણ 0.05 કક્ષાએ ‘F’ = 0.05 (1, 38) = 4.084 & (1, 37) = 4.084 સારણી-1 માાં રૂશધરાર્ભસરણ સહિિક્ક્તિા પવૂટકસોટીિો ‘F’ રેશિયો 0.060 જોવા મળેલ હતો.
જે 0.05 કક્ષાએ અસાથટક જોવા મળેલ હતો. જયારે બાંિે જુથિો અંશતમ કસોટીિો ‘F’ રેશિયો 12.956 જોવા મળેલ હતો. જે 0.05 કક્ષાએ સાથટક જોવા મળેલ હતો. અિે સધુારેલ મધ્યકિો ‘F’ રેશિયો 14.349 જોવા મળેલ હતો. જે 0.05 કક્ષાએ સાથટક જોવા મળ્યો હતો.
આલેખ – 1
રૂસધરાણર્િરણ િહનશક્તતના પ્રાયોણગક જુથ અને સનયસંત્રત જુથના મધ્યકો દશાાવતો આલેખ
28.25 27.8
42.8
32.3
42.651
32.448
0
10
20
30
40
50
પ્રાયોર્ગક જૂથ શિયાંશત્રત જૂથપવૂટ કસોટી મધ્યક અંશતમ કસોટી મધ્યક સધુારેલ મધ્યક

Volume: 3, Issue: 2, December 2016 ISSN –2349- 3992
Vyayam Setu: International Journal of Physical Education and Sports Sciences
8
િારાશં પ્રાયોર્ગક જુથિી રૂશધરાર્ભસરણ સહિિક્ક્ત શિયાંત્રીત જુથ કરતા વધ ુસાથટક જોવા મળી
હતી. િદંર્ા ગ્રથં
1. વમાટ, પ્રકાિ જે (2000). એ ટેક્ષબકુ ઓિ સ્પોટટસ સ્ટેટીસ્ટીક્સ, ગ્વાર્લયરીઃ શવિસ પબ્બ્લકેિિ. 2. રાજશષિ મશુિ સ્વામી (૨૦૦૫), યોગદશિિકા દ્રીતીય, વડોદરા :ગજુરાત સમાચાર પે્રસ ,

Volume: 3, Issue: 2, December 2016 ISSN –2349- 3992
Vyayam Setu: International Journal of Physical Education and Sports Sciences
9
અમદાવાદ જજલ્લાની કેન્દ્દ્રીય સવદ્યાલય અને ઉત્તર બસુનયાદી શાળાઓના સવદ્યાથીઓનો બદુ્ધિઆંકનો તલુનાત્મક અભ્યાિ
જીગર ર. આગજા ડૉ. કે.જે. ગોકહલ (ફરસચટ સ્કોલર) (એસોિીયેટ પ્રોફેસર) સ્વર્ણિમ ગજુરાત સ્પોર્ ટસ યશુિવસીટી, સી.પી. ડીગ્રી કોલેજ ઓફ ફફિીકલ એજ્યકેુિિ સેક્ટર ૧૫, ગાાંધીિગર ૩૮૨૦૧૬ રાજપીપળા, િમટદા િીલલા, ગજુરાત ૩૯૩૧૪૫ ટ ંકિાર :આ અભ્યાસિો હતે ુઅમદાવાદ જજલલાિી કેન્દ્રીય શવદ્યાલય અિે ઉિર બશુિયાદી િાળાઓિા શવદ્યાથીઓિો બદુ્ધદ્ધઆંકિો તલુિાત્મક અભ્યાસ કરવાિો હતો. અમદાવાદ જજલલાિી કેન્દ્રીય શવદ્યાલય અિ ેઉિર બશુિયાદી િાળાઓમાાં 13 થી 15 વષટિા શવદ્યાથીઓિ ેપસાંદ કરવામાાં આવ્યા હતા. તેિા ઉપર ડો. કૃષ્ટ્ણકાાંત ગોપાળજી દેસાઈ રર્ચત દેસાઈ િાષ્ક્બ્દક-અિાષ્ક્બ્દક સમહૂ બદુ્ધદ્ધકસોટી લેવામાાં આવી. જેિા દ્વારા તેમિા ઉપર બદુ્ધદ્ધઆંકિો અભ્યાસ કરવામાાં આવ્યો હતો. અમદાવાદ જજલલાિી કેન્દ્રીય શવદ્યાલય અિે ઉિર બશુિયાદી િાળાિા શવદ્યાથીઓિ ેપ્રાપત થયેલી માફહતીિે ‘t’ ટેસ્ટ દ્વારા આંકડાકીય પથૃક્કરણ કરવામાાં આવ્ય ુહત ુઅિે 0.05 કક્ષાએ સાથટકતા ચકાસવામાાં આવી હતી.
પ્રસ્તાવના
શવશ્વશવજેતા શસકાંદરિી સફળતા માટેિી િારીફરક તાકાત કદાચ કાંઈક અંિે જવાબદાર હિ.ે પરાંત ુમાત્ર િારીફરક બળથી કદી શવજેતા બિી િકાત ુાં િથી. ગમે તેટલી િારીફરક તાકાત અિ ેમાિશસક સ્ૂશતિ શવિા અધરૂી છે. માત્ર પાિવી િારીફરક તાકાત ધરાવતી વ્યક્ક્તિે પેલા કરતાાં અડધી િારીફરક તાકાત ધરાવતા કરાટે, કુાંગ-ફુ કે ટેકવાિ-ડો જેવી કળામાાં શિષ્ટ્ણાાંત વ્યક્ક્ત પણ મહાત કરી િકે છે. કેવળ િારીફરક તાકાત તો પશમુાાં પણ હોય છે. એટલે િારીફરક તાકાતિે જ્યાાં સધુી માિશસક તાકાત (બદુ્ધદ્ધ) િો સાથ િ મળે ત્યાાં સધુી એિી અસર અધરૂી રહ ેછે. એટલ ેબળ અિે બદુ્ધદ્ધિો સમન્વય કરવો પડે છે. િારીફરક તાકાત કસરત અિે પૌષ્ક્ષ્ટ્ટક ખોરાક વડે લાવી િકાય છે. પરાંત ુબદુ્ધિ માટે કોઈ દાંડ-બેઠક કે કોઈ ટેબ્લેટ, ઈંજેક્િિ કામ િથી લાગતા બદુ્ધદ્ધ એક કેળવણી છે અિ ેએ ઉછેર, વાતાવરણ તથા પોતાિી માિશસક જાગશૃત પર સૌથી વધ ુઆધાર રાખિાર બાબત છે. સફળ માણસ િાફરરીક તાકાત જેટલુાં જ મહત્વ બદુ્ધિિે પણ આપે છે. અલબિ, એિો અથટ એ િથી કે િારીફરક તાકાત કે િક્ક્તિી અવગણિા કરવી જોઈએ. હકીકતમાાં તો બાંિે બાબતો શસક્કાિી બે બાજુ જેવી છે. શસક્કાિી એક પણ બાજુ ઘસાઈ ગઈ હોય તો શસક્કો ચલણમાાંથી બહાર ફેંકાય જાય છે.

Volume: 3, Issue: 2, December 2016 ISSN –2349- 3992
Vyayam Setu: International Journal of Physical Education and Sports Sciences
10
માિવ સાંસ્કૃશતમાાં બદુ્ધિિાળી માિવી જ્યાાં શવિેષ રીત ે અશત મલૂયવાિ છે. તે ક્યારેય શવવાદાસ્પદ િથી. કારણ કે બદુ્ધદ્ધિો પ્રયોગ અિેક અથોમાાં કરી િકાય છે. વધારે પડતા લોકો બદુ્ધદ્ધ િબ્દિો અથટ ‘તકટ અિે સમજિી ક્ષમતા અથવા સામાન્ય જ્ઞાિ યોગ્યતા.’ પ્રમાણ કરતા હોય છે. પરાંત ુતે બદુ્ધિિો પ્રયોગ ખોટા અથટમાાં કરે છે. કેટલાક લોકો સારી યાદિક્ક્તિે, કેટલાક લોકો સમસ્યા સમાધાિિી ઉિમ યોગ્યતાિે, તથા કેટલાક લોકો શ્રેષ્ટ્ઠ શસદ્ધદ્ધિે બદુ્ધિ માિે છે. પરાંત ુઆ બધી બદુ્ધદ્ધિી ખોટી વ્યાખ્યાઓ છે. બદુ્ધિ આ બઘાથી ર્ભન્ન છે. બદુ્ધિિા સાંદભટમાાં પ્રસ્તતુ કરેલ વ્યાખ્યાઓમાાં કોઈ એવી વ્યાખ્યા િથી. જે બઘા જ મિોવૈજ્ઞાશિકો તથા શિક્ષણિાસ્ત્રીઓ દ્વારા સવટસામાન્ય રૂપે સ્વીકારવામાાં આવી હોય. મિોવૈજ્ઞાશિકોએ ર્બદ્ધદ્ધિે અિેક પ્રકારે વ્યાખ્યાશયત કરી છે અિ ેપોતાિી વ્યાખ્યાિા કોઈ એક પક્ષ પર ભાર દઈિે બીજા દ્વારા પ્રસ્તતુ વ્યાખ્યાઓિે માટે સાંમશત આપી િથી. ઉદાહરણ તરીકે બદુ્ધદ્વિે “જન્મજાત, યોગ્યતા, સામાન્ય યોગ્યતા ઓળખવાિી તથા િીખવાિી િક્ક્ત, અમતૂટ ર્ચિંતિ વગેરે રૂપોમાાં વ્યાખ્યાશયત કરી છે.” બદુ્ધદ્ધ સાથ ેસાંબાંશધત સાફહત્યનુાં અવલોકિ કરવાથી એવુાં જણાય છે કે બદુ્ધદ્ધ સાથે સાંબાંશધત સાફહત્યનુાં અવલોકિ કરવાથી એવુાં જણાય છે કે બદુ્ધદ્ધિી અિેકાિેક વ્યાખ્યાઓ પ્રસ્તતુ કરવામાાં આવી છે. જે તેિા શવશવઘ પક્ષો પર પ્રકાિ પાડ ેછે.
અભ્યાિનો હતે ુ
અમદાવાદ જજલલાિી કેન્દ્રીય શવદ્યાલય અિ ે ઉિર બશુિયાદી િાળાઓિા શવદ્યાથીઓિો બદુ્ધદ્ધઆંકિો તલુિાત્મક અભ્યાસ કરવાિો હતો.
સવષયપાત્રોની પિદંગી
આ સાંિોધિ અભ્યાસમાાં અમદાવાદ જજલલાિી કેન્દ્રીય શવદ્યાલય અિે ઉિર બશુિયાદી િાળાઓમાાં 13 થી 15 વષટિા શવદ્યાથીઓિ ેપસાંદ કરવામાાં આવ્યા હતા.
માપનના ધોરણો
આ સાંિોધિ અભ્યાસ માટે ડો. કૃષ્ટ્ણકાાંત ગોપાળજી દેસાઈ રર્ચત દેસાઈ િાષ્ક્બ્દક-અિાષ્ક્બ્દક સમહૂ બદુ્ધદ્ધકસોટી લેવામાાં આવી. જેિા દ્વારા તેમિા ઉપર બદુ્ધદ્ધઆંકિો અભ્યાસ કરવામાાં આવ્યો હતો.
આંકડાકીય પ્રકિયા
અમદાવાદ જજલલાિી કેન્દ્રીય શવદ્યાલય અિે ઉિર બશુિયાદી િાળાિા શવદ્યાથીઓિ ેપ્રાપત થયેલી માફહતીિે ‘t’ ટેસ્ટ દ્વારા આંકડાકીય પથૃક્કરણ કરવામાાં આવ્ય ુહત ુઅિે 0.05 કક્ષાએ સાથટકતા ચકાસવામાાં આવી હતી.
Volume: 3, Issue: 2, December 2016 ISSN –2349- 3992
Vyayam Setu: International Journal of Physical Education and Sports Sciences
11
પકરણામોની ચચાા િારણી-1
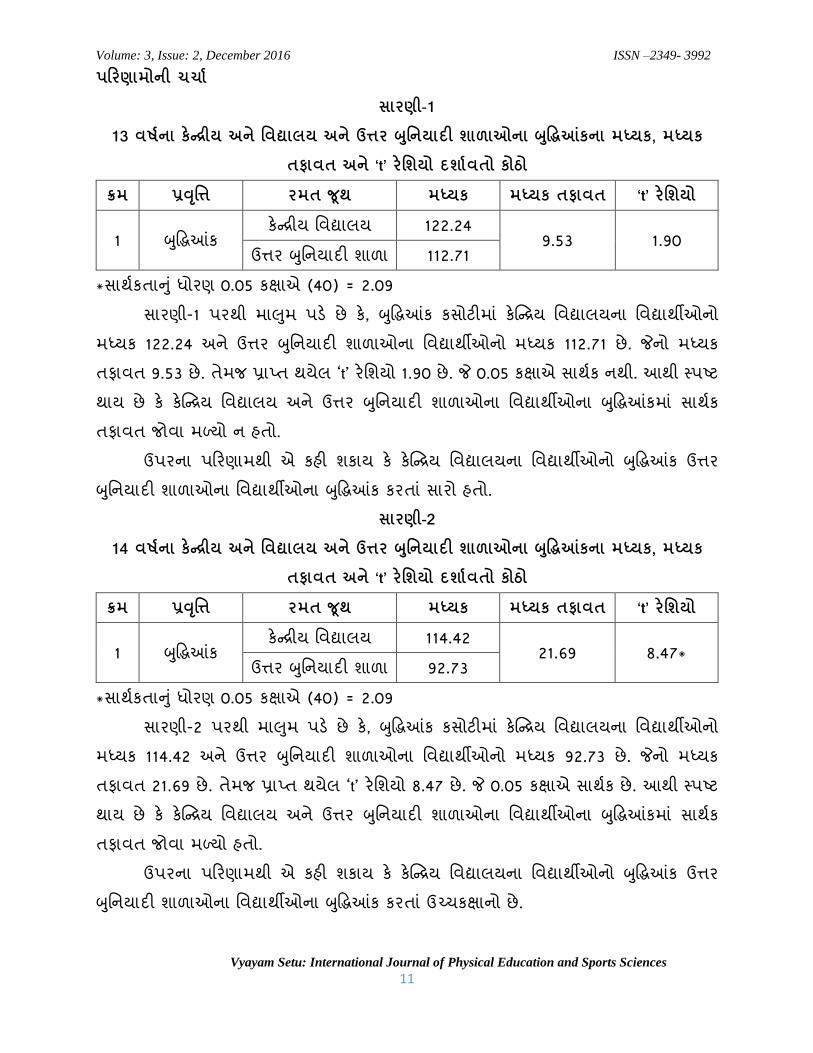
13 વષાના કેન્દ્દ્રીય અને સવદ્યાલય અને ઉત્તર બસુનયાદી શાળાઓના બદુ્ધિઆંકના મધ્યક, મધ્યક તફાવત અને ‘t’ રેસશયો દશાાવતો કોઠો
િમ પ્રવસૃત્ત રમત જ થ મધ્યક મધ્યક તફાવત ‘t’ રેસશયો
1 બદુ્ધદ્ધઆંક કેન્દ્રીય શવદ્યાલય 122.24
9.53 1.90 ઉિર બશુિયાદી િાળા 112.71
*સાથટકતાનુાં ધોરણ 0.05 કક્ષાએ (40) = 2.09 સારણી-1 પરથી માલમુ પડે છે કે, બદુ્ધદ્ધઆંક કસોટીમાાં કેષ્ક્ન્દ્રય શવદ્યાલયિા શવદ્યાથીઓિો
મધ્યક 122.24 અિે ઉિર બશુિયાદી િાળાઓિા શવદ્યાથીઓિો મધ્યક 112.71 છે. જેિો મધ્યક તફાવત 9.53 છે. તેમજ પ્રાપત થયેલ ‘t’ રેશિયો 1.90 છે. જે 0.05 કક્ષાએ સાથટક િથી. આથી સ્પષ્ટ્ટ થાય છે કે કેષ્ક્ન્દ્રય શવદ્યાલય અિે ઉિર બશુિયાદી િાળાઓિા શવદ્યાથીઓિા બદુ્ધદ્ધઆંકમાાં સાથટક તફાવત જોવા મળ્યો િ હતો.
ઉપરિા પફરણામથી એ કહી િકાય કે કેષ્ક્ન્દ્રય શવદ્યાલયિા શવદ્યાથીઓિો બદુ્ધદ્ધઆંક ઉિર બશુિયાદી િાળાઓિા શવદ્યાથીઓિા બદુ્ધદ્ધઆંક કરતાાં સારો હતો.
િારણી-2 14 વષાના કેન્દ્દ્રીય અને સવદ્યાલય અને ઉત્તર બસુનયાદી શાળાઓના બદુ્ધિઆંકના મધ્યક, મધ્યક
તફાવત અને ‘t’ રેસશયો દશાાવતો કોઠો િમ પ્રવસૃત્ત રમત જ થ મધ્યક મધ્યક તફાવત ‘t’ રેસશયો
1 બદુ્ધદ્ધઆંક કેન્દ્રીય શવદ્યાલય 114.42
21.69 8.47* ઉિર બશુિયાદી િાળા 92.73
*સાથટકતાનુાં ધોરણ 0.05 કક્ષાએ (40) = 2.09 સારણી-2 પરથી માલમુ પડે છે કે, બદુ્ધદ્ધઆંક કસોટીમાાં કેષ્ક્ન્દ્રય શવદ્યાલયિા શવદ્યાથીઓિો
મધ્યક 114.42 અિે ઉિર બશુિયાદી િાળાઓિા શવદ્યાથીઓિો મધ્યક 92.73 છે. જેિો મધ્યક તફાવત 21.69 છે. તેમજ પ્રાપત થયેલ ‘t’ રેશિયો 8.47 છે. જે 0.05 કક્ષાએ સાથટક છે. આથી સ્પષ્ટ્ટ થાય છે કે કેષ્ક્ન્દ્રય શવદ્યાલય અિે ઉિર બશુિયાદી િાળાઓિા શવદ્યાથીઓિા બદુ્ધદ્ધઆંકમાાં સાથટક તફાવત જોવા મળ્યો હતો.
ઉપરિા પફરણામથી એ કહી િકાય કે કેષ્ક્ન્દ્રય શવદ્યાલયિા શવદ્યાથીઓિો બદુ્ધદ્ધઆંક ઉિર બશુિયાદી િાળાઓિા શવદ્યાથીઓિા બદુ્ધદ્ધઆંક કરતાાં ઉચ્ચકક્ષાિો છે.

Volume: 3, Issue: 2, December 2016 ISSN –2349- 3992
Vyayam Setu: International Journal of Physical Education and Sports Sciences
12
િારણી-3 15 વષાના કેન્દ્દ્રીય અને સવદ્યાલય અને ઉત્તર બસુનયાદી શાળાઓના બદુ્ધિઆંકના મધ્યક, મધ્યક
તફાવત અને ‘t’ રેસશયો દશાાવતો કોઠો િમ પ્રવસૃત્ત રમત જ થ મધ્યક મધ્યક તફાવત ‘t’ રેસશયો
1 બદુ્ધદ્ધઆંક કેન્દ્રીય શવદ્યાલય 112.68
18.83 7.47* ઉિર બશુિયાદી િાળા 93.85
*સાથટકતાનુાં ધોરણ 0.05 કક્ષાએ (40) = 2.09 સારણી-3 પરથી માલમુ પડે છે કે, બદુ્ધદ્ધઆંક કસોટીમાાં કેષ્ક્ન્દ્રય શવદ્યાલયિા શવદ્યાથીઓિો
મધ્યક 112.68 અિે ઉિર બશુિયાદી િાળાઓિા શવદ્યાથીઓિો મધ્યક 93.85 છે. જેિો મધ્યક તફાવત 18.83 છે. તેમજ પ્રાપત થયેલ ‘t’ રેશિયો 7.47 છે. જે 0.05 કક્ષાએ સાથટક છે. આથી સ્પષ્ટ્ટ થાય છે કે કેષ્ક્ન્દ્રય શવદ્યાલય અિે ઉિર બશુિયાદી િાળાઓિા શવદ્યાથીઓિા બદુ્ધદ્ધઆંકમાાં સાથટક તફાવત જોવા મળ્યો હતો.
ઉપરિા પફરણામથી એ કહી િકાય કે કેષ્ક્ન્દ્રય શવદ્યાલયિા શવદ્યાથીઓિો બદુ્ધદ્ધઆંક ઉિર બશુિયાદી િાળાઓિા શવદ્યાથીઓિા બદુ્ધદ્ધઆંક કરતાાં ઉચ્ચકક્ષાિો છે. િારાશં • કેન્દ્રીય શવદ્યાલયિા 13 વષટિા શવદ્યાથીઓ અિે ઉિર બશુિયાદી િાળાઓિા શવદ્યાથીઓિા
બદુ્ધદ્ધઆંક કસોટીમાાં કેન્દ્રીય શવદ્યાલયિા શવદ્યાથીઓિો બદુ્ધદ્ધઆંક સારો જોવા મળેલ છે. • કેન્દ્રીય શવદ્યાલયિા 14 વષટિા શવદ્યાથીઓ અિે ઉિર બશુિયાદી િાળાઓિા શવદ્યાથીઓિા
બદુ્ધદ્ધઆંક કસોટીમાાં કેન્દ્રીય શવદ્યાલયિા શવદ્યાથીઓિો બદુ્ધદ્ધઆંક સારો જોવા મળેલ છે. • કેન્દ્રીય શવદ્યાલયિા 15 વષટિા શવદ્યાથીઓ અિે ઉિર બશુિયાદી િાળાઓિા શવદ્યાથીઓિા
બદુ્ધદ્ધઆંક કસોટીમાાં કેન્દ્રીય શવદ્યાલયિા શવદ્યાથીઓિો બદુ્ધદ્ધઆંક સારો જોવા મળેલ છે. િદંર્ાગ્રથંો
1. અંધાફરયા, રવીન્દ્ર, (૨૦૦૪) અધ્યયિ, અધ્યાપિનુાં મિોશવજ્ઞાિ, અમદાવાદીઃ વાફરષેણ પ્રકાિિ,
2. અલી જાવેદ, (૨૦૦૫) ખેલ મિોશવજ્ઞાિ, િવી ફદલહીીઃ ખેલ સાફહત્ય કેન્દ્ર. 3. દરજી, ડાહ્યાભાઈ આર, (૧૯૮૫) િૈક્ષર્ણક માપ અિે મલૂયાાંકિિી પ્રશવશધઓ, અમદાવાદીઃ
યશુિવશસિટી ગ્રાંથ શિમાટણ બોડટ, ગજુરાત રાજ્ય. 4. બેરો, હરેોલડ એમ અિે મેકગી, રોિમેરી, (૧૯૮૯) એ પ્રેક્ટીકલ એપ્રોચ રુ્ મેિરમેન્ટ ઈિ
ફફિીકલ એજ્યકેુિિ, ફફલાડેલફફયાીઃ લી. એન્ડ ફેબીગર.

Volume: 3, Issue: 2, December 2016 ISSN –2349- 3992
Vyayam Setu: International Journal of Physical Education and Sports Sciences
13
કબડ્ડી અને વોલીબોલ રમતમા ંઆંતર સવશ્વસવદ્યાલય કક્ષાએ પિદંગી પામેલા ખેલાડીઓના શરીર પકરસમસતનો તલુનાત્મક અભ્યાિ
સવષ્ણ ુજ. ચૌધરી પ્રો. જગદીશચદં્ર કે. િાવણલયા (પીએચ. ડી. સ્કોલર) (એસોશસયેટ પ્રોફેસર) સ્વર્ણિમ ગજુરાત સ્પોર્ ટસ યિુીવસીટી, િારીફરક શિક્ષણ અિે રમત શવજ્ઞાિશવદ્યાિાખા સેક્ટર ૧૫, ગાાંધીિગર -૩૮૨૦૧૬ સાદરા, ગાાંધીિગર -૩૮૨૩૨૦ ટંુકિાર: આ સાંિોધિ અભ્યાસિો હતે ુ કબડ્ડી રમતજૂથ અિે વોલીબોલ રમત જૂથિા આંતર શવશ્વશવદ્યાલય કક્ષાએ પસાંદગી પામેલા ખેલાડીઓિા િરીર પફરશમશતિો તલુિાત્મક અભ્યાસ કરવાિો હતો .આ સાંિોધિ અભ્યાસ માટે ગજૂરાત શવદ્યાપીઠિા કબડ્ડી રમત જૂથિા 12 ખેલાડીઓ
અિે વોલીબોલ રમત જૂથિા 12 ખેલાડીઓિે શવષયપાત્રો તરીકે પસાંદ કરી િોર્જિ અિે જોન્સિ કસોટીિે માપિ ધોરણ તર ્ીકે પસાંદ કરી આંકડાઓનુાં એકત્રીકરણ કરી બાંિે જૂથોિા પ્રાપતાાંકો પર
‘t’ ટેસ્ટ લાગ ુપાડી 0.05 કક્ષાએ સાથટકતા ચકાસતા કબડ્ડી અિે વોલીબોલ રમતિા ખેલાડીઓિા િરીરિા વજિમાાં કબડ્ડી રમતિા ખેલાડીઓનુાં જૂથ વધ ુસાથટક જોવા મળ્યુાં હત ુાં .જયારે િરીરિી
ઊંચાઈ, પગિી લાંબાઈ, હાથિી લાંબાઈમાાં કબડ્ડી રમતિા ખેલાડીઓ કરતાાં વોલીબોલ રમતિા ખેલાડીઓનુાં જૂથ ત્રણેય પાસાઓમાાં ચફડયાત ુસાર્બત થય ુહત.ુ
પ્રસ્તાવના આજિા આધશુિક યગુમાાં રમતગમત અિે િારીફરક શિક્ષણમાાં િોંધપાત્ર સધુારો થયો છે અિે
સમગ્ર શવશ્વમાાં શવશવધ સ્પધાટઓ સતત ચાલતી હોય છે. હવે તો રમતગમતિી શવશવધ માફહતીઓ સમાચાર પત્રોિી સ્પોટટસિી કોલમ દ્વારા ટી.વી.િી સ્પોટટસ ચેિલો દ્વારા તથા અન્ય પ્રચાર પ્રસાર માધ્યમો દ્વારા છેવાડાિા આમ માિવી સધુી પહોંચી િકે છે. શવશવધ રમતોમાાં ભાગ લેિારિી સાંખ્યા વધતી જાય છે.
રમત એ દરેક પ્રાણીમાાં રહલેી સાહજીક બાબત છે. દરેક સજીવિી તમામ પ્રવશૃિ હલિચલિ સ્વરૂપે પ્રદશિિત થાય છે. પ્રાણીમાત્ર જ્યાાં સધુી હલિચલિ કરે ત્યાાં સધુી તેિો વદૃ્ધદ્ધ અિે શવકાસ થતો િથી. રમત એ વદૃ્ધદ્ધ અિે શવકાસિી પ્રફિયાિે િડપી બિાવે છે. ઉપરાાંત આિાંદ અિે સખુિી લાગણીિો અનભુવ કરાવે છે. માટે જ વ્યક્ક્ત િારીફરક શિક્ષણ અિે રમતગમત પ્રત્યે આકષાટય છે. જેથી વ્યક્ક્તમાાં િારીફરક, માિશસક અિે સાાંવેર્ગક ગણુોિો શવકાસ થાય છે. ઉપરાાંત આિાંદ પ્રાપત કરી િકે, વ્યક્ક્ત જ્યારે રમતમાાં જોડાય છે ત્યારે એ બદુ્ધદ્ધિાળી પ્રાણી તરીકે શવશિષ્ટ્ટ દેખાવ કરવા

Volume: 3, Issue: 2, December 2016 ISSN –2349- 3992
Vyayam Setu: International Journal of Physical Education and Sports Sciences
14
પ્રયત્િ કરે છે. બીજાથી પોતે શે્રષ્ટ્ઠ છે તે બતાવવા પ્રયત્િિીલ રહ ેછે. જેથી ઉચ્ચકક્ષાએ પહોંચવા સતત કાયટિીલ બિે છે. અભ્યાિનો હતેઓુ
કબડ્ડી અિે વોલીબોલ રમતિા ખેલાડીઓિા વજિિી તલુિા કરવાિો હતે.ુ કબડ્ડી અિે વોલીબોલ રમતિા ખેલાડીઓિી ઊંચાઈિી તલુિા કરવાિો હતે.ુ કબડ્ડી અિે વોલીબોલ રમતિા ખેલાડીઓિા પગિી લાંબાઈિા તલુિા કરવાિો હતે.ુ કબડ્ડી અિે વોલીબોલ રમતિા ખેલાડીઓિા હાથિી લાંબાઈિી તલુિા કરવાિો હતે.ુ
સવષયપાત્રોની પિદંગી આ અભ્યાસિા હતે ુમાટે ગજૂરાત શવદ્યાપીઠિા કબડ્ડી રમતિા 12 અિે વોલીબોલ રમતિા
12 એમ કુલ 24 ખેલાડીઓિે શવષયપાત્રો તરીકે પસાંદ કરવામાાં આવ્યા હતા. માપનના ધોરણો
િરીરઅંગ પફરશમશત માટે િોર્જિ અિે જોન્સિ કસોટીિે માપિ ધોરણ તરીકે પસાંદ કરવામાાં આવી હતી. આંકડાકીય પ્રકિયા
કબડ્ડી રમત જૂથ અિે વોલીબોલ રમત જૂથિા વજિ, િરીરિી ઊંચાઈ, પગિી લાંબાઈ અિે હાથિી લાંબાઈિા પાસાઓિી તલુિા કરવા માટે ‘t’ કસોટી લાગ ુપાડી સાથટકતાનુાં સ્તર 0.05 પસાંદ કરવામાાં આવ્ય ુહત.ુ પકરણામો અને ચચાા
િારણી-1 કબડ્ડી અને વોલીબોલ રમતમા ંપિદંગી પામેલ ખેલાડીઓના શરીરનુ ંવજન કિોટીના મધ્યક,
મધ્યક તફાવત અને ‘t’ રેસશયો દશાાવતી િારણી
જૂથ આવશૃિ મધ્યક સરેરાિ શવચલિ
મધ્યક તફાવત ‘t’
કબડ્ડી 12 66.5 7.52 7.33 2.699*
વોલીબોલ 12 59.17 5.65 *સાથટકતાનુાં ધોરણ 0.05 કક્ષાએ ‘t’ = (22) = 2.074
ઉપરોક્ત સારણી-1 પરથી માલમુ પડે છે કે િરીરિા વજિ કસોટીમાાં કબડ્ડી રમતિા ખેલાડીઓિો મધ્યક 66.5 હતો અિે વોલીબોલ રમતિા ખેલાડીઓિો મધ્યક 59.17 હતો. જેિો મધ્યક તફાવત 7.33 તેમજ પ્રાપત થયેલ ‘t’ રેશિયો 2.699 હતો. જે 0.05 કક્ષાએ સાથટક થાય છે.

Volume: 3, Issue: 2, December 2016 ISSN –2349- 3992
Vyayam Setu: International Journal of Physical Education and Sports Sciences
15
આથી સ્પષ્ટ્ટ થાય છે કે કબડ્ડી અિે વોલીબોલ રમતિા ખેલાડીઓિા િરીર વજિ કસોટીમાાં સાથટક તફાવત જોવા મળેલ હતો.
િારણી-2 કબડ્ડી અને વોલીબોલ રમતમા ંપિદંગી પામેલ ખેલાડીઓની શરીરની ઊંચાઈ કિોટીના મધ્યક,
મધ્યક તફાવત અને ‘t’ રેસશયો દશાાવતી િારણી
જૂથ આવશૃિ મધ્યક સરેરાિ શવચલિ મધ્યક તફાવત
‘t’
કબડ્ડી 12 163.33 5.97 12.08 5.679*
વોલીબોલ 12 175.42 4.32 *સાથટકતાનુાં ધોરણ 0.05 કક્ષાએ (22) = 2.074
ઉપરોક્ત સારણી-2 પરથી માલમુ પડે છે કે િરીરિી ઊંચાઈ કસોટીમાાં કબડ્ડી રમતિા ખેલાડીઓિો મધ્યક 163.33 હતો અિે વોલીબોલ રમતિા ખેલાડીઓિો મધ્યક 175.42 હતો. જેિો મધ્યક તફાવત 12.08 તેમજ પ્રાપત થયેલ ‘t’ રેશિયો 5.679 હતો. જે 0.05 કક્ષાએ સાથટક થાય છે. આથી સ્પષ્ટ્ટ થાય છે કે કબડ્ડી અિે વોલીબોલ રમતિા ખેલાડીઓિી િરીરિી ઊંચાઈ કસોટીમાાં સાથટક તફાવત જોવા મળેલ હતો.
િારણી-3 કબડ્ડી અને વોલીબોલ રમતમા ંપિદંગી પામેલ ખેલાડીઓના પગની લબંાઈ કિોટીના મધ્યક,
મધ્યક તફાવત અને ‘t’ રેસશયો દશાાવતી િારણી
જૂથ આવશૃિ મધ્યક સરેરાિ શવચલિ મધ્યક તફાવત
‘t’
કબડ્ડી 12 95 3.67 9.25 5.509*
વોલીબોલ 12 104.25 4.515 *સાથટકતાનુાં ધોરણ 0.05 કક્ષાએ (22) = 2.074
ઉપરોક્ત સારણી-3 પરથી માલમુ પડે છે કે પગિી લાંબાઈ કસોટીમાાં કબડ્ડી રમતિા ખેલાડીઓિો મધ્યક 95 હતો અિે વોલીબોલ રમતિા ખેલાડીઓિો મધ્યક 104.25 હતો. જેિો મધ્યક તફાવત 9.25 તેમજ પ્રાપત થયેલ ‘t’ રેશિયો 5.509 હતો. જે 0.05 કક્ષાએ સાથટક થાય છે. આથી સ્પષ્ટ્ટ થાય છે કે કબડ્ડી અિે વોલીબોલ રમતિા ખેલાડીઓિી પગિી લાંબાઈ કસોટીમાાં સાથટક તફાવત જોવા મળેલ હતો.

Volume: 3, Issue: 2, December 2016 ISSN –2349- 3992
Vyayam Setu: International Journal of Physical Education and Sports Sciences
16
િારણી-4 કબડ્ડી અને વોલીબોલ રમતમા ંપિદંગી પામેલ ખેલાડીઓના હાથની લબંાઈ કિોટીના મધ્યક,
મધ્યક તફાવત અને ‘t’ રેસશયો દશાાવતી િારણી
જૂથ આવશૃિ મધ્યક સરેરાિ શવચલિ મધ્યક તફાવત
‘t’
કબડ્ડી 12 70 3.65 9.41 7.104*
વોલીબોલ 12 79.5 2.77 *સાથટકતાનુાં ધોરણ 0.05 કક્ષાએ (22) = 2.074
ઉપરોક્ત સારણી-4 પરથી માલમુ પડે છે કે હાથિી લાંબાઈ કસોટીમાાં કબડ્ડી રમતિા ખેલાડીઓિો મધ્યક 70 હતો અિે વોલીબોલ રમતિા ખેલાડીઓિો મધ્યક 79.5 હતો. જેિો મધ્યક તફાવત 9.41 તેમજ પ્રાપત થયેલ ‘t’ રેશિયો 7.104 હતો. જે 0.05 કક્ષાએ સાથટક થાય છે. આથી સ્પષ્ટ્ટ થાય છે કે કબડ્ડી અિે વોલીબોલ રમતિા ખેલાડીઓિી હાથિી લાંબાઈ કસોટીમાાં સાથટક તફાવત જોવા મળેલ હતો.
ગજૂરાત શવદ્યાપીઠિા આંતર શવશ્વશવદ્યાલય કક્ષાએ પસાંદગી પામેલ કબડ્ડી અિે વોલીબોલ રમતિા ખેલાડીઓમાાં િરીરિા વજિમાાં કબડ્ડી રમતિા ખેલાડીઓનુાં વજિ વોલીબોલ રમતિા ખેલાડીઓ કરતા વધ ુજોવા મળ્યુાં હત ુાં. જયારે િરીરિી ઊંચાઈ, પગિી લાંબાઈ, હાથિી લાંબાઈમાાં કબડ્ડી રમતિા ખેલાડીઓ કરતાાં વોલીબોલ રમતિા ખેલાડીઓનુાં જૂથ ત્રણેય પાસાઓમાાં ચફડયાત ુસાર્બત થય ુહત.ુ િદંર્ાગ્રથંો
1. કમલેિ ,એમ,.એલ (૧૯૯૪) મેથોડોલોજી ઓફ રીસચટ ઈિ ફફર્િકલ એજ્યકેુિિ એન્ડ સ્પોટટસ ,ફદલહીીઃ મેરોપોલીટિ બકુ કાંપિી ,
2. કાંસારી ,એમ .એસ (૧૯૮૨), િારીફરક શિક્ષા મેં પરીક્ષા એવમ માપિ ,રાજપીપળાીઃ પ્રકાિક ગજુરાત વ્યાયામ પ્રચારક માંડળ,
3. ગોફહલ ,કરણશસિંહ રૂ ,.િાહ ,મકુુન્દભાઈ ઓ .અિે પટેલ ,હષટદભાઈ ઈ,.(૨૦૦૩) વ્યાયામ શવજ્ઞાિ કોષ, રાજપીપળાીઃ ગજુરાત વ્યાયામ પ્રચારક માંડળ ,
4. જોહન્સિ ,બેરી એલ અિ ે િેલસિ, કે.(૧૯૮૮) પ્રકે્ટીકલ મેિરમેન્ટ ફોર ઈવેલયએુિિ ઈિ ફફર્િકલ એજ્યકેુિિ ,ફદલહીીઃ સરુજીત પબ્બ્લકેિિ,
5. ઢુલ, દેવેન્દ્રશસિંહ (૧૯૯૭) ,િારીફરક શિક્ષણ તત્વ એવમ ઈશતહાસ વ સમસ્તખેલ મેદાિ એવમ શિયમ, ફદલહીીઃ ફે્રન્ડિ પબ્બ્લકેિિ.
6. કાંસલ, દેવીન્દર કે(૧૯૯૬) ,ટેસ્ટ એન્ડ મેિરમેન્ટ , ન્ય ુફદલહીીઃ ડી.વી.એસ .પબ્બ્લકેિિ ,
Volume: 3, Issue: 2, December 2016 ISSN –2349- 3992
Vyayam Setu: International Journal of Physical Education and Sports Sciences
17
SPORTS: A VIGOROUS SCENARIO FOR EMPOWERING WOMEN IN
NORTH EAST INDIA
Deba Ranjan Duarah,
Ph.D. Scholar,
Swarnim Gujarat Sports University,
Sector 15, Gandhinagar, Gujarat 382016.
Bhanu Pratap Prajapati,
P.G. Diploma in Yoga,
Lakshmibai National Institute of Physical Education,
Gwalior, Madhya Pradesh 472002
ABSTRACT
In this modern era sport has come to play an increasingly important role in society. With
the development of technology and civilization, maintaining fitness and recovering from injury
and diseases become more important as the competition and popularity of sports event grow.
Geographically, men and women share the same space, but everywhere women are accorded a
lower status than men in the world. There is a perception that the status of women is higher in the
North Eastern Region of the country in comparison with the status of women in all Indian average.
In this study, an attempt has been made to look around the status and prospects of women in the
field of Game & Sport of the North Eastern Region of India. It is of course a great deal to find out
the prospects and status of women in this region, comparatively better than the rest of the country
only in some selected indicators. Women from North Eastern states of India have made wonderful
progress in the past few decades. In national and international level of sports competitions, women
of NER played a major role in many difference event or discipline and occupies a high level of
achievements with their marvellous performance that’s unbeatable.
Keywords – Sport, Status, Prospects, North Eastern Region of India.
INTRODUCTION
In this modern era sport has come to play an increasingly important role in modern
society, through its origins data back to the dawn of man. Throughout human history man’s
ability to survive has depend upon his/her physical capacities. The speed, skill and strength
early man needed for survival were transformed in to games of skill during times of peace and
as cultivation progressed. As contest becomes more organized, more highly trained and skilled
athletes competed in teams. Maintaining fitness and recovering from injury and diseases
become more important as the sophistication and popularity of sports event grew.
Though geographically, men and women share the same space, but everywhere women
are accorded a lower status than men in the world. From the time of independent India, the
North Eastern Region (NER) of India, the province that received less attention and a deprived
corner though natural abilities & talents are worthy. The North Eastern Region (NER) of India
has been considered as a backward region in terms of growth in per capita income. However,
there is a perception that the status of women is higher in the North Eastern Region of the
country in comparison with the status of women in all India average. If we look back to the
great historian’s view, the position of women in the society of ‘Bar Axom’ (wider Assam, the
Ahom kingdom territory) in pre & post independent time of India – Women were placed under
no disability in their social life and activities. The general character of women is summed up
thus: “The women from a striking contrast to men – they are very fair indeed; fairer than any
race I have seen in India; and many of them would be acknowledged beautiful in any part of
the world. I don’t mean Hindustani beauty properly so called; the Assamese women have a
form, a feature closely approaching the European……” Women were refined and enlightened
and active and versatile in their accomplishment. Some gallant Ahom women, like Mula-
Gabharu did actual fighting in the battle-field. Sometimes they were engaged as spies. They

Volume: 3, Issue: 2, December 2016 ISSN –2349- 3992
Vyayam Setu: International Journal of Physical Education and Sports Sciences
18
were also expert weavers. (Gait, E.A, A History of Assam, Sixth Indian Reprint 2011. p. 258-
259)
Women now have opportunities in the field of Political, Social, Educational, Economic
& Sports that were denied them for centuries, however, these rights are not enjoyed equally
around the world but slowly for too slowly in some nations changed for women is beginning
to be felt. Over the last twenty years there has been an increase in women’s participation in
sport and physical activity, at per men. There has been a growing understanding that
participation in sports and movement activities is not only a right in itself but also be used to
promote health awareness, education, social status, fame and popularity, political
development, and peace and self-defence, and more importantly carrier.
The marvellous performance in Commonwealth Game, Asian Game and in Olympic by
NER Indian women athletes are raising a new horizon for upcoming athlete and motivating
strongly them to join the splendour life of sports.
OBJECTIVE OF THE STUDY
This paper attempts to focus the scenario of sports and its’ potentiality and prospects of
north east region’s women of India. The main objective is to review the performance of north-
east region women in the field of sports.
METHODOLOGY
This paper is primarily based on the researchers’ study of published works. The
secondary data is collected from the various books and papers of some authors and researchers.
The researcher has also tapped the electronic sources using the internet and World Wide Web.
STATUS OF WOMEN, NER
The status of women can be judged by some indicators. To measure the status of women
a composite index is constructed by the Population Crisis Committee (PCC) and used by the
World Bank and the United Nations which focuses on indicators measuring health, education,
employment, marriage and childbearing and social equality. Rustogi (2004) tried to measure
women’s status with the help of a diverse set of indicator. In this study, an attempt has been
made to look around the status and prospects of women in the field of Sports in North Eastern
Region (NER) of India. It is of course a great deal to find out the prospects and status of women
in this region, comparatively better than the rest of the country only in some selected
indicators. The indicators reveal that women have a very low degree of freedom of movement
and low level of control over themselves in North Eastern Region, India.
The region located on the north east part of India are regarded as the North Eastern
Region (NER) and it consists of Arunachal Pradesh, Assam, Manipur, Meghalaya, Mizoram,
Nagaland, Tripura, and Sikkim. Generally, it is thought that the status of women is
comparatively better in tribal society (Handsdak, 2012; Burman, 2012). The tribal people are
more in numbers in the NER. The scheduled tribe are 94.75 per cent in Mizoram, 87.70 per
cent in Nagaland, 85.53 per cent in Meghalaya, 63.66 per cent in Arunachal Pradesh, 34.41
per cent in Manipur, 30.95 per cent in Tripura, and 12.82 per cent in Assam (Zahol, 2010).
Moreover, there is matrilineal system (The matrilineal societies are those societies where
property is transmitted from mother to daughter) in Meghalaya. Therefore, there is a
perception that the status of women is better in the states of the North Eastern Region of the
country in comparison with the status of women in rest of India.
Though, NER is richest and proud of many natural resources and geographical asset, but
as compared with other states of India, in some specific sight, the region gets less attention
Volume: 3, Issue: 2, December 2016 ISSN –2349- 3992
Vyayam Setu: International Journal of Physical Education and Sports Sciences
19
and importance for development from the central government along with state govt. itself too.
Due to lack of public awareness, consciousness and deep knowledge about govt. plan, policy,
project, scheme, etc. are not properly implemented; and the major affects by political pressure,
corruption, migration & immigration, drug addiction, terrorism; some natural calamities like
flood, storm; diseases like malaria, HIV-AIDS, Dengue, Pox, etc. are the main drawback.
SPORT AND WOMEN Technically, Sports is an institutionalized physical exertion or the use of relatively
complex physical skill by individuals whose participation is motivated by combination of the
intrinsic satisfaction associated with the activity itself and the external rewards earned through
participation (Jay,J. coakley). Sport is an organized, competitive form of play, but a sport is
never simple play; the competitive aspect is essential to the nature of sport.
There are physiological, anatomic and psychological difference between males and
females, but these difference make participation in all forms of athletes no less beneficial for
females then for males. The average women’s performance in athletics is below that of man’s
but some women athletes can beat the performance of most male. The important issue is
whether women should compete in athletics and experience the satisfaction and joy of
knowing that they are the best in class and event. Sports participation is associated with less
risk of body dissatisfaction and disordered eating among adolescent girl. Exercise has been
shown to improve cardiovascular fitness, muscle strength, body composition, fatigue, anxiety,
depression, self-esteem, happiness and several components of quality of life (physical,
functional and emotional) in cancer survivors, ( Brown, J.K. Etal, 2003). Women who
participate the same well-designed strength training programme as men do benefit from bone
and soft tissue modelling, increase lean body mass, decrease fat and enhance self-confidence.
SPORTS, WOMEN & NER
Women from North Eastern states of India have made wonderful progress in the past
few decades. Apart from the regular faces that we see on the national media, there are
numerous other women achievers. If it is compared with the other region states of India the
North East Region women’s performance in sports is more appreciative. In national and
international level sports competitions, women of NER played a major role in many different
event or discipline and occupies a high level of achievements with their remarkable marvellous
performance. Women of Manipur, Nagaland, Assam, Arunachal and Tripura states put
forward steps in this regards and able to achieve a higher level of position in national and
international competitions. Players like M. C. Mary kom (Boxing), Kunju Rani Devi(weight
lifting), Thingbaijam Sarita (Body building), Bombayla Devi Laishram (Archary), Nganbam
Soniya Chanu (weight lifting) Chekrovolu Swuro (archery, Nagaland), Sushila Chanu and
Anuradha Devi Thokchum (Hockey), Saikhom Mirabai (Weight lifting) Chekrovolu Swuro
(Archery), Anshu Jamsenpa (Arunachal Pradesh), Wansuk Myrthong (Mountaining), Dipa
Karmakar ( Gymnastics, Tripura), Susan Das Chaudhary,(Tennis, Assam), Monalisha Baruah
(T.T, Assam), Tayebunnessa (Athletics, Assam) and many others are glory, proud and forever
inspiration of Indian.
CONCLUSION
In the ethnically and culturally diverse Northeast India, one facet which is
homogeneous and unique is the region’s status of women in the society. This aspect usually
goes unnoticed and has thereby remain unexplored. Since ages the north eastern India women
have shared a significant social space as compared to most of their contemporaries living in

Volume: 3, Issue: 2, December 2016 ISSN –2349- 3992
Vyayam Setu: International Journal of Physical Education and Sports Sciences
20
other part of the Indian sub-continent, their commendable participation in and contribution to
the sports, social, cultural, economic and political affairs of the state have not received the
recognition it deserves.
We should be concerned about gender, girls’ sports and physical education because
access and regular participation is a fundamental human right. It is a fundamental human right
because regular participation in physical activity is an essential component of a healthy
lifestyle (Beutler, 2008; Biddle, Gorely and Stensel, 2004; UNESCO, 1978). Programmes that
prepare children for lifelong physical activity must be formally organised, well designed and
professionally led. Quality, school sports & physical education programmes provide young
people with opportunities to develop the values, knowledge and skills they need to lead
physically active lives, build self-esteem, and to promote and facilitate physical activity in the
lives of others.
In addition to their role in contributing to public health, and consistent with Articles 2
and 3 of the UNESCO International Charter of Physical Education and Sport (UNESCO,
1978), physical education and sport can also provide a universal language to bridge social,
racial, gender and religious divides. In so doing, Sports & physical education has the potential
to promote peace, develop personal qualities essential to democracy such as leadership,
tolerance, solidarity, cooperation and respect, and provide a means of inclusion for
marginalised individuals and groups. It is total means that sports & physical education bestows
the experience of equality, freedom and a dignifying means for empowerment, particularly for
girls and women.
Supporting this position, well designed physical education and sport programmes can
contribute to the achievement of all Millennium Development Goals, in particular as a tool for
child and youth development and as a means of promoting gender equality and empowerment
for girls and women (Right To Play, 2008; de Vries, 2008).
REFERENCES
1. Gait, S. E., (2011) A History of Assam, Surjeet Publications, Delhi, India.
2. Kamlesh. M. L, (2009) UGCNET Digest on Paper Physical Education, N. Delhi, Khal Sahitya
Kendra.
3. Das, Ira. (2013) Status of Women: North Eastern Region of India Versus India, International
Journal of Scientific and Research Publications, Volume 3, Issue 1,
4. Burman, J.J Roy, (2012) Status of Tribal Women in India, Mainstream, Vol. L, No.12.
5. Gupta, Vibha. (2014) Indian Scenario For Promotion Of Physical Education, International
Journal in IT and Engineering, Vol.2 Issue-11.
6. Kirk, David (2012). Empowering Girls and Women through Physical Education and Sports -
Advocacy Brief. Bangkok: UNESCO Bangkok.
7. www.ijsrp.org;
8. http://www.ijmr.net.in


Volume: 3, Issue: 2, December 2016 ISSN –2349- 3992
Vyayam Setu: International Journal of Physical Education and Sports Sciences
22
the face, and eyes may close shut, along with many more processes. It is not just the fitness and
training that is required for excellence but also certain strong mental abilities like anticipation
ability, ability to take decisions quickly and act accordingly for successful sports participation. We
often see and read in newspapers articles about football players who are good sprinters. Good
anticipation and reaction times are extremely important psychological skills needed for gaining
advantage over opponents during a crucial match and those nerve-wrecking closing moments of a
game.
Psychologists have named three basic kinds of reaction times (Luce, 1986; Welford, 1980
[1], [2]: In simple reaction time experiments, there is only one stimulus and one response. For
example, reaction to sound or light (one at a time) measures simple reaction time.
In recognition reaction time experiments, there are some stimuli that should be responded to (the
'memory set'), and others that should get no response (the 'distractor set'). There is still only one
correct response. 'Symbol recognition' and 'tone recognition' are both recognition experiments.
In choice reaction time experiments, the tester gives a response that corresponds to the stimulus,
such as pressing a key corresponding to a letter or the light that appears on the screen.
The objective of the present study was to investigate the effect of yoga protocol on the choice
visual reaction time of soccer players. A null hypothesis was formulated, meaning there will be no
significant difference in the pre- and post-test scores of the footballers after yoga training.
PROCEDURE In the present study, a basic information questionnaire (seeking information regarding age,
resting heart rate, height, body mass, body mass index, grip strength and fat percentage) was
circulated amongst the footballers to be filled up by each player. The body mass index, body mass,
fat percentage was measured manually by the researchers.
A total of 40 state and national level male footballers (mean age of 18.5 years) were
randomly divided into control and experimental groups. An Audio Visual Reaction timer machine
was used to measure the choice visual reaction time (CVRT in seconds) of all the soccer players
on day-one. The player would sit opposite the tester, both separated by a two feet high plate so that
the player could not see the corresponding button being pressed by the tester. The player was
expected to respond by switching off the three colored LED lights, whichever glows (one at a time)
as quickly as possible. The best reaction time of the three trials was recorded for each player. Only
the experimental group was being imparted following 45 minutes yoga protocol for six-days a
week for total of 45 days at the end of their regular morning training session:
I. Yogaasana(Yoga Postures) 26 minutes
(i) Taadaasana (ii) Vrikshaasana (iii) Pada-hastaasana (iv) ArdhaChakraasana (v)
Trikonaasana (vi) Bhadraasana / Baddhakonaasan (vii) Vajrasana/Veerasana (viii)
Ushtraasana/ Ardha ushtrasana (ix) Shashankaasan (x) UtthanaMandukasana (xi)
Marichyaasana / Vakraasana (xii) Makaraasana (xiii) Bhujangaasana (xiv) Shalabhaasana (xv)
Setu bandhasana (xvi) Utthana paadaasana (xvii) Ardha Halasana (xviii) Pawana muktaasana
(xix) Shav asana
II. Kapalbhati (forced nostril exhalation, 3 cycles of 40 strokes each) 3 minute
III. Pranayama: 6 minutes
(i) Anuloma Viloma Pranayama (5 repetitions)
(ii) Sheetali Pranayama (5 repetitions)
(iii) Bhraamari Pranayama (5 repetitions)
IV. Meditation in supine lying down posture (with closed eyes) 10 minutes
The CVRT of both control and experimental groups were then measured again after 45
days. Each player was allowed to take three tests and the best of the three was recorded.
Volume: 3, Issue: 2, December 2016 ISSN –2349- 3992
Vyayam Setu: International Journal of Physical Education and Sports Sciences
23
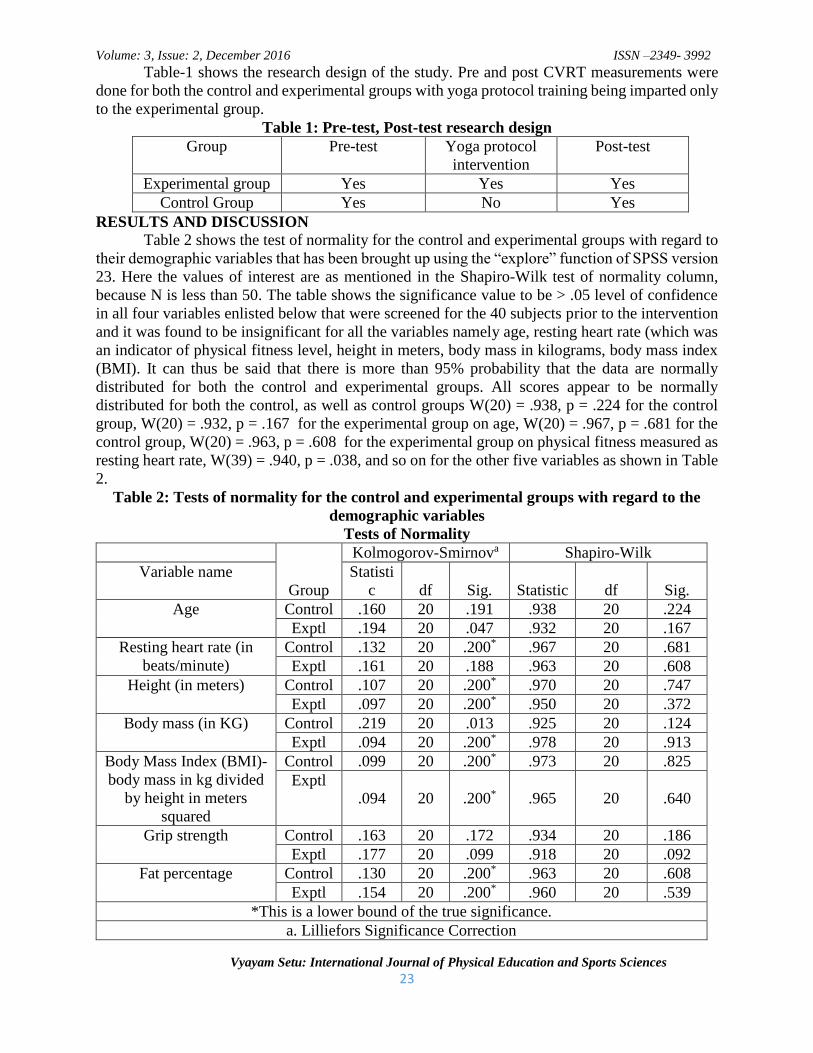
Table-1 shows the research design of the study. Pre and post CVRT measurements were
done for both the control and experimental groups with yoga protocol training being imparted only
to the experimental group.
Table 1: Pre-test, Post-test research design
Group Pre-test Yoga protocol
intervention
Post-test
Experimental group Yes Yes Yes
Control Group Yes No Yes
RESULTS AND DISCUSSION
Table 2 shows the test of normality for the control and experimental groups with regard to
their demographic variables that has been brought up using the “explore” function of SPSS version
23. Here the values of interest are as mentioned in the Shapiro-Wilk test of normality column,
because N is less than 50. The table shows the significance value to be > .05 level of confidence
in all four variables enlisted below that were screened for the 40 subjects prior to the intervention
and it was found to be insignificant for all the variables namely age, resting heart rate (which was
an indicator of physical fitness level, height in meters, body mass in kilograms, body mass index
(BMI). It can thus be said that there is more than 95% probability that the data are normally
distributed for both the control and experimental groups. All scores appear to be normally
distributed for both the control, as well as control groups W(20) = .938, p = .224 for the control
group, W(20) = .932, p = .167 for the experimental group on age, W(20) = .967, p = .681 for the
control group, W(20) = .963, p = .608 for the experimental group on physical fitness measured as
resting heart rate, W(39) = .940, p = .038, and so on for the other five variables as shown in Table
2.
Table 2: Tests of normality for the control and experimental groups with regard to the
demographic variables
Tests of Normality
Group
Kolmogorov-Smirnova Shapiro-Wilk
Variable name Statisti
c df Sig. Statistic df Sig.
Age Control .160 20 .191 .938 20 .224
Exptl .194 20 .047 .932 20 .167
Resting heart rate (in
beats/minute)
Control .132 20 .200* .967 20 .681
Exptl .161 20 .188 .963 20 .608
Height (in meters) Control .107 20 .200* .970 20 .747
Exptl .097 20 .200* .950 20 .372
Body mass (in KG) Control .219 20 .013 .925 20 .124
Exptl .094 20 .200* .978 20 .913
Body Mass Index (BMI)-
body mass in kg divided
by height in meters
squared
Control .099 20 .200* .973 20 .825
Exptl .094 20 .200* .965 20 .640
Grip strength Control .163 20 .172 .934 20 .186
Exptl .177 20 .099 .918 20 .092
Fat percentage Control .130 20 .200* .963 20 .608
Exptl .154 20 .200* .960 20 .539
*This is a lower bound of the true significance.
a. Lilliefors Significance Correction

Volume: 3, Issue: 2, December 2016 ISSN –2349- 3992
Vyayam Setu: International Journal of Physical Education and Sports Sciences
24
As shown in Table 2, CVRT pre-mean value for the control group was 308.20 ± 12.27
seconds and for the experimental group it was 310.85 ± 16.75 seconds. After 45 days of yoga
protocol, the control group CVRT value was 306.45 ± 11.96 seconds, while for the experimental
group it was 242.45 ± 42.94 seconds.
Table-3: Group statistics for the control and experimental groups showing mean and
standard deviations of dependent variable Choice visual reaction time (CVRT) on day-one and
post-45 days.
Variable Group Mean Std. Deviation
CVRT pre Control 308.20 12.27
Exptl 310.85 16.75
CVRT post Control 306.45 11.96
Exptl 242.55 42.94
Fig.1: Bar chart showing Mean and standard deviation of reaction times on pre and post
yoga protocol for control and experimental groups:
Table 4 shows Levene's test that examines the equality of variances. The t-test outcome for
CVRT on day one indicates that no significant difference in reaction times were recorded (p =
.077). Complete statistical notation is: t (38) = .571, p = .077 (two-tailed). ‘Equal variance is
assumed’. In the case of CVRT on day-45 (F = 29.66, p = .000) because p<.05 that ‘Equal variance
is not assumed’. The t-test outcome for CVRT on day-45 indicates that there was a significant
difference in choice reaction time (p = .000). Complete statistical notation is: t (21.93) = 6.410, p
= .000 (two-tailed).
Table 4: Independent samples t-test showing Levene's Test for Equality of Variances
Independent Samples Test
Levene's Test for
Equality of Variances t-test for Equality of Means
F Sig. t df
Sig. (2-
tailed)
CVRT-day-1 Equal variances
assumed 3.31 .077 -.57 38 .57
Equal variances not
assumed -.57 34.82 .57
CVRT after 45
days
Equal variances
assumed 29.66 .00 6.41 38 .00
Equal variances not
assumed 6.41 21.93 .00

Volume: 3, Issue: 2, December 2016 ISSN –2349- 3992
Vyayam Setu: International Journal of Physical Education and Sports Sciences
25
Table 5 shows mean and standard deviation of the control and experimental groups on
difference of CVRT (CVRT values in seconds on day-one minus the value on day-45). For the
control group it was 1.15 ± 1.38 and for the experimental group it was 42.10 ± 28.68.
Table 5: Univariate analysis of variance showing mean and standard deviation of the
control and experimental variables on difference of CVRT (CVRT values in seconds on day-one
minus the value on day-45)
Descriptive Statistics
Dependent Variable: Difference of CVRT on day-one and day-45
Group Mean Std. Deviation N
Control 1.15 1.38 20
Experimental 42.10 28.36 20
Total 21.62 28.68 40
Table 6 shows the effect size and power of the outcome upon the application of the
independent t-test. Though this is an additional outcome supplementing the main outcomes of
independent t-tests for the reaction times, to ensure that we have a balanced view, the magnitude
of the outcome through effect size has also been reported here since an underpowered study
increases the likelihood that we make Type II errors. With the aim to discover the true effects on
at least 80% of occasions and to help achieve this, we set a target power of 0.80 for our present
study. Observed power here is 1.00, which is higher than .80 and which is a widely accepted and
adopted as the benchmark here. It can thus be concluded that the study had sufficient power to
detect any significant effects if they exist. The effect size, as displayed by Partial Eta Squared, is
.523 that means that around 52% of the variation in CVRT is explained by the difference of the
CVRT value, which is considered a large effect size.
Table 6: Tests of Between-Subjects Effects and power of the outcome for difference of
CVRT on day-one and day-45
Dependent Variable: Difference of CVRT on day-one and day-45
Source
Type III
Sum of
Squares df
Mean
Square F Sig.
Partial
Eta
Squared
Observed
Powerb
Corrected
Model 16769.02a 1 16769.03 41.58 .000 .523 1.00
Intercept 18705.63 1 18705.63 46.38 .000 .550 1.00
Group 16769.03 1 16769.03 41.58 .000 .523 1.00
Error 15324.35 38 403.27
Total 50799.00 40
Corrected
Total 32093.38 39
a. R Squared = .523 (Adjusted R Squared = .510),
b. Computed using alpha = .05
For about 120 years, the average mean simple reaction times for college-age individuals
have been about 0.19 sec for light stimuli and about .16 seconds for sound stimuli (Galton, 1899;
Fieandt et al., 1956 [4], [5]; Welford, 1980, Brebner and Welford, 1980 [2], [3]).
Stephen Draper et al. (2010) [6] studied the effect of acute, short-duration exercise on the
performance of simple and choice visual reaction and movement times of 12 physically active

Volume: 3, Issue: 2, December 2016 ISSN –2349- 3992
Vyayam Setu: International Journal of Physical Education and Sports Sciences
26
males. Those doing moderate and heavy physical exercise were found to have shorter simple and
choice reaction times.
Hernán Ponce-Bravo (2015) [7] studied the impact of a resistance-band functional exercise
program, compared with a recreational exercise program, on physical fitness and reaction times in
persons older than 60 years. Their findings indicated that a functional exercise program using a
resistance band improves fitness and cognitive performance, as displayed by reaction time analysis
in healthy older adults.
Overall, the findings of the present study extend the hypothesis that yoga practice improves
choice visual reaction time. Though, the precise psychological mechanism by which yoga protocol
improves the CVRT has not been examined in the present study, although earlier findings suggest
that by enhancing alertness and improving attention through yoga may help to improve the CVRT
of young male soccer players. Besides the objectivity of the present study being seen as a major
advantage, a further study using a larger sample and cross over studies are recommended to
substantiate this speculation.
CONCLUSION It can therefore be concluded that there was a significant decrease in the simple visual
reaction time among the experimental group post yoga protocol. CVRT of yoga protocol
experimental group also showed significant decrease after 45 days of yoga protocol. The control
groups did not show statistically significant improvement in the choice visual reaction time. The
effect size was more than 52% for CVRT, indicating that the effect of the treatment was highly
significant. The power of the study was also found to be high (>.80).
REFERENCES
1. Luce, R. D. (1986) Response Times: Their Role in Inferring Elementary Mental
Organization, Oxford University Press, New York.
2. Welford, A. T. (1980) Choice reaction time: Basic concepts. In A. T. Welford (Ed.),
Reaction Times. Academic Press, New York, pp. 73-128.
3. Brebner, J. T. and A. T. Welford. (1980). Introduction: an historical background sketch. In
A. T. Welford (Ed.), Reaction Times. Academic Press, New York, pp. 1-23.
4. Galton, F. (1899). On instruments for (1) testing perception of differences of tint and for (2)
determining reaction time. Journal of the Anthropological Institute.
5. Fieandt, K. von, Huhtala A, Kullberg P. and Saarl K.(1956). Personal tempo and phenomenal
time at different age levels. Reports from the Psychological Institute, No. 2, University of
Helsinki.
6. Stephen Draper, Terry Mc Morris and Parker John K. (2010). Effect of acute exercise of
differing intensities on simple and choice reaction and movement times. Psychology of Sport
and Exercise, 11, 536-541
7. Ponce-Bravo Hernán et.al (2015) Influence of Two Different Exercise Programs on Physical
Fitness and Cognitive Performance in Active Older Adults: Functional Resistance-Band
Exercises vs. Recreational Oriented Exercises. Journal of Sports Science and Medicine, 14,
716 – 722

Volume: 3, Issue: 2, December 2016 ISSN –2349- 3992
Vyayam Setu: International Journal of Physical Education and Sports Sciences
27
A COMPARITIVE STUDY OF ANTHROPOMETRIC COMPONENTS OF
PLAYERS PARTICIPATED AT STATE LEVEL IN YOGA AND
MALLAKHAMBA IN KHEL MAHAKUMBH
Manishkumar V Patel Dr. K. J. Gohil
Ph.D. Scholar Associate Professor
Swarnim Gujarat Sport University Shree Chhotubhai Purani College of Physical Education
Sector 15, Gandhinagar Gujarat 382016 Rajpipla, Distt Narmada, Gujarat 393146
ABSTRACT The objective of this research study was comparative study of anthropometric components
of players participated at state level in Yoga and Malkhamb in Khel Mahakumbh. For this research
study 15 players of Yoga and 15 players of Malkhamb who participated at state level in Khel
Mahakumbh from open age group were selected as subjects. Hence total of 30 subjects were
selected. In Anthropometric components, dimensions of chest and waist were measured using steel
tape. The “t” was applied on the data collected at 0.05 level for the significance and it was observed
that there was significant difference in the dimension of chest in both the groups. Whereas there
was no difference in the dimension of waist in both groups.
INRODUCTION
The word “Anthropometry” is derived from Greek language. In Greek, Anthropos means
’man’ and metreein means ‘to measure’. So, in Anthropometric study, Posture, general body
measurements, measurements of physical dimension and skin measurement are included.
Anthropometry is a prominent method of measurement since ancient time. The word
Anthropometry was made famous by Quetelet, a French mathematician. But, the Anthropometric
research work was made famous by in Chromewell 1860. After doing research on the growth
children of age group 8-14 years, he concluded that after the age of around 11 to 14, boys were
more heighted and muscular built. But, after the age of 14 years, girls were more heighted and
heavier and in this duration growth rate was observed for longer period in boys than that of girls.
OBJECTIVE
To compare the dimensions of chest of players participated at state level in Yoga and
Malkhamb.
To compare the dimensions of waist of players participated at state level in Yoga and
Malkhamb.
SELECTION OF SUBJECTS
15 players each from Yoga and Malkhamb participated at state level in Khel Mahakumbh
were selected as subjects.
MEASUREMENT STANDARDS
In Anthropometric factors, for the measurement of dimensions of chest and waist a Steel
Tape was used.
STATISTICAL PROCESS
On the data collected of players participated at state level in Yoga and Mallakhamba, “t”
test was applied and the difference in mean was tested at 0.05 level for significance.

Volume: 3, Issue: 2, December 2016 ISSN –2349- 3992
Vyayam Setu: International Journal of Physical Education and Sports Sciences
28
RESULTS OF STUDY
Results can be seen in following tables.
Table – 1
Table showing Mean of chest dimension, mean difference and “t” ratio of the players who
participated at state level in Yoga and Malkhamb in Khel Mahakumbh Group Number of
Subjects
Mean STANDARD
DEVIATION
Mean
Difference
‘t’
Yoga 15 74.533 7.008 5.4 2.322*
Malkhamb 15 69.133 5.655
*Significance standard at 0.05 level ‘t’ = (28) 2.048
From Table – 1, it can be observed that in the test of chest dimension, the mean of the
players of Yoga was 74.533 and that of the players of Malkhamb was 69.133. The mean difference
was observed to be 5.4. The ‘t’ ratio was 2.322 which was significance at 0.05 level. Therefore it
is clear that, there was significant difference in the chest dimension of players of Yoga and
Malkhamb.
Table – 2
Table showing Mean of waist dimension, mean difference and “t” ratio of the players who
participated at state level in Yoga and Malkhamb in Khel Mahakumbh Group Number of
Subjects
Mean STANDARD
DEVIATION
Mean
Difference
‘t’
Yoga 15 77.4 9.272 4.4 1.473
Malkhamb 15 73 6.917
*Significance standard at 0.05 level ‘t’ = (28) 2.048
From Table – 2, it can be observed that in the test of waist dimension, the mean of the
players of Yoga was 77.4 and that of the players of Malkhamb was 73. The mean difference was
observed to be 4.4. The ‘t’ ratio was 2.322 which was insignificant at 0.05 level. Therefore it is
clear that, there was insignificant difference in waist dimension of players of Yoga and Malkhamb.
CONCLUSION
There was significant difference in chest dimension of the players of Yoga and Malkhamb.
There was no difference in the waist dimension of the players of Yoga and Malkhamb.
REFERENCES
1. Kansal, Devinder K.(1996), Test and Measurement, New Delhi: D.V.S. Publication.
2. Kasundra Prabhulal M. and Patel Kantibhai R. (2010), Sharirik Yogyata ane Sukhakari,
Gandhinagar : Rama Prakashan.
3. Verma, Prakash J. (2002) A Text Book of Sports Statistic, Gwalior : Venus Publication.

Volume: 3, Issue: 2, December 2016 ISSN –2349- 3992
Vyayam Setu: International Journal of Physical Education and Sports Sciences
29
EFFECT OF TRAINING WITH AEROBICS AND SPECIAL EXERCISE ON
ANTHROPOMETRIC MEASUREMNET OF WORKING WOMEN
Meeta R. Vyas,
Ph. D Research Scholar,
Swarnim Gujarat Sports University, Sector 15,
Gandhinagar, Gujarat 382016.
Prof. Jamnadas K. Savaliya,
Dean,
Faculty of Phy. Edu. & Sports,
Gujarat Vidyapith Sadara,
Gandhinagar 382320
ABSTRACT
The purpose of this study is to see Effects of training with aerobics and special exercises
on Anthropometric measurement of working women. To know the status of Anthropometric
measurement of working women .To know the effect of aerobics and special exercise on
Anthropometric measurement. To know the overall effects of Aerobics and special exercise on
working women. For this study women’s from Gandhinagar city were selected. The age group was
between 30-45 years. In this research work Anthropometric measurement was taken with anthro
tape and measurement was taken of butt, belly and thigh circumference. For this study there were
three groups Group A – Aerobics 2) Group B- Specific 3) Group –C Control. For this study
program of exercise was 12 weeks. To find out the effect of aerobics on Anthropometric
measurement of working women “F’ test was taken for analysis From this research analysis shows
that effect of aerobics and special exercise on anthropometric measurement was significant then
control group .
Key Words :- Aerobics, Anthropometric measurement, Butt, Belly and Thigh
INTRODUCTION Today, anthropometry plays an important role in industrial design, clothing design,
ergonomics and architecture where statistical data about the distribution of body dimensions in the
population are used to optimize products. Changes in life styles, nutrition and ethnic composition
of populations lead to changes in the distribution of body dimensions (e.g. the obesity epidemic),
and require regular updating of anthropometric data collections. Anthropometry is the most
common technique used to assess the presence and degree of protein-energy malnutrition.
Anthropometry is the measurement of body parameters to indicate nutritional status.
Anthropometry can be used to measure an individual to determine if he or she needs nutrition
intervention or it can be used to measure many individuals to determine if malnutrition is a problem
in a population.
STATEMENT OF PROBLEM
The purpose of this study is to see Effects of training with aerobics and special exercises
on the Anthropometric measurement of working women
OBJECTIVES
1) To know the status of Anthropometric measurement of working women
2) To know the effect of aerobics and special exercise on Anthropometric measurement
3) To know the overall effects of Aerobics and special exercise on working women

Volume: 3, Issue: 2, December 2016 ISSN –2349- 3992
Vyayam Setu: International Journal of Physical Education and Sports Sciences
30
METHOD
60 women of Gandhinagar city were selected randomly. There was Three groups.1) Group
A – Aerobics 2) Group B- Specific exercise 3) Group –C Control Group A was given aerobics
Training Group B was given special excises of Butt, Belly and Thigh.Following physiological
aspects was selected for this study Anthropometric measurement of body parts like Butt Belly and
Thigh.
1) Butt
2) Belly (Low belly, Center belly, High belly)
3) Thigh (Thigh near, Thigh above)
For Exercise training and Aerobics training there will be 12 week program as per under
Group A was given Aerobics training whole body exercise with music and Group B was given
special exercise. Group A was given training on Monday, Wednesday and Friday. Group B was
given special exercise on Tuesday, Thursday and Saturday
RESULT AND DISCUSSION
For this research work data was collected as pre test and post test. Data was collected before
training and after 12 weeks training. Statistical Analysis was done from collected data. To check
Mean difference .Analysis of variance (ANOVA) and Analysis co-variance (ANCOVA) To check
signification level between four group LSD (List of significant difference) was taken as 0.05
significant level The level of significance chosen to study the significance of difference between
means obtained by using mean difference method and analysis of variance was set at 0.05 level of
confidence, and “F” ratio was considered adequate for the purpose of the study.To see the Effect
of Special exercise and Aerobics on Anthropometric measurements Analysis has been shown in
tables and graph thoroughly.
Table-1
Upper Belly
Analysis of variance and co-variance of mean for Aerobic Group , Special Exercise Group
, and Control Group in the Performance of Upper Belly
(Test)
Group ANCOVA TABLE
A B C (SS) (df) (MSS) ‘F’
(Pre Test
Mean) 85.4 82.05 86.2
A 193.9 2 96.95 1.168
W 4728.95 57 82.964
(Post Test
Mean) 82.325 79.15 87.8
A 765.858 2 382.929 5.786*
W 3771.89 57 66.173
(Adjusted
Mean) 81.587 81.318 86.369
A 316.944 2 158.472 41.550*
W 213.632 56 3.814
* Significant level of 0.05 F = (2, 57) 3.15
The analysis of the data shown in tabe-1 Pre-test mean of groups A, B and C are 85.4,
82.05 and 86.20 respectively. The ‘F’ ratio of Pre-test is 1.168, which is not significant at 0.05
level of confidence. Its Indicates that the average initial differences between the groups is not
significant.
The post-test is significant at 0.05 level of confidence. Its Indicates that there are significant
difference between groups in post -test.

Volume: 3, Issue: 2, December 2016 ISSN –2349- 3992
Vyayam Setu: International Journal of Physical Education and Sports Sciences
31
The Adjusted mean is 81.587, 81.318 and 86.369 subsequently and the adjusted mean ‘F’
ratio is 41.550, which is significant at 0.05 level of confidence. It’s Indicates that there are
significant differences between groups in Adjusted Mean.
As the post -test ‘F’ ratio found significant post-hoc LSD test was applied.
Graph -1
Pretest and Posttest mean and Adjusted Mean for Aerobic Group , Special Exercise Group
, and Control Group in the Performance of Anthropometric measurements Upper Belly
Table -2
Mean difference and critical difference of Aerobics group, Special Exercise group, and
control group in performance of Anthropometric measurements Upper Belly
(Mean) (MD) (CD)
A B C
81.587 81.32 0.267
1.235
81.587 86.368 4.781*
81.32 86.368 5.048*
Necessary value at 0.05 level (C.D.) = 1.235.
It is shown from table-12 that there is significant difference between A-C and B-C, where
as there is no significant difference between groups A-B.
Here shown that the difference between mean of group A-C and B-C is 4.781 and 5.048,
which is more than critical difference 1.235. Here group B prove more significant than group A.
Pretest mean
Posttest mean
Adjusted mean
74
76
78
80
82
84
86
88
Group AGroup B
Group C
85.4
82.5
86.2
82.325
79.150
87.800
81.58781.318
86.369
Pretest mean
Posttest mean
Adjusted mean

Volume: 3, Issue: 2, December 2016 ISSN –2349- 3992
Vyayam Setu: International Journal of Physical Education and Sports Sciences
32
Table-3
Center Belly
Analysis of variance and co-variance of mean for Aerobic Group, Special Exercise Group ,
and Control Group in the Performance of Center Belly
(Test)
Group ANCOVA TABLE
A B C (SS) (df) (MSS) ‘F’
(Pre Test
Mean) 92.25 87.95 91.7
A 219.033 2 109.516 1.384
W 4508.9 57 79.103
(Post Test
Mean) 88.6 85.4 93.45
A 657.1 2 328.55 5.414*
W 3458.55 57 60.676
(Adjusted
Mean) 87.229 87.674 92.545
A 346.230 2 173.115 44.340*
W 218.635 56 3.904
* Significant level of 0.05 F = (2, 57) 3.15
The analysis of the data shown in tabe-3 Pre-test mean of groups A, B and C are 92.25,
87.95 and 91.7 respectively. The ‘F’ ratio of Pre-test is 1.384,which is significant at 0.05 level of
confidence. Its Indicates that the average initial differences between the groups is significant.
The posttest mean is 88.6, 85.4 and 93.45 subsequently and the posttest ‘F’ ratio is 5.414,
which is significant at 0.05 level of confidence. It’s Indicates that there are significant differences
between groups in post- test.
The Adjusted mean is 87.229, 87.674 and 92.545 subsequently and the adjusted mean ‘F’
ratio is 44.340, which is significant at 0.05 level of confidence. It’s Indicates that there are
significant differences between groups in Adjusted Mean.
As the post-test ‘F’ ratio found significant post-hoc LSD test was applied.
Graph -2
Pretest and Posttest mean and Adjusted Mean for Aerobic Group , Special Exercise Group
, and Control Group in the Performance of Medium Belly
Pretest mean
Posttest mean
Adjusted mean
80
85
90
95
Group AGroup B
Group C
92.25
87.95
91.7088.6
85.4
93.5
87.22 87.674
92.545
Pretest mean
Posttest mean
Adjusted mean

Volume: 3, Issue: 2, December 2016 ISSN –2349- 3992
Vyayam Setu: International Journal of Physical Education and Sports Sciences
33
Table -4
Mean difference and critical difference of Aerobics group, Special Exercise group, and
control group in performance of Center Belly
(Mean) (MD) (CD)
A B C
87.229 87.674 0.445
1.249
87.229 92.545 5.316*
87.674 92.545 4.871*
Necessary value at 0.05 level (C.D.) = 1.249
It is shown from table-4 that there is significant difference between A-C and B-C, where
as there is no significant difference between groups A-B.
Here shown that the difference between mean of group A-C and B-C is 5.316 and 4.871,
which is more than critical difference 1.249. Here group B prove more significant than group A.
Table-5
Lower Belly
Analysis of variance and co-variance of mean for Aerobic Group, Special Exercise Group,
and Control Group in the Performance of lower Belly
(Test)
Group ANCOVA TABLE
A B C (SS) (df) (MSS) ‘F’
(Pre Test
Mean) 98.8 94.4 95.75
A 203.233 2 101.617
1.666
W 3475.75 57 60.978
(Post Test
Mean) 92.9 89.85 97.6
A 609.7 2 304.85 6.077*
W 2859.15 57 50.160
(Adjusted
Mean) 90.859 91.424 98.066
A 639.403 2 319.701 34.918*
W 512.723 56 9.155
* Significant level of 0.05 F = (2, 57) 3.15
The analysis of the data shown in tabe-5 Pre-test mean of groups A, B and C are 98.8, 94.4
and 95.75 respectively. The ‘F’ ratio of Pre-test is 1.666. which is not significant at 0.05 level of
confidence. Its Indicates that the average initial differences between the groups is not significant.
The post-test mean is 92.90, 89.85 and 97.60 subsequently and the post-test ‘F’ ratio is
6.077,which is significant at 0.05 level of confidence. It’s Indicates that there are significant
differences between groups in post-test.
The Adjusted mean is 90.859, 91.424 and 98.066 subsequently and the adjusted mean ‘F’
ratio is 34.918, which is significant at 0.05 level of confidence. It’s Indicates that there are
significant differences between groups in Adjusted Mean.
As the post-test ‘F’ ratio found significant post-hoc LSD test was applied

Volume: 3, Issue: 2, December 2016 ISSN –2349- 3992
Vyayam Setu: International Journal of Physical Education and Sports Sciences
34
Graph -3
Pretest and Posttest mean and Adjusted Mean for Aerobic Group , Special Exercise Group
, and Control Group in the Performance of Lower Belly
Table -6
Mean difference and critical difference of Aerobics group, Special Exercise group, and
control group in performance of Lower Belly
(Mean) (MD) (CD)
A B C
90.859 91.424 0.565
1.913
90.859 98.066 7.207*
91.424 98.066 6.642*
Necessary value at 0.05 level (C.D.) = 1.913
It is shown from table-6 that there is significant difference between A-C and B-C, where
as there is no significant difference between group A-B.
Here shown that the difference between mean of group A-C and B-C is 7.206 and 6.641,
which is more than critical difference 1.913. Here group B prove more significant than group A.
Pretest mean
Posttest mean
Adjusted mean
84.00
86.00
88.00
90.00
92.00
94.00
96.00
98.00
100.00
Group AGroup B
Group C
98.80
94.4095.7592.90
89.85
97.60
90.859 91.424
98.066
Pretest mean
Posttest mean
Adjusted mean

Volume: 3, Issue: 2, December 2016 ISSN –2349- 3992
Vyayam Setu: International Journal of Physical Education and Sports Sciences
35
Table-7
Butt Circumference
Analysis of variance and co-variance of mean for Aerobic Group , Special Exercise Group
, and Control Group in the Performance of Butt Circumference
(Test)
Group ANCOVA TABLE
A B C (SS) (df) (MSS) ‘F’
(Pre Test
Mean) 105.7 100.7 102.6
A 254.8 2 127.4 2.566
W 2829.2 57 49.635
(Post Test
Mean) 101.7 95.55 106
A 1102.23 2 551.115 15.019*
W 2091.5 57 36.692
(Adjusted
Mean) 99.60 97.289 106.3
A 875.249 2 437.624 51.869*
W 472.507 56 8.437
* Significant level of 0.05 F = (2, 57) 3.15
The analysis of the data shown in tabe-7 Pre-test mean of groups A, B and C are 105.7,
100.7 and 102.6 respectively. The ‘F’ ratio of Pre-test is 2.566. Which is not significant at 0.05
level of confidence.Its Indicates that the average initial differences between the groups Is not
significant.
The post-test mean is 101.7, 95.55 and 106 subsequently and the post-test ‘F’ ratio is
15.019, which is significant at 0.05 level of confidence. It’s Indicates that there are significant
differences between groups in post-test.
The Adjusted mean is 99.60, 97.289 and 106.3 subsequently and the adjusted mean ‘F’
ratio is 51.865, which is significant at 0.05 level of confidence. It’s Indicates that there are
significant differences between groups in Adjusted Mean.
As the post-test ‘F’ ratio found significant post-hoc LSD test was applied
Graph -4
Pretest and posttest mean and Adjusted Mean for Aerobic Group , Special Exercise Group
, and Control Group in the Performance of Butt circumference
Pretest mean
Posttest mean
Adjusted mean
90
92
94
96
98
100
102
104
106
108
Group AGroup B
Group C
105.7
100.7102.6
101.70
95.55
106.00
99.600
97.289
106.300
Pretest mean
Posttest mean
Adjusted mean

Volume: 3, Issue: 2, December 2016 ISSN –2349- 3992
Vyayam Setu: International Journal of Physical Education and Sports Sciences
36
Table -8
Mean difference and critical difference of Aerobics group, Special Exercise group, and
control group in performance of Butt circumference
(Mean) (MD) (CD)
A B C
99.607 97.289 2.317*
1.837
99.607 106.303 6.695*
97.289 106.303 9.013*
Necessary value at 0.05 level (C.D.) = 1.837
It is shown from table-8 that there is significant difference between A-C and B-C, where
as there is significant difference between groups A-B.
Here shown that the difference between mean of group A-C and B-C is 6.695 and
9.013.which is more than critical difference 1.837. Here group B prove more significant than group
A.
Table-9
Thigh Above
Analysis of variance and co-variance of mean for Aerobic Group , Special Exercise Group
, and Control Group in the Performance of Thigh above
(Test)
Group ANCOVA TABLE
A B C (SS) (df) (MSS) ‘F’
(Pre Test
Mean) 69.55 68.95 69.45
A 4.133 2 2.066 0.017
W 6564.85 57 115.17
(Post Test
Mean) 67 64.9 74.1
A 929.733 2 464.866
4.215* W 6285.6 57 110.273
(Adjusted
Mean) 66.776 65.250 73.972
A 867.715 2 433.857 85.601*
W 283.828 56 5.068
* Significant level of 0.05 F = (2, 57) 3.15
The analysis of the data shown in tabe-9 Pre-test mean of groups A, B and C are 69.55,
68.95 and 69.45 respectively. The ‘F’ ratio of Pre-test is 0.017. which is not significant at 0.05
level of confidence. Its Indicates that the average initial differences between the groups is
significant.
The post-test means 67.00, 64.90 and 74.10 subsequently and the post-test ‘F’ ratio is
4.215, which is significant at 0.05 level of confidence. It’sIndicates that there are significant
differences between groups in post-test.
The Adjusted mean is 66.776, 65.250 and 73.972 subsequently and the adjusted mean ‘F’
ratio is 85.601, which is significant at 0.05 level of confidence. It’s Indicates that there are
significant differences between groups in Adjusted Mean.
As the post-test ‘F’ ratio found significant post-hoc LSD test was applied

Volume: 3, Issue: 2, December 2016 ISSN –2349- 3992
Vyayam Setu: International Journal of Physical Education and Sports Sciences
37
Graph -5
Pretest and Posttest mean and Adjusted Mean for Aerobic Group , Special Exercise Group
, and Control Group in the Performance of Thigh above
Table -10
Mean difference and critical difference of Aerobics group, Special Exercise group, and
control group in performance of Thigh Above
(Mean) (MD) (CD)
A B C
66.776 65.250 1.526*
1.423
66.776 73.972 7.195*
65.250 73.972 8.722*
Necessary value at 0.05 level (C.D.) = 1.423
It is shown from table-20that there is significant difference between A-C and B-C, where
as there is significant difference between groups A-B.
Here shown that the difference between mean of mean of group A-C and B-C is 7.195
and 8.721, which is more than critical difference 1.423. Here group B prove more significant
than group A.
Pretest mean
Posttest mean
Adjusted mean
60
62
64
66
68
70
72
74
76
Group AGroup B
Group C
69.55
68.95 69.4567
64.9
74.1
66.77
65.25
73.97
Pretest mean
Posttest mean
Adjusted mean

Volume: 3, Issue: 2, December 2016 ISSN –2349- 3992
Vyayam Setu: International Journal of Physical Education and Sports Sciences
38
Table-11
Thigh near Knee
Analysis of variance and co-variance of mean for Aerobic Group , Special Exercise Group
, and Control Group in the Performance of Thigh near Knee
(Test)
Group ANCOVA TABLE
A B C (SS) (df) (MSS) ‘F’
(Pre Test
Mean) 61.35 60.9 61.25
A 2.233 2 1.116 0.010
W 6316.1 57 110.808
(Post Test
Mean) 57.95 58.65 65.95
A 785.2 2 392.6 4.068*
W 5500.45 57 96.499
(Adjusted
Mean) 57.780 58.895 65.873
A 769.388 2 384.694 162.909*
W 132.237 56 2.361
* Significant level of 0.05 F = (2, 57) 3.15
The analysis of the data shown in tabe-11 Pre-test mean of groups A, B and C are 61.35,
60.90 and 61.25 respectively. The ‘F’ ratio of Pre-test is 0.010. Which is not significant at 0.05
level of confidence. Its Indicates that the average initial differences between the groups is not
significant.
The post-test mean is 57.95, 58.65 and 65.95 subsequently and the post-test ‘F’ ratio is
4.068, which is significant at 0.05 level of confidence. It’s Indicates that there are significant
differences between groups in post-test.
The Adjusted mean is 57.780, 58.895 and 65.873 subsequently and the adjusted mean ‘F’
ratio is 162.909, which is significant at 0.05 level of confidence. It’s Indicates that there are
significant differences between groups in Adjusted Mean.
As the posttest ‘F’ ratio found significant post-hoc LSD test was applied
Graph -6
Pretest and Posttest mean and Adjusted Mean for Aerobic Group , Special Exercise Group
, and Control Group in the Performance of Thigh near Knee
Pretest mean
Posttest mean
Adjusted mean
52
54
56
58
60
62
64
66
Group AGroup B
Group C
61.3560.9
61.2557.95 58.65
65.95
57.7858.89
65.87
Pretest mean
Posttest mean
Adjusted mean

Volume: 3, Issue: 2, December 2016 ISSN –2349- 3992
Vyayam Setu: International Journal of Physical Education and Sports Sciences
39
Table -12
Mean difference and critical difference of Aerobics group, Special Exercise group, and
control group in performance of Thigh near Knee
(Mean) (MD) (CD)
A B C
57.780 58.895 1.115*
0.971
57.780 65.873 8.093*
58.895 65.873 6.978*
Necessary value at 0.05 level (C.D.) = 0.971
It is shown from table-12 that there is significant difference between A-C and B-C, where
as there is significant difference between groups A-B.
Here shown that the difference between mean of group A-C and B-C is 8.092 and 6.977.
Which is more than critical difference 0.971 Here group B prove more significant than group A.
CONCLUSION
From this study it shows that in body composition like Butt, Belly and thigh group of
Aerobics and Special exercise was significantly
In control group there was not significantly in Anthropometric measurement
REFERENCES
1) Splitler D.L. et al. (1987), Body Composition and Physiological Characteristics of Law
Enforcement Officers” British Journal if Sports Medicine.
2) Gibbons Mark k, (1981), Estimation of Body Fat in Middle Aged Woman Using Skin Folds
and Densitometry” Completed Research.
3) Parr Richard B, Saltareu William and Harnak James (1995), Comparison of Percent Body
Fat to BMI and Waist to Hip Ratio with in Various Categories of Obesity, Research
Quarterly for Exercise and Sports.
4) Lohman T.G. (1987), The Use of Skin Fold Estimate Body Fatness on Children and Youth”
JOPERD.
5) Eston R.G., Fue F. and Fung L. (1995) Validity of Conventional Anthropometric
Techniques for Predicting Body Composition in Healthy Chinese Adults, British Journal
of Sports Medicine.
6) Red Roxanne M. (1981), Anthropometric Determination of Body Density in prepubescent
Males Aged 7-11, Completed Research.

Volume: 3, Issue: 2, December 2016 ISSN –2349- 3992
Vyayam Setu: International Journal of Physical Education and Sports Sciences
40
COMPARATIVE EFFECTS OF DIFFERENT TRAINING PROGRAMS ON
PHYSICAL AND PHYSIOLOGICAL VARIABLES OF SCHOOL BOYS
Ladhubhai Devabhai Mori, Ph.D. Research Scholar,
Department of Physical Education,
Swarnim Gujarat Sports University,
Sector 15, Gandhinagar, Gujarat 382016
DR. Kamleshkumar P. Patel ,
Research Supervisor, Associate professor,
Mahadev Desai Samaj Seva Mahavidyalaya,
Gujarat Vidyapeeth, Ashram Road,
Ahmedabad – 380014.
ABSTRACT
The purpose of the study was to investigate the “Comparative Effects of different training
programs on Physical and Physiological Variables of school boys”. To achieve the purpose 80
male students were selected as subjects at random from Sheth J.H. Sonawala high school
Mahemdabad Dist.: Kheda, Gujarat and their ages ranged from 16 to 19 years. It was hypothesized
that there would be significant improvement in the Comparative Effects of different training
programs on Physical and Physiological Variables of school boys. The study was formulated as a
random groups design. They were divided in four equal groups, Group-A: Circuit training group,
Group B: Interval training group, Group C: Fart lack training group and Group D: Control group.
The subjects had tested on selected variables at the before (pre – test) and at the end of the
Experimental training (post – test) was taken after a 12 weeks. The obtained data’s were analyzed
by ANCOVA. Based on the result of the study it was concluded that circuit training, Interval
training and Fart lack training program produced a significant development on the selected
physical fitness variables.
Key words: Circuit training, Interval training, Fart lack training, physical fitness, Agility.
INTRODUCTION
We hear a lot about physical fitness. Social activists, educationists, political leaders etc,
regard physical fitness the foundation of the nation, and make repeated appeals to develop it. They
understand that the nation must become fit and it is necessary to acquire international acclaim and
national unity. Then what is this physical fitness? If physical fitness is an important matter for the
development an individual, society and nation, then it is extremely necessary for all of us to have
a scientific idea about it. In the larger context, individual’s ability to do a specific work can be
called physical fitness. In this regard, the level of physical fitness depends upon the individual and
specific work. Keeping the society in mind we cannot think to have equal level of physical fitness
for all. But we should think about physical fitness in terms of individual and his/her work.
Agility or Co-coordinative abilities are understood as relatively stabilized and generalized
patterns of motor control and regulations process. These enable the sportsman to do a group of
movements with better quality and effect.
The circuit training format utilizes a group of 6 to 10 strength exercise that is completed on
exercise after another. Each exercise if performed for a specified number of repetitions or for a
prescribed time period before moving on to the next exercise. The exercises within each circuit are
separated by brief, timed rest intervals, and each circuit is separated by a longer rest period.
Interval training, as the name implies, is a serious of repeated bouts of exercise alternated
with periods of relief. Light of mind exercise usually constitutes this relief period. To understand
why this method of training has been so successful, we will start with a discussion of energy
production and fatigue during intermittent work.
Speed play or fart lack (a Swedish word meaning “Speed play”) training is said to be the
forerunner of the interval-training system. It involves alternating fast-and slow-running over

Volume: 3, Issue: 2, December 2016 ISSN –2349- 3992
Vyayam Setu: International Journal of Physical Education and Sports Sciences
41
natural terrain. It can be thought as in informal interval-training program in that neither the work
nor relief intervals are precisely timed. Further-more, the proportions of fast-and slow-running are
left entirely up to the runners as they feel the need or urge to run them. Such a program will develop
both aerobic and anaerobic capacities.
OBJECTIVE OF THE STUDY
The objective of this research is to study “Comparative Effects of different training
programs on Physical and Physiological Variables of school boys”
HYPOTHESES
It was hypnotized that there would be a positive “Comparative Effects of different training
programs on Physical and Physiological Variables of school boys”
METHODOLOGY
Subjects: 80 male students from Sheath J. H. Sonavala High school, Mahemdabad, were selected
as subjects at random for this study. The age ranged of the subjects from 16 to 19 years. The
subjects were randomly assign in four equal groups i.e. Group – A circuit training group, Group –
B Interval training group and Group – C Control group.
Experimental Design: Pertest – post-test randomized group design. The subjects were randomly
assigned in to three groups. Each group consisted of 20 subjects.
Criterion Measure: Agility was measured with shuttle run and time recorded to the nearest l/10th
of a second.
Collection of Data: The data were collected by administering the pre- test and post- test, pre-test
were taken before commencement of the training and post-test were taken after completion of
twelve week training.
Administration of Training: The experimental group met three times in a week for the period of
12 weeks. Each experimental session was of 60-70 minutes duration. The Group-A: underwent
Circuit training and Group B: underwent Interval training Group C underwent Fart lack training
for a period of 12 weeks while the Control group (Group: D) did not involve in any Physical
activities during the 12 week training period.
Statically technique: In order to find out the “Comparative Effects of different training programs
on Physical and Physiological Variables of school boys”, analysis of co- variance was used, the
proposed hypothesis was tested at 0.05 level of confidence. When the adjusted post -test was
significant, Least Significant Difference (LSD) post hoc test is applied for pair wise comparison.
ANALYSIS OF THE DATA AND RESULTS OF THE STUDY Mean and Analysis of covariance of Agility for Circuit training group, Interval training
group, Fart lack training group and Control group have been presented in Table- 1

Volume: 3, Issue: 2, December 2016 ISSN –2349- 3992
Vyayam Setu: International Journal of Physical Education and Sports Sciences
42
Table - 1
Mean and Analysis of covariance of Agility for Circuit training group, Interval training
group, Fart lack training group and Control group
Means
Group means Source of
Variance
Sum
of Squares df
Mean Sum
of Squares F Circuit
Training
Interval
Training
Fart lack
Training
Control
Group
Pre test
Means 11.8095 11.8675 11.7825 11.951
Among .334 3 .111
.232 Within 36.463 76 .480
Post-test
Means 10.8170 11.1520 10.9000 11.9255
Among 15.307 3 5.102
10.690* Within 36.275 76 .477
Adjusted
Means 10.857 11.138 10.965 11.835
Among 11.496 3 3.832 56.385*
Within 5.097 75 .068
* Significant at 0.05 level F.05 (3, 76) =2.74
Table-1 shows that the pre-test mean values of Circuit training, Interval training, Fart lack
training group and control group on Agility are 11.8095,11.8675,11.7825 and11.951 respectively.
The F value (.232) is not significant for pre-test means. Since, the obtained F ratio for pre-test
means is less than the table value 2.74 on 3,76df. This shows that there was no significant
difference between the mean of the groups at the initial stage and the random assignment of the
groups is successful. The adjusted post-test mean of Circuit training, Interval training, Fart lack
training group and control group on Agility are 10.857, 11.138, 10.965 and 11.835 respectively.
The F value (56.385) is significant for adjusted pre-test means. Since, the obtained F ratio is higher
than the table value 2.74 on 3, 75 df. This shows that there is a significant difference among
adjusted post-test means of Circuit training, Interval training, Fart lack training group and control
group on Agility.
Since, the F value is significant; Least Significant Difference (LSD) post hoc test is applied
for pair wise comparison and presented in Table -2

Volume: 3, Issue: 2, December 2016 ISSN –2349- 3992
Vyayam Setu: International Journal of Physical Education and Sports Sciences
43
Table -2
Least Significant Difference (LSD) post hoc test of Agility for Circuit training group,
Interval training group, Fart lack training group and Control group Mean
Mean
Difference
Std.
Error Significant
95% Confidence
Interval for Difference
Circuit
Training
Interval
Training
Fart lack
Training
Control
Group Lower
Bound
Upper
Bound
10.857 11.138 __ __ -.281* .082 .001 -.446 -.117
10.857 __ 10.965 __ -.108 .082 .194 -.272 .056
10.857 __ __ 11.835 -.978* .083 .000 -1.142 -.813
__ 11.138 10.965 __ .173* 0.83 .039 .009 .338
__ 11.138 __ 11.835 -.696* .083 .000 -.861 -.532
__ __ 10.965 11.835 -.870* .083 .000 -1.035 -.009
* Significant at 0.05 level
The LSD Table- 2 shows that the significant difference is found between Circuit training
and Interval training group, Circuit training and control group, Interval training and Fart lack
group, Interval training and control group and Fart lack training group and control group in relation
to Agility. Since, the significance value is 0.01,.000 ,.039and .000 and .000 respectively on the
other hand insignificant difference was found between Circuit training group and Fart lack training
group in relation to Agility. Since, the significance value is .194.
The pre-test, post-test and adjusted post-test mean values of Circuit training group,
Interval training group, Fart lack training group and Control group on
Agility are graphically presented in the Figure
10.2
10.4
10.6
10.8
11
11.2
11.4
11.6
11.8
12
12.2
Circuit Training IntervalTraining
FartlackTraining
Control group
Pre testMean
PosttestMean

Volume: 3, Issue: 2, December 2016 ISSN –2349- 3992
Vyayam Setu: International Journal of Physical Education and Sports Sciences
44
DISCUSSION ON FINDING The Agility significantly improved after the Circuit training, Interval training and Fart lack
training when compared the control group. The significant difference shows that Interval training
was better than circuit training and Fart lack training, while Fart lack training was less effective
than Interval training but more effective than Circuit training, Circuit training also effective but its
effect was less than interval training and Fart lack training to increase the Agility. While there was
no significance found between Circuit training and Fart lack training on other hand slightly
significance found between Circuit training and Interval training and Interval training and Fart
lack training.
CONCLUSIONS
Within limitation of the study the following conclusions were drawn
1. The well planned and systematic training program of Circuit training, Interval training and Fart
lack training for 12 week is beneficial in improving the Agility of school boys.
2. There was significant Improvement found on Agility due to 12 weeks Circuit training, Interval
training and Fart lack training when compared with the control group.
3. The Interval training improved better performance than Circuit training and Fart lack training
in case of Agility.
REFERENCES
1. Clarke David and Clarke Harrison H. (1989), Application of Measurement Health and
Physical Education, New Jersey: Englewood cliffs Prentice Hall Inc.
2. Fox Bowers Foss (1989), The Physiological Basis of Physical Education and Athletics,
Lowa, U.S.A., WCB publication.
3. Jain, Rachna (2006), Physical fitness and Health, New Delhi: Khel Sahitya Kendra.
4. Kamlesh, M. L.(1993), Sharirik Shiksha: Ek Eaitihasik Vagmay, New Delhi: Metropolitan
Book Co.
5. Kansal, Devindar K. (1997), Test and Measurement, New Delhi: D.V.S. Publication.
6. Laxmi Vijya and Chandrasekhar K. (2005), Physical Education, Fitness and Sports Part
II” Khel Sahitya Kendra vol. II.
7. Mishra, Sharad Chandra (2005), Fitness for Sports, New Delhi: Sports Publication.
8. Patel, Harshad and Chaniyara N. (1996), Ramat –Vignan, Ahmedabad: Krishna Graphics.

Volume: 3, Issue: 2, December 2016 ISSN –2349- 3992
Vyayam Setu: International Journal of Physical Education and Sports Sciences
45
PERFORMANCE ENHANCING DRUGS IN ATHLETES
- THE NEW NORMAL
Sheetal Sheth,
Assistant Director,
Dept. of Physical Education,
The M. S. Uni. of Baroda
Vadodara, Gujarat 392002
INTRODUCTION Recently we have heard of athletes such as Lance Armstrong (former world cycling
champion) because he was in a "doping" scandal - he secretly used drugs to improve performance
during his cycling races.
The World Anti-Doping Agency (WADA) forbids the use of performance enhancing drugs
in competitive sports and athletes who dope (abuse drugs) violate this rule. WADA has a an Anti-
Doping Code which includes drug lists describing what is acceptable and what is not acceptable
in various sports. Yet we continue to see the rise of doping scandals and see stories of performance
enhancing drugs taken by athletes to gain competitive advantage. This has become a regular event
in sports today, almost like the new normal.
The below list includes some of the main reasons athletes use performance enhancing
drugs:
increase stamina, strength, aggression and intensity of physical activity,
increase muscle mass and reduce weight and/or body fat and
Increase concentration and/or focus on the physical activity.
ATHLETES FACE TREMENDOUS PRESSURE TO PERFORM We live in a highly visual and digital world where everyone is connected somehow
(television, mobile phones, tablets, and social media). We are obsessed with sports and our favorite
teams (IPL's popularity is proof) and our favorite athletes. We watch their every game and their
every move and we rejoice in the wins and are dejected in the losses. Companies, sponsors and
fans like us regularly spend a lot of money (dollars, pounds, rupees etc. since we are all over the
world) on buying tickets to watch games, or clothes with team/athlete brands etc.
Moreover, athletes who win are rewarded with not only the winning trophy but profitable
contracts with big companies and brand names to endorse their products guaranteeing a lot of extra
income and promising a luxurious lifestyle. Often times the team coach can be fired for losing in
games or a team captain may be demoted. All this to say that athletes and coaches both are under
tremendous pressure to perform as best as they can and to win.
Having good sportsmanship when you lose is not enough and is considered a losing
attitude. Winning seems to be everything and there are real consequences if you athletes do not
constantly win. Especially in highly populated Asian countries like China and India, it is easy to
replace under-performing athletes with the next new talented person who performs better.
This pressure to win and be on top makes athletes and even coaches to take risks with
performance enhancement drugs for the reasons listed above and to gain advantage in the
competition.
For example, a very popular sports related magazine in USA, Sports Illustrated, asked a
number of Olympic athletes whether they would take a performance-enhancing drug if they are
not caught and which would allow them to win. A whopping 98% of the athletes said they would

Volume: 3, Issue: 2, December 2016 ISSN –2349- 3992
Vyayam Setu: International Journal of Physical Education and Sports Sciences
46
take the drugs. Then they were asked the same question, but also told that what if they would die
from the drugs in 5 years? Over 50% of them said they would take the drugs if it means winning
even if they die after 5 years. So it is clear that the athletes are willing to risk even their lives if it
means they would win in their chosen game/sport.
WHY AND HOW DO ATHLETES DOPE? Doping increases the number of red blood cells and the oxygen in the active muscles that
in turn increases athletic and aerobic performance of an athlete. This is especially true for sports,
which require more stamina such as long-distance cycling, track & field etc.
Below is a list of the most frequently abused performance enhancing drugs and their effects
in alphabetical order:
Beta-blockers - reduce tremors and shakes, increase focus
Cannabinoids (marijuana, hashish) - reduces stress/anxiety, increase relaxation
Diuretics (weight loss, fluid retention) - reduces weight to be in certain weight category
Hormones (testosterone, hGH) - increases muscle growth, rapid muscle recovery
Narcotics (morphine, oxycodone) and analgesics - pain relief, pain management
Oxygen enhancement (blood doping, steroids) - increases muscle mass, reduces
inflammation
Stimulants (amphetamines, cocaine)
Increases alertness, concentration, self-confidence
Sometimes coaches and team managers are the ones who give performance enhanced
"supplements" to the team members to increase the chances of winning. They facilitate doping
without the athlete's knowledge or consent, also called as non-intentional doping.
Athletes can also look up drug dosage and frequency online and many online sites wrongly
advise that steroids are safe to use and help with performance and that the side effects are
exaggerated. In fact, steroids are the most abused performance enhancement drugs taken by
athletes to boost their chances of winning.
OPPOSING VIEWPOINTS ON DOPING
There are two main views on the practice of doping - i.e. taking performance enhanced
drugs to increase the chances to win.
The supporters of doping downplay the health risks involved and believe that if the athletes
know the side effects and the risks, they should be able to make an informed decision. They also
think that performance enhanced drugs should be regulated (allowed in control) and not banned
completely.
The opposes of doping argue that all sports and games should occur on a level playing field
where every athlete performs and is judged based on their talent, strength and skill in the game.
And taking performance enhancing drugs gives an unfair advantage to athletes who use those drugs
and shatters the level playing field. Moreover, there are health risks because of the drug abuse and
long-term adverse side effects, which are not good for the athletes who use drugs.
So, the question becomes that which of the above viewpoint is right? Should we accept
performance enhancing drugs as "normal" and part of the sports world and expect most of the
athletes (if not all) to use them? On the other hand, should we tighten the tests and checkpoints to
ensure that absolutely no one is allowed to take any drugs at all before an athletic event?
TESTING FOR PERFORMANCE ENHANCING DRUGS IN ATHLETES Different agencies and institutions in different countries around the world test differently

Volume: 3, Issue: 2, December 2016 ISSN –2349- 3992
Vyayam Setu: International Journal of Physical Education and Sports Sciences
47
for drugs and stimulants in athletes and have their own anti-doping programmes. The World Anti-
Doping Agency (WADA) usually has a policy to test the first 5 athletes to finish an event and 2
more athletes in the event randomly. They do this by conducting blood tests and are known to hold
the samples for 8 years and retest them when new techniques come out.
In the USA extensive anti-doping programs are avoided due to agreements between athlete
unions and anti-doping agencies.
The National Anti-Doping Agency (NADA) of India has extensive testing guidelines and
plans including in-competition testing, out-of-competition testing, target testing, and does this
using blood as well as urine samples.
Even with all the anti-doping programmes and testing, it is not always possible to detect
drug misuse or abuse. It is possible to take drugs at certain times such that the testing will not
detect the drugs in the blood or urine samples. In addition, many athletes know the underlying
pharmacy of the drugs they use and know exactly what dose to take.
Finally, as mentioned before, sometimes the coaches and team managers are involved and
cover up the drug abuse to unfairly win the whole tournament. Therefore, the testers themselves
may be corrupt, especially at the local or city level.
CONSEQUENCES OF USING PERFORMANCE ENHANCING DRUGS There are several negative consequences of using performance-enhanced drugs. First and
foremost, any drug used beyond the recommended dosage and number to times has increased
chances of harmful side effects.
The athlete can become addicted to the drugs and/or their effect and continue to use them
even beyond and outside their athletic boundaries. This is especially true for narcotics and
analgesics, which help with pain relief and pain management. It is true for steroids. In such cases,
athletes undergo withdrawals when they try to not take the drugs anymore and this can happen
several times before they can reduce or nullify their dependence on the drugs.
Serious side effects of the drugs include mood alteration and mood swings, depression,
aggression, increased risk of cancer, diabetes and other cardiovascular diseases. Abuse of steroids,
which are used the most, can result in haemorrhage, hepatitis, hepatoma etc.
Finally, the drugs themselves can be contaminated with toxic substances. And athletes face
the additional risk of contracting HIV or such diseases by sharing needles to inject such drugs in
their bloodstream.
CONCLUSION Performance enhancing drugs are widely used to gain short-term benefits and to win races,
games and tournaments. But, at what cost?
As we reviewed in this paper, in the long term, it is at the cost of the athlete's physiological
and psychological well being because each athlete's body is unique and each athlete requires
specific doses of approved, prescription drugs. The adverse effects of performance enhancing
drugs in athletes can be dangerous and significantly reduce the quality of life and in some cases,
the quantity of life as well.
We would be wise to not allow the use of performance enhanced drugs as the new normal
in sports and make sure that we have proper procedures, protocols and testing in place to ensure a
drug free, level playing field for all sports events.
REFERENCES 1. Angell P.J. (2012), Performance enhancing drug abuse and cardiovascular risk in athletes:

Volume: 3, Issue: 2, December 2016 ISSN –2349- 3992
Vyayam Setu: International Journal of Physical Education and Sports Sciences
48
implications for the clinician. British Journal of Sports Medicine.
2. Bamberger M and Yaeger D (1997), Over the edge. Sports Illustrated.
3. Baron D.A., Martin D.M. and Abol Magd S. (2007) Doping in sports and its spread to at-
risk populations: an international review. World Psychiatry.
4. Brennan BP, Kanayama G and Pope HG Jr. (2013) Performance-enhancing drugs on the
web: a growing public-health issue. American Journal Addict.
5. Botrè F, Wu M. and Boghosian T. (2012) Preparation and accreditation of anti-doping
laboratories for the Olympic Games. Bioanalysis.
6. Dunn M, McKay FH and Iversen J. (2014) Steroid users and the unique challenge they
pose to needle and syringe program workers. Drug Alcohol Rev.
7. Furst Wolf R. (2011) Conflicting anti-doping laws in professional sports: collective
bargaining agreements v. state law. Seattle U L Rev.
8. Hope VD et. al. (2013) Prevalence of, and risk factors for, HIV, hepatitis B and C
infections among men who inject image and performance enhancing drugs: a cross-
sectional study. BMJ Open.
9. Perera NJ, Steinbeck KS and Shackel N. (2013) The adverse health consequences of the
use of multiple performance-enhancing substances: a deadly cocktail. J Clin Endocrinol
Metab.
10. Prakash K. (2013) Performance enhancing drugs in sports and the role of doctors: are there
guidelines? Indian J Med Ethics.
11. Savulescu J, Creaney L and Vondy A. (2013) Should athletes be allowed to use
performance enhancing drugs? BMJ.
12. Sawka MN et al. (1996), American College of Sports Medicine position stand: the use of
blood doping as an ergogenic aid. Med Sci Sports Exerc.
13. Tang MH. (2013) The Lance Armstrong story: should we find another hero? Pediatr Blood
Cancer.
14. www.nada.nic.in
15. www.wada-ama.org