Embed Size (px)
Citation preview

Jawaharlal Nehru Engineering College
Laboratory Manual
Basic Instrumentation
For
Second Year Students
Author JNEC INSTRU DEPT., Aurangabad

SUBJECT INDEX
1. Design of multirange ammeter and voltmeter, conversion of ammeter
into voltmeter.
2. Design of Wheatstone bridge.
3. Design of AC Bridge.
4. Measurement of unknown voltage using DC Potentiometer.
5. Measurement of power using wattmeter (single phase).
6. Measurement of power using energy meter (single phase).
7. Measurement of voltage, frequency and phase using CRO, measurement
of unknown frequency by z-modulation.
8. Study of y-t, x-y recorders, frequency response of y-t recorder.
EXPERIMENT NO. 1
Design of multirange ammeter and voltmeter, conversion of ammeter into voltmeter. OBJECTIVE: To design multirange ammeter and voltmeter.
EXPERIMENTAL SETUP: PMMC Instrument such as voltmeter, ammeter, shunt, multiplier, DC voltage source, bread board, connecting wires. THEORY:
WORKING PRINCIPLE:
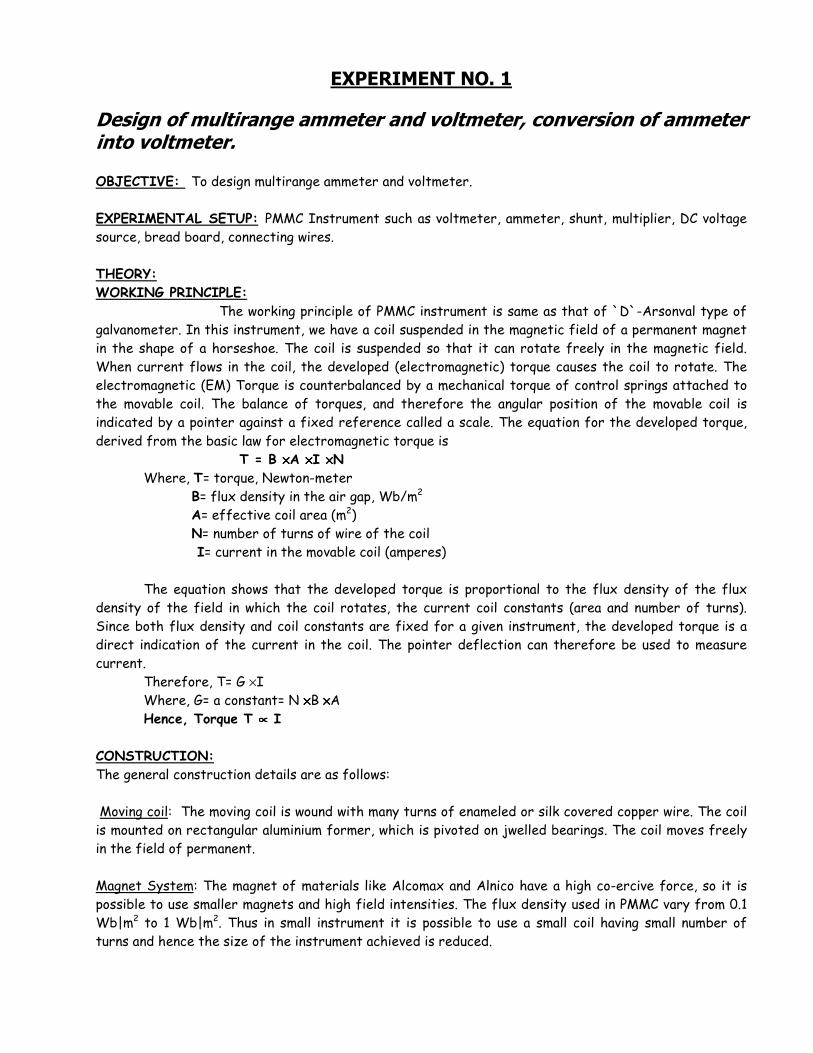
The working principle of PMMC instrument is same as that of `D`-Arsonval type of galvanometer. In this instrument, we have a coil suspended in the magnetic field of a permanent magnet in the shape of a horseshoe. The coil is suspended so that it can rotate freely in the magnetic field. When current flows in the coil, the developed (electromagnetic) torque causes the coil to rotate. The electromagnetic (EM) Torque is counterbalanced by a mechanical torque of control springs attached to the movable coil. The balance of torques, and therefore the angular position of the movable coil is indicated by a pointer against a fixed reference called a scale. The equation for the developed torque, derived from the basic law for electromagnetic torque is T = B ××××A ××××I ××××N
Where, T= torque, Newton-meter B= flux density in the air gap, Wb/m2 A= effective coil area (m2) N= number of turns of wire of the coil I= current in the movable coil (amperes) The equation shows that the developed torque is proportional to the flux density of the flux density of the field in which the coil rotates, the current coil constants (area and number of turns). Since both flux density and coil constants are fixed for a given instrument, the developed torque is a direct indication of the current in the coil. The pointer deflection can therefore be used to measure current. Therefore, T= G ×I Where, G= a constant= N ××××B ××××A Hence, Torque T ∝∝∝∝ I
CONSTRUCTION: The general construction details are as follows: Moving coil: The moving coil is wound with many turns of enameled or silk covered copper wire. The coil is mounted on rectangular aluminium former, which is pivoted on jwelled bearings. The coil moves freely in the field of permanent. Magnet System: The magnet of materials like Alcomax and Alnico have a high co-ercive force, so it is possible to use smaller magnets and high field intensities. The flux density used in PMMC vary from 0.1 Wb|m2 to 1 Wb|m2. Thus in small instrument it is possible to use a small coil having small number of turns and hence the size of the instrument achieved is reduced.
Control: when the coil is supported between two jewel bearings two phosphor bronze hairsprings provide the control torque. These springs also serve to lead current in and out of the coil. The control torque is provided by the ribbon suspension. This method is comparatively new and is claimed to be advantageous as it eliminates bearing friction. Damping: Damping means dissipation of energy of rotation. This dissipation of energy is due partly to mechanical effects, and usually to a greater extent, due to electromagnetic effects from the coil circuit. Damping torque is produced by movement of the aluminium former moving in the magnetic field of the permanent magnet.
Pointer and Scale: The pointer is carried by the spindle and moves over a graduated scale. The pointer is of lightweight construction and, apart from those used in some inexpensive instruments has the section over the scale twisted to form a fine blade. This helps to reduce parallax errors in the reading of the scale. In many instruments such errors may be reduced further by careful alignment of the pointer blade and its reflection in the mirror adjacent to scale. The weight of the instrument is normally counter balanced by weights situated diametrically opposite and rigidly connected to it.
Fig: - D’Arsonval Galvanometer
Operation of D’Arsonval Meter
When current flows through the coil, the core will rotate.Amount of rotation is proportional to the

amount of current flows through the coil. The meter requires low current for a full scale deflection, thus consumes very low power. Its accuracy is about 2% -5% of full scale deflection
DC AMMETER
The PMMC galvanometer constitutes the basic movement of a dc ammeter. The coil winding of a basic movement is small and light, so it can carry only very small currents. A low value resistor (shunt resistor) is used in DC ammeter to measure large current. PMMC AS AN AMMETER: - PMMC movement can be used as DC ammeter by connecting resistor in shunt with it, so that shunt resistance allows a specific fraction of current (excess current greater than full scale deflection current (IFSD) flowing in the circuit to bypass the meter movement. The fractions of the current flowing in the movement indicate the total current flowing in the circuit DC ammeter can be converted into multirange ammeter by connecting number of resistances called multiplier in parallel with the PMMC movement.
Let Rm = internal resistance of the movement. I = full scale current of the ammeter + shunt (i.e. total current)
Rsh = shunt resistance in ohms. Im = full-scale deflection current of instrument in ampere. Ish = (I- Im) = shunt current in ampere.
Since the shunt resistance is in parallel with the meter movement, the voltage drop across the shunt and movement must be the same.
Therefore, Vsh = Vm ∴ IshRsh = ImRm, Rsh = (ImRm)/Ish But Ish = I – Im Hence Rsh = (ImRm) / (I-Im)
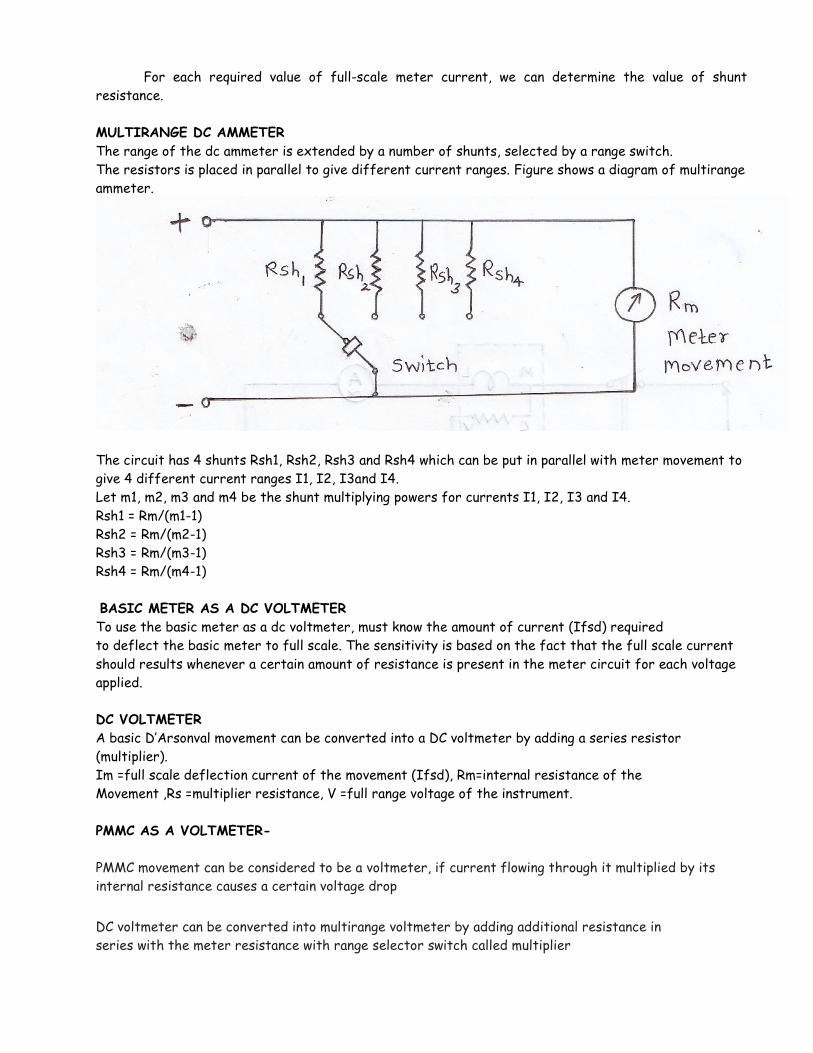
For each required value of full-scale meter current, we can determine the value of shunt resistance. MULTIRANGE DC AMMETER
The range of the dc ammeter is extended by a number of shunts, selected by a range switch. The resistors is placed in parallel to give different current ranges. Figure shows a diagram of multirange ammeter.
The circuit has 4 shunts Rsh1, Rsh2, Rsh3 and Rsh4 which can be put in parallel with meter movement to give 4 different current ranges I1, I2, I3and I4. Let m1, m2, m3 and m4 be the shunt multiplying powers for currents I1, I2, I3 and I4. Rsh1 = Rm/(m1-1) Rsh2 = Rm/(m2-1) Rsh3 = Rm/(m3-1) Rsh4 = Rm/(m4-1) BASIC METER AS A DC VOLTMETER
To use the basic meter as a dc voltmeter, must know the amount of current (Ifsd) required to deflect the basic meter to full scale. The sensitivity is based on the fact that the full scale current should results whenever a certain amount of resistance is present in the meter circuit for each voltage applied.
DC VOLTMETER
A basic D’Arsonval movement can be converted into a DC voltmeter by adding a series resistor (multiplier). Im =full scale deflection current of the movement (Ifsd), Rm=internal resistance of the Movement ,Rs =multiplier resistance, V =full range voltage of the instrument. PMMC AS A VOLTMETER-
PMMC movement can be considered to be a voltmeter, if current flowing through it multiplied by its internal resistance causes a certain voltage drop
DC voltmeter can be converted into multirange voltmeter by adding additional resistance in series with the meter resistance with range selector switch called multiplier
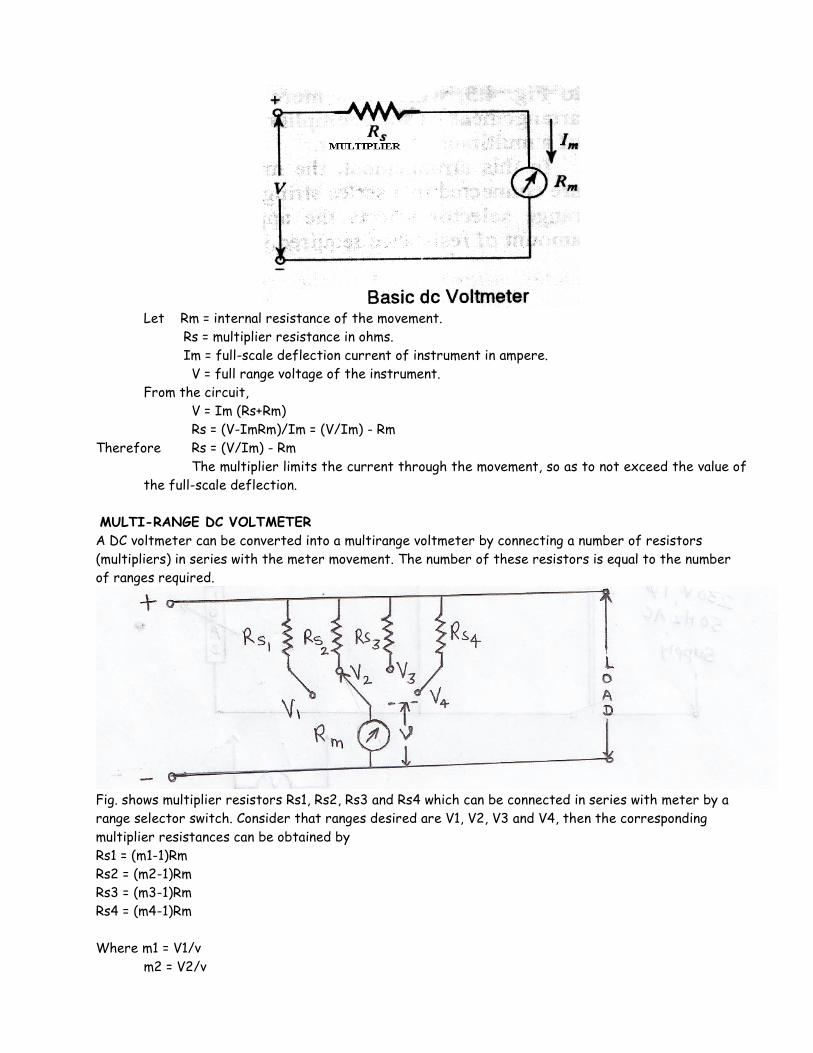
Let Rm = internal resistance of the movement.
Rs = multiplier resistance in ohms. Im = full-scale deflection current of instrument in ampere. V = full range voltage of the instrument. From the circuit, V = Im (Rs+Rm) Rs = (V-ImRm)/Im = (V/Im) - Rm Therefore Rs = (V/Im) - Rm
The multiplier limits the current through the movement, so as to not exceed the value of the full-scale deflection.
MULTI-RANGE DC VOLTMETER
A DC voltmeter can be converted into a multirange voltmeter by connecting a number of resistors (multipliers) in series with the meter movement. The number of these resistors is equal to the number of ranges required.
Fig. shows multiplier resistors Rs1, Rs2, Rs3 and Rs4 which can be connected in series with meter by a range selector switch. Consider that ranges desired are V1, V2, V3 and V4, then the corresponding multiplier resistances can be obtained by Rs1 = (m1-1)Rm Rs2 = (m2-1)Rm Rs3 = (m3-1)Rm Rs4 = (m4-1)Rm Where m1 = V1/v m2 = V2/v
m3 = V3/v m4 = V4/v PROCEDURE:
A) For ammeter; 1. Find the values of shunt resistance for a given current range. 2. Make the connection as shown in the circuit diagram. 3. Give D.C. voltage from D.C.power supply. 4. Take the reading of meter before and after connecting the shunt. B) For voltmeter; 1. Find the value of series resistance i.e. multiplier for a given voltage range. 2. Make the connection as shown in the circuit diagram. 3. Give D.C. voltage from D.C.power supply. 4. Take the reading of meter before and after connecting the series resistor (multiplier).
OBSERVATIONS:
A) For ammeter
Voltage applied=V= Reading of meter before connecting shunt= Reading of meter after connecting shunt=
B) For voltmeter
Voltage applied=V= Reading of meter before connecting multiplier= Reading of meter after connecting multiplier=
CALCULATIONS:
Internal resistance of meter=Rm= A) For ammeter Multiplying factor =m=I/Im= Rsh=value of shunt resistor=Rm/(m-1)= A) For voltmeter Multiplying factor =m=V/v= Rs=value of series resistor=Rm (m-1)= CONCLUSION: When multiplier resistor is added in series with PMMC movement, the range of voltmeter can be extended. When shunt resistor is added in parallel with PMMC movement, the range of ammeter can be extended.

EXPERIMENT NO. 2
Design of Wheatstone bridge. OBJECTIVE: To measure the unknown resistance using Wheatstone’s Bridge. EXPERIMENTAL SETUP: Wheat stone bridge, bread board, galvanometer, D.C. power supply, unknown resistance, connecting leads etc. THEORY:
INTRODUCTION: Bridge circuits are extensively used for measuring components values such as R, L and C. Since the bridge circuit merely compares the value of tan unknown component with that of an accurately known component (a standard), its measurement accuracy can be very high. The Wheatstone bridge is used for accurate measurement of resistance.
BRIDGE CIRCUIT DETAILS:
The source of emf and switch is connected to points A and B, while a sensitive current indicating meter, the galvanometer, is connected to points C and D. The galvanometer is a sensitive microammeter, with a zero center scale. When there is no current through the meter, the galvanometer pointer resets at 0, i.e. mid scale. Current in one direction causes the pointer to deflect on one side and current in the opposite direction to the other side. When SW1 is closed, current flows and divides into the two arms at point A, i.e. I1 and I2. The bridge is balanced when there is no current through the galvanometer, or when the potential difference at points C and D is equal, i.e. the potential across the galvanometer is zero. To obtain the bridge balance equation, we have from the fig. I1R1 = I2R2 ------------------------ (1) For the galvanometer current to be zero, the following condition should be satisfied. I1 = I3 = E -----------------(2) R1 + R3
I2 = I4 = E --------------------(3) R2 + R4 Substituting in eq. (1) R4 = R2 R3 R1 This is the equation for the bridge to be balanced.

Balance Equation: R4 = R2 R3 R1
SENSITIVITY OF WHETSTONE BRIDGE:
Sensitivity is deflection per unit current.
Sensitivity = deflection Unit current.
Where, S=linear or angular per micro-A S=mm/micro-A S=radians/micro-A Therefore, total deflection is given by D=S*I Where I=current in amperes (micro-A)

THEVENINS EQUIVALENT FOR UNBALANCED WHEATSTONE’S BRIDGE:
Thevenin’s equivalent voltage is found by disconnecting the galvanometer from the bridge circuit, as shown in the above figure, and determining the open circuit voltage between terminals a and b. Applying the voltage divider equation, the voltage at point ‘ a’, can be determined as follows Ea = E × R3 and at point ‘ b’, Eb = E × R4 R1 + R3 R2 + R4 Therefore, the voltage between a and b is the difference between Ea and Eb , Which represents Thevenin’s equivalent voltage. Eth = Eab = Ea – Eb = E × R3 - E × R4 R1 + R3 R2 + R4 Therefore Eab = E R3 - R4 R1 + R3 R2 + R4 Thevenin’s equivalent resistance can be determined by replacing the voltage source E with its internal impedance or otherwise short-circuit and calculating the resistance looking into terminals a and b. Since the internal resistance looking into terminals a and b. Since the internal resistance is assumed to be very low, we treat it as 0Ω. Thevenin’s equivalent resistance circuit is shown below.

The equivalent resistance of the circuit is R1R3 in series with R2R4 i.e. R1R3 + R2R4 . Therefore, Thevenin’s equivalent circuit is given in figure below. If the galvanometer is connected across the terminals a and b of fig 2 or its Thevenin’s equivalent fig 4 it will experience the same deflection at the output of the bridge.
The magnitude of current is limited by both Thevenin’s equivalent resistance and any resistance connected between point a and b. The resistance between a and b consists only of the galvanometer resistance Rg. The deflection current in the galvanometer is therefore given by Ig = Eth
Rth + Rg

LIMITATIONS:
For low resistance measurement, the resistance of the leads and contacts becomes significant and introduces an error. This can be eliminated by Kelvin’s Double Bridge. Another difficulty in Wheatstone’s bridge is the change in resistance of the bridge arms due to the heating effect of current through the resistance. The rise in temperature causes a change in the resistance, and excessive current may cause a permanent change in value. APPLICATIONS:
The Wheatstone’s bridge can be used to measure the dc resistance of various types of wire, either for the purpose of quality control of the wire itself, or of some assembly in which it is used. For example, the resistance of motor windings, transformers, solenoids, and relay coils can be measured. Wheatstone’s bridge is also used extensively by telephone companies and others to locate cable faults. The fault may be two lines shorted together, or a single line shorted to ground. PROCEDURE:
1. Make the connections as per circuit diagram on the breadboard. 2. Give DC voltage to the circuit from DC power supply. 3. Vary the R3 variable resistor till you get null deflection on galvanometer. 4. If galvanometer shows null deflection, then bridge is said to be balanced and measure the value of
R3. 5. Calculate unknown resistance as given in formula. OBSERVATIONS:
Resistance R1=
Resistance R2=
Resistance R3=
Resistance R4 = unknown resistance = R4 = R2 R3 = R1
CONCLUSION:
Thus we have measured the value of unknown resistance using wheatstone bridge.

EXPERIMENT NO.4
Design of AC bridge (Schering ’s Bridge). OBJECTIVE: To measure unknown capacitance using Schering bridge. EXPERIMENTAL SETUP: AC source, resistor, capacitor, detector, connecting leads etc. THEORY:
A Schering Bridge is a bridge circuit used for measuring an unknown electrical capacitance and its dissipation factor. The dissipation factor of a capacitor is the the ratio of its resistance to its capacitive reactance. The Schering Bridge is basically a four-arm alternating-current (AC) bridge circuit whose measurement depends on balancing the loads on its arms. Figure below shows a diagram of the Schering Bridge.
Fig: Schering Bridge
In the Schering Bridge above, the resistance values of resistors R1 and R2 are known, while the resistance value of resistor R3 is unknown. The capacitance values of C1 and C2 are also known, while the capacitance of C3 is the value being measured. To measure R3 and C3, the values of C2 and R2 are fixed, while the values of R1 and C1 are adjusted until the current through the ammeter between points A and B becomes zero. This happens when the voltages at points A and B are equal, in which case the bridge is said to be 'balanced'. When the bridge is balanced, Z1/C2 = R2/Z3, where Z1 is the impedance of R1 in parallel with C1 and Z3 is the impedance of R3 in series with C3. In an AC circuit that has a capacitor, the capacitor contributes a capacitive reactance to the impedance. The capacitive reactance of a capacitor C is 1/2πfC. As such, Z1 = R1/[2πfC1((1/2πfC1) + R1)] = R1/(1 + 2πfC1R1) while Z3 = 1/2πfC3 + R3. Thus, when the bridge is balanced:
2πfC2R1/(1+2πfC1R1) = R2/(1/2πfC3 + R3); or 2πfC2(1/2πfC3 + R3) = (R2/R1)(1+2πfC1R1); or C2/C3 + 2πfC2R3 = R2/R1 + 2πfC1R2. When the bridge is balanced, the negative and positive reactive components are equal and cancel out, so 2πfC2R3 = 2πfC1R2 or R3 = C1R2 / C2. Similarly, when the bridge is balanced, the purely resistive components are equal, so C2/C3 = R2/R1 or C3 = R1C2 / R2. Note that the balancing of a Schering Bridge is independent of frequency.
PROCEDURE:
1. Connect Cx to be measured at point C. 2. Connect proper range std. capacitance Cs at point C. 3. Connect points B and D at Vin of audio detector. 4. Make power ON the unit.
Alternatively adjust R4 and R1 to get null condition or as minimum sound as possible. 5. Make power off
Measure the values of R1 and R2 By using formula calculate the value of Cx and Rx. Cx = C3 R4/R1 Rx = R1 C4/C3 Dissipation factor D = wR4C4 Note: It may be observed that if Cx/Cs ratio is more, then balance condition is noted for more than one set of R, C values. In that case repeat steps with two different CS values and take average reading of two.
OBSERVATIONS: Resistance R1 = Resistance R2 = The value of capacitance Cx = C3 R4/R1 = The value of resistance Rx = R1 C4/C3 = CONCLUSION: Thus we have measured the value of unknown capacitance using Schering bridge.
EXPERIMENT NO.5
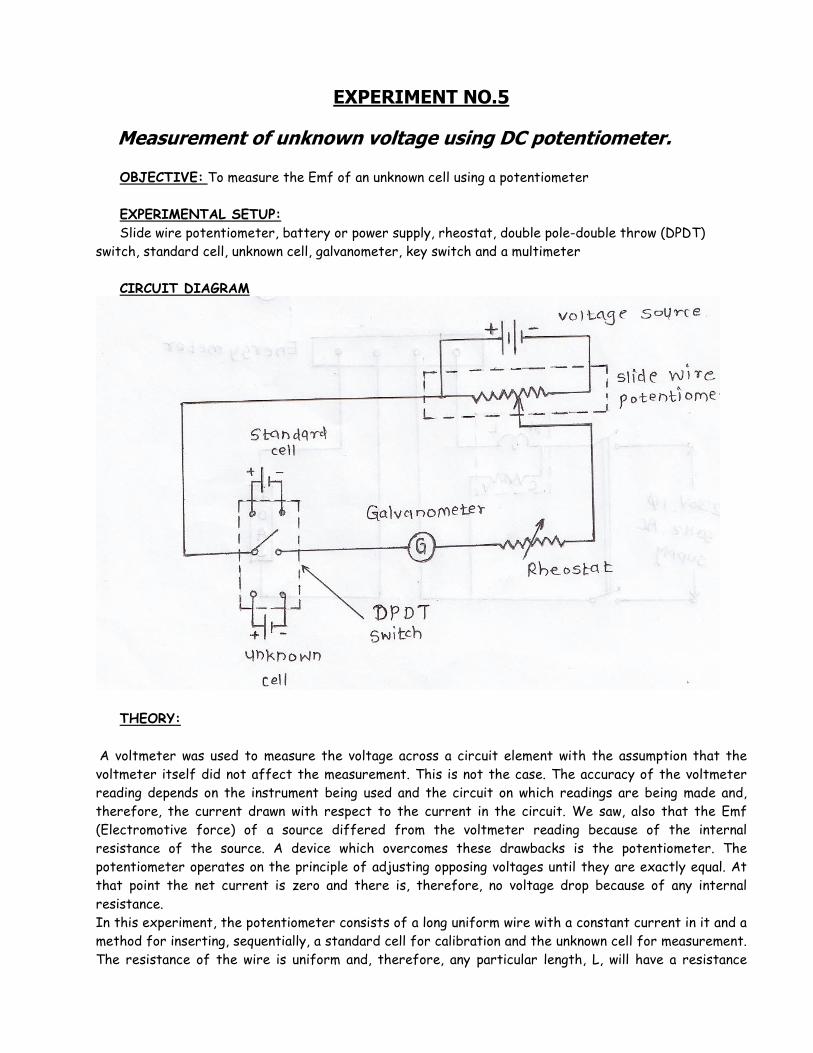
Measurement of unknown voltage using DC potentiometer.
OBJECTIVE: To measure the Emf of an unknown cell using a potentiometer EXPERIMENTAL SETUP:
Slide wire potentiometer, battery or power supply, rheostat, double pole-double throw (DPDT) switch, standard cell, unknown cell, galvanometer, key switch and a multimeter
CIRCUIT DIAGRAM
THEORY:
A voltmeter was used to measure the voltage across a circuit element with the assumption that the voltmeter itself did not affect the measurement. This is not the case. The accuracy of the voltmeter reading depends on the instrument being used and the circuit on which readings are being made and, therefore, the current drawn with respect to the current in the circuit. We saw, also that the Emf (Electromotive force) of a source differed from the voltmeter reading because of the internal resistance of the source. A device which overcomes these drawbacks is the potentiometer. The potentiometer operates on the principle of adjusting opposing voltages until they are exactly equal. At that point the net current is zero and there is, therefore, no voltage drop because of any internal resistance. In this experiment, the potentiometer consists of a long uniform wire with a constant current in it and a method for inserting, sequentially, a standard cell for calibration and the unknown cell for measurement. The resistance of the wire is uniform and, therefore, any particular length, L, will have a resistance
proportional to that length. Since, from Ohms Law, voltage is proportional to the resistance (assuming constant current), the voltage across the length, L, is proportional to L and V = kL, where V is the voltage in volts, L is the variable length of wire in meters and k is the proportionality constant in volts per meter. If a parallel circuit is connected to the wire with a sliding contact, galvanometer, and standard voltage source (see diagram below), the sliding contact may be adjusted to a length of wire in which the voltage drop is just equal to that of the standard cell. At this point, there is no net current in the parallel circuit and
Emf=kL. (eq 1) Since the Emf and L are known, k can be calculated. Substitution of an unknown cell through a similar procedure will enable one to determine the Emf of that unknown cell. PROCEDURE:
1. Connect the circuit as shown in Figure I. Voltage supply is set at its appropriate value, so the current is fairly small. This is to protect the galvanometer.
2. Close the DPDT switch to the standard cell side and calibrate the potentiometer by finding what length of wire corresponds to the voltage of the standard cell. This is done by finding the location of the sliding contact where the galvanometer does not deflect when the key switch is closed.
3. Calculate the constant, k, using the emf of the standard cell and the length, LS measured to the sliding
contact - use Eq. 1. 4. Throw the DPDT switch to connect the unknown battery in the circuit and move the sliding contact
until the galvanometer indicates zero current as in Step 2. (Do not adjust Rt since this will change the
voltage across the potentiometer wire and upset your calibration). Read the length Lu , measured to the
sliding contact. 5. Calculate the emf of the unknown battery. emf = k L
U
6. Now measure the voltage of the unknown battery with the voltmeter. Explain the difference.
OBSERVATION:
Length Lu measured to the sliding contact = EMF of unknown battery = k Lu =
CONCLUSION:
Thus we have measured the unknown voltage using DC potentiometer.

EXPERIMENT NO.6
Measurement of power using wattmeter (single phase).
OBJECTIVE: To measure power in single phase AC circuit. EXPERIMENTAL SETUP:
i. Wattmeter- (0-1200W) 1 No ii. AC Ammeter (0-5A). iii. AC Voltmeter (0-300V) iv. Load bank.
CIRCUIT DIAGRAM:
THEORY:
WATTMETER
Electric power is measured by means of a wattmeter. This instrument is of the electrodynamic type. It consists of a pair of fixed coils, known as current coils, and a movable coil known as the potential coil. The fixed coils are made up of a few turns of a comparatively large conductor. The potential coil consists of many turns of fine wire. It is mounted on a shaft, carried in jeweled bearings, so that it may turn inside the stationary coils. The movable coil carries a needle which moves over a suitably marked scale. Spiral coil springs hold the needle to a zero position.

Figure shows a simplified electrodynamic wattmeter circuit.
The current coil (stationary coil) of the wattmeter is connected in series with the circuit (load), and the potential coil (movable coil) is connected across the line. When line current flows through the current coil of a wattmeter, a field is set up around the coil. The strength of this field is proportional to the line current and in phase with it. The potential coil of the wattmeter generally has a high-resistance resistor connected in series with it. This is for the purpose of making the potential-coil circuit of the meter as purely resistive as possible. As a result, current in the potential circuit is practically in phase with line voltage. Therefore, when voltage is applied to the potential circuit, current is proportional to and in phase with the line voltage.
Figure: Electrodynmic type wattmeter
The actuating force of a wattmeter comes from the field of its current coil and the field of its potential coil. The force acting on the movable coil at any instant (tending to turn it) is proportional to the instantaneous values of line current and voltage.
The wattmeter consists of two circuits, either of which will be damaged if too much current is passed through them. This fact is to be especially emphasized in the case of wattmeters, because the reading of the instrument does not serve to tell the user that the coils are being overheated. If an ammeter or voltmeter is overloaded, the pointer will be indicating beyond the upper limit of its scale. In the wattmeter, both the current and potential circuits may be carrying such an overload that their insulation is burning, and yet the pointer may be only part way up the scale. This is because the position of the pointer depends upon the power factor of the circuit as well as upon the voltage and current. Thus, a low power-factor circuit will give a very low reading on the wattmeter even when the current and potential circuits are loaded to the maximum safe limit. This safe rating is generally given on the face of the instrument. A wattmeter is always distinctly rated, not in watts but in volts and amperes.

PROCEDURE:
1. Make the connections as per circuit diagram. 2. Give 230 volt single phase AC supply to circuit. 3. On the load. 4. Take the reading of Wattmeter. 5. Also take readings of ammeter, voltmeter. 6. Calculate power= VI cosΦ.
OBSERVATION:
1. Ammeter reading -------------------------------- = I = ________ Amp. 2. Wattmeter reading ----------------------------- = W= P= _______Watts 3. Voltmeter reading ----------------------------------= V = ________ Volts.
CALCULATIONS:
Active power = Wattmeter reading = Calculated power = VI cosΦ = Cos Φ = Wattmeter reading (W) / Supply voltage (V) X Ammeter reading=
CONCLUSION:
We conclude that power actual measured and calculated are same.

EXPERIMENT NO.7
Measurement of power using energy meter (single phase). OBJECTIVE: To measure power using energy meter. EXPERIMENTAL SETUP:
i. Wattmeter (0-1200W) ii. Single phase energy meter iii. Load bank
CIRCUIT
DIAGRAM
THEORY:
WATT-HOUR METER
The watt-hour meter is an instrument for measuring energy. Since energy is the product of power and time, the watt-hour meter must take into consideration both of these factors. In principle, the watt-hour meter is a small motor whose instantaneous speed is proportional to the POWER passing through it. The total revolutions in a given time are proportional to the total ENERGY, or watt-hours, consumed during that time.
Construction of Induction Type Energy Meter
There are four main parts of the operating mechanism (i) Driving system

(ii) Moving system (iii) Braking system (iv) Registering system Driving system
• The driving system of the meter consists of two electro-magnets. • The core of these electromagnets is made up of silicon steel laminations. • The load current excites the coil of one of the electromagnets. This coil is called the current coil. • The coil of second electromagnet is connected across the supply and, therefore, carries a current proportional to the supply voltage. This coil is called the pressure coil. • Consequently the two electromagnets are known as series and shunt magnets respectively. • Copper shading bands are provided on the central limb. • The position of these bands is adjustable. • The function of these bands is to bring the flux produced by the shunt magnet exactly in quadrature with the applied voltage.
Moving System
• This consists of an aluminum disc mounted on a light alloy shaft. • This disc is positioned in the air gap between series and shunt magnets. • The upper bearing of the rotor (moving system) is a steel pin located in a hole in the bearing cap fixed to the top of the shaft. • The rotor runs on a hardened steel pivot, screwed to the foot of the shaft. • A jewel bearing supports the pivot. • A pinion engages the shaft with the counting or registering mechanism.
(Fig) single-phase energy meter

Braking System
• A permanent magnet positioned near the edge of the aluminium disc forms the braking system. • The aluminium disc moves in the field of this magnet and thus provides a braking torque. • The position of the permanent magnet is adjustable, and therefore braking torque can be adjusted by shifting the permanent magnet to different radial positions as explained earlier.
Registering (counting) Mechanism • The function of a registering or counting mechanism is to record continuously a number, which is proportional to the revolutions made by the moving system. • By a suitable system, a train of reduction gears the pinion on the rotor shaft drives a series of five or six pointers. • These rotate on round dials, which are marked with ten equal divisions.
PROCEDURE:
1. Do the connections as per ckt. diagram. 2. Connect 230V AC supply to the circuit. 3. ON the load (kept it constant throughout the experiment) 4. Take the readings of energy meter & wattmeter. 5. After 20 minutes take the second reading of energy meter. OBSERVATIONS:
1. Initial energy meter reading (E1)= ________ KWH 2. Final energy meter reading (E2)= _________KWH 3. Wattmeter reading (W)=_________________Watts 4. Time required for final energy meter reading = 20 minutes. CALCULATIONS:
E= Actual energy consumed = E2-E1= _________KWH--------------(I) E=Actual energy consumed calculated from wattmeter reading & time = W x t= ____________watt minute. = (W x t)/(1000x60) KWH-------------------------------------------(II) P=power = Energy/time =
CONCLUSION:
Thus we have measured power using energy meter.

EXPERIMENT NO.8
Measurement of voltage, frequency and phase using CRO, measurement of unknown frequency by Z-Modulation. OBJECTIVE: To measure voltage, frequency, phase using CRO and unknown frequency by z-modulation. EXPERIMENTAL SETUP:
CRO, function generator, probes. THEORY:
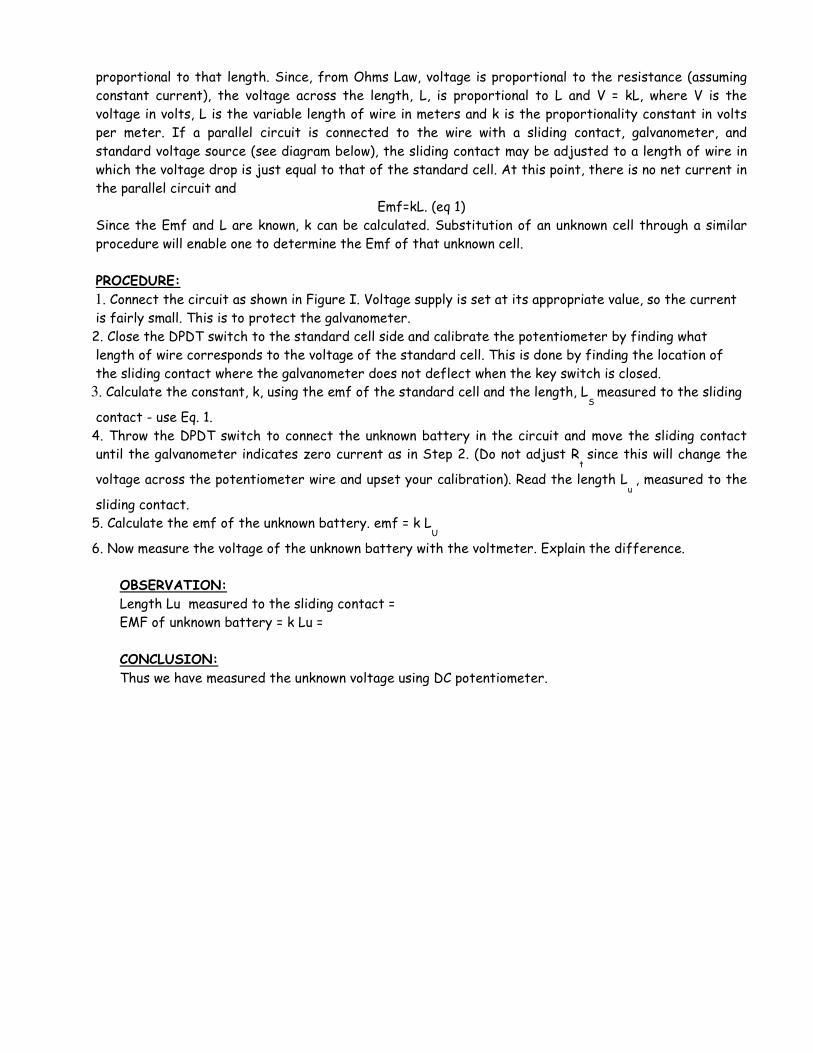
FIG: FUNCTIONAL BLOCK OF A SIMPLE CRO TYPICAL SPECIFICATIONS:
VERTICAL DEFLECTION: Bandwidth (-3dB): d.c. to 20MHz ( 2Hz to 20KHz on a.c.) Sensitivity: 2mV/cm to 10V/cm Accuracy: ± 3% Input Impedance: 1MΩ/28pf approx. Input Coupling: DC-GND-AC Input Protection: 400V d.c. or pk a.c. HORIZONTAL DEFLECTION: Timebase: 0.5µs/cm to 0.2µs/cm, 18 ranges Accuracy: ± 3% ADDITIONAL FACILITIES: Calibrator: 1V, 2% squarewave at approx. 1KHz.
Ramp Output: Approx. ± 3.5V ramp from 5KΩ. SUPPLY: 220/240V± 10% 45 TO 65 Hz approx. 40VA.
Fig No. 2: - Simple CRO
APPLICATIONS OF OSCILLOSCOPE:
I. Measurement of Voltage:
The most direct voltage measurement made with the help of an oscilloscope is the peak to peak (p-p) value. The rms value of the voltage can then be easily calculated from the p-p value.
To measure the voltage from the CRT display, one must observe the setting of the vertical attenuator expressed in V/div and the peak to peak deflection of beam, i.e. the number of divisions. The peak value of voltage is then computed as follows.
Vp-p = (volts/div) × (no. Of div)

Fig No. 3: - Sine Waveform
II. Period and Frequency Measurement:
The period and frequency of periodic signals are easily measured with an oscilloscope. The waveform must be displayed such that a complete cycle is displayed on the CRT screen. Accuracy is generally improved if a signal cycle displayed fills as much of the horizontal distance across the screen as possible. The period is calculated as follows. T = (time/div) × (No. of div/cycle) The frequency is then calculated as f = 1/T
III. Measurement of Frequency by Lissajous Method:
This particular pattern results when sine waves are applied simultaneously to both pairs
of the deflection plates. If one frequency is an integral multiple (harmonic) of the other, the pattern will be stationary, and is called a lissajous figure.
In this method of measurement a standard frequency is applied to one set of deflection plates of the CRT tube while the unknown frequency (of approximately the same amplitude) is simultaneously applied to the other set of plates. However, the unknown frequency is presented to the vertical plates and the known frequency (standard) to the horizontal plates. The resulting patterns depend on the integral and phase relationship between the two frequencies. (The horizontal signal is designated as fh and the vertical signal as fv
Measurement Procedure:
Set up the oscilloscope and switch off the internal sweep (change to Ext). Switch off sync control. Connect the signal source as given in Fig. 4. Set the horizontal and vertical gain control for the desired width and height of the pattern. Keep frequency fv constant and vary frequency fh , noting that the pattern spins in alternate directions and changes shape. The pattern stands still whenever fv and fh are in an integral ratio ( either even or odd). The fv = fh pattern stands still and

is a single circle or ellipse. When fv = 2fh , a two loop horizontal pattern is obtained as shown in Fig. 5.
To determine the frequency from any Lissajous figure, count the number of horizontal loops in the pattern, divide it by the number of vertical loops and multiply this quantity by fh , (known or standard frequency).
In Fig.5 (g), there is one horizontal loop and 3 vertical loops, giving a fraction of 1/3. The unknown frequency fv is therefore 1/3 fh. An accurately calibrated, variable frequency oscillator will supply the horizontal search frequency for frequency measurement. For the case where the two frequencies are equal and in phase, the pattern appears as a straight line at an angle of 45° with the horizontal. As the phase between the two alternating signals changes, the pattern changes cyclically, i.e. an ellipse (at 45° with the horizontal) when the phase difference is π/4, a circle when the phase difference is π/2 and an ellipse (at 135° with horizontal) when the phase difference is 3π/4, and a straight line pattern (at 135° with the horizontal) when the phase difference is π radians.
Fig No. 5: - Lissajous Pattern for Integral Frequencies

As the phase angle between the two signals changes from π to 2π radians, the pattern changes correspondingly through the ellipse-circle-ellipse cycle to a straight line. Hence the two frequencies, as well as the phase displacement can be compared using Lissajous figures techniques.
When the two frequencies being compared are not equal, but are fractionally related, a more complex stationary pattern results, whose form is dependent on the frequency ratio and the relative phase between the two signals as in fig 6.
Fig No. 6 : - Lissajous Pattern for Non-Integral Frequencies
The fractional relationship between the two frequencies is determined by counting the number of cycles in the vertical and horizontal. fv = (fraction) × fh or fv = number of horizontal tangencies fh number of vertical tangencies
OBSERVATIONS:
1. Peak to peak voltage Vp-p = (volts/div) × (no. Of div) = 2. Time period T = (time/div) × (No. of div/cycle)= The frequency is then calculated as f = 1/T= 3. Measurement of phase= 4. Measurement of unknown frequency by Z-Modulation=
CONCLUSION:
Thus we have measured voltage, frequency and phase using CRO.

EXPERIMENT NO. 9
Study of y-t, X-Y recorders, frequency response of y-t recorder. OBJECTIVE: To understand working and construction of recorcers.
THEORY: It is often necessary to have a permanent recorder. In many of industrial & research processes it is necessary to monitor continuously the condition, state or value of the process variables such as flow, force, pressure, temprature, current voltage, electrical power etc. A recorder thus records electric & non-electric quantities as a function of time. This record may be written or printed & later on, can be examined & analyses to obtain a better understanding & control of processes. Currents & voltages can be recorded directly while the non-electrical quantities are recorded directly by first converting them to equivalent currents or voltages with the help of sensors or transducers. The every increasing emphasis on automation, continuously recording instruments are finding many applications in industry. There are two types of recording devices.
1. Analog recorders. 2. Digital recorders.
ANALOG RECORDRES:
There are numerous types of analog recorders. They are broadly classified into: a. Graphic recorders b. Oscillographic recorders c. Magnetic Tape recorders
GRAPHIC RECORDERS:
i. Stripchart recorder: A strip chart records one or more dependent variable with respect to time. It is X-t recorder.
ii. X-Y recorders: An X-Y recorder records one or more dependent variable With respect to an independent Variable.
RECORDERS
A recorder is a measuring instrument that displays a time-varying signal in a form easy to examine and re-examine, perhaps long after the original signal has ceased to exist. In other words a recorder is a device whose function is to record the value of a quantity as it is being measured. Such devices may include graphic recording devices, computer printers, tape recorders, or cathode ray tubes.
Recording preserves the experimental data in a manageable and usable form. A recording system is very useful as
(i) it preserves informations which could be obtained at any instant from indicating instruments and

(ii) it gives informations about waveforms and transient behavior or phase relationships in different parts of a circuit.
A recorder records electrical and non-electrical quantities as a function of time or relates two signals to each other. Electrical quantities, such as current, voltage etc, can be recorded directly while non-electrical quantities, such as pressure, temperature, speed, flow etc. are recorded indirectly by first converting them into the form of electrical signals with the help of sensors and transducers.
XY recorder An output device that sketches the relationship between two variables onto a grid of plane rectangular coordinates. These recorders are available in either 81¼2" x 11" (DIN A4) or 11" x 17" (DIN A3) chart sizes. Each operates in X-Y mode or Y-t mode. Recorders feature ±0.25% accuracy. Pen response times are 0.3 second for the X-axis and 0.2 second for the Y-axis— critical for ensuring accurate graphs. Recorders are mechanically simple. Paper is held in place electrostatically while the entire pen assembly travels over length of chart. In X-Y mode, two separate input voltages determine pen position on the X-axis and the Y-axis. In Y-t mode, one input voltage determines Y-axis pen position, and one of nine time sweep speeds determines X-axis position. The control board is easy to operate. Front-mounted switches give you access to pen lift and paper hold-down functions. Alternately, operate pen lift remotely with external TTL signal. Recorders include 7-ft power cord with plug, one pack of chart paper (100 sheets), and pens. Order replacement chart paper from below and replacement pens from the right. Specifications - Product Type X-Y Recorders Input impedance 1 M Chart size 11 in x 17 in (DIN A3) Zero setting -250 to +150% Pen response X-axis: 0.3 sec full-scale. Y-axis: 0.2 sec full-scale Accuracy ±0.25% full-scale No. of channels two (X and Y) Power 115/230 VAC, 50 to 400 Hz Dimensions 15.0625 in W x 5.875 in H x 15.25 in D. X-Y Recorders
Such recorders are used where it is desired to plot the relationship between two variables, Y = f(x) instead of plotting each variable separately as a function of time. In such recorders chart remains fixed its position and the pen moves simultaneously in both the X and Y directions in response to electrical signals applied to its input terminals. As most of the x-y recorders also have a time base, so they can be used to plot the variation of one variable against time as well. Thus such recorders carry out some measurements in the same way as the strip chart recorders do.
The advantages of x-y recorders are that they are rather economical to operate as ordinary low-cost paper can be used for the chart and they are easy and convenient to use. The disadvantages of x-y recorders are that in comparison to strip-chart recorders they are most expensive to buy, and cannot be employed for continuous recording. Because of electromechanical mechanism used for movement of pen the frequency response the speeds of x-y recorders are inherently limited.
An x-y recorder may have the sensitivity of 10 µ V/mm, slewing speed 1.5 m/s, a frequency response of about 6 Hz in both the X and Y directions, and an accuracy of + 0.2 per cent of full-scale. The paper size used in these recorders is 440 280 mm or 280 mm 220 mm. Input impedance is from 100µ k to 50 M or more depending upon the sensitivity range.

X-Y recorders have wide applications. These can be successfully employed for plotting current vs. voltage curves of diodes and transistors, plotting B-H curves of magnetic materials and plotting speed-time curves for electric motors etc.
A strip chart recorder records the variations of a quantity with respect to time while a X-Y recorder is an instrument which gives a graphic record of the relationship between two variables.
In strip recorders, usually self-balancing potentiometers are used. These self-balancing potentiometers plot the emf as a function of time. In X-Y recorders, an emf is plotted as a function of another emf. This is done by having one self-balancing potentiometer control the position of the rolls. while another self-balancing potentiometer controls the position of the recording pen.
In some X-Y recorders, one self-balancing potentiometer circuit moves a recording pen in the X direction while another self-balancing potentiometer circuit moves the recording pen in the Y direction at right angles to the X direction, while the paper remains stationary.
There are many variations of X-Y recorders. The emf, used for operation of X-Y recorders, may not necessarily measure only voltages. The measured emf may be the output of a transducer that may measure displacement force, pressure, strain , light intensity or any other physical quantity. Thus with the help of X-Y recorders and appropriate transducers, a physical quantity may be plotted against another physical quantity.
Hence an X-Y recorder consists of a pair of servo-systems, driving a recording pen in two axes
through a proper sliding pen and moving arm arrangement, with reference to a stationary paper chart.
Attenuators are used to bring the input signals to the levels acceptable by the recorder.
CONCLUSION:
Thus we have studied the x-y and y-t recorder.