Embed Size (px)
Citation preview

BHARTI AIRTEL LIMITED
Registered Office: Bharti Crescent, 1, Nelson Mandela Road, Vasant Kunj, Phase II, New Delhi – 110 070, India
Financial results for the quarter ended June 30, 2012
1. Consolidated summarised financial results of Bharti Airtel Limited and its subsidiaries prepared as per
International Financial Reporting Standards (IFRS)
PDF processed with CutePDF evaluation edition www.CutePDF.com

2. Segment Reporting – Prepared as per International Financial Reporting Standards (IFRS) (as Consolidated Entity)
#
Effective October 1, 2011 corporate headquarters’ results and capital employed earlier reported under ‘Others’ has been regrouped to ‘Unallocated’ for all periods presented.
* Comprises borrowings (including borrowings for acquisition of Africa operations and other borrowings of Africa operations of Rs 550,860 Mn
(USD 9.78 bn), Rs 465,774 Mn (USD 10.42 bn) and Rs 508,113 Mn (USD 9.93 bn)), for 3G and BWA licences of Rs 54,750 Mn, Rs 61,879 Mn
and Rs 61,117 Mn, as at June 30, 2012, June 30, 2011 and March 31,2012, respectively, provision for taxes, deferred tax asset/ liabilities and
fair value of derivative financial instruments. @
Previously known as Enterprise Services. $
Previously known as DTH.
Notes to accounts
1. The above financial results for the first quarter and three months ended June 30, 2012 have been
reviewed by the Audit Committee in its meeting held on August 7, 2012 and approved by the Board of
Directors in its meeting held on August 8, 2012.
2. In terms of clause 41 of the listing agreement, the Company has voluntarily adopted International
Financial Reporting Standards (IFRS) notified by the International Accounting Standards Board, in the
preparation of consolidated financial statements w.e.f. April 1, 2010 and has decided to publish only the
consolidated financial results in the newspapers. However, the standalone financial results of the
Company for the three months ended June 30, 2012 are being submitted to the stock exchanges and will
also be available on the Company’s website (www.airtel.in).

3. Segment wise revenue, results and capital employed have been provided separately under segment
reporting. The consolidated financial statements have been furnished to provide information about overall
business of the Company, its subsidiaries, joint ventures and associates.
4. Effective April 1, 2012, in line with the changes in the internal reporting, the Broadband Wireless Access
(BWA) services reported earlier under "Telemedia Services" , is now reported as part of ‘Mobile Services
India and South Asia’. Accordingly, previous periods’ / year’s segment figures have been
regrouped/rearranged.
5. Pursuant to a definitive agreement dated May 24, 2012, Bharti Airtel Limited has acquired 49% stake for a
consideration of Rs 9,281 million (USD 165 million) in Qualcomm Asia Pacific’s (Qualcomm AP) 4 Indian
subsidiaries ("BWA entities"), (i) Wireless Business Services Private Limited- that holds Category 'A' ISP
licenses and broadband wireless spectrum in the frequencies of 2327.5 - 2347.5 for the Service Area of
Mumbai, 2327.5 - 2347.5 for the Service Area of Delhi, 2325.0 - 2345.0 for the Service Area of Kerala and
2362.5 - 2382.5 for the Service Area of Haryana ,(ii) Wireless Broadband Business Services (Delhi)
Private Limited (iii) Wireless Broadband Business Services (Kerala) Private Limited and (iv) Wireless
Broadband Business Services (Haryana) Private Limited, partly by way of acquisition of 26% equity
interest from its existing shareholders and balance 23% by way of subscription of fresh equity in the
referred entities. The agreement contemplates that once commercial operations are launched, subject to
certain terms and conditions, Bharti has the option to assume complete ownership and financial
responsibility for the BWA entities by the end of 2014.
6. During the quarter ended June 30, 2012, the Company made additional equity investments in its following
wholly owned subsidiaries:
� Rs. 400 Mn in Airtel M Commerce Services Limited; and
� USD 50 Mn (Rs 2,852 Mn) in Bharti Airtel International (Mauritius) Limited
7. During the quarter ended June 30, 2012, Bharti Airtel Employee Welfare Trust (a trust set up for
administration of ESOP Schemes of the Company) has transferred 116,466 shares to the employees
upon exercise of stock options, under ESOP Scheme 2005. As of June 30, 2012, the trust holds 547,901
equity shares.
8. Audited financial results of Bharti Airtel Limited as per IGAAP (standalone information in terms of clause
41 (IV) (b) of the Listing agreement) are as follows:
9. Previous year’s / periods’ figures have been regrouped/ rearranged, wherever required.
For Bharti Airtel Limited For Bharti Airtel Limited
Sd/- Sd/- Sunil Bharti Mittal Sanjay Kapoor Chairman and Managing Director CEO (India & South Asia) Singapore August 8, 2012 “Bharti Airtel”, or “the Company”, wherever stated stands for Bharti Airtel Limited.Group, wherever stated stands for Bharti Airtel together with its subsidiaries For more details on the financial results, please visit our website www.airtel.in

BHARTI AIRTEL LIMITED
Registered Office: Bharti Crescent, 1, Nelson Mandela Road, Vasant Kunj, Phase II, New Delhi – 110 070, India
Financial results for the quarter ended June 30, 2012
1. Bharti Airtel Limited – Audited financial results for the quarter ended June 30, 2012 as per Indian GAAP (as Stand alone
entity)

2. Segment Reporting - Prepared as per Indian GAAP (as Stand alone entity)
*Excludes inter segment assets and liabilities.
** Includes borrowings for 3G and BWA licenses of Rs 54,750 mn, Rs 61,879 mn and Rs 61,117 mn, as at June 30, 2012, June 30, 2011 and March 31, 2012, respectively. # Includes foreign exchange fluctuations in respect of loans given to subsidiaries.
$ Earlier reported as „Others‟.
@ Previously known as Enterprise Services.
Notes to accounts
1. Notes to the consolidated financial statements form part of the notes to the standalone financial results.
2. Previous year‟s/period‟s figures have been regrouped / rearranged, wherever required.
3. Reserves and surplus as at June 30, 2012 include Rs 2,941 million for the Company, towards employee stock option outstanding
account (net of the related deferred cost) of the Company.
For Bharti Airtel Limited For Bharti Airtel Limited Sd/- Sd/-
Sunil Bharti Mittal Sanjay Kapoor Chairman and Managing Director CEO (India & South Asia) Singapore August 8, 2012 “Bharti Airtel”, or “the Company”, wherever stated stands for Bharti Airtel Limited. For more details on the financial results, please visit our website www.airtel.in


Bharti Airtel Limited – Media Release Aug 8, 2012
Page 1 of 2
Bharti Airtel Limited
Consolidated Revenues up 14% India Mobile Data: Crosses 38 mn Customers, Revenues up 44%
Bharti Airtel announces consolidated IFRS results for the first quarter ended
June 30, 2012
Highlights for the first quarter ended June 30, 2012
Overall customer base stands at 260.7 million, across 20 countries.
Crosses 250 million wireless customers, Airtel continues to be amongst the global top 5.
Total minutes on network at 274.6 billion, sequentially up by 3.5% (9.4 billion).
Consolidated total revenues at ` 19,350 crore, up by 14.0% Y-o-Y; Africa up by 31.5%, and India Mobile Data revenues up by 44.2%.
Consolidated EBITDA of ` 5,849 crore, up by 2.5% Y-o-Y. EBITDA margin at 30.2% (PY:33.6%).
Operating Free Cash Flow at ` 2,273 crore, up by 67.4% Y-o-Y. New Delhi, India, Aug 8, 2012: Bharti Airtel Limited (“Bharti Airtel” or “the Company”) today announced its audited consolidated IFRS results for the first quarter ended June 30, 2012. Revenues in Q1 on a consolidated basis at ` 19,350 crore grew by 14.0% over the corresponding period last year, marked by growth of 31.5% in Africa and a strong 44.2% increase in India Mobile Data revenues. EBITDA margin at 30.2% was depressed due to the adverse regulatory and tax developments in India, enhanced market participation and planned accelerated investments in both India and Africa. Consequently, the Consolidated Net Income came in at ` 762 crore (Q1FY12: ` 1,215 crore). The Consolidated Operating Free Cash Flows for the quarter was healthy at ` 2,273 crore which represents an increase of 67.4% over the corresponding period last year. The Net Debt - Equity ratio was at 1.38 (Q4FY12: 1.29) and Net Debt - EBITDA ratio was held at 2.54 (Q4FY12: 2.56). Mobile revenues in India during the quarter were impacted by two significant changes : i) TRAI guidelines around processing fees restricted the sales of “combo packs” which offered bundled service propositions to augment customer value. ii) The service tax hike from 10.3% to 12.36%, effective 1st April 2012, causing all telecom services to become dearer by nearly 2%, with the entire additional levy being passed through to the exchequer. Africa revenues grew by 31.5%, driven by strong operational performance in the last year and favourable currency movements. However, economic and currency headwinds are presently evident in key markets, as a result of the eurozone crisis, lower aid and grants, rising inflation and political issues in some countries. With this in mind, the company intensified market operations, advertising, network rollouts, as well as new growth initiatives such as 3G, airtel money and Rwanda. In a statement, Mr. Sunil Bharti Mittal, Chairman & Managing Director, Bharti Airtel Limited, said: “Telecom revenues in India have been depressed due to hyper-competition and recent regulatory & tax developments. I am happy to note that, despite these adverse developments, Airtel has kept its focus on network expansion, market investments, superior customer experience and new product innovations. I am also pleased to see that India data pick-up is accelerating with over 38 million customers and mobile data revenues up 44%. On the African side, we are gaining market share, benefitting from the significant investments made in the last two years.”

Bharti Airtel Limited – Media Release Aug 8, 2012
Page 2 of 2
Summary of the Consolidated Statement of Income – represents consolidated Statement of Income as per International Financial Reporting Standards (IFRS)
(Amount in ` crore, except ratios)
Jun 2012 Jun 2011
Total revenues 19,350 16,975 14.0%
EBITDA 5,849 5,706 2.5%
Profit before tax 1,263 1,719 -26.6%
Net Income 762 1,215 -37.3%
Operating free cash flow 2,273 1,357 67.4%
ParticularsQuarter Ended Y-o-Y
Grow th
Customer Base
(Figures in nos, except ratios)
Parameters Unit Jun 2012 Mar 2012Q-o-Q
Grow thJun 2011
Y-o-Y
Grow th
Mobile Services 000's 250,038 241,148 3.7% 221,247 13.0%
India & South Asia 000's 194,183 188,008 3.3% 174,941 11.0%
Africa 000's 55,855 53,140 5.1% 46,306 20.6%
Telemedia Services 000's 3,272 3,270 0.1% 3,322 -1.5%
Digital TV Services 000's 7,400 7,228 2.4% 6,262 18.2%
Total 000's 260,710 251,646 3.6% 230,831 12.9%
About Bharti Airtel Limited Bharti Airtel Limited is a leading integrated telecommunications company with operations in 20 countries across Asia and Africa. Headquartered in New Delhi, India, the Company ranks amongst the top 5 mobile service providers globally in terms of subscribers. In India, the Company's product offerings include 2G, 3G and 4G services, fixed line, high speed broadband through DSL, IPTV, DTH, enterprise services including national & international long distance services to carriers. In the rest of the geographies, it offers 2G, 3G mobile services. Bharti Airtel had close to 261 million customers across its operations at the end of June 2012. To know more please visit, www.airtel.com
Disclaimer: [This communication does not constitute an offer of securities for sale in the United States. Securities may not be sold in the United States absent registration or an exemption from registration under the U.S. Securities Act of 1933, as amended. Any public offering of securities to be made in the United States will be made by means of a prospectus and will contain detailed information about the Company and its management, as well as financial statements.]

Quarterly report on the results for the first quarter ended Jun 30, 2012
Bharti Airtel Limited (Incorporated as a public limited company on July 7, 1995 under the Companies Act, 1956)
Bharti Crescent, 1, Nelson Mandela Road, Vasant Kunj, Phase II, New Delhi – 110 070, India
August 08, 2012
The financial statements included in this quarterly report fairly presents in all material respects the financial position, results of operations, cash flow of the company as of, and for the periods presented in this report.
| Mobile Services I Telemedia Services I Airtel Business | Digital TV Services | Passive Infrastructure Services |

Page 2 of 52
Supplemental Disclosures
Safe Harbor: - Some information in this report may contain forward-looking statements. We have based these forward-looking statements on our current beliefs, expectations and intentions as to facts, actions and events that will or may occur in the future. Such statements generally are identified by forward-looking words such as “believe,” “plan,” “anticipate,” “continue,” “estimate,” “expect,” “may,” “will” or other similar words. A forward-looking statement may include a statement of the assumptions or basis underlying the forward-looking statement. We have chosen these assumptions or basis in good faith, and we believe that they are reasonable in all material respects. However, we caution you that forward-looking statements and assumed facts or basis almost always vary from actual results, and the differences between the results implied by the forward-looking statements and assumed facts or basis and actual results can be material, depending on the circumstances. You should also keep in mind that any forward-looking statement made by us in this report or elsewhere speaks only as of the date on which we made it. New risks and uncertainties come up from time to time, and it is impossible for us to predict these events or how they may affect us. We have no duty to, and do not intend to, update or revise the forward-looking statements in this report after the date hereof. In light of these risks and uncertainties, any forward-looking statement made in this report or elsewhere may or may not occur and has to be understood and read along with this supplemental disclosure. General Risk: - Investment in equity and equity related securities involve a degree of risk and investors should not invest any funds in this Company without necessary diligence and relying on their own examination of Bharti Airtel, along with the equity investment risk which doesn't guarantee capital protection. Convenience translation: - We publish our financial statements in Indian Rupees. All references herein to “Indian Rupees” and “Rs” are to Indian Rupees and all references herein to “US dollars” and “US$” are to United States dollars. Translation of income statement items have been made from Indian Rupees to United States dollars (unless otherwise indicated) using the respective quarter average rate. Translation of Statement of financial position items have been made from Indian Rupees to United States dollars (unless otherwise indicated) using the closing rate. The rates announced by the Reserve Bank of India are being used as the Reference rate for respective translations. All amounts translated into United States dollars as described above are provided solely for the convenience of the reader, and no representation is made that the Indian Rupees or United States dollar amounts referred to herein could have been or could be converted into United States dollars or Indian Rupees respectively, as the case may be, at any particular rate, the above rates or at all. Any discrepancies in any table between totals and sums of the amounts listed are due to rounding off. Functional Translation (Africa): - Wherever Africa financials are reported in the quarterly report, the same are published in their functional currency i.e. US$. Refer Section “A.2.4 Key Accounting Policies as per IFRS”. Use of Certain Non-GAAP measures: - This result announcement contains certain information on the Company’s results of operations and cash flows that have been derived from amounts calculated in accordance with International Financial Reporting Standards (IFRS), but are not in themselves IFRS measures. They should not be viewed in isolation as alternatives to the equivalent IFRS measures and should be read in conjunction with the equivalent IFRS measures. Further, disclosures are also provided under “Use of Non - GAAP financial information” on page 33 Others: In this report, the terms “we”, “us”, “our”, “Bharti”, or “the Company”, unless otherwise specified or the context otherwise implies,
refer to Bharti Airtel Limited (“Bharti Airtel”) and its subsidiaries, Bharti Hexacom Limited (“Bharti Hexacom”), Bharti Airtel Services Limited, Bharti Infratel Limited (Bharti Infratel), Bharti Infratel Ventures Limited (subsidiary of Bharti Infratel Limited), Bharti Telemedia Limited (Bharti Telemedia), Bharti Airtel (USA) Limited, Bharti Airtel (UK) Limited, Bharti Airtel (Canada) Limited, Bharti Airtel (Hong Kong) Limited, Bharti Airtel Lanka (Private) Limited, Network i2i Limited, Bharti Airtel Holdings (Singapore) Pte Limited, Bharti Infratel Lanka (Private) Limited (subsidiary of Bharti Airtel Lanka (Private) Limited), Bharti Airtel International (Netherlands) B.V., Bharti International (Singapore) Pte Ltd, Airtel Bangladesh Limited, Airtel M Commerce Services Limited, Bharti Airtel (Japan) Kabushiki Kaisha, Bharti Airtel (France) SAS, Bharti Airtel International (Mauritius) Limited, Indian Ocean Telecom Limited, Airtel (Seychelles) Limited, Bharti Airtel Africa B.V., Bharti Airtel Acquisition Holdings B.V., Bharti Airtel Burkina Faso Holdings B.V., Bharti Airtel Cameroon Holdings B.V., Bharti Airtel Chad Holdings B.V., Bharti Airtel Congo Holdings B.V., Bharti Airtel Gabon Holdings B.V., Bharti Airtel Ghana Holdings B.V., Bharti Airtel Kenya B.V., Bharti Airtel Kenya Holdings B.V., Bharti Airtel Madagascar Holdings B.V., Bharti Airtel Malawi Holdings B.V., Bharti Airtel Mali Holdings B.V., Bharti Airtel Niger Holdings B.V., Bharti Airtel Nigeria B.V., Bharti Airtel Nigeria Holdings B.V., Bharti Airtel Nigeria Holdings II B.V., Bharti Airtel RDC Holdings B.V., Bharti Airtel Services B.V., Bharti Airtel Sierra Leone Holdings B.V., Bharti Airtel Tanzania B.V., Bharti Airtel Uganda Holdings B.V., Bharti Airtel Zambia Holdings B.V., Airtel Burkina Faso S.A., Airtel Congo S.A, Celtel Congo RDC S.a.r.l., Celtel Gabon S.A., Airtel (Ghana) Limited, Airtel Networks Kenya Limited, Airtel Madagascar S.A., Airtel Malawi Limited, Celtel Niger S.A., Airtel Networks Limited, Airtel Tanzania Limited, Airtel Uganda Limited, Celtel Zambia plc, Bharti Airtel DTH Holdings B.V., Celtel Cameroon SA, Partnership Investments Sprl, MSI-Celtel Nigeria Limited, Celtel (Mauritius) Holdings Limited, Channel Sea Management Co Mauritius Limited, Montana International, Zap Trust Company Nigeria Limited, Airtel Mobile Commerce Tchad SARL, ZMP Ltd. (Zambia), Airtel Mobile Commerce Malawi Limited, Airtel Mobile Commerce Ghana Limited, Airtel Mobile Commerce Kenya Limited, Airtel Money Niger S.A, Airtel Mobile Commerce (SL) Limited, Africa Towers N.V., Airtel DTH Services Ghana Limited, Airtel DTH Services Malawi Limited, Airtel DTH Services Uganda Limited, Airtel Towers (Ghana) Limited, Malawi Towers Limited, Mobile Commerce Gabon S.A, Société Malgache de Telephonie Cellulaire SA, Uganda Towers Limited, Airtel Mobile Commerce Tanzania Limited, Airtel (SL) Limited, Airtel DTH Services (K) Limited, Airtel DTH Services (Sierra Leone) Limited, Airtel DTH Services Burkina Faso S.A., Airtel DTH Services Congo (RDC )S.p.r.l, Airtel DTH Services Congo S.A., Airtel DTH Services Gabon S.A., Airtel DTH Services Madagascar S.A., Airtel DTH Services Niger S.A., Airtel DTH Services Nigeria Limited, Airtel DTH Services T.Chad S.A., Airtel DTH Services Tanzania Limited, Bharti DTH Services Zambia Limited, Airtel Money (RDC) S.p.r.l, Burkia Faso Towers S.A. , Congo RDC Towers S.p.r.l., Congo Towers S.A., Gabon Towers S.A., Kenya Towers Limited, Madagascar Towers S.A., Mobile Commerce Congo S.A., Niger Towers S.A., Tanzania Towers Limited, Tchad Towers S.A., Towers Support Nigeria Limited, Bharti Airtel Developers Forum Ltd., Bangladesh Infratel Networks Limited, Africa Towers Services Limited, Airtel Mobile Commerce B.V., Airtel Mobile Commerce Burkina Faso S.A., Airtel Mobile Commerce Holdings B.V., Airtel Mobile Commerce Madagascar S.A., Airtel Mobile Commerce Uganda Limited, Airtel Rwanda Limited, Airtel Towers S.L. Company, Bharti Airtel Cameroon B.V., Celtel Tchad S.A., Rwanda Towers Limited, Zambian Towers Limited, Zebrano (Mauritius) Limited. Disclaimer: - This communication does not constitute an offer of securities for sale in the United States. Securities may not be sold in the United States absent registration or an exemption from registration under the U.S. Securities Act of 1933, as amended. Any public offering of securities to be made in the United States will be made by means of a prospectus and will contain detailed information about the Company and its management, as well as financial statements.
Page 3 of 52
TABLE OF CONTENTS
Section 1 Bharti Airtel – Performance at a glance 4
Section 2 An Overview 5
Section 3 Financial Highlights as per IFRS
3.1 Consolidated - Summary of Consolidated Financial Statements 7
3.2 Region wise - Summary of Statement of Operations 8
3.3 Segment wise - Summary of Statement of Operations 9
3.4 Region wise & Segment wise - Investment & Contribution 12
Section 4 Operating Highlights 13
Section 5 Management Discussion & Analysis
5.1 India & South Asia 17
5.2 Africa 19
5.3 Results of Operations 21
5.4 Three Line Graph 24
Section 6 Stock Market Highlights 25
Section 7 Detailed Financial and Related Information 27
Annexure Trends & Policies
A.1 Trends & Ratio Analysis 34
A.2 Key Accounting Policies as per IFRS 42
Glossary 46
Page 4 of 52
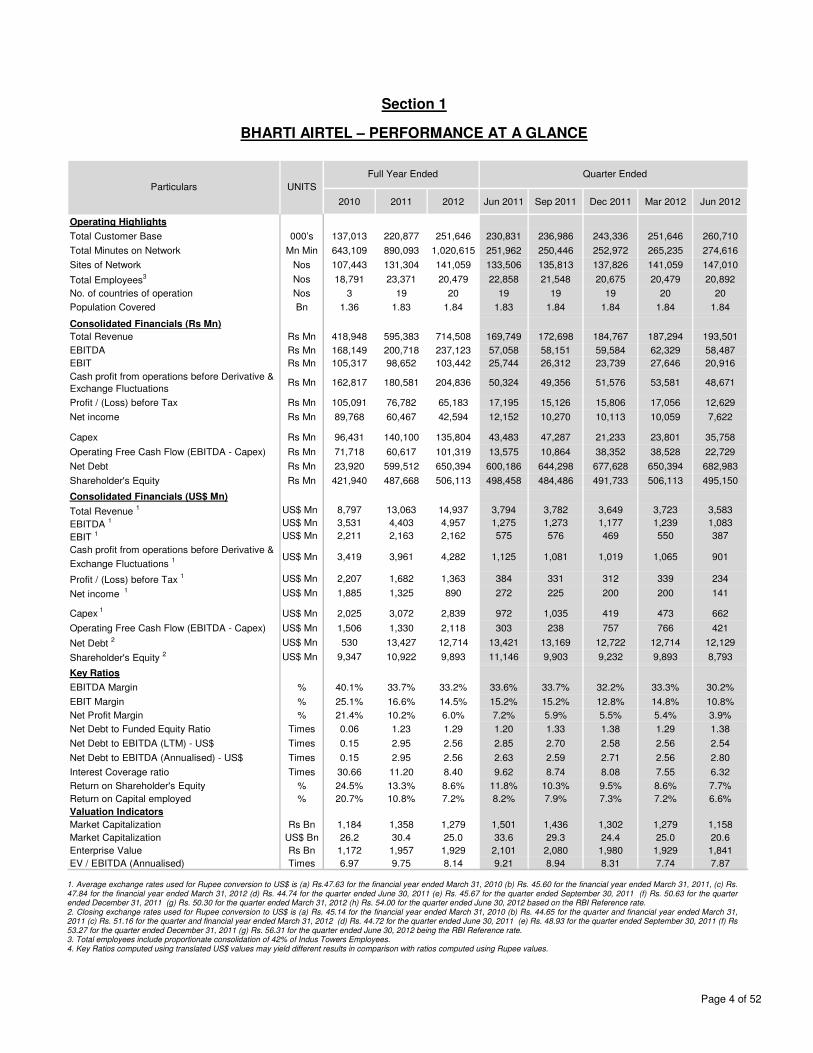
Section 1
BHARTI AIRTEL – PERFORMANCE AT A GLANCE
2010 2011 2012 Jun 2011 Sep 2011 Dec 2011 Mar 2012 Jun 2012
Operating Highlights
Total Customer Base 000’s 137,013 220,877 251,646 230,831 236,986 243,336 251,646 260,710
Total Minutes on Network Mn Min 643,109 890,093 1,020,615 251,962 250,446 252,972 265,235 274,616
Sites of Network Nos 107,443 131,304 141,059 133,506 135,813 137,826 141,059 147,010
Total Employees3 Nos 18,791 23,371 20,479 22,858 21,548 20,675 20,479 20,892
No. of countries of operation Nos 3 19 20 19 19 19 20 20
Population Covered Bn 1.36 1.83 1.84 1.83 1.84 1.84 1.84 1.84
Consolidated Financials (Rs Mn)
Total Revenue Rs Mn 418,948 595,383 714,508 169,749 172,698 184,767 187,294 193,501
EBITDA Rs Mn 168,149 200,718 237,123 57,058 58,151 59,584 62,329 58,487
EBIT Rs Mn 105,317 98,652 103,442 25,744 26,312 23,739 27,646 20,916
Cash profit from operations before Derivative &
Exchange FluctuationsRs Mn 162,817 180,581 204,836 50,324 49,356 51,576 53,581 48,671
Profit / (Loss) before Tax Rs Mn 105,091 76,782 65,183 17,195 15,126 15,806 17,056 12,629
Net income Rs Mn 89,768 60,467 42,594 12,152 10,270 10,113 10,059 7,622
Capex Rs Mn 96,431 140,100 135,804 43,483 47,287 21,233 23,801 35,758
Operating Free Cash Flow (EBITDA - Capex) Rs Mn 71,718 60,617 101,319 13,575 10,864 38,352 38,528 22,729
Net Debt Rs Mn 23,920 599,512 650,394 600,186 644,298 677,628 650,394 682,983
Shareholder's Equity Rs Mn 421,940 487,668 506,113 498,458 484,486 491,733 506,113 495,150
Consolidated Financials (US$ Mn)
Total Revenue 1 US$ Mn 8,797 13,063 14,937 3,794 3,782 3,649 3,723 3,583
EBITDA 1 US$ Mn 3,531 4,403 4,957 1,275 1,273 1,177 1,239 1,083
EBIT 1 US$ Mn 2,211 2,163 2,162 575 576 469 550 387
Cash profit from operations before Derivative &
Exchange Fluctuations 1 US$ Mn 3,419 3,961 4,282 1,125 1,081 1,019 1,065 901
Profit / (Loss) before Tax 1 US$ Mn 2,207 1,682 1,363 384 331 312 339 234
Net income 1 US$ Mn 1,885 1,325 890 272 225 200 200 141
Capex 1
US$ Mn 2,025 3,072 2,839 972 1,035 419 473 662
Operating Free Cash Flow (EBITDA - Capex) US$ Mn 1,506 1,330 2,118 303 238 757 766 421
Net Debt 2 US$ Mn 530 13,427 12,714 13,421 13,169 12,722 12,714 12,129
Shareholder's Equity 2 US$ Mn 9,347 10,922 9,893 11,146 9,903 9,232 9,893 8,793
0 0 0 0 0 0 0 0Key Ratios
EBITDA Margin % 40.1% 33.7% 33.2% 33.6% 33.7% 32.2% 33.3% 30.2%
EBIT Margin % 25.1% 16.6% 14.5% 15.2% 15.2% 12.8% 14.8% 10.8%
Net Profit Margin % 21.4% 10.2% 6.0% 7.2% 5.9% 5.5% 5.4% 3.9%
Net Debt to Funded Equity Ratio Times 0.06 1.23 1.29 1.20 1.33 1.38 1.29 1.38
Net Debt to EBITDA (LTM) - US$ Times 0.15 2.95 2.56 2.85 2.70 2.58 2.56 2.54
Net Debt to EBITDA (Annualised) - US$ Times 0.15 2.95 2.56 2.63 2.59 2.71 2.56 2.80
Interest Coverage ratio Times 30.66 11.20 8.40 9.62 8.74 8.08 7.55 6.32
Return on Shareholder's Equity % 24.5% 13.3% 8.6% 11.8% 10.3% 9.5% 8.6% 7.7%
Return on Capital employed % 20.7% 10.8% 7.2% 8.2% 7.9% 7.3% 7.2% 6.6%
Valuation Indicators
Market Capitalization Rs Bn 1,184 1,358 1,279 1,501 1,436 1,302 1,279 1,158
Market Capitalization US$ Bn 26.2 30.4 25.0 33.6 29.3 24.4 25.0 20.6
Enterprise Value Rs Bn 1,172 1,957 1,929 2,101 2,080 1,980 1,929 1,841
EV / EBITDA (Annualised) Times 6.97 9.75 8.14 9.21 8.94 8.31 7.74 7.87
Particulars UNITS
Full Year Ended Quarter Ended
1. Average exchange rates used for Rupee conversion to US$ is (a) Rs.47.63 for the financial year ended March 31, 2010 (b) Rs. 45.60 for the financial year ended March 31, 2011, (c) Rs. 47.84 for the financial year ended March 31, 2012 (d) Rs. 44.74 for the quarter ended June 30, 2011 (e) Rs. 45.67 for the quarter ended September 30, 2011 (f) Rs. 50.63 for the quarter ended December 31, 2011 (g) Rs. 50.30 for the quarter ended March 31, 2012 (h) Rs. 54.00 for the quarter ended June 30, 2012 based on the RBI Reference rate. 2. Closing exchange rates used for Rupee conversion to US$ is (a) Rs. 45.14 for the financial year ended March 31, 2010 (b) Rs. 44.65 for the quarter and financial year ended March 31, 2011 (c) Rs. 51.16 for the quarter and financial year ended March 31, 2012 (d) Rs. 44.72 for the quarter ended June 30, 2011 (e) Rs. 48.93 for the quarter ended September 30, 2011 (f) Rs 53.27 for the quarter ended December 31, 2011 (g) Rs. 56.31 for the quarter ended June 30, 2012 being the RBI Reference rate. 3. Total employees include proportionate consolidation of 42% of Indus Towers Employees. 4. Key Ratios computed using translated US$ values may yield different results in comparison with ratios computed using Rupee values.

Page 5 of 52
Section 2
AN OVERVIEW
2.1 Introduction We are one of the world’s leading providers of telecommunication services with significant presence in India, operations spread over 17 countries of Africa, Sri Lanka and Bangladesh. We served close to 261 million customers as of June 30, 2012. Our bouquet of services include telecommunication services under wireless and fixed line technology, integrated suite of telecom solutions to our enterprise customers and providing long distance connectivity both nationally and internationally. We also offer Digital TV and IPTV Services. All these services are rendered under a unified brand “airtel”. The company also deploys, owns and manages passive infrastructure pertaining to telecom operations through its subsidiary and joint venture entity. 2.2 Business Divisions 2.2.1 India & South Asia The operations of Bharti Airtel in India and South Asia are divided into two distinct Customer Business Units (CBU) with clear focus on B2C (Business to Customer) and B2B (Business to Business) segments. The B2C organization consists of Consumer Business and Market Operations. The B2B business unit focuses on serving large corporate and carriers through Bharti Airtel’s wide portfolio of telecommunication solutions. B2C Services: Mobile Services (India & South Asia): We offer mobile services using GSM technology in South East Asia across India, Sri Lanka and Bangladesh, serving a total of 194 million customers in these geographies. In India, we have 187.3 million mobile customers as on June 30, 2012, which makes us the largest wireless operator in the country both in terms of customers and revenues. We offer postpaid, pre-paid, roaming, internet, m-commerce and other value added services through our extensive sales and distribution network covering over 1.5 million outlets. Our network is present in 5,121 census towns and 455,575 non-census towns and villages in India, covering approximately 86.5% of the country’s population. We also provide 3G services in key cities of the country offering host of innovative services to our customers like Mobile TV, video calls, live streaming of videos, gaming along with access to high speed internet. We have 5.1 million active 3G customers of which 3.7 million are active 3G data customers as on June 30, 2012. Our Airtel Money provides mobile wallet service offering money transfer between its own mobile wallets & to bank accounts including person to person money transfer capability. Post the successful launch of 4G services in Kolkata, this quarter also saw the launch of 4G services in Bengaluru. These services based on TDLTE technology, offer a wide range of services to our customers including rich content, superfast access to High Definition (HD) video streaming, multiple chatting, instant uploading of pictures etc. Our national long distance infrastructure comprises of 159,762 Rkms of optical fibre, thereby providing a pan India reach.
Airtel Sri Lanka has 1.6 million customers with presence in all 25 administrative districts of Sri Lanka. We have launched 3.5G services in major towns and have created a nationwide distribution network comprising of over 48,000 retailers. Airtel Bangladesh has 5.3 million customers and offers mobile services across 64 districts of Bangladesh with a distribution network comprising of around 85,000 retailers across the country. The burgeoning economy of Bangladesh coupled with growing population coverage of nearly 70% presents a unique market opportunity for telecom services. Telemedia Services – We provide broadband (DSL), data and telephone services (fixed line) in 87 cities with growing focus on various data solutions for the Small & Medium Business (SMB) segment. We have 3.3 million customers of which 1.4 million have subscribed to broadband / internet services, as on June 30, 2012. Our product offerings in this segment include fixed-line telephones providing local, national and international long distance voice connectivity, broadband internet access through DSL, internet leased lines as well as MPLS (multiprotocol label switching) solutions. We remain strongly committed to our focus on the SMB segment by providing a range of telecom & software solutions and aim to achieve revenue leadership in this rapidly growing segment of the ICT market. The strategy of this business unit is to focus on cities with high revenue potential. Digital TV Services – Airtel digital TV has 7.4 million customers on its Direct-To-Home (DTH) platform. We also offer High Definition (HD) Set Top Boxes and Digital TV Recorders with 3D capabilities delivering superior customer experience. We currently offer a total of 298 channels including 15 HD channels and 6 interactive services. We are the first company in India which provides real integration of all the three screens viz. television, mobile and computer enabling our customers to record their favorite TV programs through mobile and web. B2B Services: Airtel Business – Airtel business offers wide portfolio of services that include voice, data, network integration, data center & managed services, enterprise mobile applications and digital media. It is India’s leading and most trusted provider of communication and ICT services to large Enterprise, Government, Small & Medium businesses and carrier customers. Airtel business offers network infrastructure, integration & management with a combination of cutting edge global network infrastructure, technical skills and world-class services through a consultative approach. Our portfolio of MPLS and IP services helps our customers in keeping mission critical applications running and in managing the flow of information across the globe. Our data center & managed services include entire suite of managed hosting, storage, business continuity, data security & cloud services. Airtel business also offers digital media services, a centralized online media management and distribution platform akin to a media exchange linking all the content owners, production facilities and screens enabling

Page 6 of 52
them to store, forward, share & trade multi versions of produced content to multiple platforms across the globe. Our Global services for both voice and data, with strategically located submarine cable systems across the world and satellite connectivity in hard to reach areas, provide our customers connectivity from anywhere to everywhere in the world. Our international infrastructure includes ownership of the i2i submarine cable system connecting Chennai to Singapore, consortium ownership of the SMW4 submarine cable system connecting Chennai and Mumbai to Singapore and Europe, and our investments in new cable systems such as Asia America Gateway (AAG), India Middle East & Western Europe (IMEWE), Unity, EIG (Europe India Gateway) and East Africa Submarine System (EASSy) expanding our global network to over 225,000 Rkms, covering 50 countries across 5 Continents. We also have terrestrial express connectivity to neighboring countries including Nepal, Pakistan, Bhutan and China. Passive Infrastructure Services – Bharti Infratel provides passive infrastructure services on a non-discriminatory basis to all telecom operators in India. It deploys, owns and manages passive infrastructure in 11 circles of India. Bharti Infratel also holds 42% share in Indus Towers (a Joint Venture between Bharti Infratel, Vodafone and Idea Cellular). Indus Towers operates in 15 circles (4 circles common with Bharti Infratel, 11 circles on exclusive basis). Bharti Infratel has 33,660 towers in 11 circles, (excluding the 35,252 towers in 11 circles for which the right of use has been assigned to Indus Towers with effect from January 1, 2009). Indus Towers has a portfolio of 109,318 towers including the towers under right of use. 2.2.2 Africa Mobile Services – We offer mobile services in 17 countries across Africa, namely: Nigeria, Burkina Faso, Chad, Congo B, Democratic Republic of Congo, Gabon, Madagascar, Niger, Ghana, Kenya, Malawi, Seychelles, Sierra Leone, Tanzania, Uganda, Zambia and Rwanda. This makes Airtel’s footprint across Africa, the largest amongst all telecommunication service providers in the continent. We continue to grow as the most loved brand and currently serve 55.9 million customers across these geographies. We offer wide range of services to our customers, which includes post-paid, pre-paid, roaming, One-Network, Airtel Money, internet services, content, media & entertainment and other non-voice services. We continue to focus on 3G through roll-out of new sites across markets to increase the user base. The company is now offering services in 7 countries namely: Ghana, Kenya, Nigeria, Tanzania, Zambia, Congo B & Sierra Leone. Our offerings under ‘Airtel Money’ brand allows our customers to enjoy the convenience of banking on their mobiles with new, secure & robust features and more stable platforms. Four countries launched Airtel money this quarter; namely Congo B, Niger, Tchad & Sierra Leone, taking the total number of countries to 12. 2.3 Partners Strategic Equity Partners - We have a strategic alliance with SingTel, which has enabled us to further enhance and expand our telecommunications networks in India to provide quality service to our customers. The investment made by SingTel in Bharti is one of their largest investments made in the world outside Singapore.
Equipment and Technology Partners - We have long term strategic partnerships in all areas including network equipment, Information technology and call center technology building upon the unique outsourcing business models we pioneered. Our business models have enabled us to partner with global leaders who share our drive for co-creating innovative and tailor-made solutions for the markets we operate in. For 2G/2.5G & 3G network equipments, we have partnered with Ericsson, Nokia Siemens Networks (NSN) and Huawei for the markets in India, Africa, Sri Lanka and Bangladesh. We have partnered with ZTE, Huawei & Nokia Siemens Networks for our TD-LTE (popularly known as 4G) networks in the BWA telecom circles of Kolkata, Karnataka and Maharashtra respectively. We have appointed Infosys as technology partner that powered the national launch of airtel money. We have also entered into Supply & Services Contracts for enhanced packet core with Cisco, NSN & Huawei. These partners will design, deploy and maintain a state of the art packet core system to handle data traffic from 2G, 3G & LTE access networks. Besides wireless network with strategic partners, we have also partnered with Alcatel Lucent, Huawei, ECI, Tejas Networks and Cisco for fiber/ carrier Ethernet based 3G backhaul products supply and deployment. Alcatel Lucent (ALU) is our wire-line access network managed services partner through a joint venture company. It is responsible for deployment of fiber/ copper and service provisioning. However, we are free to choose the electronic equipment, switches and routers from any other competent suppliers and we do purchase equipment from world leaders like Cisco, Juniper, ECI, Tellabs and Huawei amongst others in addition to the strategic partners mentioned above. IBM is our strategic partner for all business and enterprise IT systems. Our path breaking contract with IBM caters to, among other things, technology evolution, scale, tariff changes and subscriber growth. It is a Global IT outsourcing contract covering India, Bangladesh, Sri Lanka and African regions thereby taking our relationship to a truly global level. Under this contract, IBM will provide and run all telecom-related IT systems, software and services to support business requirements. It is helping Bharti Airtel derive economies of scale benefits, while ensuring similar customer services and experience across regions. IBM Daksh, Wipro, Mphasis, FirstSource, Aegis, Teleperformance, Tech Mahindra and HGSL are our call centre partners and provide an excellent customer experience through dedicated contact center operations. Our existing call centre technology partners are Avaya, Wipro and Cisco. We work with other renowned organizations such as Comviva, OnMobile, Acision, Yahoo, Google and Spice Digital, among others, to provide each of our customers with a unique experience in VAS like CRBT (caller ring back tone), Talk2Me (Interactive sessions with Celebrities), SMS, Music on Demand, Airtel Talkies (Movies via Audio), Buddy Finder, Email services and other Airtel Live applications. We also have an alliance with RIM for selling Blackberry enterprise and internet services.

Page 7 of 52
SECTION 3
FINANCIAL HIGHLIGHTS The financial results presented in this section are compiled based on the audited consolidated financial statements prepared in accordance with International Financial Reporting Standards (IFRS) and the underlying information. Detailed financial statements, analysis & other related information is attached to this report (page 27 - 29). Also, kindly refer to Section 7.4 - use of Non - GAAP financial information (page 33) and Glossary (page 46) for detailed definitions.
3.1 Consolidated - Summary of Consolidated Financial Statements 3.1.1 Consolidated Summarized Statement of Operations (net of inter segment eliminations)
Amount in Rs mn, except ratios
Quarter Ended
Jun-12 Jun-11Y-on-Y
Growth
Total revenues 193,501 169,749 14%
EBITDA 58,487 57,058 3%
EBITDA / Total revenues 30.2% 33.6%
EBIT 20,916 25,745 -19%
Finance cost (net) 8,211 8,549 -4%
Profit / (Loss) before Tax 12,629 17,195 -27%
Income tax expense 4,878 5,141 -5%
Net income / (loss) 7,622 12,152 -37%
Capex 35,758 43,483 -18%
Operating Free Cash Flow (EBITDA - Capex) 22,729 13,575 67%
Cumulative Investments 1,865,052 1,629,756 14%
Particulars
3.1.2 Consolidated Summarized Statement of Financial Position
Amount in Rs mn
As at As at
Jun 30, 2012 Mar 31, 2012
Assets
Non-current assets 1,482,473 1,422,532
Current assets 177,655 148,084
Total assets 1,660,128 1,570,616
Non-current liabilities 636,623 547,935
Current liabilities 500,656 488,873
Total liabilities 1,137,279 1,036,808
Equity & Minority Interest
Equity 495,150 506,113
Non-Controlling Interest 27,699 27,695
Total Equity & Minority Interest 522,849 533,808
Total Equity and liabilities 1,660,128 1,570,616
Particulars

Page 8 of 52
3.2 Region wise - Summary of Consolidated Financial Statements 3.2.1 Summarized Statement of Operations (net of inter segment eliminations)
Amount in Rs mn, except ratios
India & SA Africa Total India & SA Africa Total
Total revenues 137,177 57,586 193,501 126,306 43,784 169,749
EBITDA 43,584 14,924 58,487 46,006 11,053 57,058
EBITDA / Total revenues 31.8% 25.9% 30.2% 36.4% 25.2% 33.6%
EBIT 17,533 3,405 20,916 23,473 2,272 25,745
Net income / (loss) 14,338 (6,693) 7,622 15,167 (3,016) 12,152
Capex 29,308 6,450 35,758 24,705 18,778 43,483
Operating Free Cash Flow (EBITDA - Capex) 14,276 8,474 22,729 21,300 (7,725) 13,575
Cumulative Investments 1,130,777 734,274 1,865,052 1,047,625 582,131 1,629,756
ParticularsQuarter Ended Jun 2012 Quarter Ended Jun 2011
3.2.2 Region wise Summarized Statement of Financial Position
Amount in Rs mn
India & SA Africa Eliminations Total
Assets
Non-current assets 781,845 709,156 (8,528) 1,482,473
Current assets 255,340 49,306 (126,991) 177,655
Total assets 1,037,185 758,462 (135,519) 1,660,128
Liabilities
Non-current liabilities 166,715 469,908 - 636,623
Current liabilities 275,855 351,787 (126,986) 500,656
Total liabilities 442,570 821,695 (126,986) 1,137,279
Equity & Minority Interest
Equity 566,236 (62,553) (8,533) 495,150
Minority Interest 28,379 (680) - 27,699
Total Equity & Minority Interest 594,615 (63,233) (8,533) 522,849
Total Equity and liabilities 1,037,185 758,462 (135,519) 1,660,128
Particulars As at Jun 30, 2012

Page 9 of 52
3.3 Segment wise Summarized Statement of Operations INDIA & SOUTH ASIA B2C Services 3.3.1 Mobile Services (India & South Asia) – comprises of Consolidated Statement of Operations of Mobile Services India & South Asia.
Amount in Rs mn, except ratios
Jun-12 Jun-11Y-on-Y
Growth
Total revenues 106,848 98,404 9%
EBITDA 32,350 33,614 -4%
EBITDA / Total revenues 30.3% 34.2%
EBIT 17,012 20,853 -18%
Capex 19,411 13,452 44%
Operating Free Cash Flow (EBITDA - Capex) 12,939 20,162 -36%
Cumulative Investments 711,311 653,410 9%
Particulars
Quarter Ended
Note 5: Cumulative investments include investments in 4G earlier reported under Telemedia services. Previous quarters’ have been restated accordingly. 3.3.2 Telemedia Services
Amount in Rs mn, except ratios
Jun-12 Jun-11Y-on-Y
Growth
Total revenues 9,442 9,457 0%
EBITDA 3,809 4,304 -11%EBITDA / Total revenues 40.3% 45.5%
EBIT 1,333 2,220 -40%
Capex 2,081 3,113 -33%
Operating Free Cash Flow (EBITDA - Capex) 1,728 1,191 45%
Cumulative Investments 95,305 88,950 7%
Particulars
Quarter Ended
Note 6: Cumulative investments in 4G earlier reported under Telemedia services have now been reported under Mobile services (India & South Asia). Previous quarters’ have been restated accordingly. 3.3.3 Digital TV Services
Amount in Rs mn, except ratios
Jun-12 Jun-11Y-on-Y
Growth
Total revenues 3,658 2,934 25%
EBITDA (23) 50 -147%
EBITDA / Total revenues -0.6% 1.7%
EBIT (2,265) (1,494) -52%
Capex 3,241 3,014 8%
Operating Free Cash Flow (EBITDA - Capex) (3,264) (2,964) -10%
Cumulative Investments 35,402 29,294 21%
Particulars
Quarter Ended

Page 10 of 52
B2B Services 3.3.4 Airtel Business
Amount in Rs mn, except ratios
Jun-12 Jun-11Y-on-Y
Growth
Total revenues 11,906 10,410 14%
EBITDA 1,963 2,303 -15%
EBITDA / Total revenues 16.5% 22.1%
EBIT 591 683 -14%
Capex 166 295 -44%
Operating Free Cash Flow (EBITDA - Capex) 1,797 2,008 -11%
Cumulative Investments 42,927 41,405 4%
Particulars
Quarter Ended
3.3.5 Passive Infrastructure Services – represents Bharti Infratel Ltd and proportionate consolidation of 42% Indus Towers.
Amount in Rs mn, except ratios
Jun-12 Jun-11Y-on-Y
Growth
Total revenues 24,048 22,767 6%
EBITDA 8,788 8,585 2%EBITDA / Total revenues 36.5% 37.7%
EBIT 3,420 3,433 0%
Capex 4,283 4,115 4%
Operating Free Cash Flow (EBITDA - Capex) 4,504 4,470 1%
Cumulative Investments 238,467 226,043 5%
Particulars
Quarter Ended
Others 3.3.6 Others (India & South Asia)
Amount in Rs mn, except ratios
Jun-12 Jun-11Y-on-Y
Growth
Total revenues 817 791 3%
EBITDA (2,495) (2,067) -21%
EBIT (2,624) (2,214) -19%
Capex 126 726 -83%
Operating Free Cash Flow (EBITDA - Capex) (2,621) (2,793) 6%
Cumulative Investments 7,365 8,523 -14%
Particulars
Quarter Ended
Includes corporate office and other support units.

Page 11 of 52
AFRICA 3.3.7 Consolidated Africa – comprises of 17 country operations in Africa.
Amount in US $ mn, except ratios
Jun-12 Jun-11Y-on-Y
Growth
Total revenues 1,066 979 9%
EBITDA 275 246 12%EBITDA / Total revenues 25.8% 25.2%
EBIT 62 50 23%
Capex 119 420 -72%
Operating Free Cash Flow (EBITDA - Capex) 156 (173) 190%
Cumulative Investments 13,041 13,017 0%
Particulars
Quarter Ended
Note 7: Africa financials reported above are in their functional currency i.e., US$. Note 8: In constant currency terms, Jun’12 reported revenues of $ 1,066 Mn against $ 913 Mn in the same quarter last year, which represents a growth of 17%.

Page 12 of 52
3.4 Region wise & Segment wise Investment & Contribution 3.4.1 India and South Asia
Amount in Rs mn, except ratios
Revenue % of Total EBITDA % of Total Capex % of TotalCummulative
Investments% of Total
Mobile Services9 106,848 78% 32,350 74% 19,411 66% 711,311 63%
Telemedia Services 9,442 7% 3,809 9% 2,081 7% 95,305 8%
Digital TV Services 3,658 3% (23) 0% 3,241 11% 35,402 3%
Airtel Business 11,906 9% 1,963 5% 166 1% 42,927 4%
Passive Infrastructure Services 24,048 18% 8,788 20% 4,283 15% 238,467 21%
Others 817 1% (2,495) -6% 126 0% 7,365 1%
Sub Total 156,719 114% 44,392 102% 29,308 100% 1,130,777 100%
Eliminations (19,541) -14% (808) -2% - 0%
Accumulated Depreciation And Amortization (405,311)
Total (India & SA) 137,177 100% 43,584 100% 29,308 100% 725,466
Consolidated 193,501 58,487 35,758 1,865,052
% of Consolidated 71% 75% 82% 61%
Segment
Quarter Ended Jun 2012 As at Jun 30, 2012
Note 9: Cumulative Investments includes National optic fibre network.
3.4.2 Africa
Amount in US$ mn, except ratios
Revenue % of Total EBITDA % of Total Capex % of TotalCummulative
Investments% of Total
Africa 1,066 100% 275 100% 119 100% 13,041 100%
Accumulated Depreciation And Amortization (1,305)
Total (Africa) 1,066 100% 275 100% 119 100% 11,736
% of Consolidated 29% 25% 18% 39%
Segment
Quarter Ended Jun 2012 As at Jun 30, 2012

Page 13 of 52
SECTION 4
OPERATING HIGHLIGHTS
The financial figures used for computing ARPU, Realization per Minute, Revenue per Site, Non Voice revenue, Messaging & VAS revenue, Data revenue, Others revenue, Gross revenue per employee per month, Personnel cost per employee per month are based on IFRS. 4.1 Customers and Non Voice % - Consolidated
Parameters UnitJun 30,
2012
Mar 31,
2012
Q-on-Q
Growth
Jun 30,
2011
Y-on-Y
Growth
Mobile Services 000's 250,038 241,148 4% 221,247 13%
India & South Asia 000's 194,183 188,008 3% 174,941 11%
Africa 000's 55,855 53,140 5% 46,306 21%
Telemedia Services 000's 3,272 3,270 0% 3,322 -1%
Digital TV Services 000's 7,400 7,228 2% 6,262 18%
Total 000's 260,710 251,646 4% 230,831 13%
Non Voice Revenue as a % of Total Revenues % 26.6% 25.5% 26.0%
Note 10: Non Voice revenue now includes revenue from non-telecom (refer glossary for definition). Previous quarters’ have been restated accordingly. 4.2 Traffic Details – Consolidated
Parameters UnitJun 30,
2012
Mar 31,
2012
Q-on-Q
Growth
Jun 30,
2011
Y-on-Y
Growth
Mobile Services Mn Min 267,511 257,910 4% 244,668 9%
India & South Asia Mn Min 247,860 238,779 4% 228,331 9%
Africa Mn Min 19,651 19,131 3% 16,337 20%
Telemedia Services Mn Min 4,162 4,145 0% 4,570 -9%
National Long Distance Services Mn Min 22,241 21,588 3% 19,878 12%
International Long Distance Services Mn Min 3,362 3,518 -4% 3,119 8%
Total Minutes on Network (Gross) Mn Min 297,276 287,161 4% 272,235 9%
Eliminations Mn Min (22,660) (21,926) 3% (20,272) 12%
Total Minutes on Network (Net) Mn Min 274,616 265,235 4% 251,962 9%

Page 14 of 52
4.3 Mobile Services India
Parameters UnitJun 30,
2012
Mar 31,
2012
Q-on-Q
Growth
Jun 30,
2011
Y-on-Y
Growth
Customer Base 000's 187,302 181,279 3% 169,187 11%
VLR % 90.8% 91.7% 88.8%
Net Additions 000's 6,023 5,626 7% 6,984 -14%
Pre-Paid (as a % of total Customer Base) % 96.2% 96.3% 96.3%
Monthly Churn % 8.8% 8.8% 6.4%
Average Revenue Per User (ARPU) Rs 185 189 -2% 190 -3%
Average Revenue Per User (ARPU) US$ 3.4 3.8 -9% 4.3 -20%
Total Revenue / Minutes on Network paisa 42.7 43.8 -3% 42.8 0%
Revenue per site per month Rs 275,647 280,332 -2% 270,590 2%
Voice
Minutes on the network Mn 239,338 230,365 4% 221,560 8%
Voice Average Revenue Per User (ARPU) Rs 154 158 -2% 161 -4%
Voice Usage per customer min 433 431 0% 445 -3%
Voice Realization per minute paisa 35.7 36.7 -3% 36.1 -1%
Non Voice Revenue
% of Mobile revenues % 16.3% 16.2% 15.6%
Of Which
Messaging & VAS as % of Mobile revenues % 10.8% 11.0% 12.1%
Data as % of Mobile revenues % 4.3% 4.1% 3.2%
Others as % of Mobile revenues % 1.2% 1.1% 0.3%
Data
Data Customer Base 000's 38,660 35,780 8% NA NA
Of which no. of 3G data customers 000's 3,713 2,711 37% NA NA
As % of Customer Base % 20.6% 19.7% NA
Total MBs on the network Mn MBs 12,566 10,006 26% NA NA
Data Average Revenue Per User (ARPU) Rs 40 44 -10% NA NA
Data Usage per customer MBs 112 107 5% NA NA
Data Realization per MB paisa 35.3 40.9 -14% NA NA
4.4 Telemedia Services
Parameters UnitJun 30,
2012
Mar 31,
2012
Q-on-Q
Growth
Jun 30,
2011
Y-on-Y
Growth
Telemedia Customers 000's 3,272 3,270 0% 3,322 -1%
Of which no. of broadband (DSL) customers 000's 1,371 1,369 0% 1,433 -4%
As % of Customer Base % 41.9% 41.9% 43.1%
Net additions 000's 2 (47) 104% 26 -92%
Average Revenue Per User (ARPU) Rs 962 933 3% 952 1%
Average Revenue Per User (ARPU) US$ 17.8 18.6 -4% 21.3 -16%
Non Voice Revenue as a % of Telemedia revenues % 54.3% 55.8% -3% 52.0% 4%
4.5 Digital TV Services
Parameters UnitJun 30,
2012
Mar 31,
2012
Q-on-Q
Growth
Jun 30,
2011
Y-on-Y
Growth
Digital TV Customers 000's 7,400 7,228 2% 6,262 18%
Net additions 000's 172 159 8% 600 -71%
Average Revenue Per User (ARPU) Rs 166 166 0% 163 2%
Average Revenue Per User (ARPU) US$ 3.1 3.3 -7% 3.7 -16%
Monthly Churn % 1.7% 1.2% 0.7%
Page 15 of 52
4.6 Network and Coverage - India
Parameters UnitJun 30,
2012
Mar 31,
2012
Q-on-Q
Growth
Jun 30,
2011
Y-on-Y
Growth
Mobile Services
Census Towns Nos 5,121 5,118 3 5,114 7
Non-Census Towns and Villages Nos 455,575 454,302 1,273 452,719 2,856
Population Coverage % 86.5% 86.4% 86.2%
Optic Fibre Network R Kms 159,762 157,886 1,876 148,792 10,970
Sites on Network Nos 126,010 120,905 5,105 117,144 8,866
Of which no. of 3G sites Nos 18,012 16,162 1,850 10,669 7,343
Telemedia Services
Cities covered Nos 87 87 - 87 -
Airtel Business
Submarine cable systems Nos 7 7 - 7 -
Digital TV Services
Districts Covered Nos 616 609 7 550 66
Coverage % 96% 95% 86%
4.7 Passive Infrastructure Services 4.7.1 Bharti Infratel Consolidated
Parameters UnitJun 30,
2012
Mar 31,
2012
Q-on-Q
Growth
Jun 30,
2011
Y-on-Y
Growth
Total Towers11Nos 79,574 79,154 420 78,689 884
Total Tenancies11Nos 151,932 150,315 1,616 144,706 7,225
Key Indicators
Sharing Revenue per Sharing Operator per month Rs 32,360 34,104 -5% 33,533 -4%
Tenancy Ratio Times 1.91 1.89 1.83
Note 11: Total Towers and Tenancies include proportionate consolidation of 42% of Indus Towers.
4.7.2 Bharti Infratel Standalone
Parameters UnitJun 30,
2012
Mar 31,
2012
Q-on-Q
Growth
Jun 30,
2011
Y-on-Y
Growth
Total Towers12Nos 33,660 33,326 334 32,942 718
Total Tenancies Nos 61,024 60,422 602 58,624 2,400
Key Indicators
Sharing Revenue per Sharing Operator per month Rs 36,532 37,277 -2% 36,203 1%
Tenancy Ratio Times 1.82 1.82 1.77
Note 12: Total Towers are excluding 35,252 towers in 11 circles for which the right of use has been assigned to Indus with effect from 1st Jan 2009.
4.7.3 Indus Towers
Parameters UnitJun 30,
2012
Mar 31,
2012
Q-on-Q
Growth
Jun 30,
2011
Y-on-Y
Growth
Total Towers Nos 109,318 109,114 204 108,922 396
Total Tenancies Nos 216,447 214,032 2,415 204,958 11,489
Key Indicators
Sharing Revenue per Sharing Operator per month Rs 30,139 32,563 -7% 31,963 -6%
Tenancy Ratio Times 1.97 1.94 1.87
Note 13: Indus KPIs are on 100% basis.

Page 16 of 52
4.8 Human Resource Analysis – India
Parameters UnitJun 30,
2012
Mar 31,
2012
Q-on-Q
Growth
Jun 30,
2011
Y-on-Y
Growth
Consolidated
Total Employees14Nos 15,256 14,935 321 16,545 (1,289)
Number of Customers per employee Nos 12,977 12,841 136 10,805 2,172
Personnel cost per employee per month Rs 118,119 110,252 7% 111,741 6%
Gross Revenue per employee per month Rs 2,935,716 2,937,785 0% 2,504,062 17%
Note 14: Total Employees include proportionate consolidation of 42% Indus Towers employees. 4.9 Operational Performance - Africa
Parameters UnitJun 30,
2012
Mar 31,
2012
Q-on-Q
Growth
Jun 30,
2011
Y-on-Y
Growth
Customer Base 000's 55,855 53,140 5% 46,306 21%
Net Additions 000's 2,715 2,191 24% 2,100 29%
Pre-Paid (as a % of total Customer Base) % 99.3% 99.3% 99.3%
Monthly Churn % 5.1% 5.3% 6.3%
Average Revenue Per User (ARPU) US$ 6.5 6.8 -4% 7.3 -10%
Total Revenue / Minutes on Network US¢ 5.4 5.6 -3% 6.0 -9%
Revenue per site per month US$ 23,134 24,522 -6% 26,196 -12%
Voice
Minutes on the network Mn 19,651 19,131 3% 16,337 20%
Voice Average Revenue Per User (ARPU) US$ 5.7 6.1 -7% 6.5 -13%
Voice Usage per customer min 120 122 -1% 121 -1%
Voice Realization per minute US¢ 4.7 5.0 -6% 5.4 -12%
Non Voice Revenue
% of Mobile revenues % 12.9% 10.6% 10.6%
Of Which
Messaging & VAS as % of Mobile revenues % 7.0% 5.6% 5.4%
Data as % of Mobile revenues % 3.4% 3.2% 3.2%
Others as % of Mobile revenues % 2.5% 1.8% 2.0%
Refer page 35 for KPI’s in constant currency. 4.10 Network & Coverage - Africa
Parameters UnitJun 30,
2012
Mar 31,
2012
Q-on-Q
Growth
Jun 30,
2011
Y-on-Y
Growth
Sites on Network Nos 15,439 14,831 608 12,703 2,736
Of which no. of 3G sites Nos 4,787 3,205 1,582 NA NA
4.11 Human Resource Analysis - Africa
Parameters UnitJun 30,
2012
Mar 31,
2012
Q-on-Q
Growth
Jun 30,
2011
Y-on-Y
Growth
Total Employees Nos 4,907 4,792 115 5,474 (567)
Number of Customers per employee Nos 11,383 11,089 293 8,459 2,924
Personnel cost per employee per month US$ 5,436 6,006 -9% 5,657 -4%
Gross Revenue per employee per month US$ 72,831 75,800 -4% 59,594 22%

Page 17 of 52
SECTION 5
MANAGEMENT DISCUSSION AND ANALYSIS 5.1 India and South Asia A. Key Industry Developments
1. TRAI Recommendations on Unified License
On 16 April 2012, TRAI released its recommendations
on “Guidelines for Unified License / Class License and
Migration of Existing Licences”. Key Highlights of its
recommendations are:
• Unified license to be issued/ granted on three levels, namely National Level, Service Area Level and District Level.
• One time non-refundable entry fee for Unified License to be: a) National level: Rs 15 Cr b) Service area level: Rs 1 Cr, except for Jammu and Kashmir and North East Service areas where entry fee recommended is Rs 50 lakh each c) District level: Rs 10 lakh.
• Lowering the maximum penalty for violation of licensing conditions from Rs 50 Cr to Rs.25 lakh for minor penalty and Rs 10 Cr for major penalty.
• IP-1 to be covered under Unified License.
• After Unified License policy, all existing licenses would automatically converted to Unified License (restricted) with same terms & conditions including scope of service and validity period. For conversion to Unified License (restricted), no additional entry fee will be payable.
• After conversion to Unified License (restricted), if an operators desires to expand / alter the service(s) offered or service area(s) of operations, then the operator will be required to apply / migrate to Unified License.
• During migration, entry fee already paid for the service area level licenses or district level licenses will be adjusted on pro rata basis for the balance validity period of such Licences at hand against the Entry Fee for the National level or Service area level Unified License. However, where the sum of Entry Fee already paid exceeds the Entry Fee to be paid, there will be no refund of the Entry Fee.
2. TRAI’s 50th
Amendment to Telecommunication Tariff Order’ 99 (TTO)
TRAI has issued a 50th Amendment to TTO’99 increasing ceiling of Processing Fee on certain category of talk time recharge vouchers on 19 April, 2012. The key highlights are as follows:
• Increase in the ceiling of processing fee (PF) from Rs 2 to Rs 3 on talk time top-up recharges of Rs 20 and above denominations.
• Mandating availability of Rs.10 denomination as a top up voucher.
3. TRAI Recommendations on Auction of Spectrum
TRAI issued its recommendations on ‘Auction of
Spectrum’ on April 23, 2012 and subsequently provided
clarifications sought by DoT on the said
recommendations. Key highlights are as follows:
• Reserve Price of 800/900 MHz and 700 MHz should be 2 & 4 times respectively of the reserve price for 1800 MHz i.e. Rs 3,622 Cr.
• Reserve price of 800 MHz at 1.3 times the 1800 MHz reserve price, where the spectrum availability for auction is less than 5 MHz.
• The limit for holding of spectrum in any service area to be fixed at 50% of the spectrum assigned in each band and 25% of the total access spectrum assigned in all bands put together.
• Uniform spectrum usage charge @ 1% of AGR which was subsequently revised to 3%.
• Refarming of 900 MHz spectrum available with operators.
• Arrangement to allocate spectrum in 1900 MHz for refarming of 800 MHz band.
• Deferred payment plan for payment of bid amount.
• Spectrum Mortgage/sharing to be allowed.
4. TRAI’s Tariff Order on Digital Addressable Cable
TV System (DAS)
Key highlights of the tariff order dated April 30, 2012
are:
• 42% Reference Interconnection offer rate (from Broadcaster to MSO) to stay.
• Revenue sharing between MSO (Multi System operators) and LCO (Local cable operators) to be based on mutual negotiation. In case of failure, the revenue shall be in the ratio of 55:45 (MSO:LCO) for FTA (Free to Air) and 65:35 for pay channels.

Page 18 of 52
5. National Telecom Policy- 2012
The Union Cabinet of India on May 31, 2012, approved
the National Telecom Policy (NTP) 2012 that provides
for abolition of roaming charges and allows users to
retain the same number across the country. Other key
highlights of the NTP 2012 are:
• Strive to create One Nation - One License across services and service areas.
• Move towards Unified License regime.
• Delink spectrum in respect of all future licenses and move towards liberalization of spectrum.
• Refarm spectrum and allot alternative frequency bands to service providers from time to time.
• Increase rural tele-density from 39% to 70% by the year 2017 and 100% by the year 2020.
• Target 175 Mn broadband connections by the year 2017 and 600 Mn by the year 2020 at minimum 2 Mbps download speed.
• Utilization of domestic telecommunication equipment to the extent of 60% and 80% by the year 2017 and 2020 respectively with a minimum value addition of 45% and 65% respectively.
6. Uniform License Fee @ 8%
DoT has announced a uniform license fee rate of 8% of
Adjusted Gross Revenues (AGR). The uniform rates
shall be adopted for all the below licenses in two steps
starting from July 1, 2012.
Category of License
Annual License fee as % of AGR
From 1st July
2012 to 31st
March 2013
For the Year 2013
-14 and onwards
UASL (Metro/Category A,B & C)
9%, 8%, and 7%
respectively. 8%
ISP 4% 8%
ISP-IT 7% 8%
NLD/ILD 7% 8%
VSAT 7% 8%
7. Guidelines for Auction of spectrum in 1800 MHz
and 800 MHz
On July 3, 2012, DoT issued its guidelines on Auction of spectrum in 1800 MHz and 800 MHz band as below:
• Liberalization of Spectrum:
� In future, all spectrums to be assigned shall be liberalized.
� Service providers may be allowed to convert their existing 1800 MHz spectrum to liberalized spectrum for a period of 20 years on payment of auction determined price
• Eligibility Criteria:
� Holder of CMTS/UAS Licences or those eligible for award of Unified License (UL).
� Quashed licensees will be treated as new entrants.
• Validity period of spectrum to be auctioned shall be for 20 years.
• Price related issues:
� Reserve price, Terms of Payment and Annual spectrum usage charges to be announced separately.
• Auction of 1800 MHz band:
� A minimum of 8 blocks each of 1.25MHz (10MHz) across all circles.
� In addition, a provision may also be made for spectrum upto 3 blocks each of 1.25MHz (3.75MHz), wherever available for topping upto the 8 blocks of spectrum put for auction i.e. upto a total of 11 blocks each of 1.25MHz to meet the requirement of new entrants, if such an exigency arises.
� For existing operators a maximum of 2 blocks of 1.25 MHz to be allowed.
� New entrants can bid for min 4 blocks and one additional block of 1.25 MHz each
• Auction of 800 MHz band:
� Block Size: 1.25 MHz (Paired)
� 3 block each of 1.25MHz (3.75MHz).
� In addition, a provision may also be made for spectrum of 1 block of 1.25MHz, wherever available, for topping up the 3 blocks of spectrum to meet the requirement of new entrants, if such an exigency arises.
� For existing operators a maximum of 1 block of 1.25 MHz to be allowed.
� New entrants can bid for min 2 blocks and one additional block of 1.25 MHz
8. Decision of the Union Cabinet on reserve price for spectrum auctions
The Government of India vide its press release dated 3rd August 2012, announced the following decisions taken by the Union Cabinet:

Page 19 of 52
• Reserve price of Rs 14,000 Cr for 5 MHz pan India spectrum in 1800 MHz band.
• Reserve price for 800 MHz band to be at 1.3 times that of 1800 MHz band.
• The Union Cabinet’s decision to adopt escalating slabs of 3%-8% of AGR for Spectrum Usage Charge (SUC), instead of TRAI’s recommendation of a flat rate of 3%, is disappointing. This would result in an imbalance skewed against the existing operators, and may affect bidding economics in a discriminatory manner.
B. Key Company Developments
• Bharti Airtel launched India’s first 4G services in Kolkata and Bengaluru. Airtel has launched the service on a state-of-the-art network based on TD-LTE, making India one of the first countries in the world to commercially deploy this cutting-edge technology.
• Bharti Airtel acquires 49% in Qualcomm India’s BWA entity to eventually roll out 4G networks on LTE TDD technology in Delhi, Mumbai, Haryana & Kerala to expand its footprint across India.
• Aimed at adding thrust to the adoption of 3G services, Bharti Airtel took the lead in announcing all new and affordable rates for its 3G customers across India.
• Bharti Airtel, through its wholly owned subsidiary Airtel MCommerce Services Limited, announced a partnership with Axis Bank for extending banking and payment services to India’s unbanked millions through the mobile platform. The all new ‘airtel money Super Account powered by Axis Bank’ acts as a no-frills bank account that comes with remittance capabilities which empower customers to send money, withdraw cash from the nearby designated airtel money outlets, keep money safe and even enjoy interest on savings through their mobile device.
• Bharti Airtel announced its strategic foray into the mobile advertising (mAdvertising) segment, thus allowing advertisers to connect with potential customers in a targeted and personalized fashion via their mobile phones.
• In association with Manchester United, Bharti Airtel kicked off Airtel Rising Stars – an under-16 football talent hunt across India, Sri Lanka and Bangladesh.
• Brand Airtel announced its ‘title sponsorship’ association with TV show ‘Satyamev Jayate’.
• Bharti Airtel bagged the rights for the exclusive mobile video content for UEFA Euro 2012 matches.
• Bharti Airtel was awarded 'Star News Viewers Choice Best Mobile Network' & ‘Best Quality Mobile Network Service Provider' at 6th National Telecom Awards 2012 by CMAI. The recognition reinforces Airtel’s commitment to provide a robust network and best in class service experience to its customers.
• Airtel’s ‘har friend zaroori hai, yaar’ campaign was conferred with 7 awards at Goafest 2012.
5.2 Africa
A. Key Industry Developments
Burkina Faso • 3G license
Airtel has paid the 3G license fees as specified by the Government and is expecting issuance of the final license soon.
Chad • Taxes & Fees
The regulator is also considering the introduction of a new tax per customer per day to finance Sports programs in the country. Final decision is still pending.
DRC
• 3G License Airtel has paid the 3G license fees as specified by the Government. Final terms and conditions have been agreed and signed.
Gabon
• 3G License In October 2011, Airtel and the regulator signed an MoU granting a 3G license and the extension of the 2G license to match the duration of the 3G license at the proportionate rate. Efforts are ongoing to obtain the issuance of the Presidential Decree by the President of the Republic.
Kenya
• LTE
The Kenya government called for submissions of interest in the proposed future LTE license consortium. Airtel has submitted its proposal and awaits further response from the government.
• Know Your Subscribers (KYC) The Finance Bill/Statutes Law Miscellaneous Amendment act was passed in parliament, formally introducing Subscriber registration; the deadline for which has been determined by CCK as 30th September 2012.
Malawi
• Converged Licensing Framework Final amendments have been published and all operators are now allowed to provide both fixed and mobile voice telephony.
Niger
• 3G License The Government has opted for an international tender process to grant 3G licenses. The government will launch an international invitation for tender requesting all interested parties to bid for 3G licenses.
Nigeria
• Taxes & Fees An industry working group on ‘Multiple-Taxation’ has been formed with a mandate to engage the regulator in respect of multiple and inappropriate regulation and

Page 20 of 52
taxation of telecommunications operations. A working plan is currently being constructed.
• Fines on non-compliance with QoS Regulations
The Nigerian Communications Commission (NCC) has modified the Quality of Service (QoS) Key Performance Indicators (KPIs) under the QoS Regulations, resulting in reduction of the QoS KPIs to five (5) parameters which will form the basis of assessing QoS performance of operators until December 2013.
• Mobile Number Portability
The NCC published MNP Business Rule and Port Order Processes. The NCC in partnership with the Number Portability Clearing house/Administration Service Provider held an on-site Workshop on MNP with network operators.
Rwanda
• Interconnect Rates New regulations have been passed on the International Gateway Traffic Verification System (IGTVS), introducing an increased minimal termination rates for all calls into the country.
B. Key Company Developments
• Airtel has rolled out 3G services in Ghana, Sierra Leone, Kenya, Nigeria, Zambia, Tanzania & Congo B, taking the total number of countries to 7.
• Airtel continues to drive the iconic stature of the brand. Airtel Rising Star has been launched in 15 countries. Airtel Rising Stars African Championship is scheduled to be hosted in Nairobi. As part of this program, deals have been signed with Manchester United & Arsenal FC.
• Airtel Money was launched in 4 countries namely Niger, Tchad, Congo B, Sierra Leone bringing the total countries to 12.
• Airtel Money was awarded “Best Mobile Money Service in Ghana” at the Mobile World Ghana Telecom awards.
• Airtel rolled out numerous youth campaigns across countries like DRC, Gabon, Nigeria, Kenya etc to drive its brand equity among the youth.

Page 21 of 52
5.3 Results of Operations
The financial results presented in this section are compiled based on the audited consolidated financial statements prepared in accordance with International Financial Reporting Standards (IFRS) and the underlying information.
Key Highlights - For the quarter ended June 30, 2012
• Overall customer base at 260.7 million. • Net addition of 9.06 million customers. • Total Revenues of Rs 193.5 billion (up 14% Y-o-Y). • EBITDA Rs 58.5 billion (up 3% Y-o-Y). • Net Income of Rs 7.6 billion (down 37% Y-o-Y). • Operating free cash flow of Rs 22.7 billion (up 67% Y-o-Y).
Bharti Airtel Consolidated Quarter ended June 30, 2012 Customer Base As on June 30, 2012, the company had an aggregate of 260.7 million customers consisting of 250.0 million Mobile, 3.3 million Telemedia and 7.4 million Digital TV customers. Its total customer base as on June 30, 2012 increased by 13% compared to its customer base as on June 30, 2011. The 250 million mark (wireless customers) is an important milestone for the company. Revenues/Turnover During the quarter ended June 30, 2012, the company recorded revenues of Rs 193,501 million, a growth of 14% compared to the quarter ended June 30, 2011. Non-voice revenue contributed to approximately 26.6% of the total revenues for the quarter. Operating Expenses (excluding-revenue share license and spectrum fee) During the quarter ended June 30, 2012; the company incurred an operating expenditure of Rs 91,788 million representing 47.4% of the total revenues. The operating expense comprises of: Rs 45,425 million towards network operations cost (23.5% of total revenues), Rs 35,750 million towards selling, general & administrative cost (18.5% of total revenues), Rs 9,193 million towards employee costs (4.8% of total revenues) and Rs 1,420 million towards cost of goods sold (0.7% of total revenues). EBITDA, EBIT & Finance Cost During the quarter ended June 30, 2012, the company had an EBITDA of Rs 58,487 million, a growth of 3% compared to the quarter ended June 30, 2011. The reported EBITDA margin for the quarter was 30.2%. During the quarter ended June 30, 2012, the company had depreciation and amortization expenses of Rs 37,571 million. The resultant EBIT for the quarter ended June 30, 2012 was Rs 20,916 million, a decline of 19% compared to quarter ended June 30, 2011. The net finance cost for the quarter ended June 30, 2012 was Rs 8,211 million. During the quarter, the interest on borrowings & finance charges was Rs 10,726 million, derivatives & exchange fluctuation gain of Rs 1,605 million and the investment income (primarily related to income on marketable securities) was Rs 910 million. Profit / (Loss) Before Tax (PBT) The Profit / (Loss) before tax for the quarter was Rs 12,629 million, a decrease of 27%, as compared to the quarter ended June 30, 2011. Stagnant EBITDA coupled with higher depreciation and amortization arising from enhanced capex and license fees has resulted in the lower PBT.
Net income The net income for the quarter ended June 30, 2012 was Rs 7,622 million representing a Y-o-Y decline of 37%. The current tax for the quarter ended June 30, 2012 was Rs 7,907 million and deferred tax expense / (income) was Rs (3,029) million.
Statement of Financial Position The Company had total assets of Rs 1,660,128 million and total liabilities of Rs 1,137,279 million, as on June 30, 2012. The difference of Rs 522,849 million was on account of Equity attributable to equity holders of parent and non-controlling interest. Equity movement during the quarter ended June 30, 2012 includes reduction in foreign currency translation reserve (FCTR) of Rs 18,682 million arising from depreciation of Rupee and the movements of various functional currencies of overseas operations, on net basis. The company had a net debt of Rs 682,983 million (US$ 12,129 million) as on June 30, 2012, resulting in a Net Debt (in US $) to EBITDA (LTM in US $) of 2.54. The Net Debt has reduced during the quarter by US$ 585 million. Capital Expenditure & Operating Free Cash Flow During the quarter ended June 30, 2012, the company incurred capital expenditure of Rs 35,758 million. The Operating Free Cash Flow during the quarter was Rs 22,729 million, a strong growth of 67% over the same period last year. Human Resources As on June 30, 2012, the company had a total of 20,892 employees. B2C Services – India & South Asia Mobile Services The Company and the industry were adversely impacted by restrictions on special tariff vouchers enforced by the Regulator in India. The hike in service tax for April 2012 also rendered telecom services costlier. The market continues to be characterized by hyper competition despite the cancellation of 122 wireless licenses by the Supreme Court in February 2012. The company is focusing all its attention in developing the Data and VAS businesses, even while sustaining growth in overall minutes of usage. Customer Base, Churn, ARPU and MoU - India As on June 30, 2012, the company had 187.3 million GSM mobile customers on its network of which number of 3G customers were 5.1 million. The average monthly churn for the quarter ended June 30, 2012 was 8.8%. Sustained hyper competition has driven this industry to become structurally defective with abnormally high rotational churn. The industry is witnessing high levels of gross customer additions

Page 22 of 52
resulting in net additions of less than 10%. This has a significant bearing on the telecom industry's profitability.
During the quarter, blended ARPU was Rs 185 (US$ 3.4) per month. The blended monthly voice usage per customer during the quarter was at 433 minutes.
The gross realization per minute during the quarter was 42.7 paisa. Voice ARPU was Rs 154 and Voice realization was 35.7 paisa per minute. The company had 38.7 million Data (Mobile Internet) customers, of which 3.7 million used 3G services. Data ARPU came in at Rs 40 , helped by average data download of 112 MBs per user per month, and blended data realization rate of 35.3 paisa per MB. Value added services, which includes revenue from services apart from voice, data & others viz. SMS, MMS, Ring Back Tones, Airtel Talkies, Music on Demand etc. contributed to approximately 10.8% of the total revenues of the segment.
Data and Value Added Services offer tremendous growth potential, and the company is leading the market development of these services through innovations, sachet packs, mass advertising, deep penetration, network expansion and market activation. The handset ecosystem is also making significant progress, with 3G-enabled phones especially smartphones riding a virtuous cycle of affordability, scale and innovation.
Revenues, EBITDA and EBIT The revenues for the quarter ended June 30, 2012 for mobile services stood at Rs 106,848 million, a growth of 9% over the corresponding quarter last year. The revenue from this segment contributed to 77.9% of the total revenues of India & South Asia.
Mobile revenues in India during the quarter were impacted by two significant changes:
i) The Telecom Regulatory Authority of India (“TRAI”) guidelines around processing fees restricted the sales of "combo packs" which offered bundled service propositions to augment customer value. These regulations have restricted the operators from free market pricing prevalent hitherto. The net impact of these changes in this quarter was in the range of Rs 2,500 – Rs 3,000 million.
The industry is of the firm view that the Indian market is highly competitive. The principles of "forbearance" have guided healthy competition; hence, the pricing intervention by TRAI is uncalled for. The Company, along with the rest of the industry, has appealed to the Regulator to restore pricing flexibility.
ii) The service tax hike from 10.3% to 12.36%, effective 1st April 2012, caused all telecom services to become dearer by nearly 2%, with the entire additional levy being passed through to the exchequer. The service tax amount on the Company's Mobile revenues has increased from Rs 9,442 million in the previous quarter to Rs 11,594 million in the current quarter. On one hand, this has adversely impacted the usage in respect of value recharges; on the other, it has reduced the effective realization on usage based vouchers.
Depressed revenues on account of unfavourable regulatory interventions and taxation, coupled with enhanced market participation and planned accelerated investments have impacted mobile profitability. Increased aggression enabled 9.0 Bn incremental minutes, despite the adverse impact of the service tax hike partially neutralized by the positive usage impact arising from processing fee reductions.
The EBITDA during the quarter ended June 30, 2012 was Rs 32,350 million representing a decline of 4% over the quarter ended June 30, 2011. The EBITDA margin for the quarter ended June 30, 2012 was 30.3%. The EBIT for the quarter ended June 30, 2012 was Rs 17,012 million as
compared to Rs 20,853 million for the quarter ended June 30, 2011, a decline of 18%.
Capital Expenditure During the quarter ended June 30, 2012, the company incurred a capital expenditure of Rs 19,411 million in Mobile Services (including investments towards launch of 4G services).
Telemedia Services Customer Base and ARPU As on June 30, 2012, the company had its Telemedia operations in 87 cities. The number of customers stood at 3.3 million customers as on June 30, 2012. The company had approximately 1.4 million broadband (DSL) customers. The ARPU for the quarter was Rs 962 (US$ 17.8) per month.
Revenues, EBITDA and EBIT For the quarter ended June 30, 2012, the revenues from Telemedia operations of Rs 9,442 million represented a decline of 0.2% over the corresponding quarter last year. The EBITDA for the quarter was Rs 3,809 million compared to Rs 4,304 million in the corresponding prior year quarter, a decrease of 11%. The EBITDA margin for this segment was 40.3%. The EBIT was Rs 1,333 million as compared to Rs 2,220 million for the quarter ended June 30, 2011, a decline of 40%.
Capital Expenditure During the quarter ended June 30, 2012, the company incurred a capital expenditure of Rs 2,081 million in Telemedia Services.
Digital TV Services
Customer Base and ARPU As on June 30, 2012, the company had its Digital TV operations in 616 districts. The number of customers stood at 7.4 million customers as on June 30, 2012. The ARPU for the quarter was Rs 166 (US$ 3.1) per month.
Revenues, EBITDA and EBIT For the quarter ended June 30, 2012, the revenues from Digital TV operations of Rs 3,658 million represented a growth of 25% over the corresponding quarter last year. The EBITDA for the quarter was Rs (23) million representing a decline of 147% over the corresponding quarter last year. The EBITDA margin for this segment was -0.6% for the quarter ended June 30, 2012. The EBIT loss for the quarter was Rs 2,265 million as compared to loss of Rs 1,494 million for the quarter ended June 30, 2011.
Capital Expenditure During the quarter ended June 30, 2012, the company incurred a capital expenditure of Rs 3,241 million in Digital TV Services.
B2B Services – India & South Asia Airtel Business Revenues, EBITDA and EBIT The revenues for the quarter ended June 30, 2012 for Airtel Business stood at Rs 11,906 million, a healthy growth of 14% over the corresponding quarter last year. The revenue from this segment contributed to 8.7% of the total revenues of India and South Asia. The EBITDA during the quarter ended June 30, 2012 was Rs 1,963 million, a decline of 15% over the corresponding quarter last year. The EBITDA margin for the quarter ended June 30, 2012 was16.5%. The EBIT for the quarter ended June 30, 2012 was Rs 591 million as compared to Rs 683 million for the quarter ended
Page 23 of 52
June 30, 2011, a decline of 14%. With the transition from capex to opex model, Company believes EBIT as a right measure of profitability for the business. Capital Expenditure During the quarter ended June 30, 2012, the company incurred a capital expenditure of Rs 166 million in Airtel Business. The segment contributed a healthy Operating Free Cash Flow of Rs 1,797 million; at 15.1% of revenues, this reflects a strong cash generating business. Passive Infrastructure Services Revenues, EBITDA and EBIT The revenues for the quarter ended June 30, 2012 for its Passive Infrastructure Services were Rs 24,048 million a growth of 6% over the corresponding quarter last year. The EBITDA during the quarter ended June 30, 2012 was Rs 8,788 million representing a growth of 2% over the quarter ended June 30, 2011. The EBITDA margin for the quarter ended June 30, 2012 was 36.5%. The EBIT for the quarter ended June 30, 2012 was Rs 3,420 million as compared to Rs 3,433 million for the quarter ended June 30, 2011, a decline of 0.4%. Capital Expenditure During the quarter ended June 30, 2012, the company incurred a capital expenditure of Rs 4,283 million in Passive Infrastructure Services.
Towers and Sharing Operators As at the end of the quarter, Bharti Infratel had 33,660 towers and tenancy ratio of 1.82 times. As at the end of the quarter, Indus Towers had 109,318 towers and tenancy ratio of 1.97 times. Mobile Services – Africa Economic and currency headwinds are evident in key markets, as a result of the eurozone crisis, slowing down of aid and grants, rising inflation and political issues in some countries. With this in mind, the company chose to accelerate the intensity of market operations to stimulate more growth in the coming quarters. Customer Base, ARPU and MoU At the end of the quarter ended June 30, 2012, the company had 55.9 million GSM mobile customers on its network. During the quarter, the company added 2.7 million customers. The ARPU for the quarter was US$ 6.5 per month. The blended monthly voice usage per customer, during the quarter was 120 minutes.
Non voice revenue, which includes revenue from services other than voice i.e., Messaging & VAS (including SMS, GPRS, MMS, Ring Back Tone, Airtel Talkies, Music on
Demand), data, others etc. contributed to approximately 12.9% of the total revenues of the segment.
The company added 150,000 selling outlets to touch 1.24 million outlets, and is all set to become Africa’s largest retailer by 2013. The company’s exclusive airtel express outlets have crossed 1,000. The company now offers its low-cost, innovative airtel money service in 12 African countries. The company has so far launched 3G in 7 countries with roll out of 4,787 sites. The number of 2G sites has also increased by 22% to 15,439 over June 30, 2011.
Significant marketing investments were made in several campaigns such as 3G, airtel money, airtel Rising Stars, Arsenal Football Club sponsorship and ‘Zambitious’. Revenues, EBITDA and EBIT During the quarter, in local currency terms, the company’s revenue in Africa grew by 17% over the corresponding period last year. In Rupee terms, Africa revenue came in at Rs 57,586 million representing a strong growth of 32% over last year, helping to lift the overall consolidated growth of the company. EBITDA in Rupee terms of Rs 14,924 million grew by 35% over the corresponding period last year, thanks to strong growth in revenues, improved margin and favourable currency movement. The EBITDA margin slightly improved to 25.8% from 25.2% in the corresponding quarter last year. Investments in network expansion, head start in 3G rollout, the Rwanda launch, stepping up of marketing campaigns including airtel money and distribution expansion resulted in a lower EBITDA compared to the previous quarter ended March 31, 2012. But, the company has reinforced the investments made in the last two years in the basic pillars of the business, viz., network, brand, distribution and products. While the soft market conditions came in the way of revenue growth in this quarter, the investments made during this period are strategically placed in the right direction for long-term growth and profitability of the business in Africa. EBIT for the quarter ended June 30, 2012 was Rs 3,405 million representing a growth of 50% over the corresponding quarter last year. Net Income The net loss for the quarter was significantly high at Rs 6,693 million, mainly due to the pressures on EBITDA, higher depreciation and substantial finance cost including forex losses. Capital Expenditure During the quarter ended June 30, 2012, the company incurred a capital expenditure of Rs 6,450 million on its African operations. The resultant Operating Free Cash Flow in Africa was a record Rs 8,474 million.

Page 24 of 52
5.4 Bharti’s Three Line Graph
The company tracks its performance on a three-line graph.
The parameters considered for the three-line graph are:
1. Total Revenues i.e. absolute turnover/sales 2. Opex Productivity – operating expenses divided by the
total revenues for the respective period. Operating expenses is the sum of (i) equipment costs (ii) employee costs (iii) network operations costs & (iv)
selling, general and administrative costs. This ratio depicts the operational efficiencies in the company
3. Capex Productivity – this is computed by dividing
revenue for the quarter (annualized) by gross cumulative capex (gross fixed assets and capital work in progress) till date i.e. the physical investments made in the assets creation of the company. This ratio depicts the asset productivity of the company.
Given below are the graphs for the last five quarters of the company: 5.4.1 Bharti Airtel Consolidated
169,749 172,698
184,767 187,294
193,501
44.6% 44.5% 45.4% 44.4%47.4%
71.2%68.6% 70.9% 71.1%
70.2%
30.0%
40.0%
50.0%
60.0%
70.0%
80.0%
150,000
160,000
170,000
180,000
190,000
200,000
Q1 F
Y12
Q2 F
Y12
Q3 F
Y12
Q4 F
Y12
Q1F
Y13
Total Revenue (Rs mn) LHS Opex to Total Rev (RHS) Capex Productivity (RHS)
5.4.2 Bharti Airtel - India & South Asia
126,306 126,790
131,628
134,210 137,177
42.4% 42.6%43.9% 42.8%
45.9%
62.9%61.4%
63.2% 64.1% 63.2%
30.0%
40.0%
50.0%
60.0%
70.0%
115,000
125,000
135,000
145,000
Q1 F
Y12
Q2 F
Y12
Q3 F
Y12
Q4 F
Y12
Q1F
Y1
3
Total Revenue (Rs mn) LHS Opex to Total Rev (RHS) Capex Productivity (RHS)
5.4.3 Bharti Airtel – Africa
979 1,030 1,057 1,071 1,066
51.0% 49.6% 49.3% 48.4% 50.7%
115.8% 111.3%107.6%
101.5% 102.5%
0.0%
40.0%
80.0%
120.0%
160.0%
0
300
600
900
1,200
Q1 F
Y12
Q2 F
Y12
Q3 F
Y12
Q4 F
Y12
Q1F
Y13
Total Revenue (US$) LHS Opex to Total Rev (RHS) Capex Productivity (RHS)

Page 25 of 52
SECTION 6
STOCK MARKET HIGHLIGHTS 6.1 General Information
Shareholding and Financial Data Unit
Code/Exchange 532454/BSE
Bloomberg/Reuters BHARTI IN/BRTI.BO
No. of Shares Outstanding (29/06/12) Mn Nos 3,797.53
Closing Market Price - BSE (29/06/12) Rs /Share 305.00
Combined Volume (NSE & BSE) (02/04/12-29/06/12) Nos in Mn/day 3.86
Combined Value (NSE & BSE) (02/04/12-29/06/12) Rs bn /day 1.18
Market Capitalization Rs bn 1,158
Market Capitalization US$ bn 20.57
Book Value Per Equity Share Rs /share 130.38
Market Price/Book Value Times 2.34
Enterprise Value Rs bn 1,841
Enterprise Value US$ bn 32.70
Enterprise Value/ Annualised Q1 Revenue Times 2.38
Enterprise Value/ Annualised Q1 EBITDA Times 7.87 6.2 Summarized Shareholding pattern as of June 30, 2012
Category Number of Shares %
Promoter & Promoter Group
Indian 1,735,453,890 45.70%
Foreign 865,673,286 22.80%
Sub total 2,601,127,176 68.50%
Public Shareholding
Institutions 959,923,970 25.28%
Non-institutions 236,478,950 6.23%
Sub total 1,196,402,920 31.50%
Total 3,797,530,096 100.00%

Page 26 of 52
6.3 Bharti Airtel Daily Stock price (BSE) and Volume (BSE & NSE Combined) Movement
0
8,000
16,000
24,000
200
250
300
350
400
02/4
/201
2
09/4
/201
2
16/4
/201
2
23/4
/201
2
30/4
/201
2
07/5
/201
2
14/5
/201
2
21/5
/201
2
28/5
/201
2
04/6
/201
2
11/6
/201
2
18/6
/201
2
25/6
/201
2
Volume (in 000's) RHS Share Price (Rs.) LHS
Source: Bloomberg
6.4 Comparison of Domestic Telecom Stock movement with Sensex and Nifty
60
68
76
84
92
100
108
01/4
/2012
08/4
/2012
15/4
/2012
22/4
/2012
29/4
/2012
06/5
/2012
13/5
/2012
20/5
/2012
27/5
/2012
03/6
/2012
10/6
/2012
17/6
/2012
24/6
/2012
Bharti RCOM Sensex NSE MTNL TATA Comm IDEA
Bharti -9.4%
TCOM 3.0%
Sensex 0.1%
NSE -0.3%
RCOM -24.4%
Idea -23.3%
MTNL -13.9%
Q1'13 vs. Q4'12
Stock Movement
Source: Bloomberg

Page 27 of 52
SECTION 7
DETAILED FINANCIAL AND RELATED INFORMATION 7.1 Extracts from Audited Consolidated Financial Statements prepared in accordance with International
Financial Reporting Standards (IFRS) 7.1.1 Consolidated Statement of Income
Amount in Rs mn, except ratios
Y-on-Y
Growth
Revenue 193,501 169,749 14%
Other operating income 118 79 49%
Operating expenses (135,132) (112,769) 20%
Depreciation & amortisation (37,571) (31,314) 20%
Profit / (Loss) from operations 20,916 25,745 -19%
Share of results of associates (76) -
Profit / (Loss) before interest and tax 20,840 25,745 -19%
Finance income 2,618 696 276%
Finance costs (10,829) (9,246) 17%
Profit / (Loss) before tax 12,629 17,195 -27%
Income tax income/(expense) (4,878) (5,141) -5%
Net income / (loss) for the period 7,751 12,054 -36%
Income Attributable to :
Equity holders of the parent 7,622 12,152 -37%
Non controlling interests 129 (98) -232%
Net Income / (Loss) 7,751 12,054 -36%
Earning Per Share
Basic, profit attributable to equity holders of parent (In Rs) 2.01 3.20
Diluted, profit attributable to equity holders of parent (In Rs) 2.01 3.20
ParticularsQuarter Ended
Jun 2012 Jun 2011
7.1.2 Consolidated Statement of Comprehensive Income
Y-on-Y
Growth
Net income / (loss) for the period 7,751 12,054 -36%
Exchange differences on translation of foreign operations (18,709) (1,181) 1485%
Total comprehensive income / (loss) for the period, net of tax (10,958) 10,873 -201%
Total comprehensive income / (loss) attributable to :
Equity holders of the parent (11,060) 10,931 -201%
Non controlling interests 102 (58) -277%
Total Comprehensive Income / (Loss) (10,958) 10,873 -201%
ParticularsQuarter Ended
Jun 2012 Jun 2011

Page 28 of 52
7.1.3 Consolidated Statement of Financial Position
Amount in Rs mn
As at As at
Jun 30, 2012 Mar 31, 2012
Assets
Non-current assets
Property, plant and equipment 694,283 674,932
Intangible assets 682,742 660,889
Investment in associates 9,229 24
Derivative financial assets 4,029 2,756
Other financial assets 15,994 17,086
Other non - financial assets 17,107 15,568
Deferred tax asset 59,089 51,277
1,482,473 1,422,532
Current assets
Inventories 1,323 1,308
Trade and other receivable 70,882 63,735
Derivative financial assets 3,030 2,137
Prepayments and other assets 36,810 32,621
Income tax recoverable 8,968 9,049
Short term investments 33,003 18,132
Other financial assets 701 802
Cash and cash equivalents 22,938 20,300
177,655 148,084
Total assets 1,660,128 1,570,616
Equity and liabilities
Equity
Issued capital 18,988 18,988
Treasury shares (236) (282)
Share premium 56,499 56,499
Retained earnings / (deficit) 403,304 395,682
Foreign currency translation reserve (24,708) (6,026)
Other components of equity 41,303 41,252
Equity attributable to equity holders of parent 495,150 506,113
Non-controlling interest 27,699 27,695
Total equity 522,849 533,808
Non-current liabilities
Borrowing 577,569 497,154
Deferred revenue 8,771 2,892
Provisions 7,817 7,240
Derivative financial liabilities 1,026 401
Deferred tax liability 13,595 11,621
Other financial liabilities 23,660 23,076
Other non - financial liabilities 4,185 5,551
636,623 547,935
Current liabilities
Borrowing 163,075 193,078
Deferred revenue 38,410 43,282
Provisions 1,714 1,290
Other non - financial liabilities 16,245 10,811
Derivative financial liabilities 506 166
Income tax liabilities 6,307 7,596
Trade & other payables 274,399 232,650
500,656 488,873
Total liabilities 1,137,279 1,036,808
Total equity and liabilities 1,660,128 1,570,616
Particulars

Page 29 of 52
7.1.4 Consolidated Statement of Cash Flows
Amount in Rs mn
Quarter Ended
Jun 30, 2012
Cash flows from operating activities
Profit before tax 12,629
Adjustments for -
Depreciation and amortization 37,571
Finance income (2,618)
Finance cost 10,829
Share of results of associated companies (post tax) 76
Amortization of stock based compensation 90
Other non-cash items 124
Operating cash flow before changes in assets and liabilities 58,701
Trade & other receivables and prepayments (9,996)
Inventories 34
Trade and other payables 28,670
Change in provision 606
Other financial and non financial liabilities (1,228)
Other financial and non financial assets 427
Cash generated from operations 77,214
Interest received 109
Income tax paid (7,143)
Net cash inflow from operating activities 70,180
Cash flows from investing activities
Proceeds/(Purchase) of property, plant and equipment (28,085)
Purchase of intangible assets (1,156)
Short term investments (Net) (14,276)
Investment in associates (9,281)
Loan to associates (60)
Net cash outflow from investing activities (52,858)
Cash flows from financing activities
Proceeds from issuance of borrowings 95,449
Repayment of borrowings (97,345)
Short term borrowings (net) (2,295)
Interest paid (10,440)
Proceeds from exercise of stock options 11
Dividend paid (including tax) to non - controlling interests (101)
Net cash inflow / (outflow) from financing activities (14,721)
Net (decrease) / increase in cash and cash equivalents during the
period2,601
Effect of exchange rate changes on cash and cash equivalents (2,431)
Add : Balance as at the Beginning of the period 8,037
Balance as at the end of the period 8,207
Particulars
Note 15: Cash and Cash Equivalents is excluding bank overdraft

Page 30 of 52
7.2 Schedules to Financial Statements
7.2.1 India & South Asia 7.2.1.1 Schedule of Operating Expenses
Amount in Rs mn
ParticularsQuarter Ended
Jun 30, 2012
Access charges 16,866
Licence fees, revenue share & spectrum charges 13,868
Network operations costs 35,393
Cost of goods sold 322
Employee costs 5,101
Selling, general and adminstration expense 22,165
Operating Expenses 93,715 7.2.1.2 Schedule of Depreciation & Amortization
Amount in Rs mn
ParticularsQuarter Ended
Jun 30, 2012
Depreciation 23,050
Amortization 3,001
Depreciation and Amortization 26,051
7.2.1.3 Schedule of Income Tax
Amount in Rs mn
ParticularsQuarter Ended
Jun 30, 2012
Current tax expense 5,627
Deferred tax expense / (income) (1,915)
Income tax expense 3,712

Page 31 of 52
7.2.2 Africa 7.2.2.1 Schedule of Operating Expenses
Amount in US$ mn
ParticularsQuarter Ended
Jun 30, 2012
Access charges 206
Licence fees, revenue share & spectrum charges 45
Network operations costs 188
Cost of goods sold 20
Employee costs 80
Selling, general and adminstration expense 253
Operating Expenses 792
7.2.2.2 Schedule of Depreciation & Amortization
Amount in US$ mn
ParticularsQuarter Ended
Jun 30, 2012
Depreciation 149
Amortization 64
Depreciation and Amortization 213
7.2.2.3 Schedule of Income Tax
Amount in US$ mn
ParticularsQuarter Ended
Jun 30, 2012
Current tax expense 42
Deferred tax expense / (income) (21)
Income tax expense 21

Page 32 of 52
7.3 Schedule of Net Debt & Finance Cost 7.3.1 Schedule of Net Debt in INR
Amount in Rs mn
Long term debt, net of current portion 577,569
Short-term borrowings and current portion of long-term debt 163,077
Less:
Cash and Cash Equivalents 22,938
Restricted Cash 890
Restricted Cash, non-current 831
Short term investments 33,003
Net Debt 682,983
As at Jun 30, 2012Particulars
7.3.2 Schedule of Net Debt in US$
Amount in US $ mn
Long term debt, net of current portion 10,257
Short-term borrowings and current portion of long-term debt 2,896
Less:
Cash and Cash Equivalents 407
Restricted Cash 16
Restricted Cash, non-current 15
Short term investments 586
Net Debt 12,129
Particulars As at Jun 30, 2012
7.3.3 Schedule of Finance Cost
Amount in Rs mn
ParticularsQuarter Ended
Jun 30, 2012
Interest on borrowings & Finance charges 10,726
Derivatives and exchange (gain)/loss (1,605)
Investment Income (910)
Finance cost (net) 8,211

Page 33 of 52
7.4 Use of Non-GAAP Financial Information
In presenting and discussing the Company’s reported financial position, operating results and cash flows, certain information is derived from amounts calculated in accordance with IFRS, but this information is not in itself an expressly permitted GAAP measure. Such non - GAAP measures should not be viewed in isolation as alternatives to the equivalent GAAP measures. A summary of non - GAAP measures included in this report, together with details where additional information and reconciliation to the nearest equivalent GAAP measure can be found, is shown below.
Non – GAAP measure Equivalent GAAP measure
for IFRS
Location in this results announcement of
reconciliation and further information
Earnings before Interest, Taxation, Depreciation and Amortization (EBITDA)
Profit / (Loss) from Operating Activities
Page 33
Cash Profit from Operations before Derivative & Exchange (Gain)/Loss
Profit / (Loss) from Operating Activities
Page 33
Capex NA NA
Operating Free Cash flow NA NA
Cumulative investments NA NA
7.4.1 Reconciliation of Non-GAAP financial information based on IFRS
Amount in Rs mn
Quarter Ended
Jun 2012
Profit / (Loss) from Operating Activities 20,916
Add: Depreciation and Amortization 37,571
EBITDA 58,487
Finance Cost 10,829
Finance Income (2,618)
Finance Cost (net) 8,211
Profit / (Loss) from Operating Activities 20,916
Add: Depreciation and Amortization 37,571
Less: Finance Cost (net) 8,211
Add: Derivatives and exchange (gain)/loss (1,605)
Cash Profit from Operations 48,671
Particulars
Profit / (Loss) from Operating Activities To EBITDA
Profit / (Loss) from Operating Activities to Cash Profit from Operations before Derivative &
Exchange Fluctuation
Reconciliation of Finance Cost

Page 34 of 52
ANNEXURE – TRENDS AND POLICIES
A.1 Trends & Ratio Analysis
A.1.1 Based on Statement of Operations
Consolidated
Amount in Rs mn
Jun-12 Mar-12 Dec-11 Sep-11 Jun-11
Total Revenues 193,501 187,294 184,767 172,698 169,749
Access and interconnection charges 27,045 25,658 26,235 23,310 22,158
Operating Expenses (Excl Access Charges &
License Fee)91,788 83,183 83,826 76,794 75,672
Licence Fee 16,300 16,218 15,434 14,508 14,939
EBITDA 58,487 62,329 59,584 58,151 57,058
Cash profit from operations before Derivative
and Exchange Fluctuations48,671 53,581 51,576 49,356 50,324
Profit / (Loss) before tax 12,629 17,056 15,806 15,126 17,195
Net income 7,622 10,059 10,113 10,270 12,152
Jun-12 Mar-12 Dec-11 Sep-11 Jun-11
As a % of Total Revenues
Access and interconnection charges 14.0% 13.7% 14.2% 13.5% 13.1%
Operating Expenses (Excl Access Charges &
License Fee)47.4% 44.4% 45.4% 44.5% 44.6%
Licence Fee 8.4% 8.7% 8.4% 8.4% 8.8%
EBITDA 30.2% 33.3% 32.2% 33.7% 33.6%
Cash profit from operations before Derivative
and Exchange Fluctuations25.2% 28.6% 27.9% 28.6% 29.6%
Profit / (Loss) before tax 6.5% 9.1% 8.6% 8.8% 10.1%
Net income 3.9% 5.4% 5.5% 5.9% 7.2%
ParametersFor the Quarter Ended
India & South Asia
Amount in Rs mn
Jun-12 Mar-12 Dec-11 Sep-11 Jun-11
Total Revenues 137,177 134,210 131,628 126,790 126,306
Access and interconnection charges 16,866 15,720 15,371 14,594 13,847
Operating Expenses (Excl Access Charges &
License Fee)62,980 57,462 57,824 53,991 53,493
Licence Fee 13,868 13,829 13,371 12,547 13,025
EBITDA 43,584 47,352 45,225 45,728 46,006
Profit / (Loss) before tax 18,461 18,606 16,955 19,005 20,902
Net income 14,338 13,472 12,703 14,519 15,167
Jun-12 Mar-12 Dec-11 Sep-11 Jun-11
As a % of Total Revenues
Access and interconnection charges 12.3% 11.7% 11.7% 11.5% 11.0%
Operating Expenses (Excl Access Charges &
License Fee)45.9% 42.8% 43.9% 42.6% 42.4%
Licence Fee 10.1% 10.3% 10.2% 9.9% 10.3%
EBITDA 31.8% 35.3% 34.4% 36.1% 36.4%
Profit / (Loss) before tax 13.5% 13.9% 12.9% 15.0% 16.5%
Net income 10.5% 10.0% 9.7% 11.5% 12.0%
ParametersFor the Quarter Ended

Page 35 of 52
Africa
Amount in US$ mn
Jun-12 Mar-12 Dec-11 Sep-11 Jun-11
Total Revenues 1,066 1,071 1,057 1,030 979
Access and interconnection charges 206 208 216 206 191
Operating Expenses (Excl Access Charges &
License Fee)541 518 521 511 499
Licence Fee 45 48 41 43 43
EBITDA 275 298 282 270 246
Profit / (Loss) before tax (108) (30) (26) (87) (83)
Net income (124) (67) (52) (95) (68)
Jun-12 Mar-12 Dec-11 Sep-11 Jun-11
Exchange Fluctuation Impact
Reported revenues (US $) 1,066 1,071 1,057 1,030 979
a. QoQ growth (%) -0.45% 1.30% 2.62% 5.27% 5.94%
b. Impact of exchange fluctuation (%)16 -1.65% -1.38% -2.29% -1.81% 0.55%
c. QoQ growth in constant currency (%) (a - b) 1.20% 2.68% 4.92% 7.08% 5.39%
Revenues in constant currency (US $)17 1,066 1,054 1,026 978 913
ParametersFor the Quarter Ended
ParametersFor the Quarter Ended
Note 16: Based on QoQ variation and weighted on the revenues of each country for the current quarter Note 17: Revenues for all prior periods restated at the average exchange rates of each country for the quarter ended Jun’12.
Jun-12 Mar-12 Dec-11 Sep-11 Jun-11
As a % of Total Revenues
Access and interconnection charges 19.3% 19.4% 20.4% 20.0% 19.5%
Operating Expenses (Excl Access Charges &
License Fee)50.7% 48.4% 49.3% 49.6% 51.0%
Licence Fee 4.2% 4.4% 3.9% 4.2% 4.4%
EBITDA 25.8% 27.8% 26.7% 26.2% 25.2%
Profit / (Loss) before tax -10.1% -2.8% -2.5% -8.5% -8.5%
Net income -11.6% -6.3% -5.0% -9.2% -6.9%
Operational KPIs (in constant currency)
Parameters UnitJun 30,
2012
Mar 31,
2012
Dec 31,
2011
Sep 30,
2011
Jun 30,
2011
Average Revenue Per User (ARPU) US$ 6.5 6.7 6.9 6.9 6.8
Total Revenue / Minutes on Network US¢ 5.4 5.5 5.5 5.4 5.6
Voice Average Revenue Per User (ARPU) US$ 5.7 6.0 6.3 6.2 6.1
Voice Realization per minute US¢ 4.7 4.9 5.0 4.9 5.0
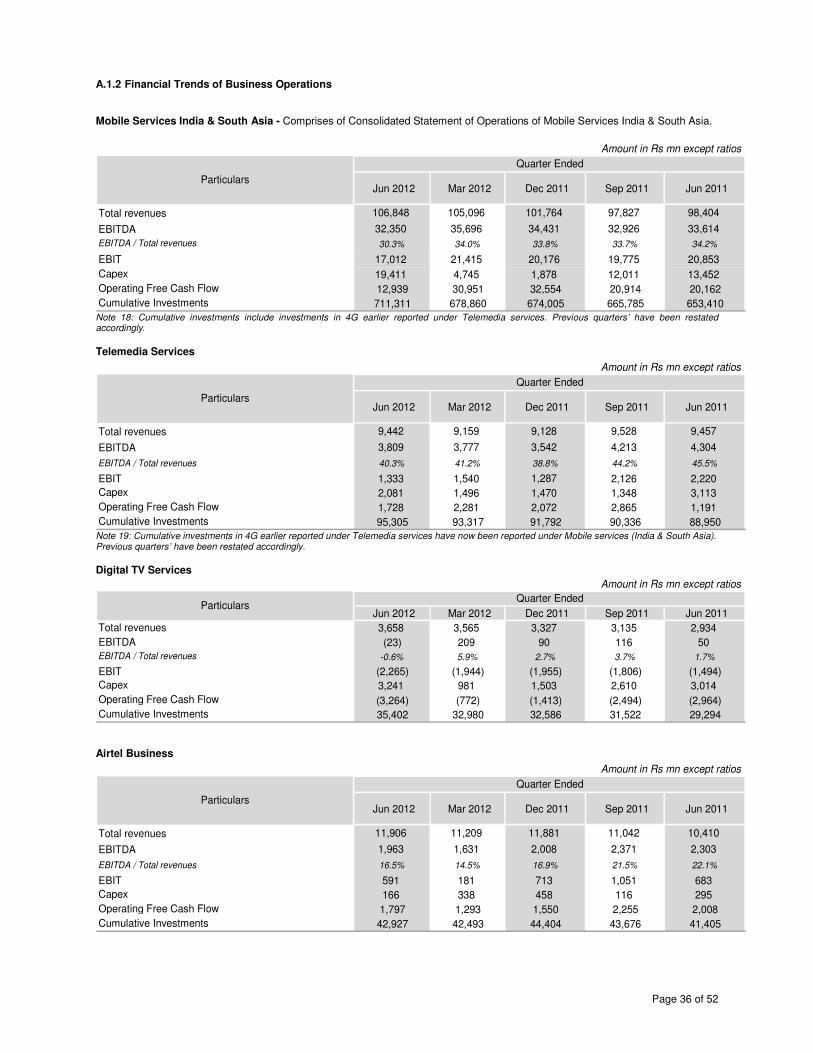
Page 36 of 52
A.1.2 Financial Trends of Business Operations Mobile Services India & South Asia - Comprises of Consolidated Statement of Operations of Mobile Services India & South Asia.
Jun 2012 Mar 2012 Dec 2011 Sep 2011 Jun 2011
Total revenues 106,848 105,096 101,764 97,827 98,404
EBITDA 32,350 35,696 34,431 32,926 33,614
EBITDA / Total revenues 30.3% 34.0% 33.8% 33.7% 34.2%
EBIT 17,012 21,415 20,176 19,775 20,853
Capex 19,411 4,745 1,878 12,011 13,452
Operating Free Cash Flow 12,939 30,951 32,554 20,914 20,162
Cumulative Investments 711,311 678,860 674,005 665,785 653,410
Quarter Ended
Amount in Rs mn except ratios
Particulars
Note 18: Cumulative investments include investments in 4G earlier reported under Telemedia services. Previous quarters’ have been restated accordingly. Telemedia Services
Amount in Rs mn except ratios
Jun 2012 Mar 2012 Dec 2011 Sep 2011 Jun 2011
Total revenues 9,442 9,159 9,128 9,528 9,457
EBITDA 3,809 3,777 3,542 4,213 4,304
EBITDA / Total revenues 40.3% 41.2% 38.8% 44.2% 45.5%
EBIT 1,333 1,540 1,287 2,126 2,220
Capex 2,081 1,496 1,470 1,348 3,113
Operating Free Cash Flow 1,728 2,281 2,072 2,865 1,191
Cumulative Investments 95,305 93,317 91,792 90,336 88,950
Quarter Ended
Particulars
Note 19: Cumulative investments in 4G earlier reported under Telemedia services have now been reported under Mobile services (India & South Asia). Previous quarters’ have been restated accordingly. Digital TV Services
Amount in Rs mn except ratios
Jun 2012 Mar 2012 Dec 2011 Sep 2011 Jun 2011
Total revenues 3,658 3,565 3,327 3,135 2,934
EBITDA (23) 209 90 116 50EBITDA / Total revenues -0.6% 5.9% 2.7% 3.7% 1.7%
EBIT (2,265) (1,944) (1,955) (1,806) (1,494)
Capex 3,241 981 1,503 2,610 3,014
Operating Free Cash Flow (3,264) (772) (1,413) (2,494) (2,964)
Cumulative Investments 35,402 32,980 32,586 31,522 29,294
Quarter EndedParticulars
Airtel Business
Amount in Rs mn except ratios
Jun 2012 Mar 2012 Dec 2011 Sep 2011 Jun 2011
Total revenues 11,906 11,209 11,881 11,042 10,410
EBITDA 1,963 1,631 2,008 2,371 2,303
EBITDA / Total revenues 16.5% 14.5% 16.9% 21.5% 22.1%
EBIT 591 181 713 1,051 683
Capex 166 338 458 116 295
Operating Free Cash Flow 1,797 1,293 1,550 2,255 2,008
Cumulative Investments 42,927 42,493 44,404 43,676 41,405
Quarter Ended
Particulars

Page 37 of 52
Passive Infrastructure Services - Bharti Infratel Ltd and proportionate consolidation of 42% of Indus.
Amount in Rs mn except ratios
Jun 2012 Mar 2012 Dec 2011 Sep 2011 Jun 2011
Total revenues 24,048 24,183 24,393 23,766 22,767
EBITDA 8,788 9,346 9,110 8,902 8,585EBITDA / Total revenues 36.5% 38.6% 37.3% 37.5% 37.7%
EBIT 3,420 3,930 3,758 3,520 3,433
Capex 4,283 3,427 2,440 3,743 4,115
Operating Free Cash Flow 4,504 5,919 6,670 5,159 4,470
Cumulative Investments 238,467 234,730 231,533 229,486 226,043
Quarter Ended
Particulars
Others
Amount in Rs mn
Jun 2012 Mar 2012 Dec 2011 Sep 2011 Jun 2011
Total revenues 817 738 666 859 791
EBITDA (2,495) (2,505) (3,139) (1,969) (2,067)
EBIT (2,624) (2,631) (3,243) (2,118) (2,214)
Capex 126 13 66 787 726
Operating Free Cash Flow (2,621) (2,519) (3,205) (2,756) (2,793)
Cumulative Investments 7,365 7,013 9,690 9,322 8,523
Quarter EndedParticulars
Africa - Comprises of 17 country operations in Africa.
Jun 2012 Mar 2012 Dec 2011 Sep 2011 Jun 2011
Total revenues 1,066 1,071 1,057 1,030 979
EBITDA 275 298 282 270 246EBITDA / Total revenues 25.8% 27.8% 26.7% 26.2% 25.2%
EBIT 62 102 58 81 50
Capex 119 254 265 575 420
Operating Free Cash Flow 156 44 17 (305) (173)
Cumulative Investments 13,041 13,432 13,049 12,889 13,017
ParticularsQuarter Ended
Amount in US$ mn except ratios
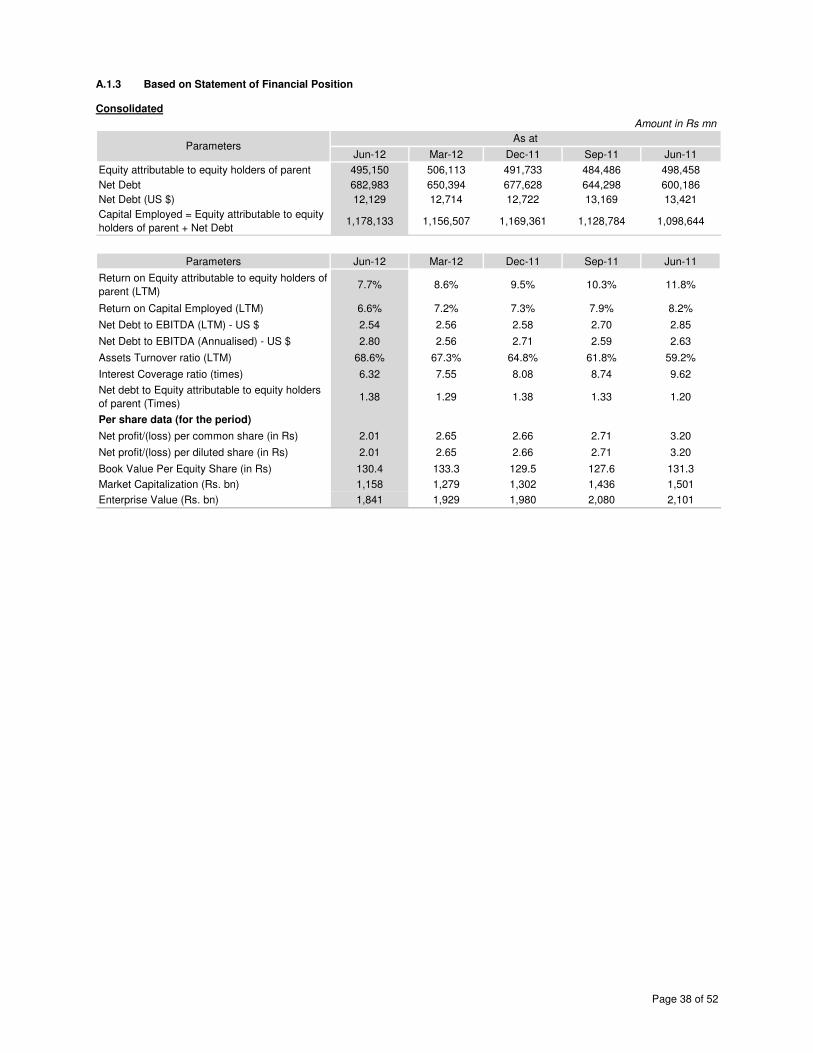
Page 38 of 52
A.1.3 Based on Statement of Financial Position Consolidated
Amount in Rs mn
Jun-12 Mar-12 Dec-11 Sep-11 Jun-11
Equity attributable to equity holders of parent 495,150 506,113 491,733 484,486 498,458
Net Debt 682,983 650,394 677,628 644,298 600,186
Net Debt (US $) 12,129 12,714 12,722 13,169 13,421
Capital Employed = Equity attributable to equity
holders of parent + Net Debt1,178,133 1,156,507 1,169,361 1,128,784 1,098,644
Parameters Jun-12 Mar-12 Dec-11 Sep-11 Jun-11
Return on Equity attributable to equity holders of
parent (LTM)7.7% 8.6% 9.5% 10.3% 11.8%
Return on Capital Employed (LTM) 6.6% 7.2% 7.3% 7.9% 8.2%
Net Debt to EBITDA (LTM) - US $ 2.54 2.56 2.58 2.70 2.85
Net Debt to EBITDA (Annualised) - US $ 2.80 2.56 2.71 2.59 2.63
Assets Turnover ratio (LTM) 68.6% 67.3% 64.8% 61.8% 59.2%
Interest Coverage ratio (times) 6.32 7.55 8.08 8.74 9.62
Net debt to Equity attributable to equity holders
of parent (Times) 1.38 1.29 1.38 1.33 1.20
Per share data (for the period)
Net profit/(loss) per common share (in Rs) 2.01 2.65 2.66 2.71 3.20
Net profit/(loss) per diluted share (in Rs) 2.01 2.65 2.66 2.71 3.20
Book Value Per Equity Share (in Rs) 130.4 133.3 129.5 127.6 131.3
Market Capitalization (Rs. bn) 1,158 1,279 1,302 1,436 1,501
Enterprise Value (Rs. bn) 1,841 1,929 1,980 2,080 2,101
ParametersAs at

Page 39 of 52
A.1.4 Operational Performance – India
Parameters UnitJun 30,
2012
Mar 31,
2012
Dec 31,
2011
Sep 30,
2011
Jun 30,
2011
Total Customers Base 000's 197,974 191,777 186,039 182,725 178,771
Mobile Services
Customer Base 000's 187,302 181,279 175,653 172,783 169,187
VLR % 90.8% 91.7% 90.0% 88.6% 88.8%
Net Additions 000's 6,023 5,626 2,870 3,595 6,984
Pre-Paid (as a % of total Customer Base) % 96.2% 96.3% 96.3% 96.3% 96.3%
Monthly Churn % 8.8% 8.8% 7.9% 7.2% 6.4%
Average Revenue Per User (ARPU) Rs 185 189 187 183 190
Average Revenue Per User (ARPU) US$ 3.4 3.8 3.7 4.0 4.3
Total Revenue / Minutes on Network paisa 42.7 43.8 44.6 43.2 42.8
Revenue per site per month Rs 275,647 280,332 274,637 266,165 270,590
Voice
Minutes on the network Mn 239,338 230,365 219,152 217,408 221,560
Voice Average Revenue Per User (ARPU) Rs 154 158 157 153 161
Voice Usage per customer min 433 431 419 423 445
Voice Realization per minute paisa 35.7 36.7 37.5 36.2 36.1
Non Voice Revenue
% of Mobile revenues % 16.3% 16.2% 15.8% 16.1% 15.6%
Of Which
Messaging & VAS as % of Mobile revenues % 10.8% 11.0% 11.3% 12.2% 12.1%
Data as % of Mobile revenues % 4.3% 4.1% 3.5% 3.1% 3.2%
Others as % of Mobile revenues % 1.2% 1.1% 1.0% 0.8% 0.3%
Data
Data Customer Base 000's 38,660 35,780 NA NA NA
Of which no. of 3G customers 000's 3,713 2,711 NA NA NA
As % of Customer Base % 20.6% 19.7% NA NA NA
Total MBs on the network Mn MBs 12,566 10,006 NA NA NA
Data Average Revenue Per User (ARPU) Rs 40 44 NA NA NA
Data Usage per customer MBs 112 107 NA NA NA
Data Realization per MB paisa 35.3 40.9 NA NA NA
Telemedia Services
Customers 000's 3,272 3,270 3,317 3,328 3,322
Of which no. of Broadband (DSL) customers 000's 1,371 1,369 1,357 1,398 1,433
As % of Customer Base % 41.9% 41.9% 40.9% 42.0% 43.1%
Net Additions 000's 2 (47) (11) 7 26
Average Revenue Per User (ARPU) Rs 962 933 916 955 952
Average Revenue Per User (ARPU) US$ 17.8 18.6 18.1 20.9 21.3
Non Voice Revenue as a % of Telemedia Revenues % 54.3% 55.8% 54.8% 52.1% 52.0%
Digital TV
Digital TV Customers 000's 7,400 7,228 7,069 6,614 6,262
Net additions 000's 172 159 455 352 600
Average Revenue Per User (ARPU) Rs 166 166 160 161 163
Average Revenue Per User (ARPU) US$ 3.1 3.3 3.2 3.5 3.7
Monthly Churn % 1.7% 1.2% 1.2% 1.2% 0.7%

Page 40 of 52
A.1.5 Traffic Trends – India
Parameters UnitJun 30,
2012
Mar 31,
2012
Dec 31,
2011
Sep 30,
2011
Jun 30,
2011
Mobile Services Mn Min 239,338 230,365 219,152 217,408 221,560
Telemedia Services Mn Min 4,162 4,145 4,186 4,598 4,570
National Long Distance Services Mn Min 22,241 21,588 20,551 20,305 19,878
International Long Distance Services Mn Min 3,362 3,518 3,529 3,519 3,119
Total Minutes on Network (Gross) Mn Min 269,103 259,615 247,418 245,831 249,127
Eliminations Mn Min (22,525) (21,926) (20,904) (20,660) (20,272)
Total Minutes on Network (Net) Mn Min 246,578 237,688 226,514 225,171 228,854
A.1.6 Coverage and Network Trends - India
Parameters UnitJun 30,
2012
Mar 31,
2012
Dec 31,
2011
Sep 30,
2011
Jun 30,
2011
Mobile Servies
Census Towns Nos 5,121 5,118 5,116 5,115 5,114
Non-Census Towns & Villages Nos 455,575 454,302 453,294 453,148 452,719
Population Coverage % 86.5% 86.4% 86.4% 86.3% 86.2%
Optic Fibre Network R Kms 159,762 157,886 154,744 151,719 148,792
Sites on Network Nos 126,010 120,905 119,044 118,011 117,144
Of which no. of 3G sites Nos 18,012 16,162 14,751 12,979 10,669
Telemedia Services
Cities covered Nos 87 87 87 87 87
Airtel Business
Submarine cable systems Nos 7 7 7 7 7
Digital TV Services
Districts Covered Nos 616 609 587 582 550
Coverage % 96% 95% 92% 91% 86%
A.1.7 Passive Infrastructure Services A.1.7.1 Bharti Infratel Consol
Parameters UnitJun 30,
2012
Mar 31,
2012
Dec 31,
2011
Sep 30,
2011
Jun 30,
2011
Total Towers20Nos 79,574 79,154 79,025 78,835 78,689
Total Tenancies20Nos 151,932 150,315 148,777 146,536 144,706
Key Indicators
Sharing Revenue per Sharing Operator per month Rs 32,360 34,104 34,290 33,098 33,533
Tenancy Ratio Times 1.91 1.89 1.87 1.85 1.83
Note 20: Total Towers and Tenancies include proportionate consolidation of 42% of Indus Towers.
A.1.7.2 Bharti Infratel Standalone
Parameters UnitJun 30,
2012
Mar 31,
2012
Dec 31,
2011
Sep 30,
2011
Jun 30,
2011
Total Towers21Nos 33,660 33,326 33,203 33,056 32,942
Total Tenancies Nos 61,024 60,422 60,512 59,444 58,624
Key Indicators
Sharing Revenue per Sharing Operator per month Rs 36,532 37,277 37,623 37,117 36,203
Tenancy Ratio Times 1.82 1.82 1.81 1.79 1.77
Note 21: Total Towers are excluding 35,252 towers in 11 circles for which the right of use has been assigned to Indus with effect from 1st Jan 2009.
A.1.7.3 Indus Towers
Parameters UnitJun 30,
2012
Mar 31,
2012
Dec 31,
2011
Sep 30,
2011
Jun 30,
2011
Total Towers Nos 109,318 109,114 109,101 108,998 108,922
Total Tenancies Nos 216,447 214,032 210,154 207,361 204,958
Key Indicators
Sharing Revenue per Sharing Operator per month Rs 30,139 32,563 32,272 31,112 31,963
Tenancy Ratio Times 1.97 1.94 1.91 1.89 1.87
Note 22: Indus KPIs are on 100% basis.

Page 41 of 52
A.1.8 Human Resource Analysis - India
Parameters UnitJun 30,
2012
Mar 31,
2012
Dec 31,
2011
Sep 30,
2011
Jun 30,
2011
Consolidated
Total Employees23Nos 15,256 14,935 15,141 15,611 16,545
Number of Customers per employee Nos 12,977 12,841 12,287 11,705 10,805
Personnel Cost per employee per month Rs 118,119 110,252 104,443 116,451 111,741
Gross Revenue per employee per month Rs 2,935,716 2,937,785 2,843,124 2,661,360 2,504,062
Note 23: Total Employee count of India includes proportionate consolidation of 42% of Indus Towers employees. A.1.9 Operational Performance – Africa
Parameters UnitJun 30,
2012
Mar 31,
2012
Dec 31,
2011
Sep 30,
2011
Jun 30,
2011
Customer Base 000's 55,855 53,140 50,949 48,437 46,306
Net Additions 000's 2,715 2,191 2,512 2,131 2,100
Pre-Paid (as a % of total Customer Base) % 99.3% 99.3% 99.3% 99.3% 99.3%
Monthly Churn % 5.1% 5.3% 5.4% 6.1% 6.3%
Average Revenue Per User (ARPU) US$ 6.5 6.8 7.1 7.3 7.3
Total Revenue / Minutes on Network US¢ 5.4 5.6 5.7 5.7 6.0
Revenue per site per month US$ 23,134 24,522 25,225 25,836 26,196
Voice
Minutes on the network Mn 19,651 19,131 18,496 17,950 16,337
Voice Average Revenue Per User (ARPU) US$ 5.7 6.1 6.5 6.5 6.5
Voice Usage per customer min 120 122 125 128 121
Voice Realization per minute US¢ 4.7 5.0 5.2 5.1 5.4
Non Voice Revenue
% of Mobile revenues % 12.9% 10.6% 9.4% 10.7% 10.6%
Of Which
Messaging & VAS as % of Mobile revenues % 7.0% 5.6% 5.3% 6.0% 5.4%
Data as % of Mobile revenues % 3.4% 3.2% 2.5% 2.7% 3.2%
Others as % of Mobile revenues % 2.5% 1.8% 1.6% 2.0% 2.0%
A.1.10 Coverage and Network Trends - Africa
Parameters UnitJun 30,
2012
Mar 31,
2012
Dec 31,
2011
Sep 30,
2011
Jun 30,
2011
Sites on Network Nos 15,439 14,831 14,112 13,628 12,703
Of which no. of 3G sites Nos 4,787 3,205 NA NA NA
A.1.11 Human Resource Analysis - Africa
Parameters UnitJun 30,
2012
Mar 31,
2012
Dec 31,
2011
Sep 30,
2011
Jun 30,
2011
Total Employees Nos 4,907 4,792 4,773 5,115 5,474
Number of Customers per employee Nos 11,383 11,089 10,674 9,470 8,459
Personnel Cost per employee per month US$ 5,436 6,006 5,783 5,154 5,657
Gross Revenue per employee per month US$ 72,831 75,800 73,835 67,138 59,594

Page 42 of 52
A.2 Key Accounting Policies as per IFRS 1. Joint Ventures A joint venture is a contractual arrangement whereby the Group and other parties undertake an economic activity that is subject to joint control; that is, when the strategic financial and operating policy decisions relating to the activities require the unanimous consent of the parties sharing control. The Group reports its interests in jointly controlled entities using proportionate consolidation. The Group’s share of the assets, liabilities, income, expenses and cash flows of jointly controlled entities are combined with the equivalent items in the results on a line-by-line basis in the consolidated financial statements. The financial statements of the joint venture are prepared for the same reporting period as the parent company. Adjustments are made where ever necessary, to bring the accounting policies in line with those of the Group. Adjustments are made in the Group’s consolidated financial statements to eliminate the Group’s share of intra-group balances, income and expenses and unrealized gains and losses on transactions between the Group and its jointly controlled entities. 2. Property and equipment
Property and equipment are stated at cost, net of
accumulated depreciation and impairment loss. All direct
costs relating to the acquisition and installation of property
and equipment are capitalized.
Depreciation is recorded on a straight-line basis over the
estimated useful lives of the assets.
Assets
Years
Building 20 Network Equipment 3-20 Computer equipment 3 Office, furniture and equipment 2 - 5 Vehicles 3 - 5
Leasehold improvements
Remaining period of the lease or 10/20 years, as applicable, whichever is less
Assets individually costing Rs. 5 thousand or less
1
Customer premises equipment 5 – 6
Land is not depreciated. The assets’ residual values and
useful lives are reviewed, and adjusted if appropriate, at
each balance sheet date.
Gains and losses arising from retirement or disposal of
property and equipment are determined as the difference
between the net disposal proceeds and the carrying amount
of the asset and are recognized in the consolidated
statement of comprehensive income on the date of
retirement and disposal.
Costs of additions and substantial improvements to property
and equipment are capitalized. The costs of maintenance
and repairs of property and equipment are charged to
operating expenses.
3. Goodwill
Goodwill arising on the acquisition of an entity represents the excess of the cost of acquisition over the Group’s interest in the net fair value of the identifiable assets, liabilities and contingent liabilities of the entity recognized at the date of acquisition. Goodwill on acquisition of subsidiaries is disclosed separately. Goodwill arising on accounting for jointly controlled entities or entities in which the Group exercises significant influence is included in investments in the related associates/jointly controlled entities. Goodwill is initially recognized as an asset at cost and is subsequently measured at cost less any accumulated impairment losses. Goodwill is held in the currency of the acquired entity and revalued to the closing rate at each date of statement of financial position. Goodwill is not subject to amortization but is tested for impairment annually and when circumstances indicate, the carrying value may be impaired. Negative goodwill arising on an acquisition is recognized directly in the statement of comprehensive income. On disposal of a subsidiary or a jointly controlled entity, the attributable amount of goodwill is included in the determination of the profit or loss recognized in the statement of comprehensive income on disposal. Impairment is determined for goodwill by assessing the recoverable amount of each cash-generating unit (or group of cash-generating units) to which the goodwill relates. Where the recoverable amount of the cash- generating unit is less than their carrying amount an impairment loss is recognized. Impairment losses relating to goodwill are not reversed in future periods. 4. Foreign currency transactions
Monetary assets and liabilities denominated in foreign
currencies are translated at the functional currency spot rate
of exchange ruling at the reporting date. Non-monetary items
that are measured in terms of historical cost in a foreign
currency are translated using the exchange rates as at the
dates of the initial transactions. Gains or losses resulting
from foreign currency transactions are included in the
consolidated statement of comprehensive income.
The assets and liabilities of foreign operations are translated
into functional currency of parent (i.e. INR) at the rate of
exchange prevailing at the reporting date and their
statements of comprehensive income are translated at
average exchange rates prevailing during the period. The
exchange differences arising on the translation are
recognized in ’foreign currency translation reserve (FCTR)’. Exchange differences arising on a monetary item that forms
part of Group entity’s net investment in a foreign operation is
recognized in profit or loss in the separate financial
statements of the Group entity or the individual financial
statements of the foreign operation, as appropriate. In the
consolidated financial statements, such exchange
differences are recognized in other comprehensive income.
On disposal of a foreign operation (reduction in percentage
ownership interest), the component of FCTR relating to that

Page 43 of 52
particular foreign operation is recognized in the statement of
comprehensive income. 5. Capital leases
Lessee accounting
Finance leases, which transfer to the Group substantially all
the risks and benefits incidental to ownership of the leased
item, are capitalized at the commencement of the lease at
the fair value of the leased property or, if lower, at the
present value of the minimum lease payments. Lease
payments are apportioned between finance charges and
reduction of the lease liability so as to achieve a constant
rate of interest on the remaining balance of the liability.
Finance charges are recognized in the statement of
comprehensive income.
Amortization of leased assets is computed on straight line
basis over the shorter of useful life of the assets or
remaining lease period. Amortization charge for capital
leases is included in depreciation expense for the period.
Lessor accounting
Assets leased to others under capital leases are recognized
as receivables at an amount equal to the net investment in
the leased assets. The finance income is recognized based
on periodic rate of return on the net investment of the lessor
outstanding in respect of the capital lease.
6. Indefeasible right to use (IRU)
The Group enters into agreements for leasing assets under
‘Indefeasible right to use’ with third parties. Under the
arrangement the assets are taken or given on lease over the
substantial part of the asset life. However the title to the
assets and associated risks are retained by the lessor.
Hence, such arrangements are recognized as operating
lease. Direct expenditures incurred in connection with
agreements are capitalized and expensed over the term of
the agreement.
The contracted price is received in advance and is
recognized as revenue during the period of the agreement.
Unearned IRU revenue net of the amount recognizable
within one year is disclosed as unearned income in non-
current liabilities and the amount recognizable within one
year as unearned income in current liabilities.
Exchange of network capabilities with other
telecommunication service providers are recorded as non-
monetary transactions and measured at the carrying amount
of capacities relinquished, as these exchanges are for
similar productive assets used to provide telecommunication
services to customers.
7. Impairment of long – lived assets and intangible assets
The Group reviews its long-lived assets, including identifiable intangibles with finite lives, for impairment whenever events or changes in business circumstances
indicate that the carrying amount of assets may not be fully recoverable. Such circumstances include, though are not limited to, significant or sustained declines in revenues or earnings and material adverse changes in the economic climate. For assets that the Group intends to hold for use, if the total of the expected future undiscounted cash flows produced by the asset or asset Group is less than the carrying amount of the assets, a loss is recognized for the difference between the fair value and carrying value of the assets. For assets the Group intends to dispose of by sale, a loss is recognized for the amount by which the estimated fair value, less cost to sell, is less than the carrying value of the assets. Fair value is determined based on quoted market prices, if available, or other valuation techniques including discounted future net cash flows. 8. Revenue recognition
(i) Service revenues Service revenues include amounts invoiced for usage charges, fixed monthly subscription charges and VSAT/ internet usage charges, roaming charges, activation fees, processing fees and fees for value added services (‘VAS’). Service revenues also include revenues associated with access and interconnection for usage of the telephone network of other operators for local, domestic long distance and international calls. Service revenues are recognized as the services are rendered and are stated net of discounts, waivers and taxes. Revenues from pre-paid cards are recognized based on actual usage. Activation revenue and related activation costs, not exceeding the activation revenue, are deferred and amortized over the estimated customer relationship period. The excess of activation costs over activation revenue, if any, are expensed as incurred. Subscriber acquisition costs are expensed as incurred. On introduction of new prepaid products, processing fees on recharge coupons is being recognized over the estimated customer relationship period or coupon validity period, whichever is lower. Service revenues from the internet and VSAT business comprise revenues from registration, installation and provision of internet and satellite services. Registration fee and installation charges are deferred and amortized over their expected customer relationship period of 12 months. Service revenue is recognized from the date of satisfactory installation of equipment and software at the customer site and provisioning of internet and satellite services. Revenue from prepaid dialup packs is recognized on an actual usage basis and is net of sales returns and discounts. Revenues from national and international long distance operations comprise revenue from provision of voice services which are recognized on completion of services while revenue from provision of bandwidth services is recognized over the period of arrangement. Unbilled receivables represent revenues recognized from the bill cycle date to the end of each month. These are billed in subsequent periods based on the terms of the billing plans. Unearned income includes amounts received in advance on pre-paid cards and advance monthly rentals on post-paid. The related services are expected to be performed within the next operating cycle.

Page 44 of 52
(ii) Equipment sales Equipment sales consist primarily of revenues from sale of VSAT and internet equipment (hardware) and related accessories to subscribers. Equipment sales are treated as activation revenue and are deferred and amortized over the customer relationship period. (iii) Multiple element arrangements The Group has entered into certain multiple-element revenue arrangements. These arrangements involve the delivery or performance of multiple products, services or rights to use assets including VSAT and internet equipment, internet and satellite services, set top boxes and subscription fees on DTH, indefeasible right to use and hardware and equipment maintenance. The Group evaluates all deliverables in an arrangement to determine whether they represent separate units of accounting at the inception of the arrangement in accordance “Revenue Arrangements with Multiple Deliverables” applying the hierarchy in IAS 8.12. Revenue is determined for each of the units of accounting on the basis of their fair values Arrangements involving the delivery of bundled products or services shall be separated into individual elements, each with own separate revenue contribution. Total arrangement consideration related to the bundled contract is allocated among the different elements based on their relative fair values (i.e., a ratio of the fair value of each element to the aggregated fair value of the bundled deliverables is generated). Where the Group has determined that the fair value of individual element is not ascertainable, equipment sales for these arrangements are deferred and amortized over the term of the arrangement. 9. License fees
Acquired licenses are shown at historical cost. Licenses
acquired in a business combination are recognized at fair
value at the acquisition date. License and spectrum entry
fees are measured at cost less accumulated amortization.
Amortization is charged to the statement of comprehensive
income on a straight-line basis over the period of the license
from the date of commencement of commercial operations in
the respective jurisdiction and is disclosed as components of
depreciation and amortization. The amortization period is
determined primarily by reference to the unexpired license
period.
Group’s shares of licenses acquired under business
combination are accounted for at their respective fair values
as at the date of acquisition. The amounts are amortized on
a straight-line basis over the remaining period of the license
from the date of acquisition of respective circles.
The revenue-share fee on license and spectrum is computed
as per the licensing agreement and is expensed as incurred.
10. Other intangible assets
Other intangible assets comprising enterprise resource
planning software, bandwidth capacities, brands, customer
relationships, distribution networks, licenses and non-
compete clauses, are capitalized at the Group’s share of
respective fair values on the date of an acquisition.
Amortization is charged to the statement of comprehensive
income on a straight-line basis over the estimated useful
lives of intangible assets from the date they are available for
use or placed in service. The intangibles are amortized as
follows:
• Software is amortized over the period of its license,
not exceeding three years. Software up to Rs 500
thousand is amortized over a period of 1 year.
• Bandwidth capacities are amortized over the period
of the agreement.
• Brand: Over the period of their expected benefits, not
exceeding the life of the licenses and are written off
in their entirety when no longer in use.
• Distribution network : Over estimated useful life
• Customer base: The estimated life of such
relationships.
11. Income-taxes
Income tax assets and liabilities for the current and prior
periods are measured at the amount expected to be
recovered from or paid to the taxation authorities, and is
provided using the liability method on temporary differences
at the reporting date between the tax bases of assets and
liabilities and their carrying amounts for financial reporting
purposes. Deferred tax liabilities are recognized for all
taxable temporary differences, except:
• Where the deferred tax liability arises from the initial
recognition of goodwill or of an asset or liability in a
transaction that is not a business combination and, at
the time of the transaction, affects neither the
accounting profit nor taxable profit or loss.
• In respect of taxable temporary differences
associated with investments in subsidiaries,
associates and interests in joint ventures, where the
timing of the reversal of the temporary differences
can be controlled and it is probable that the
temporary differences will not reverse in the
foreseeable future.
The tax rates and tax laws used to compute the amount are
those that are enacted or substantively enacted, by the
reporting date, in the countries where the Group operates
and generates taxable income.
12. Borrowing costs Borrowing costs directly attributable to the acquisition, construction or production of an asset that necessarily takes a substantial period of time to get ready for its intended use or sale are capitalized as part of the cost of the respective assets. The interest cost incurred for funding a qualifying asset during the construction period is capitalized based on actual investment in the asset at the average interest rate. All other borrowing costs are expensed in the period they occur. Borrowing costs consist of interest and other costs that the Group incurs in connection with the borrowing of funds. 13. Derivative financial instruments
The Group enters into derivative instruments, including
interest rate swaps and foreign currency forward contracts,
to manage interest rate movements of its debt obligations
and foreign currency exposures related to the import of

Page 45 of 52
equipment used in operations and its foreign currency
denominated debt instruments.
All derivative instruments are recorded on the balance sheet
at their fair value. Changes in the fair value of derivatives are
recorded each period in current earnings or in other
comprehensive income, depending on whether a derivative
is designated as part of a hedging relationship and, if it is,
depending on the type of hedging relationship.
14. Asset Retirement Obligations
Asset retirement obligations (ARO) are provided for those
operating lease arrangements where the Group has a
binding obligation at the end of the lease period to restore
the leased premises in a condition similar to inception of
lease. ARO are provided at the present value of expected
costs to settle the obligation using discounted cash flows
and are recognized as part of the cost of that particular
asset. The cash flows are discounted at a current pre-tax
rate that reflects the risks specific to the decommissioning
liability. The unwinding of the discount is expensed as
incurred and recognized in the statement of comprehensive
income as a finance cost. The estimated future costs of
decommissioning are reviewed annually and adjusted as
appropriate. Changes in the estimated future costs or in the
discount rate applied are added to or deducted from the cost
of the asset.
15. Allowance for uncollectible accounts receivable
The allowance for uncollectible accounts receivable reflects
management’s best estimate of probable losses inherent in
the accounts receivable balance. Management primarily
determines the allowance based on the aging of accounts
receivable balances and historical write-off experience, net
of recoveries. The Group provides for amounts outstanding
net of security deposits, or in specific cases where
management is of the view that the amounts are not
recoverable. Amounts due from debtors that have been
outstanding, though fully provided, are evaluated on a
regular basis by the management and are written off, if as a
result of such evaluation, it is determined that these amounts
will not be collected.
16. Issuance of Stock by Subsidiaries
At the time a subsidiary sells its stock to unrelated parties at a price less than or in excess of its book value, the Company's investment in that subsidiary's net assets changes. The Company's policy is to record such changes in its consolidated statement of changes in equity.

Page 46 of 52
GLOSSARY
Technical and Industry Terms
Company Related
3G Third Generation of Mobile Telephony.
3G Customers Customer who made at least one revenue generating call or a data session of more than zero Kbs
on 3G network in the last 30 days
3G Data Customers A customer who used at least one data session of more than zero Kbs on 3G network in the last 30 days
Average Revenue per User (ARPU)
Average revenue per customer per month is computed by: dividing the total revenues (including sale of goods) during the relevant period by the average customers; and dividing the result by the number of months in the relevant period.
Asset Turnover
Asset Turnover is defined as total revenues, for the preceding (last) 12 months from the end of the relevant period, divided by average assets. Asset is defined as the sum of non-current assets and net current assets. Net current assets are computed by subtracting current liabilities from current assets. Average assets are calculated by considering average of quarterly average for the preceding (last) four quarters from the end of the relevant period.
Average Sharing Operators
Average Sharing Operators are derived by computing the average of the monthly average of sharing operators for the relevant period
Average Customers Average customers are derived by computing the average of the monthly average customers for the relevant period.
Average Towers Bn
Average towers are derived by computing the average of the monthly average towers for the relevant period Billion
Book Value Per Equity Share
Total stockholder’s equity as at the end of the relevant period divided by outstanding equity shares as at the end of the relevant period.
Capex It includes investment in gross fixed assets and capital work in progress for the quarter.
Capital Employed Capital Employed is defined as sum of equity attributable to equity holders of parent and net debt.
Cumulative Investments (earlier known as Investment in Projects)
Cumulative Investments comprises of gross value of property, plant & equipment (including CWIP & capital advances) and intangibles including investment in associates.
Cash Profit From Operations before Derivative & Exchange Fluctuation
It is not an IFRS measure and is defined as operating income adjusted for depreciation and amortization, pre-operating costs, interest expense and interest income before adjusting for derivative & exchange (gain)/ loss.
Churn
Churn is calculated by dividing the total number of disconnections during the relevant period by the average customers; and dividing the result by the number of months in the relevant period.
Customer Base Customer who made at least one revenue generating call or a data session of more than zero Kbs on 2G / 3G / 4G network in the last 30 days.
Customers Per Employee
Number of customers on networks of a business unit as at end of the relevant period divided by number of employees in the respective business unit as at end of the relevant period.
Data as % of Mobile Revenue
It is computed by dividing the ‘data’ revenues by the total revenues of mobile services for the relevant period. Data revenue includes revenue from use of data session on GPRS / 3G / 4G including blackberry.
Data ARPU Average revenue per data customer per month is computed by: dividing the total data revenues
during the relevant period by the average data customers; and dividing the result by the number of months in the relevant period.

Page 47 of 52
Data Customer Base A customer who used at least one data session of more than 0 Kbs on GPRS / 3G / 4G network in the last 30 days.
Data Usage per Customer
It is calculated by dividing the total MBs consumed on the network during the relevant period by the average data customer base; and dividing the result by the number of months in the relevant period.
Data Realization per MB It is computed by dividing the Data revenues by total MBs consumed on the network. DTH / Digital TV Services
Direct to Home broadcast service
Earnings Per Basic Share.
It is computed by dividing net income attributable to ordinary shareholders by the weighted average number of ordinary shares outstanding during the period.
Earnings Per Diluted Share
The calculation of Net Profit/ (loss) per diluted share adjusts net profit or loss and the weighted average number of ordinary shares outstanding, to give effect to all dilutive potential ordinary shares that were outstanding during the year. Net profit or loss attributable to ordinary shareholders is adjusted for the after-tax effect of the following: (1) dividends on potential ordinary shares (for example, dilutive convertible preferred shares); (2) interest recognized on potential ordinary shares (for example, dilutive convertible debt); and (3) any other changes in income or expense resulting from the conversion of dilutive potential ordinary shares (e.g., an entity’s contribution to its non-discretionary employee profit-sharing plan may be revised based on changes in net profit due to the effects of items discussed above).
EBITDA Earnings/ (loss) before interest, taxation, depreciation and amortization. It is not a IFRS measure and is defined as operating income adjusted for depreciation and amortization and pre-operating costs.
EBITDA Margin It is computed by dividing EBITDA for the relevant period by total revenues for the relevant period.
EBIT Earnings / (Loss) before interest, taxation for the relevant period.
Enterprise Valuation (EV)
Calculated as sum of Market Capitalization plus Net Debt as at the end of the relevant period.
EV / EBITDA (times) Computed by dividing Enterprise Valuation as at the end of the relevant period (EV) by EBITDA
for the relevant period (annualized). Gross Revenue per Employee per month
It is computed by dividing the Gross Revenue (net of inter-segment eliminations) by the closing number of employees in a given business unit and number of months in the relevant period.
ILD International Long Distance Services.
Intangibles Comprises of goodwill, software, bandwidth, one-time entry fee paid towards acquisition of licenses, distribution network and customer relationships.
Interest Coverage Ratio EBITDA for the relevant period divided by interest on borrowing for the relevant period.
IPTV
Internet Protocol TV. IPTV is the method of delivering and viewing television programmes using an IP transmission and service infrastructure, which can deliver digital television to the customers. IPTV when offered using an IP network and high speed broadband technology becomes interactive because of availability of return path and is capable of providing Video on Demand (VOD), time shifted television and many other exciting programmes.
LTM Last twelve months.
Market Capitalization Mn
Number of issued and outstanding shares as at end of the period multiplied by closing market price (BSE) as at end of the period. Million
Messaging & VAS as % of Mobile Revenue
It is computed by dividing ‘messaging and VAS’ revenue by the total revenues of mobile services for the relevant period. Messaging revenue includes revenue from exchange of text or multimedia messages (MMS) as well as termination revenues from other operators. VAS revenue includes revenue from hello tunes, ring tones, music downloads etc.

Page 48 of 52
MNP
Mobile Network Portability
MoU
Minutes of Usage. Duration in minutes for which a customer uses the network. It is typically expressed over a period of one month.
MPLS Multi Protocol Label Switching Network Site
Comprises of Base Transmission System (BTS) which holds the radio transreceivers (TRXs) that define a cell and coordinates the radio links protocols with the mobile device. It includes all the Ground based, Roof top and In Building Solutions as at the end of the period.
Net Debt It is not a IFRS measure and is defined as the long-term debt, net of current portion plus short-term borrowings and current portion of long-term debt minus cash and cash equivalents, restricted cash, restricted cash non-current and short-term investments as at the end of the relevant period.
Net Debt to EBITDA (LTM)
It is computed by dividing net debt as at the end of the relevant period by EBITDA for preceding (last) 12 months from the end of the relevant period.
Net Debt to EBITDA (Annualized)
It is computed by dividing net debt as at the end of the relevant period by EBITDA for the relevant period (annualized).
Net Debt to Funded Equity Ratio
It is computed by dividing net debt as at the end of the relevant period by Equity attributable to equity holders of parent as at the end of the relevant period.
Net Revenues It is not IFRS measure and is defined as total revenues adjusted for access charges for the relevant period.
NLD National Long Distance Services.
Non Voice Revenue as a % of consolidated revenue
It is computed by dividing the total non-voice revenue of the company (consolidated) by the total revenues for the relevant period. Non-voice revenues include Messaging & VAS and Data revenues for Mobile, VAS and Internet Revenues for Telemedia Services, Bandwidth and Internet Revenues for Airtel Business Services, Media & Broadcasting revenues for DTH Services, site sharing revenues, sale of goods etc.
Non Voice Revenue as a % of Mobile Revenue
It is computed by dividing the total non voice revenue of mobile services by the total revenues of mobile services for the relevant period. Non voice revenue, which includes revenue from services other than voice i.e., Messaging & VAS (including SMS, GPRS, MMS, Ring Back Tone), Data, others etc.
Non Voice Revenue as a % of Telemedia Revenue
It is computed by dividing the total non voice revenue of Telemedia services by the total revenues of Telemedia services for the relevant period. Non voice revenue for Telemedia services includes revenues from services such as DSL, Leaseline, MPLS, IPTV etc.
Others as a % of Mobile Revenues
It is computed by dividing ‘other’ revenue by the total revenues of mobile services for the relevant period. Others include revenue from infrastructure sharing & sale of goods.
Operating Free Cash flow
It is computed by subtracting capex from EBITDA.
Profit / (Loss) after current tax expense
It is not a IFRS measure and is defined as Profit / (Loss) before taxation adjusted for current tax expense.
Return On Capital Employed (ROCE)
For the full year ended March 31, 2010, 2011 and 2012. ROCE is computed by dividing the sum of net profit and finance cost (net) for the period by average (of opening and closing) capital employed. For the quarterly computation, it is computed by dividing the sum of net profit and finance cost (net) for the preceding (last) 12 months from the end of the relevant period by average capital employed. Average capital employed is calculated by considering average of quarterly average for the preceding (last) four quarters from the end of the relevant period.
Return On Equity attributable to equity holders of parent
For the full year ended March 31, 2010, 2011 and 2012, it is computed by dividing net profit for the period by the average (of opening and closing) Equity attributable to equity holders of parent. For the quarterly computations, it is computed by dividing net profit for the preceding (last) 12 months from the end of the relevant period by the average Stockholder’s equity for the preceding (last) 12 months. Average Stockholder’s equity is calculated by considering average of quarterly average for the preceding (last) four quarters from the end of the relevant period.
Revenue per Site per month
Revenue per Site per month is computed by: dividing the total mobile revenues, excluding sale of goods (if any) during the relevant period by the average sites; and dividing the result by the number of months in the relevant period.
Page 49 of 52
SA South Asia Sharing revenue per Sharing Operator per month
It is computed by dividing gross revenue less energy & other pass through, from Passive Infrastructure services by average sharing operators.
Tenancy Ratio TD-LTE
It is computed by dividing average sharing operators by average towers. Time Division – Long Term Evolution.
Total MBs on Network Includes total MBs consumed on the network (uploaded & downloaded) on our network during the relevant period.
Total Tenancies It is the sum of all operators sharing total towers.
Total Towers It is the sum of ground based towers, roof top towers and others.
TSP Telecom Service Provider Total Operating Expenses
It is defined as sum of equipment costs, employee costs, network operations costs and selling, general and administrative cost for the relevant period.
VAS
Value Added Service
Voice Minutes on Network
Includes usage on our network (incoming, outgoing & in-roaming minutes) during the relevant period.
Voice ARPU Voice Average revenue per customer per month is computed by: dividing the voice revenues
during the relevant period by the average voice customers; and dividing the result by the number of months in the relevant period. Voice Revenues include airtime revenue from usage, processing fees, activation, roaming and termination charges from other operators.
Voice Minutes of Usage per Customer per Month
It is calculated by dividing the voice minutes of usage on our network during the relevant period by the average customers; and dividing the result by the number of months in the relevant period.
Voice Realization per Minute
It is computed by dividing the voice revenues by voice minutes.
Regulatory
BWA Broadband Wireless Access
3G 4G
Third - Generation Technology Fourth - Generation Technology
CCK Communications Commission of Kenya
DoT Department of Telecommunications
IP Internet Protocol
QoS Quality of Service
TRAI
Telecom Regulatory Authority of India
UAS Unified Access Service
UASL Unified Access Service License
VSAT Very Small Aperture Terminals
Others (Industry)
BSE The Stock Exchange, Mumbai
CMAI Communication Multimedia & Infrastructure
RBI Reserve Bank of India
Page 50 of 52
GSM Global System for Mobile Communications.
CDMA DSL
Code Division Multiple Access Digital Subscriber Line
ICT Information and Communication Technology
GAAP Generally Accepted Accounting Principles
MMS Multimedia Messaging Service
IAS International Accounting Standards
IFRS International Financial Reporting Standards
NSE The National Stock Exchange of India Limited.
Sensex Sensex is a stock index introduced by The Stock Exchange, Mumbai in 1986.
SMS
Short Messaging Service.

Page 51 of 52
This page has been left blank intentionally.

Page 52 of 52
Written correspondence to be sent to: Bharti Airtel Limited Investor Relations
[email protected] http://www.airtel.in