Embed Size (px)
Citation preview

ASX Announcement 12 April 2017
Peak Resources Limited Ground Floor, 5 Ord Street, West Perth, Western Australia 6005. PO Box 603, West Perth 6872. ASX: PEK ACN: 112 546 700
Telephone: +61 8 9200 5360 [email protected] www.peakresources.com.au Company Secretary: Graeme Scott
Non-Executive Chairman: Peter Harold Managing Director: Darren Townsend Technical Director: Dave Hammond Non-Executive Directors: Jonathan Murray, John Jetter
BFS positions Ngualla as one of the world’s lowest cost rare earth
projects
Peak Resources Limited (ASX: PEK) (“Peak” or the “Company”) is pleased to report the results of
its Bankable Feasibility Study (the “Study” or “BFS”) on the Ngualla Rare Earth Project (located in
Tanzania) and proposed refinery in Tees Valley (located in the UK). The BFS has delivered further
significant reductions in operating costs and facilitated access to higher value markets as
compared to the Company’s project update ASX announcement “Ngualla Project Study delivers
substantial Capex and Opex savings” dated 16 March 2016 (“Project Update”).
The results of the BFS have confirmed that the Ngualla Project has the potential to become one of
the lowest cost and highest quality rare earth projects worldwide.
Delivery of the project is well timed to benefit from the expected strong uplift in the demand for
permanent magnet motors required by the rapidly expanding electric vehicle market, which has
been the main catalyst for significant increases in the price of lithium and cobalt since late 2015.
Neodymium and praseodymium are expected to generate 90% of Ngualla’s future revenue.
Please note all cost are in US$ unless otherwise stated.
* NdPr = Nd2O3 /Pr6O11 Mixed Oxide 2N – min 75% Nd2O3
Highlights of the BFS:
Operating cost of US$ 34.20/kg NdPr* Oxide, demonstrating potential to be the world’slowest cost fully integrated rare earth development project
Annual operating costs reduced by $35 million per annum from the PFS
Pre Tax NPV10 of $676 million
Post Tax NPV10 of $445 million
Pre Tax NPV8 of $930 million
Post Tax NPV8 of $633 million
Pre Tax IRR of 25% and Post Tax IRR of 21%
High degree of confidence in the ore body and mine plan, with 92% classified as ProvedOre Reserves under JORC 2012
30 year life, low cost, open pit mining, conventional multi-stage processing plant andrefinery delivering free cash flow of $104 million per annum (post tax and royalties)
Proven and demonstrated extraction processes targeting NdPr products using extensiveoperational and marketing expertise from Peak’s team of rare earth industry specialists
For
per
sona
l use
onl
y

ASX Announcement 12 April 2017
2 ENABLING LOW CARBON TECHNOLOGIES
Completion of the BFS by Peak’s team of experienced rare earth industry experts in conjunction
with global engineering firm Amec Foster Wheeler, including the extensive pilot planting of Ngualla
ore, has delivered a study from which all stakeholders can have confidence in the deliverability and
operability of the planned mining, beneficiation and refining processes.
The Study envisages production over a 30 year mine life based on the weathered Bastnaesite
Zone mineralisation, which comprises only 22% of the Total Ngualla Mineral Resource estimate at
a 1% rare earth oxide (REO) lower grade cut (for details see Appendix). The annual output target
is:
2,420 tonnes of Neodymium and Praseodymium rare earth oxide (2N min 75% Nd2O3)
530 tonnes of mixed Samarium, Europium and Gadolinium rare earth carbonate
3,005 tonnes of Cerium carbonate and 6,940 tonnes of Lanthanum carbonate
Please note production, costs and financial analysis are reported on a 100% owned basis (Peak currently own 75% of
the Ngualla Project). Production targets and schedules are based on the Ore Reserve and stated Material Assumptions
as set out in the Company’s ASX Announcement “Ngualla Rare Earth Project – Updated Ore Reserve” dated 12 April
2017 and within the BFS Executive Summary released together with this announcement.
Managing Director, Darren Townsend commented: “I would like to congratulate the Peak and
AMEC Foster Wheeler teams and our other consultants on the delivery of a robust and
comprehensive BFS. Our stakeholders can take comfort that the Study has been completed under
the leadership of our Chief Operating Officer, Rocky Smith and Technical Director, Dave Hammond
and is based on the Peak team’s significant rare earth operating and marketing experience
combined with extensive pilot planting. With the further US $14 million per annum (14%) reduction
in operating cost compared to the Project Update and a total reduction in operating costs of US
$35 million per annum compared to the Company’s Preliminary Feasibility Study dated March 2014.
The Ngualla Project has the potential to be one of the world’s lowest operating cost/kg NdPr fully
integrated rare earth producers and we believe is perfectly positioned for the expected increase in
magnet metal prices driven by the forecast enormous growth in e-mobility and low carbon
technologies.”
AMEC Foster Wheeler Director of Mining Australasia, Greg Hayes commented: “I would like to
thank the Peak and AMEC Foster Wheeler teams for their professionalism in delivering this high
quality Study. Peak has taken advantage of perfect timing to complete the BFS during a period of
depressed commodity prices and as a result were able to access some of the best talent in our
organisation and within the various pilot plant laboratories” For
per
sona
l use
onl
y

ASX Announcement 12 April 2017
3
ENABLING LOW CARBON TECHNOLOGIES
The BFS Highlights “Physicals drive economics”
Ngualla’s favourable project economics are in part driven by the high NdPr grade and
advantageous mineralogy of the rare earth deposit itself, together with the development of an
extraction and purification process that targets the higher value rare earths whilst rejecting the
majority of the lower value cerium. The location of the refinery in proximity to sources of
inexpensive bulk reagents and existing utilities is also a key driver of lower Opex.
With the alignment of products and value drivers to the high demand magnet metal market the
project is in a favourable position in terms of marketing and future demand for its products which
will represent less than 5% of total world demand.
RESULTING IN A LIFE OF PROJECT CONSOLIDATED OPERATING COST OF
US $34.20/kg# NdPr is the breakeven point for positive cash flow. Considering
today's spot pricing of US $42.55/kg and understanding the
projections and the drivers for the market outlook of increased
demand for NdPr, Peak aims to take advantage of the expected
increase in pricing as new permanent magnet technology
applications arrive on the factory floors.
# OCBRITDA = Operating cost before royalties, interest, tax, depreciation and
amortisation
CAPEX INTENSITY OF
US $4.96/kg NdPr The Ngualla Project has the potential to have the lowest Capex
intensity per unit output of NdPr over its mine life compared to
other fully integrated development projects.
Peak Resources: Number 1 amongst its peers
For
per
sona
l use
onl
y

ASX Announcement 12 April 2017
4
ENABLING LOW CARBON TECHNOLOGIES
The BFS Highlights “Physicals drive economics” AND A TOTAL PRE-PRODUCTION CAPEX OF
US $356 million for Ngualla and the UK refinery combined. This has the
potential to be the lowest Capex among its peers for a fully
integrated producer. We highlight the fact that the BFS now
includes a third solvent extraction circuit which will improve
margins by separating cerium and lanthanum.
WITH A MINE LIFE OF
30 Years
based on an Ore Reserve of 18.5Mt grading 4.80% REO,
containing 887,000t REO, of which 92% is the highest Proved
JORC category (8% being Probable), with a favourable
mineralogy, easy to mine and able to be processed to a high
grade concentrate. This combination makes Ngualla one of the
best NdPr deposits worldwide.
We believe the three most important measures of the Ngualla Project are, in order:
1) Opex intensity per unit of NdPr output;
2) Capex intensity per unit of NdPr output; and
3) Total Capex (inclusive of producing fully separated rare earth oxides).
The Ngualla Project has the potential to be a world leading, fully integrated rare earth development
project based on each of these measures.
We believe, as a result of the low Opex position, the Ngualla Project is financially more robust and
will be able to handle periods of softness in rare earth prices. We see this as an important
distinguishing feature of the Ngualla. Based on our assumptions of expected pricing, as set out in
the BFS Executive Summary released together with this announcement, which are driven off
anticipated strong demand for e-mobility and low carbon technologies, Ngualla is predicted to
generate US$ 104 million dollars per annum in free cash flow (post tax and royalties) with an IRR
of 21% (post tax).
Peak Resources: Number 1 amongst its peers
For
per
sona
l use
onl
y
ASX Announcement 12 April 2017
5
ENABLING LOW CARBON TECHNOLOGIES
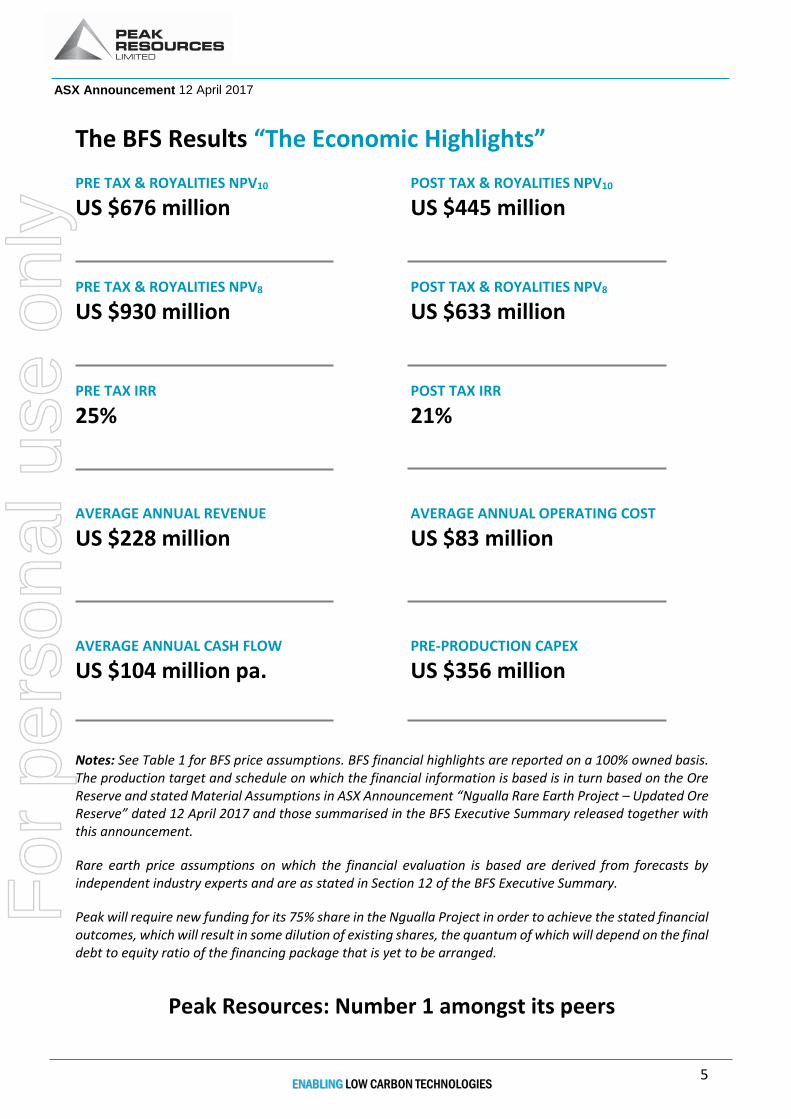
The BFS Results “The Economic Highlights”
PRE TAX & ROYALITIES NPV10 POST TAX & ROYALITIES NPV10
US $676 million US $445 million
PRE TAX & ROYALITIES NPV8 POST TAX & ROYALITIES NPV8
US $930 million US $633 million
PRE TAX IRR POST TAX IRR
25% 21%
AVERAGE ANNUAL REVENUE AVERAGE ANNUAL OPERATING COST
US $228 million US $83 million
AVERAGE ANNUAL CASH FLOW PRE-PRODUCTION CAPEX
US $104 million pa. US $356 million
Notes: See Table 1 for BFS price assumptions. BFS financial highlights are reported on a 100% owned basis. The production target and schedule on which the financial information is based is in turn based on the Ore Reserve and stated Material Assumptions in ASX Announcement “Ngualla Rare Earth Project – Updated Ore Reserve” dated 12 April 2017 and those summarised in the BFS Executive Summary released together with this announcement.
Rare earth price assumptions on which the financial evaluation is based are derived from forecasts by independent industry experts and are as stated in Section 12 of the BFS Executive Summary.
Peak will require new funding for its 75% share in the Ngualla Project in order to achieve the stated financial outcomes, which will result in some dilution of existing shares, the quantum of which will depend on the final debt to equity ratio of the financing package that is yet to be arranged.
Peak Resources: Number 1 amongst its peers
For
per
sona
l use
onl
y

ASX Announcement 12 April 2017
6
ENABLING LOW CARBON TECHNOLOGIES
Key Study Outcomes
Table 1: Key Study Outcomes. Note all costs are in US dollars unless otherwise denoted.
PRODUCTION ASSUMPTIONS
Life of Mine 30 Years
Average Life of Mine REO Grade 4.80%
Life of Mine Strip Ratio (Waste:Ore) 1.77
Average Mill Throughput 624,000 tpa
Average REO Mineral Concentrate Production 28,300 tpa
Average NdPr Mixed Oxide 2N Production 2,420 tpa
Average La Oxide Equivalent Production (final product: 6,940 tpa Carbonate) 3,650 tpa
Average Ce Oxide Equivalent Production (final product: 3,005 tpa Carbonate) 1,660 tpa
Average SEG and Mixed Heavy Oxide Equivalent (final product: 530 tpa Carbonate) 280 tpa
OPERATING COSTS
Average Operating Cost to Mine Gate US$ 46m p.a
Average Tees Valley Refinery Operating Cost to Final Product US$ 37m p.a
Total Consolidated Operating Cost to Final Product US$ 83 m p.a
Total Consolidated Operating Cost/kg
(NdPr Mixed Oxide 2N#)
US$ 34.20/kg
CAPITAL COSTS (including growth and contingency)
Ngualla (Mine and Process) US$ 52 million
Ngualla (Infrastructure) US$ 134 million
Tees Valley Refinery US$ 152 million
Owners Costs US $18 million
Total Capital Pre-Production US$ 356 million
Average Consolidated Sustaining Capital per annum US$ 5 million
FINANCIAL METRICS
Consolidated Total Revenue over life of mine US$ 6.76 billion
Consolidated Average Annual Revenue US$ 228 m p.a
Total Consolidated (Post Tax) Cash Generation over life of mine US$ 3.01 billion
Annual Average Consolidated (Post Tax) Cash flow US$ 104 m p.a
Average Annual EBITDA US$ 145 m p.a
NPV8 - Pre Tax and Royalties US$ 930 million
NPV8 - Post Tax and Royalties US$ 633 million
NPV10 - Pre Tax and Royalties US$ 676 million
NPV10 - Post Tax and Royalties US$ 445 million
IRR - Pre Tax and Royalties 25%
IRR - Post Tax and Royalties 21%
Operating Margin 64%
Payback Period (from start of Operations) 5 years
COMMODITY PRICE ASSUMPTIONS
Average LOM Product Prices:
– NdPr Mixed Oxide 2N Min 75% Nd2O3 US$ 85.00/kg
– Lanthanum rare earth oxide equivalent US$ 4.41/kg
– Cerium rare earth oxide equivalent US$ 2.25/kg
– SEG and Mixed Heavy oxide equivalent US$ 8.00/kg
Figures above are on a 100% Project basis (Peak holds 75%). #2N= 99% purity. Average annual statistics are at steady state, post ramp-up.
For
per
sona
l use
onl
y

ASX Announcement 12 April 2017
7
ENABLING LOW CARBON TECHNOLOGIES
Further details on project metrics and material assumptions are set out in the ASX Announcement
“Ngualla Rare Earth Project – Updated Ore Reserve” dated 12 April 2017 and those summarised in
the BFS Executive Summary released together with this announcement.
Leverage to Neodymium and Praseodymium price
As can be seen in the context of the three NdPr price sensitivity graphs in Figures 1 to 3 following,
the Ngualla Project is highly leveraged to the price of Neodymium and Praseodymium, the main
constituents of the high growth rare earth permanent magnet market driving e-mobility and other
low carbon technologies.
The Company has focused on the higher value and in demand magnet metals through a processing
technology that targets these metals, which are expected to generate 90% of the Ngualla Project’s
revenue.
Overall, we believe the outlook for demand for NdPr continues to be very positive. In 2016 the
majority of Chinese producers were unprofitable, suggesting that recent price levels may represent
a cyclical low. Furthermore, prices have already risen 9% this calendar year primarily driven by the
largest Chinese producer of NdPr implementing a 6% price increase in February 2017 (see Figure 4
showing recent positive price movements).
We believe we are seeing the green shoots of the resurgence of the rare earth market and look
forward to monitoring the effect of increasing levels of demand and positive actions in China to
reduce illegal production.
Figure 1: Pre Tax NPV10 vs NdPr Price
For
per
sona
l use
onl
y

ASX Announcement 12 April 2017
8
ENABLING LOW CARBON TECHNOLOGIES
Figure 2: Ngualla Project average life of mine post ramp-up free cash flow (post tax and royalties) vs NdPr price
Figure 3: Ngualla Project Pre Tax IRR vs NdPr price
F
or p
erso
nal u
se o
nly

ASX Announcement 12 April 2017
9
ENABLING LOW CARBON TECHNOLOGIES
Figure 4: Increasing NdPr Price Trend in 2017
Source: Asian Metal
For
per
sona
l use
onl
y

ASX Announcement 12 April 2017
10
ENABLING LOW CARBON TECHNOLOGIES
Next Steps
The completion of the BFS and the recent receipt of the Environmental Certificate for Ngualla are
important achievements in the development of the project. With both these key milestones now
complete the Company is able to ramp up its discussions with potential offtake, debt financiers
and strategic partners for the Ngualla Project with an aim to move into Front End Engineering and
Design once appropriate funding partner(s) is/are identified. The focus of discussions will be on
strategic partners, export credit agencies, trading houses and NdPr customers with a particular
focus on drive train manufacturers for e-mobility.
In parallel, the Company will move forward with an application for a mining license at Ngualla. It is
the Company’s aim to have the project ready for execution in time to be exposed to the predicted
increase in Neodymium and Praseodymium prices driven by e-mobility and low carbon
technologies.
For and on behalf of Peak Resources Limited. Darren Townsend Managing Director
For
per
sona
l use
onl
y

ASX Announcement 12 April 2017
11
ENABLING LOW CARBON TECHNOLOGIES
Compliance statements
Information and documentation which forms the basis of the BFS in relation to Mineral Resources
and Ore Reserves have previously been reported as detailed within the BFS Executive Summary
released together with this announcement. The Company confirms that it is not aware of any new
information or data that materially affects the information included in the relevant market
announcements and, in the case of the Company’s February 2016 Ngualla Mineral Resources and
the April 2017 Ngualla Ore Reserves that all material assumptions and technical parameters
underpinning the estimates in the relevant market announcement continue to apply and have not
materially changed. The Company confirms that the form and context in which the Competent
Person’s findings are presented have not been materially modified from the original market
announcements.
Cautionary statements and risk factors
The contents of this announcement reflect various technical and economic conditions at the time
of writing. Given the nature of the resources industry, these conditions can change significantly
over relatively short periods of time. Consequently, actual results may vary from those detailed in
this announcement.
Some statements in this announcement regarding estimates or future events are forward-looking
statements. They include indications of, and guidance on, future earnings, cash flow, costs and
financial performance. Forward-looking statements include, but are not limited to, statements
preceded by words such as “planned”, “expected”, “projected”, “estimated”, “may”, “scheduled”,
“intends”, “anticipates”, “believes”, “potential”, “predict”, “foresee”, “proposed”, “aim”, “target”,
“opportunity”, “could”, “nominal”, “conceptual” and similar expressions. Forward-looking
statements, opinions and estimates included in this announcement are based on assumptions and
contingencies which are subject to change without notice, as are statements about market and
industry trends, which are based on interpretations of current market conditions. Please also refer
to the additional sensitivity factors described in the Project Economics section of the attached
report.
Forward-looking statements are provided as a general guide only and should not be relied on as a
guarantee of future performance. Forward-looking statements may be affected by a range of
variables that could cause actual results to differ from estimated results, and may cause the
Company’s actual performance and financial results in future periods to materially differ from any
projections of future performance or results expressed or implied by such forward-looking
statements. So there can be no assurance that actual outcomes will not materially differ from these
forward-looking statements.
For
per
sona
l use
onl
y

ASX Announcement 12 April 2017
12
ENABLING LOW CARBON TECHNOLOGIES
These statements are subject to significant risks and uncertainties that include but are not limited
to those inherent in mine development and production, geological, mining, metallurgical and
processing technical problems, the inability to obtain and maintain mine licenses, permits and
other regulatory approvals required in connection with mining and processing operations,
competition for among other things, capital, acquisitions of reserves, undeveloped lands and
skilled personnel, incorrect assessments of the value of projects and acquisitions, changes in
commodity prices and exchange rate, currency and interest rate fluctuations and other adverse
economic conditions, the potential inability to market and sell products, various events which
could disrupt operations and/or the transportation of mineral products, including labour
stoppages and severe weather conditions, the demand for and availability of transportation
services, environmental, native title, heritage, taxation and other legal problems, the potential
inability to secure adequate financing and management's potential inability to anticipate and
manage the foregoing factors and risks. There can be no assurance that forward-looking
statements will prove to be correct.
Where the Company expresses or implies an expectation or belief as to future events or results,
such expectation or belief is expressed in good faith and on a reasonable basis. No representation
or warranty, express or implied, is made by the Company that the matters stated in this
announcement will in fact be achieved or prove to be correct.
Except for statutory liability which cannot be excluded, the Company, its officers, employees and
advisers expressly disclaim any responsibility for the accuracy or completeness of the material
contained in this announcement and exclude all liability whatsoever (including in negligence) for
any loss or damage which may be suffered by any person as a consequence of any information in
this announcement or any error or omission there from.
This announcement does not take into account the individual investment objectives, financial or
tax situation or particular needs of any person. It does not contain financial advice. You should
consider seeking independent legal, financial and taxation advice in relation to the contents of this
announcement.
Except as required by applicable law, the Company does not undertake any obligation to release
publicly any revisions to any forward-looking statement to reflect events or circumstances after
the date of this announcement, or to reflect the occurrence of unanticipated events, except as may
be required under applicable securities laws.
For
per
sona
l use
onl
y

ASX Announcement 12 April 2017
13
ENABLING LOW CARBON TECHNOLOGIES
Competent Person Statements
The information in this announcement that relates to Ore Reserve estimates was based on information compiled by Ryan Locke, a Principal Consultant with Orelogy Consulting Pty Ltd, Orelogy are an independent consultant to Peak Resources. Ryan Locke, who is a Member of the Australasian Institute of Mining and Metallurgy, has sufficient experience that is relevant to the style of mineralization and type of deposit under consideration and to the activity being undertaken to qualify as a competent Person as defined in the 2012 edition of the ‘Australasian Code for Reporting of Exploration Results, Mineral Resources and Ore Reserves’. Ryan Locke consents to the inclusion in this announcement of the matters based on his information in the form and context in which it appears.
The information in this announcement that relates to the Mineral Resource Estimates is based on work conducted by Rod Brown of SRK Consulting (Australasia) Pty Ltd, and the work conducted by Peak Resources, which SRK has reviewed. Rod Brown takes responsibility for the Mineral Resource Estimate. Rod Brown is a Member of The Australasian Institute of Mining and Metallurgy and has sufficient experience that is relevant to the style of mineralisation and type of deposit under consideration, and to the activities undertaken, to qualify as Competent Person in terms of the Australasian Code for the Reporting of Exploration Results, Mineral Resources and Ore Reserves (JORC Code, 2012 edition).Rod Brown consents to the inclusion of such information in this announcement in the form and context in which it appears.
The information in this announcement that relates to Exploration Results is based on information compiled and/or reviewed by David Hammond, who is a Member of The Australasian Institute of Mining and Metallurgy. David Hammond is the Technical Director of the Company. He has sufficient experience which is relevant to the style of mineralisation and type of deposit under consideration and the activity which he is undertaking to qualify as a Competent Person in terms of the 2012 Edition of the Australasian Code for the Reporting of Exploration Results, Mineral Resources and Ore Reserves. David Hammond consents to the inclusion in this announcement of the matters based on his information in the form and contest in which it appears.
The information in this announcement that relates to metallurgical test work results is based on information compiled and / or reviewed by Gavin Beer who is a Member of the Australasian Institute of Mining and Metallurgy and a chartered Professional. Gavin Beer is a Consultant Metallurgist to the Company and has sufficient experience relevant to the activity which he is undertaking to be recognized as competent to compile and report such information. Gavin Beer consents to the inclusion in this announcement of the matters based on his information in the form and context in which it appears.
The information in this announcement that relates to infrastructure, project execution and cost estimating is based on information compiled and/or reviewed by Lucas Stanfield who is a Member of the Australasian Institute of Mining and Metallurgy. Lucas Stanfield is the General Manager - Development for Peak Resources Limited and is a Mining Engineer with sufficient experience relevant to the activity which he is undertaking to be recognized as competent to compile and report such information. Lucas Stanfield consents to the inclusion in this announcement of the matters based on his information in the form and context in which it appears.
For
per
sona
l use
onl
y

Bankable Feasibility Study
Ngualla Rare Earth Project
is the numberyou need to remember
April 2017
UNDERSTOOD - DE-RISKED - COMPETITIVE - MANAGEABLE - READY TO BE DELIVERED!
Executive Summary
For
per
sona
l use
onl
y

1PEAK RESOURCES LIMITED BANKABLE FEASIBILITY STUDYENABLING LOW CARBON TECHNOLOGIES
1. INTRODUCTION 02
2. STATEMENT FROM THE MANAGING DIRECTOR 03
3. BFS HIGHLIGHTS 04
4. COMPANY PROFILE 08
5. TIER ONE CONSULTANTS 09
6. MINERAL RESOURCES 10
7. ORE RESERVE & MINING 14
8. PILOT PLANTS 18
9. OVERVIEW: NGUALLA OPERATIONS 20
10. ENVIRONMENTAL & SOCIAL 23
11. OVERVIEW: TEES VALLEY OPERATIONS 25
12. MARKETING 29
13. CAPITAL COST SUMMARY 40
14. OPERATING COST SUMMARY 42
15. PROJECT ECONOMICS 45
16. OVERVIEW OF THE PEAK TEAM 50
17. KEY OPPORTUNITIES 52
18. STRATEGIC PARTNERS 55
19. COMPETENT PERSONS' STATEMENTS 56
APPENDIX 57
CONTENTS
For
per
sona
l use
onl
y

2 BANKABLE FEASIBILITY STUDY PEAK RESOURCES LIMITED ENABLING LOW CARBON TECHNOLOGIES
90% NdPr Mixed Oxide
RELATIVE VALUE CONTRIBUTORS
1% Mid-Heavy Carbonate
7% La Carbonate
2% Ce Carbonate
1. INTRODUCTION
Peak Resources Limited (‘Peak’ or the ‘Company’) has completed a Bankable Feasibility Study ('BFS' or 'Study') with Tier One Consultants led by Amec Foster Wheeler for its 75% owned Ngualla Project. The Study components consist of a mine and a multi-stage processing plant on-site at Ngualla in Tanzania and a rare earth refinery in the Tees Valley, United Kingdom.
Peak, together with its parters Appian Natural Resources Fund ('Appian') and International Finance Corporation ('IFC'), is developing Ngualla to be a low cost next generation rare earth project with a product suite that is strongly aligned to the high value and expanding magnet metal market. With this distinctly different development approach backed by the advantages of a large high quality deposit, a bespoke metallurgical process and real world, rare earth experience, the Company is well positioned for the predicted surge in demand for magnet metals from the electrification of automobiles and the green technology sectors.
Peak has completed a comprehensive BFS in partnership with Tier One international consultants that is backed by extensive pilot plant test work, detailed engineering design and cost studies and a high confidence Mineral Resource estimate.
The focus of the Study has been to evaluate the feasibility of the development of a long life open pit mine and associated multistage processing plant on site at Ngualla in Tanzania. A base case of a subsequent rare earth refinery located in Tees Valley in the United Kingdom is presented to produce approximately 2,420 tonnes per annum of >99% purity Neodymium-Praseodymium Oxide (NdPr), plus additional refined rare earth co-products. Alternative marketing strategies being investigated by the Company also include toll treating of the processed rare earth product from Ngualla at an existing refinery or direct sale of the product.
The production rate is based on the Ore Reserve (ASX announcement dated 12th April 2017 “Ngualla Rare Earth Project - Updated Ore Reserve”) released simultaneously with this report and which, together with this report, summarises the Material Assumptions. The Ore Reserve is based on the 2016 Weathered Bastnaesite Zone Mineral Resource estimate at +1% rare earth oxide cut-off grade (ASX announcement 'Higher grade Ngualla Mineral Resource contains nearly 1 million tonnes rare earth oxide' of 22nd February 2016) and the mining,
processing and economic assumptions contained in the following sections of this report. 91% of the Mineral Resource estimate on which the Ore Reserve is based is classified in the Measured JORC category and 9% in the Indicated. No Inferred material is included in the Ore Reserve.
Figure 1.1: Relative value* contributors by product type and constituent REO’s.
*Relative value of contained REO equivalent product mix based on prices assumed in the BFS for individual rare earth oxides.
For
per
sona
l use
onl
y

The Asset The Market The Team Peak Resources - more than the sum of its parts and the first choice for investment in the rare earth space.
3PEAK RESOURCES LIMITED BANKABLE FEASIBILITY STUDYENABLING LOW CARBON TECHNOLOGIES
2. MANAGING DIRECTOR’S STATEMENT
STATEMENT FROM THE MANAGING DIRECTOR DARREN TOWNSEND, B.ENG (MINING-HONS) EMBA 11th April 2017 It is with a great deal of pride that the Peak team delivers the BFS for the Ngualla Project. This is a milestone reached only by a select few rare earth companies and is the culmination of many years of hard work. Investors can take comfort in the tier one approach Peak and its partners have used in completing the Study. It is our understanding that we are also the only company outside of China that has used experienced rare earth industry operational and marketing executives to feed their expertise into a BFS back stopped by extensive pilot planting on the whole production process.
When you combine the above with the Study being led by engineering consultants of the quality of Amec Foster Wheeler, all stakeholders should have comfort on the deliverability and operability of the planned mining, processing and refining solution that the Ngualla Project represents.
You will note as you read on in this document how the superior physical attributes of the Ngualla orebody combined with the unique advantages of the Tees Valley refinery location positions Peak to be one of the world’s lowest operating and capital cost rare earth developers.
The Peak team has delivered on the one thing it can control – operating cost. We have further reduced our annual operating cost from US$118 million per annum, as stated in the Preliminary Feasibility Study dated March 2014, to US$ 97 million per annum, in the Project Update dated March 2016 an now to US$83 million per annum as set out in the BFS. This 30% or US$35 million per annum reduction is outstanding and makes the Ngualla Project one of the world’s lowest cost rare earth projects.
With an operating cost of US$34.20/kg NdPr oxide this means if we were to equity finance the project we could produce in excess of US $ 20 million per annum margin on the NdPr oxide product alone at today’s low spot prices.
We believe that the information set out above makes Peak the go to investment for exposure to the exciting rare earth magnet market that is underpinned by high growth applications such as e-mobility and low carbon technologies.
For
per
sona
l use
onl
y

4 BANKABLE FEASIBILITY STUDY PEAK RESOURCES LIMITED ENABLING LOW CARBON TECHNOLOGIES
Peak’s Ngualla Project is one of the highest grade undeveloped Neodymium/Praseodymium (NdPr) deposits in the world. With its 30 year mine life and simple open cut, low strip ratio mining and bastnaesite mineralogy it is blessed with significant natural advantages. Peak has demonstrated through extensive pilot planting a flow sheet that is able to reject 70% of the loss making cerium oxide (which makes up 48% of the total rare earths to be refined) prior to the addition of any expensive chemical reagents into our process. As a result this means 90% of Peak's predicted future revenue is to be from NdPr, which is perfectly aligned to the highest value component of the rare earth market that is being driven by demand from e-mobility and low carbon technologies.
To put the results from the BFS into context it is important for us to show you how Ngualla compares with other projects. A benchmarking exercise has been completed using data from Adamas Intelligence.Initially we started with 58 global junior rare earth projects and this number was reduced to 29 projects due to availability of quality data to be able to perform a detailed, comprehensive and professional comparison.
The following methodology has been applied. The white indicator on the following dials show for the specific KPI the closest perceived competitor of Peak Resources. This competitor is a light rare earth project, has low or moderate radioactivity levels in its ore body, undertakes full separation to produce separated oxides and has either a project status of Preliminary-Feasibility (‘PFS’), Definitive Feasibility Study (‘DFS’) or Bankable Feasibility Study (‘BFS’).
The ghosted white indicator shows all the projects which are not perceived as a direct competitor due to disqualifying elements such as:
• Projects only at PEA (Preliminary Economic Assessment or Scoping) stage or earlier have immature cost data and information which is not comparable with the quality of a PFS or BFS project status.
• Heavy rare earth projects which are by nature not comparable with light rare earth projects.
• Projects with high radioactivity levels in their mineralisation
• Low margin projects that aim to sell a low value intermediate or mixed rare earth product as opposed to a final purified product that is readily tradeable in the world’s rare earth markets
# Professor Dudley Kingsnorth (IMCOA) 2016
Permanent magnets made up 79% of the rare earth market by value in 2015#. Of this, the two key rare earths Neodymium and Praseodymium made up 85%.
3. BFS HIGHLIGHTSF
or p
erso
nal u
se o
nly

5PEAK RESOURCES LIMITED BANKABLE FEASIBILITY STUDYENABLING LOW CARBON TECHNOLOGIES
RESULTING IN A TOTAL LIFE OF PROJECT OPEX INTENSITY (US$/KG NdPr Oxide) OF
US$ 34.20#/kg NdPr*
is the breakeven point for positive cash flow. Considering today's (8 April 2017) spot pricing FOB China of US$42.55/kg and understanding the projections and the drivers for the market outlook of increased demand for NdPr, Peak aims to take advantage of the expected increase in pricing as new permanent magnet technology applications arrive on the factory floors.
# OCBRITDA = Operating cost before royalties, interest, tax, depreciation and amortisation * NdPr = Nd2O3 /Pr6O11 Mixed Oxide 2N – min 75% Nd2O3
CAPEX INTENSITY OF
US$ 4.96/kg NdPrThe Ngualla Project has the potential to have the lowest Capex intensity per unit output of NdPr over Life of Mine compared to other fully integrated development projects.
AND A TOTAL PRE-PRODUCTION CAPEX OF
US$ 356 million for Ngualla and Tees Valley refinery combined. This has the potential to be the lowest Capex among its peers for a fully integrated producer. We highlight the fact that the BFS now includes a third solvent extraction circuit which will improve margins by separating cerium and lanthanum.
3. CAPEX (US M)2. CAPEX INTENSITY
(USD/KG NdPr Oxide over life of mine) 4. LIFE OF MINE IN YEARS1. OPEX INTENSITY (USD/KG NdPr Oxide)
1400200
400
600 800
1200
356
34
3
316
34.2015
35
55 75
95
115
6
16
13
3 4
302
5
10 15
25
444
4.96
45
3
13
65
30
1325
10
230
2
413
3
7
3. BFS HIGHLIGHTS (continued)
3. CAPEX (US M)2. CAPEX INTENSITY
(USD/KG NdPr Oxide over life of mine) 4. LIFE OF MINE IN YEARS1. OPEX INTENSITY (USD/KG NdPr Oxide)
1400200
400
600 800
1200
356
34
3
316
34.2015
35
55 75
95
115
6
16
13
3 4
302
5
10 15
25
4.96
45
3
13
65
30
1325
10
230
2
413
3
7
3. CAPEX (US M)2. CAPEX INTENSITY
(USD/KG NdPr Oxide over life of mine) 4. LIFE OF MINE IN YEARS1. OPEX INTENSITY (USD/KG NdPr Oxide)
1400200
400
600 800
1200
356
34
3
316161616161616161616161616161616161616161616161616161616161616161616
34.2015
35
55 75
95
115
6
16
13
3 4
302
5
10 15
25
4.96
45
3
13
65
30
1325
10
230
2
413
3
7
For
per
sona
l use
onl
y

6 BANKABLE FEASIBILITY STUDY PEAK RESOURCES LIMITED ENABLING LOW CARBON TECHNOLOGIES
3. BFS HIGHLIGHTS(continued)
‘PHYSICALS DRIVE ECONOMICS’ PEAK RESOURCES: NUMBER 1 AMONG ITS PEERS
WITH A MINE LIFE OF
30 Years based on an Ore Reserve of 18.5Mt grading 4.80% REO, containing 887,000t REO, ofwhich 92% is the highest Proved JORC category (8% being Probable), with a favourablemineralogy, easy to mine and able to be processed to a high grade concentrate. Thiscombination makes Ngualla one of the best NdPr deposits worldwide.
We believe the three most important measures of the Ngualla Project are, in order:
1) Opex intensity per unit of NdPr output;2) Capex intensity per unit of NdPr output; and3) Total Capex (inclusive of producing fully separated rare earth oxides).
The Ngualla Project has the potential to be a world leading, fully integrated rare earth development project based on each of these measures.
We believe, as a result of the low Opex position, the Ngualla Project is financially more robust and will be able to handle periods of softness in rare earth prices. We see this as an important distinguishing feature of the Ngualla. Based on our assumptions of expected pricing, as set out in this BFS Executive Summary, which are driven off anticipated strong demand for e-mobility and low carbon technologies, Ngualla is predicted to generate US$ 104 million dollars per annum in free cash flow (post tax and royalties) with an IRR of 21% (post tax).
Compared to other rare earth projects, Ngualla has lower capital investment requirements and, thanks to a unique combination of favourable physical attributes and the improved processing route selected, enviably low operating costs that will make it cost competitive with Chinese production.
Ngualla's favourable project economics are in part driven by the high PrNd grade and favourable mineralogy of the rare earth deposit itself, combined with the development of an extraction and purification process that targets the higher value rare earths. This combined with the location of the refinery in proximity to the source of inexpensive reagents and utilities helps drive low Opex.
With the alignment of products and value drivers to the high demand magnet metal market, the project is also in a favourable position in terms of marketing and future demand for its products.
3. CAPEX (US M)2. CAPEX INTENSITY
(USD/KG NdPr Oxide over life of mine) 4. LIFE OF MINE IN YEARS1. OPEX INTENSITY (USD/KG NdPr Oxide)
1400200
400
600 800
1200
356
34
3
316
34.2015
35
55 75
95
115
6
16
13
3 4
302
5
10 15
25
4.96
45
3
13
65
30
1325
10
230
2
413
3
7
For
per
sona
l use
onl
y
7PEAK RESOURCES LIMITED BANKABLE FEASIBILITY STUDYENABLING LOW CARBON TECHNOLOGIES
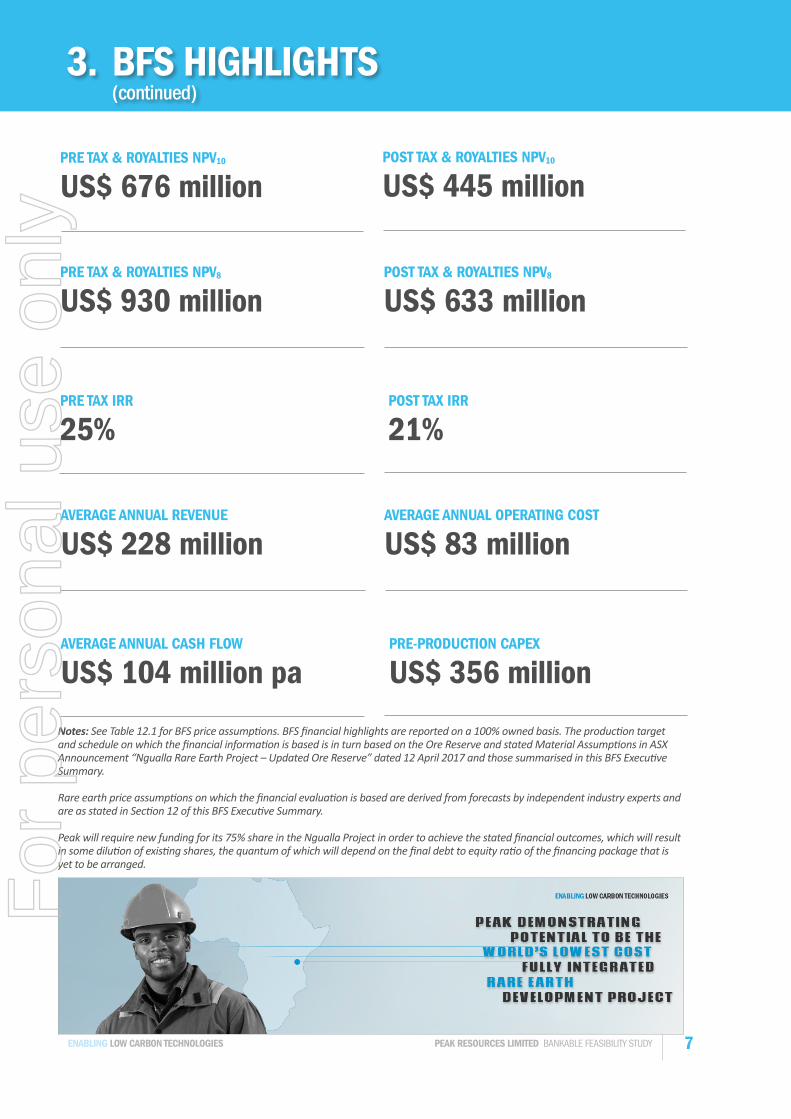
3. BFS HIGHLIGHTS (continued)
PRE TAX & ROYALTIES NPV10
US$ 676 million
POST TAX & ROYALTIES NPV10
US$ 445 million
PRE TAX IRR
25%
PRE TAX & ROYALTIES NPV8
US$ 930 million
POST TAX & ROYALTIES NPV8
US$ 633 million
POST TAX IRR
21%
Notes: See Table 12.1 for BFS price assumptions. BFS financial highlights are reported on a 100% owned basis. The production target and schedule on which the financial information is based is in turn based on the Ore Reserve and stated Material Assumptions in ASX Announcement “Ngualla Rare Earth Project – Updated Ore Reserve” dated 12 April 2017 and those summarised in this BFS Executive Summary.
Rare earth price assumptions on which the financial evaluation is based are derived from forecasts by independent industry experts and are as stated in Section 12 of this BFS Executive Summary.
Peak will require new funding for its 75% share in the Ngualla Project in order to achieve the stated financial outcomes, which will result in some dilution of existing shares, the quantum of which will depend on the final debt to equity ratio of the financing package that is yet to be arranged.
AVERAGE ANNUAL CASH FLOW
US$ 104 million pa
AVERAGE ANNUAL REVENUE
US$ 228 million
AVERAGE ANNUAL OPERATING COST
US$ 83 million
PRE-PRODUCTION CAPEX
US$ 356 million
For
per
sona
l use
onl
y

8 BANKABLE FEASIBILITY STUDY PEAK RESOURCES LIMITED ENABLING LOW CARBON TECHNOLOGIES
4. COMPANY PROFILE
Peak Resources is focused on delivering an integrated rare earth project The Company’s 75%-owned project combines mining and multi-stage processing at Ngualla in Tanzania, with downstream refining at a solvent extraction separation plant in the UK to produce a range of rare earth products. Approximately 90% of the value of the final product is associated with a high-purity neodymium and praseodymium oxide.
Ngualla is one of the world’s largest NdPr deposits The Ngualla deposit is located in Tanzania, 147 kilometres from the city of Mbeya. It is one of the world’s largestNdPr deposits, with total mineral resource containing 4.6Mt of REO. The deposit is host to a thick blanket of weathered, high-grade mineralisation from surface. The Weathered Bastnaesite Zone Mineral Resource estimate at a cut-off of 1.0% REO is 21.3Mt grading 4.75% REO, containing 1,010,000t REO, of which 89% is in the Measured category.
Tanzanian operations to produce 28,300tpa of beneficiated REO mineral concentrate grading 45% REOThe Company plans to process 624,000tpa of dry ore through a multi-stage flotation-based beneficiation process to produce 28,300tpa of high-value, 45% REO concentrate containing 12,700tpa of REO.
UK-based rare earth refinery to produce final productsHaving investigated a number of different flowsheets and following positive trials on actual mineralisation from
Ngualla, the Project will use an alkali roast processing route to produce a rare earth solution feed to a solvent extraction-based separation process. In this, the material is firstly roasted with alkali, then washed and filtered before being leached using a low-strength hydrochloric acid, a process that selectively targets Nd and Pr. The project benefits from the low rate of acid consumption, owing to the absence of acid consuming carbonate and phosphate in the mineralisation and the relatively low levels of iron in the concentrate. Final products from the project are planned to be:
• 2,420 tonnes of neodymium and praseodymium rare earth oxide (2N min 75% Nd2O3),
• 530 tonnes of mixed SEG and Mixed Heavy rare earth carbonate,
• 3,005 tonnes of cerium carbonate and 6,940 tonnes per annum lanthanum carbonate.
Neodymium and praseodymium exposed to high-growth permanent magnet demand Neodymium and praseodymium are used in combination to create high-powered lightweight NdFeB permanent magnets. Prices of rare earths, including those for NdPr oxides, peaked in 2011 and have since fallen back to unsustainable levels.
Owing to the increased use of high-power magnets in electrical motors and generators, particularly in electric cars and bikes, the outlook for demand for NdPr is very positive, suggesting that current price levels should represent a cyclical low.
UK: Rare Earth Refinery
Australia: Peak Headquarters
Tanzania: Mine and Multi-Stage
Processing Plant
For
per
sona
l use
onl
y

9PEAK RESOURCES LIMITED BANKABLE FEASIBILITY STUDYENABLING LOW CARBON TECHNOLOGIES
5. TIER ONE CONSULTANTS
Peak has completed this Study using Tier One international consulting firms in partnership with its own in house team of industry experts experienced in real world rare earth operations and marketing as well as specialised metallurgical, geological, financial modelling and engineering studies.
The team is pleased to deliver a comprehensive, high quality and accurate study that is also practically deliverable and operable.
Ngualla is de-risked and ready to be delivered.
CONSULTANT AREA OF EXPERTISE
Amec Foster Wheeler Study Lead Engineer, UK Refinery Engineering
MDM Engineering Ngualla Site Infrastructure and Plant Engineering
Knight Piésold Tailings, Geotechnical and Water Management
Golder Associates Ngualla Open Pit Geotechnical and Hydrological Studies
SRK Consulting, Australia Mineral Resource Estimation
SGS, Perth Beneficiation Pilot Plant and Sample Analyses
Orelogy Consulting Ngualla Ore Reserve and Mining Studies
COWI Tanzania Ngualla Access Road Engineering
ANSTO Minerals Leach Recovery and Separation Pilot Plants
ALS Metallurgy Beneficiation Pilot Plants and Mineralogy
Nagrom Metallurgical Process Development
Independent Metallurgical Operations (IMO) Benefication Process Development
Jenike and Johanson Materials Handling
Align Environment and Risk Management Environmental and Social Studies, Tanzania
Paulsam Geo-Engineering Environmental Certificate Studies, Tanzania
WYG Environmental Studies and Permitting, UK
Dr Wally Witt Geology and Mineralogy
Dr Roger Townend and Associates Mineralogy
Deloitte Accounting and Location Studies
Steinepreis Paganin Corporate and Legal
Clyde and Co, Tanzania Corporate and Legal, Tanzania
Table 5.1 List of BFS consultants and areas of expertise
For
per
sona
l use
onl
y

10 BANKABLE FEASIBILITY STUDY PEAK RESOURCES LIMITED ENABLING LOW CARBON TECHNOLOGIES
6.1 WEATHERED BASTNAESITE ZONE MINERAL RESOURCE ESTIMATE
Included in the Total All Ngualla Mineral Resource estimate is an important high grade subset, the Weathered Bastnaesite Zone Mineral Resource, a particularly mineralogically favourable component of the greater deposit, which is targeted for initial development. The rare earth component of the Weathered Bastnaesite Zone Mineral Resource estimate is the basis of this BFS.
At a 1% REO lower grade cut-off the Mineral Resource estimate for the Weathered Bastnaesite Zone is:
The rare earth Mineral Resource estimate for Ngualla was reported in accordance with the JORC 2012 Code and Guidelines by independent resource consultants SRK Consulting (Australasia) Pty Ltd (SRK) in February 2016. It was re-stated in March 2017, also by SRK, to report barite (barium sulphate, BaSO4) with no change to the rare earth Mineral Resource estimate or estimation methodology. The BFS does not contemplate theproduction of barite.
(see Table 6.1 and Table 1 in the Appendix for JORC category classification and individual rare earth distributions).
The +1% REO Mineral Resource estimate for the Weathered Bastnaesite Zone is high confidence, with 98% classified in the JORC Measured or Indicated categories, and the majority (89%) being Measured (see Table 6.1). The Ore Reserve and production schedule for the Study is based on the Measured and Indicated portions only of the +1% REO Weathered Bastnaesite Zone Mineral Resource estimate.
Table 6.1: Mineral Resource estimate summary – Weathered Bastnaesite Zone +1% REO*
Lower cut-off grade
JORC Resource Category
Tonnage (Mt)
REO (%)
Contained REO tonnes(‘000)
BaSO4 (%)
1% REO
Measured 18.9 4.75 900 37.8
Indicated 1.9 4.85 90 38.3
Inferred 0.5 4.43 20 31.5
Total 21.3 4.75 1,010 37.7
* REO = total rare earth oxides including yttrium. The Weathered Bastnaesite Zone Mineral Resource >=1% REO is contained withinand is a subset of the total All Resources Ngualla Mineral Resources +1% REO. See Table 1 in the Appendix for relative distributionsof individual rare earths as a proportion of total REO. Figures may not sum due to rounding. Barite grade is derived fromgeochemical assays for barium and the assumption, supported by extensive mineralogical studies, that barium is present as barite.
21.3 million tonnes at 4.75% REO and 37.7% barite, for 1,010,000 tonnes of contained REO and 8.03 million tonnes of contained barite
6. MINERAL RESOURCES F
or p
erso
nal u
se o
nly

11PEAK RESOURCES LIMITED BANKABLE FEASIBILITY STUDYENABLING LOW CARBON TECHNOLOGIES
6. MINERAL RESOURCES (continued)
Figure 6.1: Plan and section of Ngualla Mineral Resource block model >1% REO across the Bastnaesite Zone showing a thick blanket of high grade mineralisation from surface.
The Mineral Resource estimation process and estimate for the Weathered Bastnaesite Zone subset and the Total All Ngualla Mineral Resource is reported in ASX announcement titled “Higher grade Ngualla Mineral Resource contains nearly 1 million tonnes rare earth oxide” of 22 February 2016. Barite was added in a revision reported in ASX announcement dated 2nd March 2017 and titled “Ngualla Mineral Resource
estimate re-stated to include barite”, with no change to the rare earth estimates or estimation methodology.
As at the date of this report there has been no change to the Mineral Resource estimates since these announcements.
For
per
sona
l use
onl
y

12 BANKABLE FEASIBILITY STUDY PEAK RESOURCES LIMITED ENABLING LOW CARBON TECHNOLOGIES
6.2 TOTAL ALL NGUALLA MINERAL RESOURCE ESTIMATE
The Weathered Bastnaesite Zone Mineral Resource estimate reported above is included within and is a subset of the Total All Mineral Resource for the Ngualla Project, which at a 1% REO lower grade cut-off is:
(See Table 6.2 for JORC category classification and Table 2 in the Appendix for individual rare earth distributions).
The Mineral Resource estimation process is described in the ASX Announcements stated. As at the date of this report there has been no change to the Mineral Resource estimates since these announcements.
Metallurgical test work has shown that rare earth mineralisation outside the Weathered Bastnaesite Zone may be processed using other conventional beneficiation and leach recovery processes. The long mine life supported by the Weathered Bastnaesite Zone provides the Company with the opportunity and time to optimise these processes, which could be brought in at a later stage in the life of the operation.
Ngualla is not only an extremely large rare earth deposit but it is also of superior quality as a result of the high rare earth grades, outcropping mineralisation with a morphology that is beneficial to mining, a mineralogy that is favourable to processing, low levels of uranium and thorium and a high proportion of the more valuable rare earths neodymium and praseodymium.
214.4 million tonnes at 2.15% REO and 16.6% barite, for 4,620,000 tonnes of contained REO and 35.6 million tonnes of contained barite
Barite is included in the Mineral Resource estimates as preliminary studies have suggested that there may be some future potential to produce barite as a by-product. A relatively pure barite stream reports to one of the rare earth waste streams during rare earth production. Further work is required to evaluate the economic potential of barite production and at present barite remains a potential future upside opportunity for the project.
Definition and Advantages of the Weathered Bastnaesite Zone MineralisationThe Weathered Bastnaesite Zone Mineral Resource is defined as weathered or colluvial rare earth mineralisation containing less than 10% calcium and very low phosphorous of less than 0.3%. This higher grade mineralisation occurs from surface and extend as a thick blanket to depths of up to 140m above an undulating karstic surface.
Rare earths are contained within the fluorocarbonate mineral bastnaesite within a relatively soft barite and iron oxide-rich host rock with some quartz. Weathering processes have concentrated the rare earths and removed acid-consuming carbonate minerals. Phosphate minerals, which can also be disadvantageous in processing, are naturally absent. The mineralisation contains very low levels of uranium (15ppm) and thorium (54ppm) compared to other large rare earth deposits.
6. MINERAL RESOURCES (continued)
This combination of fundamental mineralogical characteristics distinguishes Ngualla from other projects and underpins the low capital and operating costs outlined in the following sections of this report.F
or p
erso
nal u
se o
nly

13PEAK RESOURCES LIMITED BANKABLE FEASIBILITY STUDYENABLING LOW CARBON TECHNOLOGIES
Table 6.2: Mineral Resource estimate summary - Total All Ngualla Mineral Resource estimate +1% REO*
Lower cut-off grade
JORC Resource Category
Tonnage (Mt)
REO (%)
Contained REO tonnes(‘000)
BaSO4 (%)
1% REO
Measured 86.1 2.61 2,250 20.2
Indicated 112.6 1.81 2,040 13.8
Inferred 15.7 2.15 340 17.6
Total 214.4 2.15 4,620 16.6
*REO = total rare earth oxides including yttrium. The weathered Bastnaesite Zone Mineral Resource +1% REO is contained within and is a subset of the total All Resources Ngualla Mineral Resources +1% REO. See Table 2 in the Appendix for relative distributions of individual rare earths as a proportion of total REO. Figures may not sum due to rounding. Barite grade is derived from geochemical assays for barium and the assumption, supported by extensive mineralogical studies, that barium is present as barite.
6. MINERAL RESOURCES (continued)
For
per
sona
l use
onl
y

14 BANKABLE FEASIBILITY STUDY PEAK RESOURCES LIMITED ENABLING LOW CARBON TECHNOLOGIES
7. ORE RESERVES & MINING
Mining studies indicate the viability of a modest sized but long life open pit operation with a low Life of Mine (LOM) waste strip ratio of 1.77, which at the proposed production rate can provide sufficient feed for an initial project life of 30 years based solely on the Weathered Bastnaesite Zone portion of the greater Ngualla deposit.
Orelogy Consulting Pty Ltd based in Perth, Western Australia, have undertaken the previous mining studies and Ore Reserve estimate on Ngualla and consequently Peak commissioned them to complete the mining component of the Study and Ore Reserve estimate. As the mineralisation is weathered and at surface, mining will predominantly (70%) be free dig requiring minimal blasting and with low Ore to waste stripping ratios.
OPEN PIT MINE LIFE OF 30 YEARS AT A LOW STRIP OF 1.77
ORE RESERVE OF 18.5 MILLION TONNES AT 4.80% REO
LOW AVERAGE TOTAL MINING RATE OF 1.7MT PER YEAR
Through the optimisation and scheduling process the mine will also produce higher grade mill feed with a higher proportion of neodymium and praseodymium in the earlier years of production.
The scope of work that formed the basis of miningcomponent of the BFS comprised the following:• Open Pit Optimisation • Mine design • Mining cost estimation • Mining equipment and personnel requirements
For
per
sona
l use
onl
y

15PEAK RESOURCES LIMITED BANKABLE FEASIBILITY STUDYENABLING LOW CARBON TECHNOLOGIES
7. ORE RESERVES & MINING (continued)
7.1 MINING LOSSESMining losses and dilution are expected to be minimal due to the thick blanket morphology of the deposit and the use of small mining equipment operating at a relatively low mining rate averaging less than 1.7Mt total material movement per annum over the life of mine. Total mining losses comprise just 6% of the total Mineral Resource available (Measured + Indicated categories of the +1% REO Weathered Bastnaesite Zone).
7.2 OPEN PIT OPTIMISATIONThe pit optimisation was undertaken using GEMCOM Whittle 4X software utilising the February2016 Ngualla Mineral Resource model completed by SRK Consultants Pty Ltd. Table 7.1 provides a summary of the optimisation wall slope parameters used for this Study.
Table 7.1: Optimisation wall slope parameters
LocationFace
HeightBatter Angle
Berm Width
Catch Berm Width
Catch Berm Increment
Overall Slope Angle
(m) (°) (m) (m) (m vert) (°)
Oxide 5.0 50 6.5 15 20 25
Oxide / Fresh 10.0 50 6.5 15 20 34
Fresh 10.0 75 8.0 15 40 43
The overall slope includes an allowance for a 15m wide catch berm every 20 vertical metres in oxide material and the oxide / fresh transition zone. This results in the very shallow 25° slope applied in the oxide and 34° in the oxide / fresh zone. A 23m wide ramp has been incorporated into the design suitable for a dual lane ramp based on the 65t dump truck selected.
ASX Announcement "Ngualla Rare Earth Project - UpdateOre Reserve" of 12 April 2017 summarises the materialassumptions used for the Ore Reserve estimation, whichcontinue to apply.
Associated operating cost parameters for mining, processing, and selling can be found in Section 14. The individual rare earth oxide grades, recoveries and prices were used in preference to using an average REO grade, average total recovery and basket price. This level of detail maximises total returns by allowing the optimiser and subsequent mine schedule to focus early production on the highest grade areas of Ngualla’s main value drivers of neodymium and praseodymium.
Only material from the Weathered Bastnaesite Zone Mineral Resource estimate with a REO grade above 1% was used in the optimisation. Of this material 89% is in the Measured JORC category and 9% is Indicated. The Inferred portion of the Mineral Resource was excluded from the optimisation process.
7.3 ORE RESERVEAn optimal shell was selected as the basis for the open pit mine design and subsequent LOM schedule, which is to be mined by 4 initial stages followed by the ultimate pit design. In line with previous studies, it is assumed mining is via two successive 2.5 metres mining flitches. The geotechnical parameters as defined in Table 7.1 above have been utilised in the design.
The location of the ultimate pit and the interim pitdesigns are shown in Figure 7.1.
For
per
sona
l use
onl
y

16 BANKABLE FEASIBILITY STUDY PEAK RESOURCES LIMITED ENABLING LOW CARBON TECHNOLOGIES
Table 7.3: Life of Mine (LOM) Material Movement and Plant Throughput
TotalLOM
Pre-strip
Year 1
Year 2
Year 3
Year 4-5
Year 6-10
Year 11-20
Year 21-31
Total (Mt) 51.1 0.7 2.7 2.8 2.5 4.4 12.9 16.3 8.9
Waste (Mt) 32.7 0.7 1.0 1.0 1.3 2.4 10.0 11.0 5.1
Ore (Mt) 18.5 0.0 1.6 1.7 1.3 2.0 2.9 5.2 3.8
Strip Ratio (WT:OT) 1.77 N/A 0.64 0.60 1.03 1.19 3.47 2.11 1.37
Direct Ore Feed to Mill (Mt) 13.5 0.0 0.3 0.5 0.5 1.1 2.1 5.2 3.8
Ore to Stockpile (Mt) 4.9 0.0 1.3 1.2 0.7 0.9 0.8 0.0 0.0
Ore Feed from Stockpile (Mt) 4.9 0.0 0.0 0.0 0.0 0.0 0.8 1.3 2.7
Total Ore Feed (Mt) 18.5 0.0 0.4 0.5 0.5 1.1 2.9 6.5 6.5
REO grade (%) through Mill 4.80 0.00 5.01 5.17 5.58 5.63 4.97 4.68 4.61
The ultimate design contains the following Ore Reserve:• Plant Feed of 18.5 million tonnes at 4.80% REO
comprising 17.0 million tonnes at 4.78% REO Proved Reserve and 1.5 million tonnes at 5.10% REO Probable Reserve category (see Table 7.2).
• The average LOM strip ratio is 1.77.
• Provides for 30 years of mill feed at a production rate output of approximately 2,420 tonnes per annum of NdPr oxide.
To further enhance the mining returns in the first years, and as project economics are not sensitive to total mining costs, the slightly lower value (lower grade) ore >1% REO is mined selectively to stockpile for later processing to allow access to higher value material earlier in the processing schedule. This can be seen in the mine schedule shown in Table 7.3, with the stockpiled material shown to be processed from Year 7 onwards.
Table 7.2: Ngualla Project Ore Reserve estimate
ClassificationOre
Tonnes (Mt)
REO % Contained REO tonnes
Proved 17.0 4.78 813,000
Probable 1.5 5.10 74,000
Total 18.5 4.80 887,000
7. ORE RESERVES & MINING (continued)
See Table 7.4 for indicative REO breakdown
Figure 7.1 Staged mine design
For
per
sona
l use
onl
y

17PEAK RESOURCES LIMITED BANKABLE FEASIBILITY STUDYENABLING LOW CARBON TECHNOLOGIES
7. ORE RESERVES & MINING (continued)
Figure 7.2: Perspective view of staged pit designs, Ngualla weathered Bastnaesite Zone
Rare earth oxidesREO Grade (%) % of Total REO
Proved Probable All Proved Probable All
MTonnes 17.0 1.5 18.5 - - -Lanthanum 1.318 1.418 1.326 27.59 27.80 27.61
Cerium 2.305 2.456 2.317 48.25 48.15 48.24Praseodymium 0.228 0.243 0.229 4.77 4.77 4.77
Neodymium 0.788 0.838 0.792 16.49 16.43 16.49Samarium 0.077 0.082 0.077 1.61 1.61 1.61Europium 0.014 0.015 0.014 0.30 0.28 0.30
Gadolinium 0.029 0.031 0.030 0.62 0.60 0.62Terbium 0.002 0.002 0.002 0.05 0.05 0.05
Dysprosium 0.004 0.004 0.004 0.07 0.07 0.07Holmium 0.000 0.000 0.000 0.01 0.01 0.01Erbium 0.001 0.002 0.002 0.03 0.03 0.03Thulium 0.000 0.000 0.000 0.00 0.00 0.00
Ytterbium 0.001 0.001 0.001 0.01 0.01 0.01Lutetium 0.000 0.000 0.000 0.00 0.00 0.00Yttrium 0.010 0.010 0.010 0.20 0.19 0.20
Total REO 4.78 5.10 4.80 100.00 100.00 100.00
Table 7.4: Elements of combined REO grade
Values may not sum up due to rounding.
For
per
sona
l use
onl
y

18 BANKABLE FEASIBILITY STUDY PEAK RESOURCES LIMITED ENABLING LOW CARBON TECHNOLOGIES
8. PILOT PLANTS
8.1 BENEFICIATION PILOT PLANTA beneficiation flowsheet piloting program was conducted at ALS in Perth using a total of 56 dry tonnes of typical weathered bastnaesite mineralisation from Ngualla. The mineralisation was initially coarse crushed and homogenised to form a single bulk sample grading 5.9% REO. The bulk sample was successfully piloted at a feed rate of 250 kg/hour using the new milling and two stage flotation flowsheet developed by Peak.
The Pilot Plant accomplished the following:
• Sustained operation in steady state demonstrating the beneficiation process is both robust and reproducible on mineralisation selected to be representative of the first five years of mill feed.
• Provision of vital operating and design parameters to Amec Foster Wheeler for incorporating into the BFS.
• The production of two tonnes of concentrate grading >40% REO in preparation for piloting of the next stage Leach and Purification process at ANSTO Minerals (ANSTO) in Sydney.
Peak has developed and demonstrated through extensive pilot plant operation a robust process for Ngualla’s unique ore to provide confidence in the deliverability and operability of the three main processing stages – beneficiation, leach and purification/separation (Figure 8.1). The pilot plants together cost approximately A$ 5 million and comprehensively validate the operating and design parameters used in this Study.
RUN OF MINE ORE Leach Recovery Separation
RARE EARTH OXIDE
AND CARBONATE PRODUCTS
PILOTED PILOTED PILOTED
Benefication
Figure 8.1: Simplified summary of the three stage process developed by Peak for Ngualla’s rare earth mineralisation.
8.2 LEACH & PURIFICATION PILOT PLANTThe selective leach recovery process developed by Peak is a key factor in Ngualla’s low operating and capital costs and allows the final products to be aligned to the high demand magnet metal rare earth market.
A pilot plant at ANSTO Minerals piloting facility near Sydney used the high grade mineral concentrate produced by the ALS Beneficiation Pilot Plant to demonstrate the new selective leach flowsheet.
• The simple but robust recovery process produces a high purity mixed product enriched in neodymium and praseodymium from the rare earth mineral concentrate.
• A dry roast process followed by selective leach and purification leads to low reagent consumption and a smaller downstream plant to produce a suitable feed to the final product separation stage.
• The process allows the use of lower cost modular designed polymer tanks.F
or p
erso
nal u
se o
nly

19PEAK RESOURCES LIMITED BANKABLE FEASIBILITY STUDYENABLING LOW CARBON TECHNOLOGIES
8. PILOT PLANTS (continued)
Figure 8.2: Barite pre-flotation circuit at ALS test facility in Perth, Western Australia.
Figure 8.3: A portion of the Leach Recovery and Purification Pilot Plant at ANSTO Minerals test facility.
8.3 SEPARATION PILOT PLANTThe ability to produce high purity separated rare earth products adds significant value to Ngualla’s products and allows access to wider end use markets. To this end, Peak commissioned ANSTO to prepare a feed stream for a separation Pilot Plant from a 1.3 tonne bulk sample of weathered Bastnaesite Zone mineralisation from Ngualla.
Figure 8.4: Solvent Extraction test facility at ANSTO Minerals.
By the completion of the Pilot Plant operation, four high purity separated rare earth oxide products were successfully produced from Ngualla's mineralisation. Peak Resources is one of only a very small number of rare earth development companies to have successfully demonstrated at pilot plant level the processing of rare earth mineralisation from its project through the entire stages to final high purity separated rare earth products.
For
per
sona
l use
onl
y
20 BANKABLE FEASIBILITY STUDY PEAK RESOURCES LIMITED ENABLING LOW CARBON TECHNOLOGIES
9. OVERVIEW: NGUALLA OPERTIONS
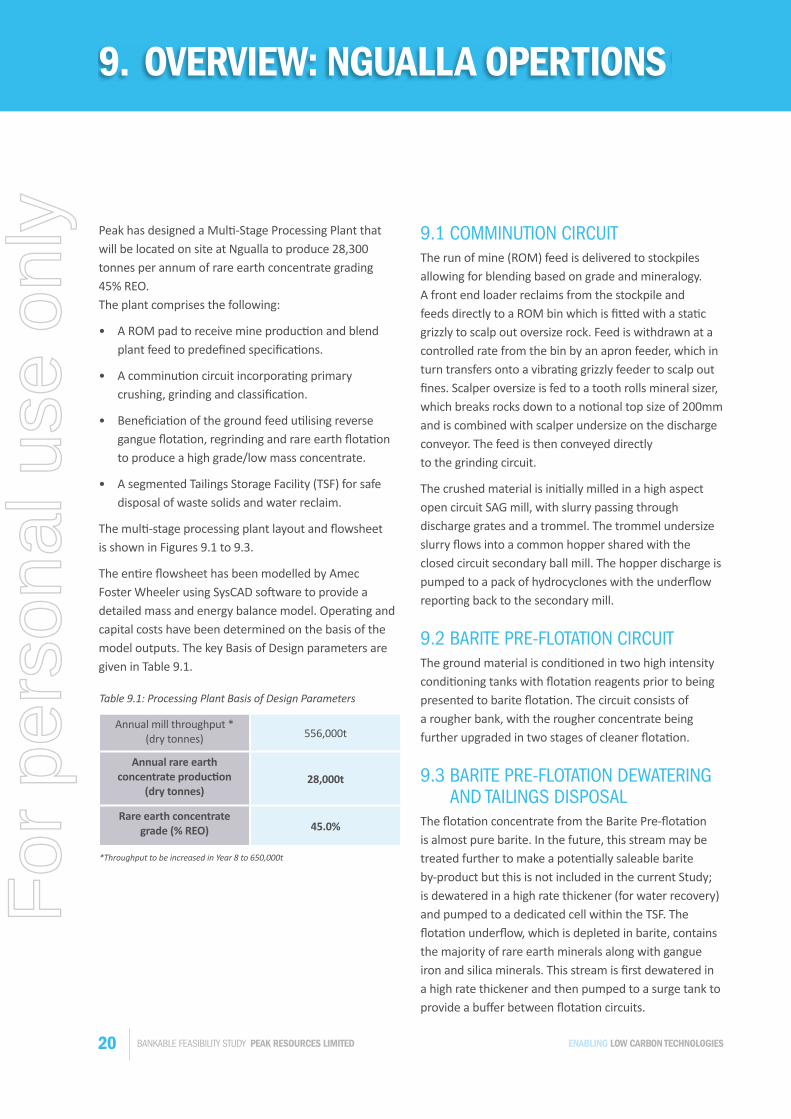
Peak has designed a Multi-Stage Processing Plant that will be located on site at Ngualla to produce 28,300 tonnes per annum of rare earth concentrate grading 45% REO. The plant comprises the following:
• A ROM pad to receive mine production and blend plant feed to predefined specifications.
• A comminution circuit incorporating primary crushing, grinding and classification.
• Beneficiation of the ground feed utilising reverse gangue flotation, regrinding and rare earth flotation to produce a high grade/low mass concentrate.
• A segmented Tailings Storage Facility (TSF) for safe disposal of waste solids and water reclaim.
The multi-stage processing plant layout and flowsheet is shown in Figures 9.1 to 9.3.
The entire flowsheet has been modelled by Amec Foster Wheeler using SysCAD software to provide a detailed mass and energy balance model. Operating and capital costs have been determined on the basis of the model outputs. The key Basis of Design parameters are given in Table 9.1.
9.1 COMMINUTION CIRCUIT The run of mine (ROM) feed is delivered to stockpiles allowing for blending based on grade and mineralogy. A front end loader reclaims from the stockpile and feeds directly to a ROM bin which is fitted with a static grizzly to scalp out oversize rock. Feed is withdrawn at a controlled rate from the bin by an apron feeder, which in turn transfers onto a vibrating grizzly feeder to scalp out fines. Scalper oversize is fed to a tooth rolls mineral sizer, which breaks rocks down to a notional top size of 200mm and is combined with scalper undersize on the discharge conveyor. The feed is then conveyed directly to the grinding circuit.
The crushed material is initially milled in a high aspect open circuit SAG mill, with slurry passing through discharge grates and a trommel. The trommel undersize slurry flows into a common hopper shared with the closed circuit secondary ball mill. The hopper discharge is pumped to a pack of hydrocyclones with the underflow reporting back to the secondary mill.
9.2 BARITE PRE-FLOTATION CIRCUITThe ground material is conditioned in two high intensity conditioning tanks with flotation reagents prior to being presented to barite flotation. The circuit consists of a rougher bank, with the rougher concentrate being further upgraded in two stages of cleaner flotation.
9.3 BARITE PRE-FLOTATION DEWATERING AND TAILINGS DISPOSAL
The flotation concentrate from the Barite Pre-flotation is almost pure barite. In the future, this stream may be treated further to make a potentially saleable barite by-product but this is not included in the current Study; is dewatered in a high rate thickener (for water recovery) and pumped to a dedicated cell within the TSF. The flotation underflow, which is depleted in barite, contains the majority of rare earth minerals along with gangue iron and silica minerals. This stream is first dewatered in a high rate thickener and then pumped to a surge tank to provide a buffer between flotation circuits.
Table 9.1: Processing Plant Basis of Design Parameters
Annual mill throughput * (dry tonnes) 556,000t
Annual rare earth concentrate production
(dry tonnes) 28,000t
Rare earth concentrate grade (% REO) 45.0%
*Throughput to be increased in Year 8 to 650,000t
For
per
sona
l use
onl
y

21PEAK RESOURCES LIMITED BANKABLE FEASIBILITY STUDYENABLING LOW CARBON TECHNOLOGIES
9. OVERVIEW: NGUALLA OPERTIONS (continued)
Figure 9.1: Ngualla Flowsheet
For
per
sona
l use
onl
y

22 BANKABLE FEASIBILITY STUDY PEAK RESOURCES LIMITED ENABLING LOW CARBON TECHNOLOGIES
9. OVERVIEW: NGUALLA OPERATIONS (continued)
9.5 CONCENTRATE AND TAILINGS DEWATERING
The final concentrate is dewatered in a high rate thickener to recover water from the overflow with the thickened slurry reporting to a filter surge tank. Slurry is then pumped through a pressure filter which operates on a batch cycle, with the filter cake discharging into the bagging facility. The bagged concentrate is then containerised for land and sea transport to the refinery.
The tailings stream from this circuit, comprising mainly of iron minerals, is dewatered in a high rate thickener to recover water and then pumped to a dedicated cell within the TSF.
The flowsheet is shown in Figure 9.1 and the plant 3D layout in Figures 9.2 and 9.3
9.4 REGRIND AND RARE EARTH FLOTATION CIRCUIT
Slurry is pumped from the surge tank through an open circuit regrind mill in order to grind coarse particles and mechanically reactivate mineral surfaces ahead of rare earth flotation. The milled slurry is diluted with process water and heated with steam injection in conditioning tanks where flotation reagents are added prior to flotation. The Rare Earth Flotation circuit is of higher complexity than the Barite Pre-Flotation Circuit due to the comparatively difficult separation of rare earth minerals from iron minerals which require stage wise depression with starch to achieve an adequate final concentrate grade. The circuit consists of a rougher train followed by four stages of counter-current closed circuit cleaner flotation. Steam is added stage wise through the cleaner circuit in order to improve selectivity against the iron minerals.
Figure 9.3: Ngualla plant 3D layout - flotation and thickening
Figure 9.2: Ngualla plant 3D layout
For
per
sona
l use
onl
y

23PEAK RESOURCES LIMITED BANKABLE FEASIBILITY STUDYENABLING LOW CARBON TECHNOLOGIES
10. ENVIRONMENTAL & SOCIAL
Peak is developing Ngualla to be a long term, environmentally and socially sustainable supplier of choice to the global high technology rare earth market. The Company’s own ethics and standards in this regard, together with those of its investor partners, match the modern needs of global industry to have a responsible source of materials throughout their product supply chain. The Company aims to make this green and sustainable approach a fundamental part of its business strategy and a point of differentiation for its products compared with some other sources of rare earths.
The Company maintains highest standards of environmental, health, safety and social behaviour and aims to ensure that the development of Ngualla benefits all stakeholders including the communities in which it operates.
The project development area at Ngualla is free of any habitation, farming or grazing and there are no reserves of any kind over the area. The Company enjoys the support of the local community and government at the district, regional and national level in the development of the project.
The location of the mine and process facilities within the ring of hills that surround the carbonatite structure will enable the site to be self-contained with a low impact on surrounding areas. Water will be recycled for re-use in the plant and there will be no waste discharge from the operation.
An assessment of the specific activity levels of the mineralisation to be mined indicates that the levels of uranium (15ppm) and thorium (54ppm) are very low and well below levels set by the International Atomic Energy Agency to be regarded as radioactive and as such there is no concern of any environmental or health and safety issues arising from safety issues.
10.1. SOCIALPeak has established and maintained an excellent relationship with the local people, village council, local government organisations and the central government ministries. Peak is an active member of the local community, which is in full support of the development of the mine and processing plant and has actively assisted the development by providing labour, local produce, access to land and security.
Through its Community and Social Responsibility (CSR) programmes, Peak has funded, assisted with and donated to many community projects in the local area and wider region (see Figure 10.1 to 10.4). Projects are identified by the Ngwala Village Council based on the needs and priorities of their constituents. These projects are brought to Peak’s attention at village meetings and developed through further discussion and consultation that includes the broader levels of local administration to ensure they are aligned with the established programs of the District and Regional government. Individual projects completed to date include the building of two new classrooms and refurbishment of several more for the Ngwala Primary School, provision of text books, school equipment and desks to three schools in the Ngwala district and the construction of nine teachers’ houses. Other projects have included completion of water bores
Figure 10.1: First bucket of water accepted by villager at handover ceremony for Madodomia village water bore and pump, donated by Peak December 2015.
For
per
sona
l use
onl
y

24 BANKABLE FEASIBILITY STUDY PEAK RESOURCES LIMITED ENABLING LOW CARBON TECHNOLOGIES
10. ENVIRONMENTAL & SOCIAL(continued)
and pumps, provision of sporting equipment for local teams, construction of clinic waiting area and assistance with the establishment of an airstrip at Ngwala.
10.2. ENVIRONMENTAL PERMITTINGThe environmental permitting of the Ngualla Rare Earth Project is complete with the Environmental Certificate (EC) received on 16 March 2017. The certificate of environmental approval was granted after the successful completion of a detailed Environmental and Social Impact Assessment Study overseen by regulators National Environment Management Council (NEMC). The study included wet and dry season baseline studies, socioeconomic reports, stakeholder consultation at local, District, Regional and National level together with a site visit and review meeting with NEMC.
Figure 10.2: Local children gathering outsideNgwala Village School.
Widespread support for the development of the project has been received from all stakeholders.
An application for an Environmental Permit for the Tees Valley refinery is in preparation at the time of writing and will be lodged with the UK Environment Agency shortly, with approvals expected during 2017.
Peak’s environmental and social consultants also assist the Company to ensure IFC’s best practice standards of operation and reporting are met, standards which will also be required by international banks in areas of environmental and social responsibility and the Company’s own sustainable business model.
Figure 10.3: Community Liason Officer, Mariam Mwaiswelo,Managing Director, Darren Townsend and Project Manager,Patrick Ochieng outside the Ngualla teachers houses builtby Peak in 2014.
Figure 10.4: Ngwala Village Football Team prepareto commence a match- kits were donated by Peakin June 2013.
For
per
sona
l use
onl
y

25PEAK RESOURCES LIMITED BANKABLE FEASIBILITY STUDYENABLING LOW CARBON TECHNOLOGIES
11. OVERVIEW: TEES VALLEY OPERATIONS
RARE EARTH REFINERY
11.1 CALCINING/LEACHING/PURIFICATIONContainers of concentrate coming from the port are stored in front of Tees Valley processing to help mitigate potential Ngualla processing and transportation issues. The Recovery Circuit takes advantage of the fact that the multi-stage beneficiation process has produced a high grade/low mass rare earth concentrate and therefore has low treatment rate of less than four dry tons per hour. This results in a very modest size circuit consisting mainly of low cost fibre-reinforced plastic tanks, pumps and filters.
The received mineral concentrate (45% REO) is mixed with a common alkali prior to being fed into an indirectly fired rotary kiln. After the material is calcined it is washed with water to remove soluble fluoride and then sent on to leach circuit. The conditions of the Calciner and the Leach form the real control for the cerium/iron sequestration and the rare earth recovery.
After the leach residue is filtered out, the leach liquor is sent to Purification process to remove the majority of the remaining impurities that cause issues with downstream processes and product quality. The solids from the leach, purification and fluoride removal process are collected and forwarded into the solid waste facility. Residual brine solutions are forwarded to water treatment and then passed into the Sembcorp effluent treatment system.
11.2 SOLVENT EXTRACTIONSolvent extraction technology will be used to separate rare earths. This process starts by separating the mid and heavy rare earths, followed by separating neodymium and praseodymium and lastly separatingcerium from lanthanum.
The conditions for each of the three solvent extraction units are altered to favour the elements being extracted. In all three solvent extraction units, the separated elements are concentrated and purified for the subsequent precipitation and product finishing.
11.3 PRODUCT PRECIPITATION / PRODUCT FINISHING
There are four different products being generated in this plant normally; mid-heavy rare earth carbonate, NdPr oxide, lanthanum carbonate, and cerium carbonate.
System for the carbonate systems will be setup as continuous precipitations, meaning multiple stages, reliable pH control, consistent temperature control, possible seeding capabilities, and correct agitation and pumping from wash thickeners to centrifuges. Thickener overflow centrate will be routed to REO scavenging recovery circuit. The NdPr oxalate batch precipitation, will be followed by calcination to a two nines oxide product. Products will be bagged in one metric tonne bags, with a plastic inside liner.
11.4 ANCILLARY SERVICESThe Tees Valley was one of over a dozen international sites that were evaluated for the fit to rare earth refinery's requirements.
LogisticsAccess to port facilities for rare earth concentrate delivery as well as availability of a bulk supply of hydrochloric acid, other reagents and heavy vehicle access has been taken into account in the site selection criteria for the refinery.
Power and Water SupplyThe power and water infrastructure to meet the Refinery’s requirements has been allowed for in the site selection criteria. This will save on the need for significant capital expenditure on Peak's part for these services.
Effluent/Solid Waste TreatmentThe solids from the leach, purification and fluoride removal process are collected and forwarded into a solid waste facility. Acidic streams generated within the Recovery and Separation circuits will be pumped to an effluent treatment plant for neutralisation; resulting in divalent precipitation and brine clarification using Best Available Techniques (BAT). Residual brine solutions are then into passed to Sembcorp water treatment.
For
per
sona
l use
onl
y

26 BANKABLE FEASIBILITY STUDY PEAK RESOURCES LIMITED ENABLING LOW CARBON TECHNOLOGIES
11. OVERVIEW: TEES VALLEY OPERATIONS (continued)
Figure 11.1: Tees Valley flowsheet
For
per
sona
l use
onl
y
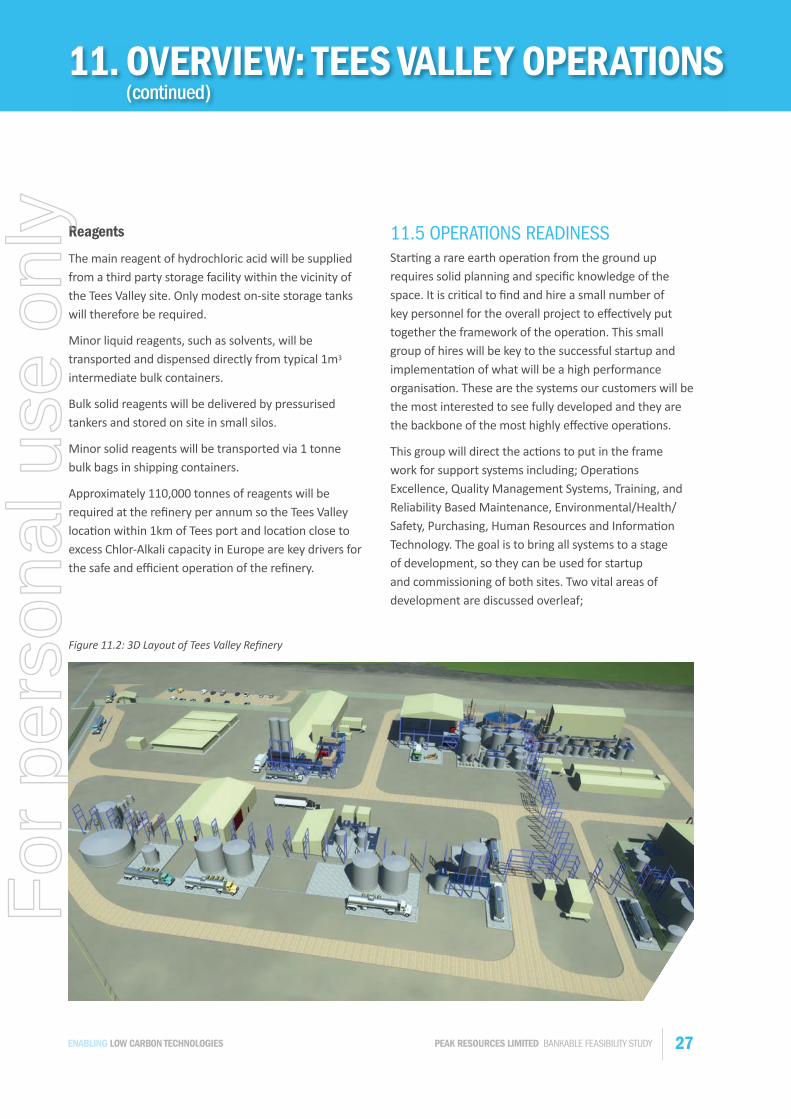
27PEAK RESOURCES LIMITED BANKABLE FEASIBILITY STUDYENABLING LOW CARBON TECHNOLOGIES
11. OVERVIEW: TEES VALLEY OPERATIONS (continued)
Figure 11.2: 3D Layout of Tees Valley Refinery
Reagents
The main reagent of hydrochloric acid will be supplied from a third party storage facility within the vicinity of the Tees Valley site. Only modest on-site storage tanks will therefore be required.
Minor liquid reagents, such as solvents, will be transported and dispensed directly from typical 1m3
intermediate bulk containers.
Bulk solid reagents will be delivered by pressurised tankers and stored on site in small silos.
Minor solid reagents will be transported via 1 tonne bulk bags in shipping containers.
Approximately 110,000 tonnes of reagents will be required at the refinery per annum so the Tees Valley location within 1km of Tees port and location close to excess Chlor-Alkali capacity in Europe are key drivers for the safe and efficient operation of the refinery.
11.5 OPERATIONS READINESSStarting a rare earth operation from the ground up requires solid planning and specific knowledge of the space. It is critical to find and hire a small number of key personnel for the overall project to effectively put together the framework of the operation. This small group of hires will be key to the successful startup and implementation of what will be a high performance organisation. These are the systems our customers will be the most interested to see fully developed and they are the backbone of the most highly effective operations.
This group will direct the actions to put in the frame work for support systems including; Operations Excellence, Quality Management Systems, Training, and Reliability Based Maintenance, Environmental/Health/Safety, Purchasing, Human Resources and Information Technology. The goal is to bring all systems to a stage of development, so they can be used for startup and commissioning of both sites. Two vital areas of development are discussed overleaf;
For
per
sona
l use
onl
y

28 BANKABLE FEASIBILITY STUDY PEAK RESOURCES LIMITED ENABLING LOW CARBON TECHNOLOGIES
11. OVERVIEW: TEES VALLEY OPERATIONS (continued)
QA/QCThe QA/QC group must have a high level of capability for analyzing rare earth products and the impurities within those products. Often the difference in getting new business is related to the confidence customers have in the product certification of analysis (COA). This group will be the primary quality support for Marketing/Sales, Ngualla QA/QC, most in-process analytical efforts at Tees Valley and Product Development. The ability to build a highly effective QA/QC team and to act as the face of the corporation on the quality front are critical to Peak’s success. They will also lead company-wide Quality Management Systems, ISO 9001:2015 certification and Reach certification.
Process EngineeringProcess Engineering will be an active support for root cause analysis (RCA), as it relates to Safety, Quality and Mechanical failures. The group will also have a lead role for quality management and active participation in ISO certification related to quality, environmental and safety.
Additional responsibility includes; short interval control (SIC) or “decision trees”, SOP development, development of Pi data historian collections and all the development of the reports which use the Pi data to give transparent vision of operational effectiveness, including process KPI’s, OEE%, down time pareto.
Figure 11.3: Concentrate handling facility.
Figure 11.4: Leaching area adjacent toeffluent treatment facility.
For
per
sona
l use
onl
y

29PEAK RESOURCES LIMITED BANKABLE FEASIBILITY STUDYENABLING LOW CARBON TECHNOLOGIES
12. MARKETING
12.1 MARKETING AND SALES STRATEGYOverall, our governments and society are becoming more concerned about the global environmental challenges which we are facing. Compounding this is the context of the growth of emerging markets in Africa, Asia and Latin America. It is predicted that more than one billion people in Asia are in the transition of advancing from low socio-economic circumstances to a middle-income class. Subsequently the desire to increase their mobility will cause a change in their consumer behaviour. At the same time we see that these emerging markets, in particular China, but also the rest of the world, are becoming aware of the environmental toll that this growth requires and they have acknowledged alarming developments in the area of climate change, health and resources scarcity.
The majority of the predicted future growth of rare earths consumption and particular neodymium and praseodymium is already underpinned by recent and already agreed legislation and government policies and the will for decarbonisation of energy production, transport and industry.
As a result of this we see a positive sentiment in our society and a positive global shift in demand which will drive and increase the demand for rare earths and in consequence underpin the growth strategy of Peak and the identified value drivers for the Ngualla Project (90% of Peak's future revenue).
Neodymium magnets are ten times more powerful and three times lighter than traditional ferric magnet alternatives. These magnets provide much better performance under a wider range of operating conditions, so allowing effective miniaturisation and production of compact, lightweight and powerful motors which represents the overall trend in the industrial manufacturing industry.
Peak will produce and market the following four products:
• A high purity neodymium-praseodymium oxide (99%)product - 2,420 tonnes per annum (tpa)
• A combined mid-heavy rare earth carbonate product -530 tpa equivalent to 280 tpa of contained REO
• A lanthanum rare earth carbonate product - 6,940 tpaequivalent to 3,650 tpa of contained REO
• A cerium rare earth carbonate product - 3,005 tpaequivalent to 1,660 tpa of contained REO
The Company is targeting a modest production level of total 8,010 tpa REO equivalent (less than 5% of worlddemand), which makes the marketing of production more achievable than many projects that need a high production profile in order to realise an adequate return on higher capital and operating costs.
Peak has held discussions with a large number of potential offtake customers and has received strong interest from several.
Potential customers include industrial conglomerates for the neodymium-praseodymium ‘magnet metal’ product, rare earth refiners for the mid + heavy product, and Fluid Catalytic Cracking (FCC) and auto catalyst manufacturers for the lanthanum and cerium products.F
or p
erso
nal u
se o
nly

30 BANKABLE FEASIBILITY STUDY PEAK RESOURCES LIMITED ENABLING LOW CARBON TECHNOLOGIES
12. MARKETING (continued)
12.2 NGUALLA – LEADING DEPOSIT UNDERPINNED BY A STRONG MARKET DEMAND STORY
Over the past six years, it has been difficult for investors to get excited about the rare-earth sector. With commodity prices for rare earths enduring significant declines and hitting lows in late 2016, the sector has been viewed as a high-risk, low return investment proposition.
Looking at pricing on face value, it appears as if nothing positive has happened following the surge in pricing in late 2010 and early 2011. However, digging beneath the recent commodity price performance and focussing on actual market dynamics, there is much to be optimistic about. The reality is that the demand for rare-earths, particularly neodymium and praseodymium is set to grow exponentially due to the introduction of new disruptive technologies in the e-mobility sector (electrified transport) which is benefiting from increased support by global legislators.
The Evolution of Disruptive TechnologyWhen a major new disruptive technology is introduced, there is often an associated scepticism among established players, who often loudly condemn the new technology as one that, for countless reasons, won’t gain momentum. Their argument is often based on the notion that if there was such a thing as ‘game changing technology’ and there was a market for it, they would have already developed it. Their excuse often sounds a lot like –“Been, there, done that – and it doesn’t work.”
A classic example of this in recent times was when 10 years ago, mobile phone powerhouses Nokia and RIM predicted that Apple would remain a niche supplier of mobile technology and that their iPhone would likely fail owing to the fact it had no keyboard and came with a fully embedded content ecosystem.
In addition the iPhone was, in their eyes also overpriced. Now, 10 years later, Apple dominates the smart phone industry having sold over 1 billion iPhone units and will in 2017, likely reach the incredible milestone of accumulating US$ 1 trillion revenues from their mobile platform IOS. Quite a ride isn’t it? Where are those former industry leaders? Well, most of them have been taken over by new players looking to get their hands on their comprehensive IP portfolios.
As human history shows through multiple examples, real innovation is always led by new players with tremendous dedication, a vision and hunger to succeed and a willingness to challenge the status quo. This is what drives them and what most big corporations are lacking because their shareholders demand predictability and low-risk business models. Uncertainty and failures are their natural enemies but inevitable when it comes to true innovation.
Now you might think we’ve gone off track here, right? Maybe, maybe not - who knows? While we may not have the magic crystal ball to see the future, we would like to help you, as Steve Jobs, CEO of Apple once said, ‘connect the dots’
The good news is if a project can make it in the current market environment, it will have an exceptional future.
OPINION This opinion piece represents Peak Resource's view on the dynamics of the market (pages 30-36).
For
per
sona
l use
onl
y

31PEAK RESOURCES LIMITED BANKABLE FEASIBILITY STUDYENABLING LOW CARBON TECHNOLOGIES
12. MARKETING (continued)
E-MobilityWe, along with many in the industry, believe that we are witnessing, right now, the type of disruption discussedabove with e-mobility in one of the biggest global industry sectors - automotive industry. This disruption is being led by an important and well-known challenger and innovator, Tesla, a company that does not have to defend a legacy like the established car manufacturers and instead, realise they have more to gain than to lose.
It will be crucial for the success of E-mobility globally that Tesla ultimately succeeds given the potential for the massive disruption it will cause to secure and accelerate the transformation of the global automotive industry. Its success will ensure the availability of capital which otherwise would have never been accessible, opening the door for new players to enter the market, in turn forcing the established car manufacturers to join e-mobility. Some of them will need to fight for theirsurvival even if they are not aware of it today.
Remember the Nokia’s, Motorola’s and RIM’s? We think the same will occur with E-mobility, and that in 10-15 years’ time the world will look very different. Here we follow the thoughts of Mr Kevin Kelly and like him believe that electric mobility in combination with autonomous driving implementation will represent a technical revolution similar to the industrial revolution in the 19th century. We believe that artificial intelligence (AI) of autonomous driving will kick off a new industrial chapter where AI is combined with electric power and this will be a fundamental technology disruption significantly impacting the way we live our lives.
Importantly, and significantly for Peak, all of these new self-sustainable robotic solutions in not only mobility, but manufacturing, agriculture, logistics,
Connecting the DotsSo, let’s connect the dots by focusing on the electric mobility market, a key demand centre for Peak’s raw materials. We have selected this industry sector deliberately because of its visibility in the media, its relevance to everybody’s daily lives and the fact that it is an end-consumer application which has a huge accelerated and unpredictable growth potential.
Tesla, as the leader in the e-mobility trend, is today facing the classical problem of a true innovator. Burning cash, making little or no profit and fighting against an established and highly profitable industry. The traditional automotive industry follows a predictable paradigm which demands companies only innovate as much as they need to be able to differentiate themselves from the competition while at the same time maximising shareholder value. As a result, they stick to their
and domestic services will need to be powered by engine technologies which will most likely rely on NdPr based technologies.
We believe the fundamentals are alreadyin place and the question is not if it willhappen, but when?
Figure 12.1
0
5%
10%
15%
20%
25%
% PENETRATIONBATTERY COST €/KWH
0
200
400
600
800
1,000
SPARKS FLYBattery Electric Vehicles, worldwide
SOURCES: Exane BNP Paribas; UBS
New forecast
Old forecast
2009 2015 2020 2025 2030
FORECAST
For
per
sona
l use
onl
y

32 BANKABLE FEASIBILITY STUDY PEAK RESOURCES LIMITED ENABLING LOW CARBON TECHNOLOGIES
12. MARKETING (continued)
written off technologies and milk the cow as long as possible with moderate investments while selling the appearance of being innovative.
When local or national governments, politicians and regulators push too hard to promote the types of true innovation we’re talking about, the automotive industry use their network and lobby groups to spread the threat that if they are forced to invest too much they will no longer be able to stay competitive and this might lead directly to local job cuts.
So that is why it is so important that Tesla succeeds in accomplishing its goal to reduce the overall cost for this technology, in particular the battery cost, which currently represents up to a third of an electric vehicle cost.
Between 2020-2025 battery cost and performance will reach competitive equilibrium with combustion engines which initiates the S-curve for electric vehicles.
Massive Emobility Market GrowthTesla’s brave push into the market has been positive for the sector having initiated an avalanche of investments of more than USD 20 billion for new, incremental lithium battery capacity committed by companies like VW, Samsung, LG Chem, BYD, Boston-Power, Foxconn, Tesla - Panasonic, Daimler. With the mega factories being built and the technical challenges being addressed, consumers can look forward to a tremendous increase in the range of electronic vehicles available for sale within the next 3-5 years.
More than +200 new electrified models from Hyundai-Kia, GM, BMW Group , Honda, VW Group, Daimler, Nissan, BYD, Ford, Toyota and others are expected to hit the dealerships by 2025. The model landscape will reach a level of diversification which will ultimately enable this technology to enter the mainstream market. This is especially the case when you see electric vehicles being designed with an emotional appeal and less with an industrial design such as the Porsche Mission e, BMW I , BMW I NEXT or the Daimlers EQ series.
When these new vehicles hit the market in the price range of US$ 30-35,000 (which represents the price range within the majority of vehicles are sold in the US today) and at the same time offer the performance of a super sports car accelerating from 0-100km per hour in less than 3 seconds, the consumer demand proposition is in our view, a "no brainer".
For
per
sona
l use
onl
y

33PEAK RESOURCES LIMITED BANKABLE FEASIBILITY STUDYENABLING LOW CARBON TECHNOLOGIES
500m vehicles
400m vehicles
300m vehicles
200m vehicles
100m vehicles
12. MARKETING(continued)
Further supporting this rapid transition to electric mobility, it is projected by Bloomberg that by 2022 the cost of ownership of an electric vehicle will be cheaper than a combustion engine. This will signal the point of no return. Once this milestone is achieved we predict within 10 years’ time combustion engines will become a nostalgic artefact.
All lights are on green, there is hardly any analyst that does not show substantial growth for the e-mobility sector, just have a look at following reports: German Bank – Lithium 101 Report, Goldman Sachs - The Low
Carbon Economy or Bloomberg - Here’s How Electric Cars Will Cause the Next Oil Crisis they all project annual sales volumes between 7 to 16 million vehicles in 2025. Representing a global market share of 7 to 22% at that time. Bloomberg projects even for 2040 a market share of 35% with potential annual sales of 40 million vehicles.
Figure 12.2: The rise of electric cars
By 2022 electric vehicles are expected to cost the same as theirinternal-combustion counterparts. That's the point of lift-off for sales.
Electric vehicles will account for 35% of all
new vehicle sales
PROJECTED ANNUAL SALES CUMULATIVE SALES
20152016
20172018
20192020
20212022
20232024
20252026
20272028
20292030
20312032
20332034
20352036
20372038
20392040
SOURCE: Data compiled by Bloomberg New Energy Finance, Marklines
The prediction is the cost of ownership of an electric car will be BELOW that of a combustion engine car by 2022!
It is projected that by 2025 electric vehicleswill reach annual sales of between 7 to 16million vehicles.
For
per
sona
l use
onl
y

34 BANKABLE FEASIBILITY STUDY PEAK RESOURCES LIMITED ENABLING LOW CARBON TECHNOLOGIES
We have followed the latest developments in theseareas carefully and we see that implemented legislationworld-wide and the overall positive sentiment in societyis supportive and accelerating the transition to NdPrtechnologies - just look what is happening in Germany,Norway, Netherlands, and India.
12.3 WHAT DOES THIS MEAN FOR NEODYMIUM AND PRASEODYMIUM?
With all of this in place, we remain puzzled that the investment community and analysts are so euphoric and engaged with commodities such as Graphite, Lithium and Cobalt (the raw materials used in lithium-ion batteries) while showing no excitement for rare earths and in particular for neodymium (Nd) and praseodymium (Pr). NdPr are the core ingredients of high-efficiency electric-motors and generators which will power not only the electric vehicles, but of a range of other clean, green and high-tech applications.
Nd and Pr are critical elements in the construction of compact, light-weight and high-efficiency permanent magnets, which are already dominant in today’s electric vehicle industry.
12. MARKETING (continued)
With this in mind, it is also important to understand that based on today’s knowledge for each electric vehicle which is built in place of a traditional internal combustion engine (ICE) powered vehicle, there is an incremental increase in demand of 0.5 to 1kg pure NdPr oxide, depending on the model and applied power train technology. Multiply this by the projections just mentioned above, and you can clearly see the potential for rapid demand growth for NdPr. And we didn’t even touch upon electric bicycles, scooters, commercial vehicles, busses, trains etc.
e-mobility is only one of several applications whichrepresents a huge increase of the future demand ofNdPr. Visit our new website and you can learn moreabout the other applications like:
• Direct Wind Turbines• HFC replacement technologies like
magnetocaloric technologies• Existing industrial robotic solutions• Future autonomous robotic solution
12.4 OTHER SUPPORTIVE KEY DRIVERS As much as we are excited about the application side of the business we understand that three additional important drivers are important for the anticipated change:
• Global environmental related legislation;
• Macroeconomic; and
• China - The leading global supplier of rare earths today
Behind each battery is a motor and 9 timesout of 10 it is an NdPr permanent magnetmotor in a vehicle.
Each converted car from combustion engine to an electrified vehicle represents an additional demand of 0.5 to 1kg NdPr oxide.
E-mobility is just one of several applicationswhich rely on NdPr as heart of their motors.
If you want to get the energy from your lithium battery onto the road, 90% of the time it will be going via an NdPr magnet.
For
per
sona
l use
onl
y

35PEAK RESOURCES LIMITED BANKABLE FEASIBILITY STUDYENABLING LOW CARBON TECHNOLOGIES
12. MARKETING (continued)
The supply demand situation will soon get out of balance and China being the single main source of supply will no longer be able to satisfy the increasing global demand.
Up to 50% of this increase of NdPr demand is underpinned by already approved government legislations.
According to BP and ExxonMobil energyoutlook 2017, the global demand for mobility and electricity will double during the next 20 to 25 years. the incremental energy demand of the next 20 years is equivalent to what South and North America are consuming together today.
In the case of government policies; tougher controls on emissions and environmental standards, growing requirements to improve energy efficiency and the will for decarbonisation of energy production, transport - and industry will positively impact the global demand to apply NdPr technologies. We agree with the new report by Adamas Intelligence, that up to 50% of this increase of demand is underpinned by legislation which is already being implemented such as the Kigali-Agreement, COP21 Paris summit and Energy 2020 (Europe).
The overall macroeconomic trend and the projected facts for 2035-2040 imply that the world needs to find new answers for old questions. It is projected that global GDP, world population, global vehicle fleet and global electricity consumption (without realisation of efficiency improvements) will double over the next 20 years. This trend will be further amplified by the trend of urbanisation and increasing numbers of mega cities – with all the associated problems that come with them.
In October 2016 the Ministry of Industry & Information Technology of the Chinese Government released its "Rare Earth Industry Development Plan (2016-2020)" which represents the implementation
plan for the Rare Earth Industrial Standard Regulation, published on July 1, 2016. The plan covers the complete spectrum of the Chinese rare earth industry including industrial consolidation, the environmental sustainability agenda, protection of national resources, a road map for further integration into the value chain and moving away from low-tech to high-tech applications. In a nutshell, China is aiming for further downstream integration of the global rare earth industry while at the same time reducing illegal mining and international exports and improving the environmental compliance of the industry. Their agenda includes: • A projected annual growth rate of 15% in regards
of the overall domestic rare earth consumption.• A fixed target of reducing solvent extraction REO
processing capacity from 300,000 t (2015) to200,000 t (2020) and implementing controls to limitREO production to 140,000 tpa.
• A reduction of rare earth exports from 57% of 2015 output to 30% of 2020 output.
• An improvement in the profitability of rare earthenterprises from 5.8% (2015) to 12% (2020).
• A target to make 90 % of Chinese rare earthcompanies compliant with energy and environmentallegislation (from a base of 30% today).
• The Government to support overseas investmentor collaboration in the rare earth space .
• The government indicates further industryconsolidation and no new mining rights issued exceptto the 6 state-owned rare earth groups.
For
per
sona
l use
onl
y

36 BANKABLE FEASIBILITY STUDY PEAK RESOURCES LIMITED ENABLING LOW CARBON TECHNOLOGIES
China is in the process of moving two thirds of their population into the middle class over the next 15 years and by doing that China has to face a reality. As soon as bellies are full and basic needs are met,
12. MARKETING (continued)
While the sole aim until now has been to elevate the national average income and the overall prosperity of their citizens, China is now facing the real issues of environmental degradation. Current methods of mining some rare-earths domestically in China are highly damaging to the environment and unsustainable into the future.
China will undergo the same phenomenon as other developed countries in combating air pollution, similarly to how London has overcome the high levels of pollution that caused the Great Smog of 1952.
"In 2016, more than 90% of China's rare earths companies were not operating profitably and lost money."
Figure 12.3: A tugboat on the Thames in 1952 near Tower Bridge in heavy smog.
In addition to the Chinese government’s rare earth agenda, China has to face the reality that from an environmental standpoint, they cannot continue to exploit their natural resources in the way they have done over the last 20 years.
Chinese citizens will no longer accept the disastrous environmental situation and the way it is impacting their daily life and health today.
All these elements will cause an imbalance in the NdPr supply-demand situation. It is predicted that today’s 2016 annual consumption of NdPr of approx. 30 - 40,000 t will double by 2025 (see market research data and publications from Professor Dudley Kingsnorth from IMCOA or ADAMAS).
It is our view and of the Chinese themselves that China will not have enough NdPr by 2025 for its own needs.Therefore we believe the outlook for NdPr demand from 2020 and beyond is outstanding.
12.5 RARE EARTH DEMAND AND PRICING OUTLOOK
Owing to the increased use of high-power magnets in electrical motors and generators, particularly in electric cars and bikes, the demand outlook for NdPr is very positive, suggesting that current price levels, where the majority of producers are losing money should represent a cyclical low.
Furthermore, in February 2017, the largest Chinese producer of NdPr implemented a price increase of 6%.
To provide context on the pricing assumptions used in the BFS the following charts are included using data from the Asian Metals Index (an independent source of actual historic pricing data). As neodymium and praseodymium are expected to generate approximately 90% of the projects revenue we have focused on these metals.
Figure 12.4: Lady walks through smog in Beijing, 2016
For
per
sona
l use
onl
y

37PEAK RESOURCES LIMITED BANKABLE FEASIBILITY STUDYENABLING LOW CARBON TECHNOLOGIES
12. MARKETING (continued)
SOURCE: Asian Metal, Argus Metals
Figure 12.6: Increasing NdPr Price Trend in 2017
SOURCE: Asian Metal
Figure 12.5: Historic Rare Earth Price Trends
290,000
285,000
280,000
275,000
270,000
265,000
260,000
255,000
3 Jan 2017
11 Jan 2017
22 Jan 2017
10 Feb 2017
22 Feb 2017
6 Mar 2017
16 Mar 2017
RMB/
t
NdPr RMB/t min 75% Nd & 99% purity Domestic China Year to Date Price Increase 9% (10 Apr 2017)
10 Apr 2017
0
NdPr US$/kg min 75% Nd & 99% purity Domestic China
Cerium Oxide 99% min Ce FOB China
NdPr US$/kg min 75% Nd & 99% purity FOB China
China's removal of export quotas after WTO ruling:
1 May 2015
$200
$150
$100
$50
Lanthanum Oxide 2N 99% min La FOB China
JAN
11
APR
11
JUL 1
1
OCT
11
JAN
12
APR
12
JUL 1
2
OCT
12
JAN
13
APR
13
JUL 1
3
OCT
13
JAN
14
APR
14
JUL 1
4
OCT
14
JAN
15
APR
15
JUL 1
5
OCT
15
JAN
16
JUL 1
6
OCT
16
JAN
17
MAR
17
$250
$300
Prices at 10 April 2017 (US$/kg):
NdPr 2N Domestic China US$ 40.78NdPr 2N FOB China US$ 42.55 (8.04.17 Argus Media)
Cerium 2N FOB US$ 1.75 (8.04.17 Argus Media)
Lanthanum 2N FOB China US$ 2.15
APR
17
USD
/KG
For
per
sona
l use
onl
y

38 BANKABLE FEASIBILITY STUDY PEAK RESOURCES LIMITED ENABLING LOW CARBON TECHNOLOGIES
12. MARKETING (continued)
12.6 PRICE DECK FOR THE BANKABLE FEASIBILITY STUDY
METRIC UNITS VALUE $
Average LOM Product Price – NdPr Mixed Oxide 2N – min 75% Nd2O3 US $/kg 85.00
Average LOM Product Price – Lanthanum rare earth oxide 2N equivalent US $/kg 4.41
Average LOM Product Price – Cerium rare earth oxide 2N equivalent US $/kg 2.25
Average LOM Product Price – SEG and Mixed heavy rare earth oxide equivalent US $/kg 8.00
12.7 ADDITIONAL RARE EARTH MARKET INSIGHTSRare Earth MarketsRare earths have a variety of end uses and are not equal in terms of demand, production or price. They therefore cannot be considered as a single commodity. Table 12.2 summarises some of the main applications for individual rare earths.
Table 12.2: Overview Rare earth applications
USE ELEMENTS USED
Magnets Neodymium and praseodymium are key components in permanent magnets which have widespread and growing application in 'green' and renewable energy such as wind turbines, hybrid and electric vehicles and also personal audio and electronic equipment.
Phosphors Europium, terbium and yttrium are important in new, low energy lighting (Flourescent and LED), TV's and computer displays.
Batteries Lanthanum is a component of nickel metal hydride (NiMH) batteries used in electris and hybrid cars and cordless power tools.
Catalysts Cerium and lanthanum are important in the manufacture of auto and petroleum industry catalysts for pollution control and refining of oil.
Polishing Cerium-based polishing powders are preferred for high finish applications including flat panel displays, optics, electronics, smart phones and touch screen computers.
Alloys Cerium-rich mischmetal, yttrium and neodymium strengthen steels and super-alloys for aerospace and military applications.
Glass Cerium and other rare earths are used as additives to colour glass and screen UV light in optical and medical applications.
In determining the rare earth pricing for the BFS, Peak reviewed a range of recent published rare earth price projections from several established independent experts and analysts including IMCOA, Adamus and Hallgarten. A pricing position was selected within the projected ranges of these experts.
Table 12.1: Price deck for the BFS
For
per
sona
l use
onl
y
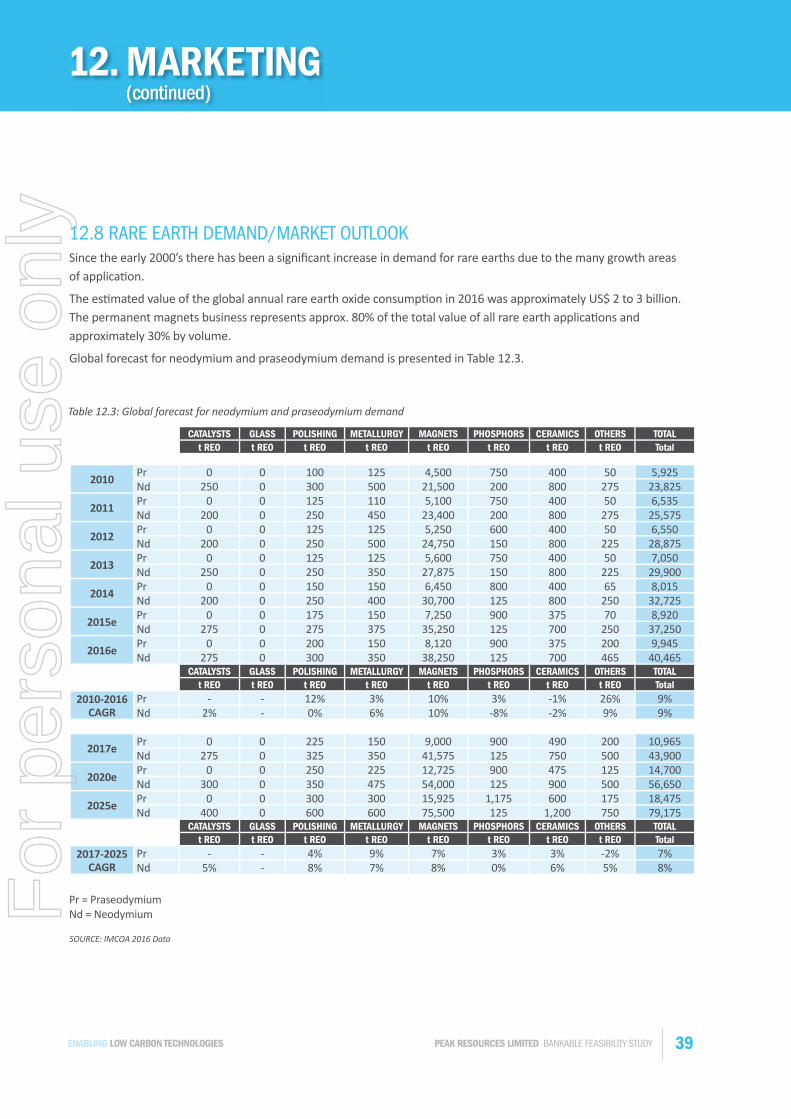
39PEAK RESOURCES LIMITED BANKABLE FEASIBILITY STUDYENABLING LOW CARBON TECHNOLOGIES
12. MARKETING (continued)
12.8 RARE EARTH DEMAND/MARKET OUTLOOKSince the early 2000’s there has been a significant increase in demand for rare earths due to the many growth areas of application.
The estimated value of the global annual rare earth oxide consumption in 2016 was approximately US$ 2 to 3 billion. The permanent magnets business represents approx. 80% of the total value of all rare earth applications and approximately 30% by volume.
Global forecast for neodymium and praseodymium demand is presented in Table 12.3.
CATALYSTS GLASS POLISHING METALLURGY MAGNETS PHOSPHORS CERAMICS OTHERS TOTALt REO t REO t REO t REO t REO t REO t REO t REO Total
2010Pr 0 0 100 125 4,500 750 400 50 5,925Nd 250 0 300 500 21,500 200 800 275 23,825
2011Pr 0 0 125 110 5,100 750 400 50 6,535Nd 200 0 250 450 23,400 200 800 275 25,575
2012Pr 0 0 125 125 5,250 600 400 50 6,550Nd 200 0 250 500 24,750 150 800 225 28,875
2013Pr 0 0 125 125 5,600 750 400 50 7,050Nd 250 0 250 350 27,875 150 800 225 29,900
2014Pr 0 0 150 150 6,450 800 400 65 8,015Nd 200 0 250 400 30,700 125 800 250 32,725
2015ePr 0 0 175 150 7,250 900 375 70 8,920Nd 275 0 275 375 35,250 125 700 250 37,250
2016ePr 0 0 200 150 8,120 900 375 200 9,945Nd 275 0 300 350 38,250 125 700 465 40,465
CATALYSTS GLASS POLISHING METALLURGY MAGNETS PHOSPHORS CERAMICS OTHERS TOTALt REO t REO t REO t REO t REO t REO t REO t REO Total
2010-2016 CAGR
Pr - - 12% 3% 10% 3% -1% 26% 9%Nd 2% - 0% 6% 10% -8% -2% 9% 9%
2017ePr 0 0 225 150 9,000 900 490 200 10,965Nd 275 0 325 350 41,575 125 750 500 43,900
2020ePr 0 0 250 225 12,725 900 475 125 14,700Nd 300 0 350 475 54,000 125 900 500 56,650
2025ePr 0 0 300 300 15,925 1,175 600 175 18,475Nd 400 0 600 600 75,500 125 1,200 750 79,175
CATALYSTS GLASS POLISHING METALLURGY MAGNETS PHOSPHORS CERAMICS OTHERS TOTALt REO t REO t REO t REO t REO t REO t REO t REO Total
2017-2025 CAGR
Pr - - 4% 9% 7% 3% 3% -2% 7%Nd 5% - 8% 7% 8% 0% 6% 5% 8%
Pr = Praseodymium Nd = Neodymium
Table 12.3: Global forecast for neodymium and praseodymium demand
SOURCE: IMCOA 2016 Data
For
per
sona
l use
onl
y
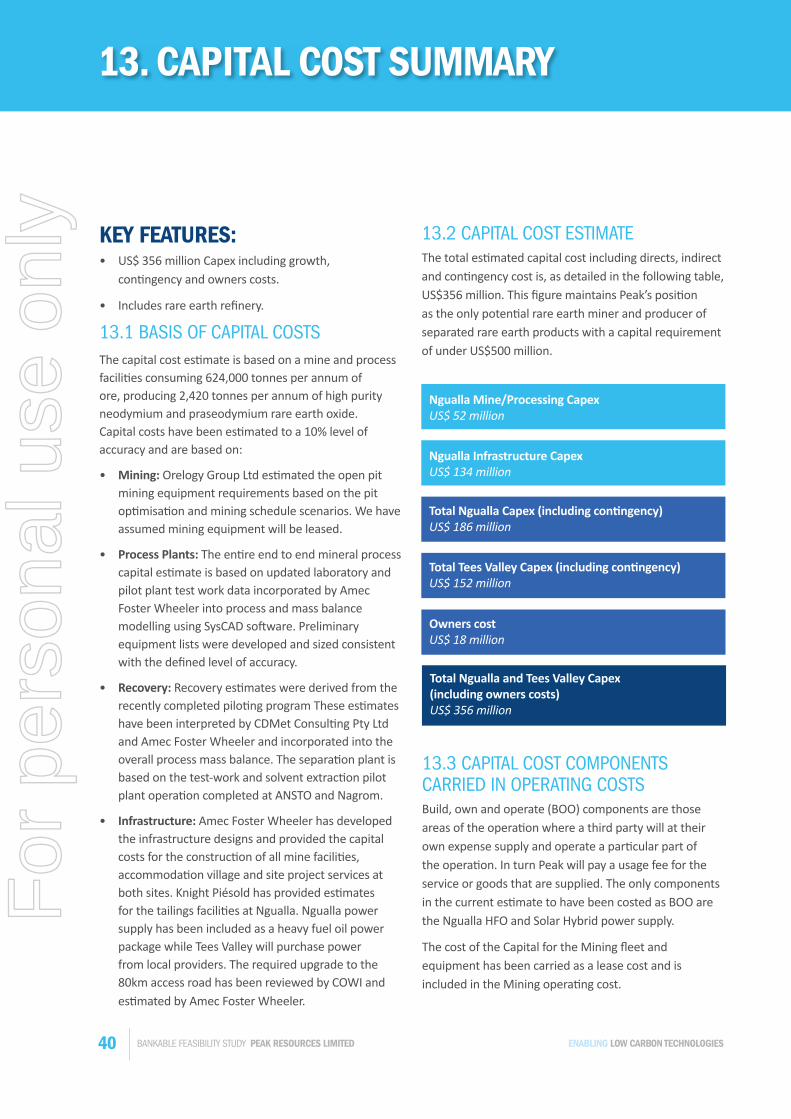
40 BANKABLE FEASIBILITY STUDY PEAK RESOURCES LIMITED ENABLING LOW CARBON TECHNOLOGIES
13. CAPITAL COST SUMMARY
KEY FEATURES:• US$ 356 million Capex including growth,
contingency and owners costs.
• Includes rare earth refinery.
13.1 BASIS OF CAPITAL COSTSThe capital cost estimate is based on a mine and process facilities consuming 624,000 tonnes per annum of ore, producing 2,420 tonnes per annum of high purity neodymium and praseodymium rare earth oxide. Capital costs have been estimated to a 10% level of accuracy and are based on:
• Mining: Orelogy Group Ltd estimated the open pitmining equipment requirements based on the pit optimisation and mining schedule scenarios. We haveassumed mining equipment will be leased.
• Process Plants: The entire end to end mineral processcapital estimate is based on updated laboratory andpilot plant test work data incorporated by AmecFoster Wheeler into process and mass balance modelling using SysCAD software. Preliminaryequipment lists were developed and sized consistentwith the defined level of accuracy.
• Recovery: Recovery estimates were derived from therecently completed piloting program These estimateshave been interpreted by CDMet Consulting Pty Ltdand Amec Foster Wheeler and incorporated into theoverall process mass balance. The separation plant isbased on the test-work and solvent extraction pilotplant operation completed at ANSTO and Nagrom.
• Infrastructure: Amec Foster Wheeler has developedthe infrastructure designs and provided the capitalcosts for the construction of all mine facilities,accommodation village and site project services atboth sites. Knight Piésold has provided estimatesfor the tailings facilities at Ngualla. Ngualla powersupply has been included as a heavy fuel oil powerpackage while Tees Valley will purchase powerfrom local providers. The required upgrade to the80km access road has been reviewed by COWI andestimated by Amec Foster Wheeler.
13.2 CAPITAL COST ESTIMATEThe total estimated capital cost including directs, indirect and contingency cost is, as detailed in the following table, US$356 million. This figure maintains Peak’s position as the only potential rare earth miner and producer of separated rare earth products with a capital requirement of under US$500 million.
13.3 CAPITAL COST COMPONENTS CARRIED IN OPERATING COSTSBuild, own and operate (BOO) components are those areas of the operation where a third party will at their own expense supply and operate a particular part of the operation. In turn Peak will pay a usage fee for the service or goods that are supplied. The only components in the current estimate to have been costed as BOO are the Ngualla HFO and Solar Hybrid power supply.
The cost of the Capital for the Mining fleet and equipment has been carried as a lease cost and is included in the Mining operating cost.
Ngualla Mine/Processing Capex US$ 52 million
Ngualla Infrastructure CapexUS$ 134 million
Total Ngualla Capex (including contingency) US$ 186 million
Total Tees Valley Capex (including contingency) US$ 152 million
Total Ngualla and Tees Valley Capex (including owners costs) US$ 356 million
Owners cost US$ 18 million
For
per
sona
l use
onl
y

41PEAK RESOURCES LIMITED BANKABLE FEASIBILITY STUDYENABLING LOW CARBON TECHNOLOGIES
13. CAPITAL COST SUMMARY (continued)
13.4 GROWTH AND CONTINGENCYContingency is defined as the amount added to a cost estimate to allow for items, conditions, or events for which the state, occurrence, or effect is uncertain and that experience shows will likely result, in aggregate, in additional cost.
For the Study the following engineering growth and contingency figures were used:Ngualla: US$ 28 million (15%)Tees Valley: US$ 23 million (15%)
The contingency provision makes allowance for suchfactors as:• Planning and estimating omissions
• Minor price fluctuations
• Design developments and changes within the scope
• Variations in market conditions
• Material and labour rate accuracy
13.5 EXECUTION STRATEGYWhere practical, the processing plant will be modularised, prefabricated off site and skid mounted to allow for fast, efficient construction and installation on site.
This technique will reduce the amount of skilled labour required on-site during construction as well as improve the quality control of the equipment to ensure a smooth ramp-up period. Peak plans to undertake a
number of different contracting strategies for each section of the project to reduce project costs and better control project risks. In areas such as the access road, local Tanzanian contracting companies have been approached to undertake the construction on a design and build contracting basis directly for Peak. In areas requiring greater technical ability such as the separation and recovery plants, it is envisaged that an EPC or EPCM contracting strategy will be used.
For
per
sona
l use
onl
y

42 BANKABLE FEASIBILITY STUDY PEAK RESOURCES LIMITED ENABLING LOW CARBON TECHNOLOGIES
14. OPERATING COST SUMMARY
KEY FEATURES:• Lowest separated oxide unit production cost of all
comparable development projects.
• Operating cost of US$ 34.20 kg NdPr 2N high purity separated oxide.
• Low cost reagents, energy and environmental costs,resulting in total annual Opex of US$ 83 million.
Costs are LOM after start-up.
Figure 14.1: Average Operating cost summary for the life of mine after start-up by category.
Mining
9%
Concentrate Transport
11%
Services: Tees Valley
Process: Tees Valley
33%
11%Process: Ngualla
23%
Services: Ngualla
13%
For
per
sona
l use
onl
y

43PEAK RESOURCES LIMITED BANKABLE FEASIBILITY STUDYENABLING LOW CARBON TECHNOLOGIES
14.1 MINING COSTSThe operating costs for mining and haulage were developed by Orelogy Group Ltd. The mining costs include drilling, blasting, grade control, fuel, labour, load and haul.
14.2 PERSONNELPersonnel requirements for management, operations and maintenance have been estimated by Orelogy, Amec Foster Wheeler and Peak. All personnel costs are fully loaded and inclusive, where applicable of all taxes and statutory charges, travel and site accommodation. A breakdown of employee numbers by area is shown in Table 14.1 below.
AREA NUMBER OF PERSONNEL (NGUALLA)
NUMBER OF PERSONNEL (TEES VALLEY)
Mining 50 -
Beneficiation 112 -
Recovery - 45
Separation - 46
Site Services 47 38
TOTAL EMPLOYEES 209 129
14.3 POWERElectrical power consumption has been calculated across the process plants by Amec Foster Wheeler from the preliminary mechanical equipment lists including estimates for infrastructure power requirements. Power rates per kWh are based on a hybrid solar and heavy fuel oil power plant BOO package similar to other Tanzanian operations.
For Tees Valley, energy pricing is based on purchasing power and piped natural gas.
Table 14.1: Personnel numbers by area
14.4 REAGENTSReagent consumption is based on pilot plant test-work results and the associated updated SysCAD mass balance model.
For Ngualla, reagents rates are based on quoted prices ex-China and South Africa, with some items including costs landed in Dar es Salaam. Shipping and transport costs by road of reagents to site are included in the total reagent cost.
For Tees Valley, reagent rates are based on quoted prices delivered to UK / Europe plus transport to site. The UK site has excellent access to ChlorAlkali and by-product Hydrochloric Acid (HCl). As shown in the Figure 14.2 HCl makes up the largest single portion of the total reagent costs.
14. OPERATING COST SUMMARY(continued)
For
per
sona
l use
onl
y

44 BANKABLE FEASIBILITY STUDY PEAK RESOURCES LIMITED ENABLING LOW CARBON TECHNOLOGIES
14. OPERATING COST SUMMARY (continued)
Figure 14.2: Annual reagent cost breakdown
14.5 CONSUMABLESEstimated costs associated with concentrate and product packaging, replacement of mill liners, grinding media, filter cloths, demineralised water, cooling tower and boiler chemicals, natural gas (Tees Valley) and over the fence services (Tees Valley) have been provided by Amec Foster Wheeler. An allowance for site safety and other general consumables has been made by Amec Foster Wheeler, included as part of salary on costs.
14.6 MAINTENANCEMaintenance costs for each part of the process are factored from the direct capital cost of the equipment. Factors range depending on the location of the equipment and area process conditions and averaging approximately 3% per annum.
14.7 GENERAL ADMINISTRATIONGeneral administration costs have been detailed for each site.
14.8 CONCENTRATE TRANSPORTConcentrate transport costs based on road haulage and shipping rates and have been obtained by Peak and Amec Foster Wheeler and include transport from Ngualla to Dar es Salaam port, port loading and port clearing fees, wharfage, sea freight to UK / Europe and destination port clearing fees plus road haulage to Tees Valley.
Flotation Reagents 28%
Hydrochloric Acid 26%
Sodium Carbonate 13%
Sodium Hydroxide 13%
Oxalic Acid 9%
Extractant 5% Other 2%
Hydrated Lime 4%
For
per
sona
l use
onl
y

45PEAK RESOURCES LIMITED BANKABLE FEASIBILITY STUDYENABLING LOW CARBON TECHNOLOGIES
15. PROJECT ECONOMICS
• A long life and profitable project with an annual free cash flow (post tax and royalties) of US $104 million over 30 years.
• Attractive NPV10 of US $676 million pre-tax and royalties.• Project IRR of 25% pre-tax and royalties.The forecast cumulative US $3.01 billion cash flow generated (post tax and royalties) by the consolidated project over the 30 year life (Figure 15.1 below) demonstrates the strategic nature of the project to the supply of key rare earths and the potential for a long life, cash flow generating business.
The BFS has demonstrated a technically robust, de-risked project with strong financial metrics that is well aligned to market demand. The financial evaluation of project economics at the stated assumptions in the BFS and Ore Reserve estimate are summarised in Table 15.1 and include:
Figure 15.1: Annual operational cash flow (EBITDA) over the 30 year life of the project.
REVENUE TOTAL CAPITAL TOTAL OPERATING COSTS CASHFLOW FROM OPERATIONS (EBITDA)
350
250
150
50
-50
-150
-250
-350
US$
MIL
LIO
N
1 2 3 4 5 6 7 8 9 10 11 12 13 14 15 16 17 18 19 20 21 22 23 24 25 26 27 28 29 30 31 32
Compliance Statements Production, costs and financial analysis are reported on a 100% owned basis (Peak hold 75%).
The production target and schedule on which the financial information is based is in turn based on the Ore Reserve estimate and stated Material Assumptions in ASX Announcement “Ngualla Rare Earth Project – Updated Ore Reserve” of 12 April 2017 and those stated within this BFS Executive Summary report.
Price deck assumptions on which the financial evaluation is based are derived from a review of a range of forecasts by respected independent industry analysts. A pricing position was selected for the BFS within the projected ranges of these experts.
The 100% Project funding requirement is estimated at approximately US $391 million, comprising Capex of US $356 million and a maximum working capital requirement of US $35 million.
Peak will require new funding for its 75% share in the Ngualla Project to achieve the stated financial outcomes, which will result in some dilution of existing shares, the quantum of which will depend on the final debt to equity ratio of the project finance package, which has yet to be arranged.
For
per
sona
l use
onl
y

46 BANKABLE FEASIBILITY STUDY PEAK RESOURCES LIMITED ENABLING LOW CARBON TECHNOLOGIES
15. PROJECT ECONOMICS (continued)
PRODUCTION ASSUMPTIONSLife of Mine 30 YearsAverage Life of Mine REO Grade 4.80%Life of Mine Strip Ratio (Waste: Ore) 1.77Average Mill Throughput 624,000 tpaAverage REO Mineral Concentrate Production 28,300 tpaAverage NdPr Mixed Oxide 2N Production 2,420 tpaAverage La Oxide Equivalent Production (final product: 6,940 tpa Carbonate) 3,650 tpaAverage Ce Oxide Equivalent Production (final product: 3,005 tpa Carbonate) 1,660 tpaAverage SEG and Mixed Heavy Oxide Equivalent Production (final product: 530 tpa Carbonate) 280 tpa
OPERATING COSTSAverage Operating Cost to Mine Gate US$ 46m p.aAverage Tees Valley Refinery Operating Cost to Final Product US$ 37m p.aTotal Consolidated Operating Cost to Final Product US$ 83m p.aTotal Consolidated Operating Cost/kg (NdPr Mixed Oxide 2N#) US$ 34.20/kg
CAPITAL COSTS including growth and contingencyNgualla (Mine and Process) US$ 52 millionNgualla (Infrastructure) US$ 134 millionTees Valley Refinery US$ 152 millionOwners Costs US$ 18 millionTotal Capital Pre-Production US$ 356 millionAverage Annual Consolidated Sustaining Capital US$ 5 million
FINANCIAL METRICSConsolidated Total Revenue US$ 6.76 billionConsolidated Average Annual Revenue US$ 228m p.aTotal Consolidated (Post Tax) Cash Generation US$ 3.01billionAnnual Average Consolidated (Post Tax) Cashflow US$ 104 m p.aAverage Annual EBITDA US$ 145 m p.aNPV8 - Pre Tax and Royalties US$ 930 millionNPV8 - Post Tax and Royalties US$ 633 millionNPV10 - Pre Tax and Royalties US$ 676 millionNPV10 - Post Tax and Royalties US$ 445 millionIRR - Pre Tax and Royalties 25%IRR - Post Tax and Royalties 21%Operating Margin 64%Payback Period (from Start of Operations) 5 Years
COMMODITY PRICE ASSUMPTIONS average LoMNdPr Mixed Oxide 2N Min 75% Nd2O3 US$ 85.00/kgLanthanum Rare Earth Oxide Equivalent US$ 4.41/kgCerium Rare Earth Oxide Equivalent US$ 2.25/kgSEG Mixed Heavy Oxide Equivalent US$ 8.00/kg
Table 15.1: Key Study Outcomes and Assumptions
For further detail on project metrics and assumptions please see the sections of this report and the Ore Reserve ASX Announcement “Ngualla Rare Earth Project – Updated Ore Reserve” of 12 April 2017. Annual average statistics are at steady state, post ramp up. #2N=99% purity
For
per
sona
l use
onl
y

47PEAK RESOURCES LIMITED BANKABLE FEASIBILITY STUDYENABLING LOW CARBON TECHNOLOGIES
15. PROJECT ECONOMICS (continued)
Compared to other rare earth projects, Ngualla has lower capital investment requirements and, thanks to a unique combination of favourable physical attributes and the improved processing route selected, enviably low operating costs that will make it cost competitive with Chinese production.
Ngualla’s favourable project economics are in part driven by the high NdPr grade and advantageous mineralogy of the rare earth deposit itself, together with the development of an extraction and purification process that targets the higher value rare earths whilst rejecting the majority of the lower value cerium. The location of the refinery in proximity to sources of inexpensive bulk reagents and existing utilities is also a key driver of lower Opex.
With the alignment of products and value drivers to the high demand magnet metal market the project is in a favourable position in terms of marketing and future demand for its products which will represent less than 5% of total world demand.
Project Sensitivity Analysis Based on the sensitivity analysis, the key drivers of the Projects economics are rare earth recovery, ore grade and price of the main revenue driver, NdPr.
Key project sensitivities to NPV (+/- 10%) are as follows:
Base Case: NPV10 US$ 676m
Process RecoveryNdPr PriceOre Grade
Operating CostCapital Cost
Reagent PricesLabour CostsPower Costs
Concentrate Transport CostsMining Costs
Strip Ratio
500 550 600 650 700 750 800 850
For
per
sona
l use
onl
y

48 BANKABLE FEASIBILITY STUDY PEAK RESOURCES LIMITED ENABLING LOW CARBON TECHNOLOGIES
15. PROJECT ECONOMICS (continued)
The comprehensive piloting of the beneficiation leach recovery and separation processes using bulk samples of mineralisation from Ngualla has mitigated process recovery risk. The Ore Reserve is based on a high confidence and well defined Mineral Resource estimate, 89% of which is in the highest Measured JORC 2012 category, which similarly minimises the potential for variance. The Project NPV is not particularly sensitive to capital costs due to the high cash flows expected to be generated. The remaining driver to project economics is NdPr pricing, which is underpinned by the predicted demand increase in the magnet metals as discussed in the Marketing section of this report.
Figures 15.2 to 15.4 following illustrate three key Project financial metrics:
• Average annual Free Cash Flow (post ramp up)• NPV10
and • IRR against changes in the BFS NdPr price assumptions flexed by +/-30%. Recent actual prices for rare earths over the last six years since January 2011 from Asian Metal are shown in Figure 12.5 on page 37. The three sensitivity graphs following illustrate robust project economics in the face of 30% variances in the BFS NdPr pricing assumptions.
Figure 15.2: Ngualla Project average life of mine post ramp-up free cash flow (post tax and royalties) vs NdPr price.
Aver
age
Annu
al
Free
Cas
h (U
S$m
)
Annual Free Cash vs NdPr Price
0
20
40
60
80
100
120
140
160
50 60 70 80 90 100 110 120
-30%
+30%
BFS
NdPr Price (US$/kg)
For
per
sona
l use
onl
y

49PEAK RESOURCES LIMITED BANKABLE FEASIBILITY STUDYENABLING LOW CARBON TECHNOLOGIES
15. PROJECT ECONOMICS (continued)
Figure 15.3: Pre Tax NPV10 vs NdPr Price
Figure 15.4: Ngualla Project Pre Tax IRR vs NdPr price
IRR
(%)
Pre Tax IRR vs NdPr Price
25%
35%
20%
30%
15%
10%
5%
0%
NdPr Price (US$/kg)
NPV
(US$
m)
Pre Tax NPV10 vs NdPr Price
NdPr Price (US$/kg)
0
200
400
600
800
1000
1200
1400
50
50
60
60
70
70
80
80
90
90
100
100
110
110
120
120
-30%
-30%
+30%
+30%
BFS
BFS
For
per
sona
l use
onl
y

50 BANKABLE FEASIBILITY STUDY PEAK RESOURCES LIMITED ENABLING LOW CARBON TECHNOLOGIES
16. OVERVIEW OF THE PEAK TEAM
Peak is fortunate to have an extremely well credentialed executive team supported by a quality Board of directors and senior advisers rarely found at a company of Peak’s size. During the completion of the BFS, Peak was able to add two key appointments to the executive team who possess significant operational and commercial rare earth experience, and have extensive industry networks. Peak was able to capitalise on this know-how during the engineering design and BFS process. The current team places Peak in an enviable position versus other aspiring rare earth development projects.
Further details of the members of the executive team.
DARREN TOWNSEND B.ENG (MINING-HONS), EMBA Managing Director, Peak Resources Limited• Extensive East African experience
incl. development of tantalum mine in Mozambique and resource drill out and permitting a niobium project in Kenya.
• Mining Engineer with 25 years' mining and corporate experience.
• Extensive experience in managing and financing ASX and TSX listed companies.
• Commercial experience generating and consummating Company transforming multi jurisdictional deals.
DAVE HAMMOND M.SC, DIC, B.SC (HONS), MAUSIMM Technical Director, Peak Resources Limited and COO Tanzania• Extensive experience working and operating in Tanzania since 2010.• Exploration Manager with
25+ years' technical and management leading teams in Africa and Australia.• Formerly held senior roles
with De Grey Mining Ltd and Sons of Gwalia. Previously with
Billiton/Gencor in Africa.
MICHAEL PRASSAS GM Sales, Marketing & Business Development• Former Global Account Manager
Automotive Catalysis /Sales Manager of Rare Earth Systems for Solvay, responsible for sales of Rare Earth Mixed Oxides in Europe and Africa.
• Over 15 years’ experience in sales and business development.
• Management skills include budget responsibility, project management, building stakeholder relationships and competing priorities in deadline-driven environments.
GRAEME SCOTT FCCA (UK) CFO & Company Secretary• Has spent the last 12 years
working in the resources sector in CFO and Company Secretarial roles for both ASX and TSX listed companies.
• Previous experience at senior managment level with multi-national blue chip companies.
• More than 20 years’ experience in professional and corporate roles in both Australia and the UK.
ROCKY SMITH B.SC (CHEM)COO Project Development• Previously Managing Director
of Molycorp’s Mountain Pass Rare Earth Complex from 2009 to 2015.
• Achievements include the delivery of successful expansions resulting in a 230% increase in production capacity over a three year period as well as managing of operation budget in excess of US$150 million.
• Chemist with over 35 years’ operations and senior management experience in the mineral processing and chemical engineering sectors.
SENIOR MANAGEMENT
For
per
sona
l use
onl
y

51PEAK RESOURCES LIMITED BANKABLE FEASIBILITY STUDYENABLING LOW CARBON TECHNOLOGIES
16. OVERVIEW OF THE PEAK TEAM (continued)
JOHN JETTER B.LAW, B.ECON, INSEAD Non-Executive Director, Peak Resources Limited• Experience in negotiating and
executing rare earth off-take agreements.
• Extensive international finance and M&A experience.
• Former Managing Director, CEO and head of investment banking of JP Morgan in Germany and Austria, and a member of the European Advisory Council of JP Morgan in London.
JONATHAN MURRAY B.LAWS AND COMMERCE Non-Executive Director, Peak Resources Limited
• Partner at independent corporate law firm Steinepreis Paganin, Bachelor of Law and Commerce (majoring in accounting).
• Specialising in equity capital raisings, acquisitions and divestments, governance and corporate compliance.
PETER HAROLD B.APPSC (CHEM), AFAICD Non-Executive Chairman, Peak Resources Limited
• Currently Managing Director of Panoramic Resources. Previous senior roles with Spectrum Rare Earths, Shell Australia, Australian Consolidated Minerals Limited and Normandy Mining Limited.
• Chemist with almost 30 years' operational and corporate experience in the minerals industry specialising in financing, marketing and business development.
PAUL RUPIA MPA, BOA (POLITICS) Special Advisor to Peak Resources Limited• Has served in the Government
of Tanzania at senior levels as Chief Secretary in the President’s Office, Secretary to the Cabinet, Head of Civil Service, Principal Secretary in the Ministry of Foreign Affairs, Permanent Representative of Tanzania to the United Nations, Ambassador to Ethiopia and Deputy High Commissioner in the United Kingdom.
• Currently Chairman of DCB Commercial Bank Plc since 2002.
KIBUTA ONGWAMUHANA B.LAW, M.LAW, PHD Non-Exective Director, PR NG Minerals Limited• Leading Tanzanian legal
practitioner who specialises in taxation and corporate law.
• Managing partner of the legal firm, Ako Law in Dar es Salaam and an Advocate of the High Court and Court of Appeal as well as legal consultant to a number of government, non-government and private business organisations.
In addition the Project is also able to call upon the extensive experience and expertise within the teams of Peak’s strategic partners in the Project; Appian and IFC (refer Section 18 Strategic Partners for further details).
DIRECTORS
For
per
sona
l use
onl
y

52 BANKABLE FEASIBILITY STUDY PEAK RESOURCES LIMITED ENABLING LOW CARBON TECHNOLOGIES
17. KEY OPPORTUNITIES
17.1 RARE EARTH PROJECT EXPANSIONThe large size of the Weathered Bastnaesite Zone Mineral Resource and the long life of the operation offer opportunities for the expansion of production once markets for Ngualla’s products are established. With the Weathered Bastnaesite Zone comprising just 22% of the Total rare earth Mineral Resources at Ngualla, there may be the opportunity to extend the operation’s life past the current 30 years indicated by the Study, or to increase production through the development of processes to treat some of the remaining mineralisation styles. Additional rare earth mineralisation has also been identified by wide spaced drilling in the Northern Zone
Figure 17.1: Significant grades and widths of niobium, fluorite and phosphate have been identified by drilling and trenching and is as yet only sparsely tested. Barite forms 38% of the host rock for the Weathered Bastnaesite Zone rare earth Mineral Resource and also may have potential as a by-product from rare earth processing.
and very recently by reconnaissance trench sampling (see fluorite section below) in February 2017 within the hills surrounding the carbonatite, that has yet to be evaluated further (Figure 17.1).
17.2 THE BARITE OPPORTUNITYBarite presents a future potential additional opportunity for incremental revenue streams from the Ngualla project. Depending on the successful outcome of a sustainable barite business case including a technical route to produce the required customer specifications the Company may consider entering the business of selling a chemical or a drilling grade barite.
For
per
sona
l use
onl
y

53PEAK RESOURCES LIMITED BANKABLE FEASIBILITY STUDYENABLING LOW CARBON TECHNOLOGIES
17. KEY OPPORTUNITIES (continued)
What is Barite? Barite (barium sulphate, BaSO4) is an industrial mineral with a high density used predominantly (an estimated 80%) as a weighting agent in fluids used in the drilling of oil and natural gas wells. Barite is preferred as it is non-abrasive, insoluble and non-toxic.
What are the applications?Drilling Grade Drilling fluid performs three primary functions: to pressurise the oil well; to cool the temperature of the drill bit; and to suspend the cuttings produced by the drill, which are then carried up to the surface. Barite also is used in the medical, construction, paints and plastics and automotive industries.
The American Petroleum Industry (API) sets the specifications for standard drilling grade barite in terms of specific gravity, barite purity, particle size and maximum allowable impurity levels. The US Environment Protection Agency also sets standards for drilling grade barite. Together these standards typically define required product specifications for drilling grade barite and include a minimum 90% barite content at 4.2mg/cm3 with a maximum allowable residue greater than 75µm of 3%, a maximum of 30% of particles being below 6µm. Levels of mercury and cadmium must be low at 1ppm and 3ppm respectively and there are limits on the allowable levels of water soluble metals such as calcium.
OTHER APPLICATIONS Non petroleum industry applications include as a filler, extender, or weighting agent in products such as paints, plastics, and rubber. Some specific applications include use in automobile brake and clutch pads, automobile paint primer for metal protection and gloss, use as a weighting agent in rubber, and in the cement jacket around underwater petroleum pipelines. In the metal-casting industry, barite is part of the mould-release compounds. Because barite significantly blocks x-ray and gamma-ray emissions, it is used as aggregate in high-density concrete for radiation shielding around x-ray units in hospitals, nuclear power plants, and university nuclear
research facilities. Ultrapure barite consumed as liquid is used as a contrast medium in medical x-ray examinations.
What about the market and pricing history? Industrial Minerals (IM) quotes barite pricing on their website and this pricing is sometimes used as a guide within the industry. However, the pricing is not transparent and the sources for this ‘bid and offer’ pricing are not disclosed. Typical prices for 4.2 grade API barite drilling powder were around US $115 to US $135 per tonne in 2016, depending on the FOB port. Other applications of higher purity barite with specific whiteness grades used in the paint industry have a higher value at US $ 200 to US $250 per tonne. Prices are currently at a five year low as a results of reduced demand from the oil industry, demand levels being closely related to oil and gas drill rig activity. A more positive outlook is forecast for the next few years with a predicted upsurge in drilling activity driving demand back up to previous levels. (Source: US Geological Survey, British Geological Survey and industry sources).
17.3 POTENTIAL FOR ADDITIONAL COMMODITIES FROM NGUALLA
In addition to rare earths, the Ngualla Carbonatite is host to several other additional mineral occurrences, which may have the potential to provide diversification to Ngualla’s rare earth products with further work in the future. Carbonatite geological complexes are well known for their multi-commodity potential, the leading example being the large Palabora mine in South Africa, which produces or has produced a range of commodities including copper, sulphuric acid, magnetite, vermiculite, nickel sulphate, apatite, cobalt, zirconium as well as by-product gold, silver and platinum.
Barite (barium sulphate, BaSO4) may have future potential as a by-product of rare earth production at Ngualla. There is 8 million tonnes of contained barite within the Weathered Bastnaesite Zone at Ngualla at an average grade of 38% barite, which is upgraded to a 90% barite stream during the rare earth processing (see Mineral Resource section of this report).
Encouraging grades of near surface niobium, phosphate
For
per
sona
l use
onl
y

54 BANKABLE FEASIBILITY STUDY PEAK RESOURCES LIMITED ENABLING LOW CARBON TECHNOLOGIES
and rare earth mineralisation were intersected over an area of more than 1km x 1km by wide spaced reconnaissance drilling to the north of the Bastnaesite Zone in 2012 (Figure 17.1) with no further follow-up completed as yet (ASX Announcement “Final drill results – Ngualla Rare Earth Project” dated 15 February 2012). The better intersections for each commodity returned from this Northern Zone include:
DRILL HOLE INTERSECTION
NRC140 18m at 1.16% Nb2O5 from 18m and
22m at 1.32% Nb2O5 from 50m and
66m at 1.56% REO from 10m
NRC154 58m at 21.1% P2O5 from 4m
The recent discovery (ASX Announcement “Wide Zones of high grade fluorite identified at Ngualla” dated 20 February 2017) of wide high grade zones of fluorite mineralisation in the relatively unexplored hills surrounding the carbonatite is a high priority for further evaluation and may present the potential for production of fluorspar from Ngualla if additional work continues to be successful. The better fluorite and rare earth intervals from these trenches were:
TRENCH INTERVAL
NCS011 78m at 37% fluorite from 0m to end of trench
NCS012 53m at 2.37% REO from 61m to end of trench
17.4 INCREASED RECOVERY AND GRADE OF FLOTATION PROCESS
The flotation process in any rare earth process is a usual area for improvement and the Ngualla Project is no exception. Every deposit has its unique aspects and the best operators are diligent to unlock these aspects and optimize the process to drive for best overall economics.
17. KEY OPPORTUNITIES (continued)
The opportunities include better understanding of the mix of mineralisation within the deposit and the ability to adapt the specific treatment opportunities, including pH, temperature and reagent dosage and types. A pilot sized unit will be installed to facilitate the testing of specific ore types and upcoming ore blends in front of the production unit. Close cooperation between geologists and metallurgists is critical to developing an understanding of the effects of the different mineralisation inherent in the Ngualla deposit.
Continuous on-line sampling and analysis of the flotation process will give continuous feedback on the performance of the process. This will be key to identifying short interval control options to optimise process performance. Other technology being reviewed includes bubble imaging, using high definition cameras to evaluate instantaneous flotation conditions in critical points in the flotation process.
Process optimisation starts on day one and the current list of opportunities includes; better flotation performance (Ore type, grade and recovery), optimised control on cerium recovery via calciner/leach operation (including lower energy and reagent consumption), improved waste management and water consumption.
Additionally, we continue to reach out to rare earth flotation experts around the globe in an effort to ensure we keep an open door to even further opportunities.
For
per
sona
l use
onl
y

55PEAK RESOURCES LIMITED BANKABLE FEASIBILITY STUDYENABLING LOW CARBON TECHNOLOGIES
18. STRATEGIC PARTNERS
About AppianAppian Natural Resources Fund is a private equity fund which has been established to invest specifically in the metals and mining sector. Appian has a uniquely collaborative investment approach that seeks to partner with local owners, managers and investors to leverage its world-class operational and corporate finance expertise.
Appian was established by ex-Anglo American, Rio Tinto, JPMorgan and Bain Capital individuals, collectively holding over 200 years of industry experience and a deep understanding of mine development and investment. This experienced team is complementary to Peak having built and managed 60+ operating mines (30 in Africa) and acted on US $200 billion of mining corporate development transactions.
A collaborative cornerstone investor with a value-add approach and long-term investment horizon, Appian is focussed on achieving technical milestones and long term value creation for the investors and other stakeholders of both the Company and Appian.
For more information, visit: appiancapitaladvisory.com
About IFCIFC, a member of the World Bank Group, is the largest global development institution focused exclusively on the private sector. Working with private enterprises in about 100 countries, IFC use their capital, expertise and influence to help eliminate extreme poverty and boost shared prosperity. In FY14, IFC provided more than US $22 billion in financing to improve lives in developing countries and tackle the most urgent challenges of development.
IFC has wide experience over 50+ years in international mining finance and demands best practice social and environmental standards. To date IFC have invested over US $400 million in Tanzania.
For more information, visit: ifc.org
100%
100%
PEAK AFRICAN MINERALS
75%20% 5%
PR NG MINERALS LTD
NGUALLA RARE EARTH PROJECT TEES VALLEY REFINERY PROJECT
i re 1 .1: nvest ent tr ct re.
100%
ote: ercenta es have been ro n e
For
per
sona
l use
onl
y
56 BANKABLE FEASIBILITY STUDY PEAK RESOURCES LIMITED ENABLING LOW CARBON TECHNOLOGIES
19. COMPETENT PERSONS' STATEMENTS
The information in this report that relates to exploration results is based on information compiled and/or reviewed by David Hammond, who is a Member of the Australasian Institute of Mining and Metallurgy. David Hammond is the Technical Director of the Company. He has sufficient experience which is relevant to the style of mineralisation and type of deposit under consideration and the activity which he is undertaking to qualify as a Competent Person in terms of the Australasian Code for Reporting of Exploration Results, Mineral Resources and Ore Reserves (the JORC Cade, 2012 edition). David Hammond consents to the inclusion in the report of the matters based on his information in the form and contest in which it appears.
The information in this report that relates to the Mineral Resource estimates is based on work conducted by Rod Brown of SRK Consulting (Australasia) Pty Ltd, and the work conducted by Peak Resources, which SRK has reviewed. Rod Brown takes responsibility for the Mineral Resource estimate. Rod Brown is a Member of the Australasian Institute of Mining and Metallurgy and has sufficient experience that is relevant to the style of mineralisation and type of deposit under consideration, and to the activities undertaken, to qualify as competent Person in terms of the Australasian Code for the Reporting of Exploration Results, Mineral Resources and Ore Reserves (JORC Code, 2012 edition). Rod Brown consents to the inclusion of such information in this report in the form and context in which it appears.
The information in this report that relates to Ore Reserve estimates was based on information compiled by Ryan Locke, a Principal Consultant with Orelogy Consulting Pty Ltd, Orelogy are an independent consultant to Peak Resources. Ryan Locke, who is a Member of the Australasian Institute of Mining and Metallurgy, has sufficient experience that is relevant to the style of mineralization and type of deposit under consideration and to the activity being undertaken to qualify as a competent Person as defined in the 2012 edition of the ‘Australasian Code for Reporting of Exploration Results, Mineral Resources and Ore Reserves’. Ryan Locke consents to the inclusion in the report of the matters based on his information in the form and context in which it appears.
The information in this report that relates to metallurgical test work results is based on information compiled and / or reviewed by Gavin Beer who is a Member of the Australasian Institute of Mining and Metallurgy and a chartered Professional. Gavin Beer is a Metallurgical Consultant and has sufficient experience relevant to the activity which he is undertaking to be recognised as competent to compile and report such information. Gavin Beer consents to the inclusion in the report of the matters based on his information in the form and context in which it appears.
The information in this report that relates to infrastructure, project execution and cost estimating is based on information compiled and / or reviewed by Lucas Stanfield who is a Member of the Australasian Institute of Mining and Metallurgy. Lucas Stanfield is the General Manager - Development for Peak Resources Limited and is a Mining Engineer with sufficient experience relevant to the activity which he is undertaking to be recognised as competent to compile and report such information. Lucas Stanfield consents to the inclusion in the report of the matters based on his information in the form and context in which it appears.
For
per
sona
l use
onl
y

57PEAK RESOURCES LIMITED BANKABLE FEASIBILITY STUDYENABLING LOW CARBON TECHNOLOGIES
APPENDIX
Rare earth oxidesREO Grade (%) % of Total REO
Measured Indicated Inferred All Measured Indicated Inferred All
Lanthanum La2O3 1.309 1.345 1.200 1.310 27.57 27.72 27.09 27.58Cerium CeO2 2.292 2.339 2.128 2.293 48.28 48.18 48.04 48.27
Praseodymium Pr6O11 0.227 0.231 0.213 0.227 4.77 4.75 4.82 4.77Neodymium Nd2O3 0.783 0.799 0.763 0.784 16.48 16.45 17.23 16.50Samarium Sm2O3 0.076 0.078 0.071 0.076 1.60 1.61 1.60 1.60Europium Eu2O3 0.014 0.014 0.013 0.014 0.30 0.29 0.29 0.29
Gadolinium Gd2O3 0.029 0.030 0.027 0.029 0.62 0.61 0.61 0.61Terbium Tb4O7 0.002 0.002 0.002 0.002 0.05 0.05 0.05 0.05
Dysprosium Dy2O3 0.004 0.004 0.003 0.004 0.07 0.07 0.07 0.07Holmium Ho2O3 0.000 0.000 0.000 0.000 0.01 0.01 0.01 0.01Erbium Er2O3 0.002 0.002 0.002 0.002 0.03 0.04 0.04 0.03Thulium Tm2O3 0.000 0.000 0.000 0.000 0.00 0.00 0.00 0.00
Ytterbium Yb2O3 0.001 0.001 0.000 0.001 0.01 0.01 0.01 0.01Lutetium Lu2O3 0.000 0.000 0.000 0.000 0.00 0.00 0.00 0.00Yttrium Y2O3 0.010 0.010 0.007 0.010 0.20 0.20 0.16 0.20
Total REO* REO 4.75 4.85 4.43 4.75 100.00 100.00 100.00 100.00
Table 1: Weathered Bastnaesite Zone Resource +1% REO. Individual rare earth oxide grades and percentages of total REO.
Rare earth oxidesREO Grade (%) % of Total REO
Measured Indicated Inferred All Measured Indicated Inferred All
Lanthanum La2O3 0.704 0.501 0.560 0.587 26.99 27.73 26.08 27.25Cerium CeO2 1.262 0.871 1.022 1.039 48.38 48.17 47.61 48.23
Praseodymium Pr6O11 0.125 0.087 0.105 0.104 4.81 4.80 4.90 4.81Neodymium Nd2O3 0.429 0.285 0.360 0.348 16.44 15.75 16.75 16.16Samarium Sm2O3 0.043 0.030 0.040 0.036 1.66 1.64 1.88 1.66Europium Eu2O3 0.009 0.006 0.009 0.007 0.33 0.34 0.43 0.34
Gadolinium Gd2O3 0.019 0.014 0.021 0.016 0.71 0.76 0.99 0.75Terbium Tb4O7 0.002 0.001 0.002 0.001 0.06 0.07 0.09 0.07
Dysprosium Dy2O3 0.003 0.003 0.006 0.003 0.13 0.16 0.27 0.16Holmium Ho2O3 0.000 0.000 0.001 0.000 0.02 0.02 0.03 0.02Erbium Er2O3 0.001 0.001 0.002 0.001 0.05 0.06 0.09 0.06Thulium Tm2O3 0.000 0.000 0.000 0.000 0.00 0.00 0.01 0.00
Ytterbium Yb2O3 0.001 0.000 0.001 0.001 0.02 0.02 0.04 0.04Lutetium Lu2O3 0.000 0.000 0.000 0.000 0.00 0.00 0.00 0.00Yttrium Y2O3 0.011 0.009 0.018 0.010 0.40 0.48 0.82 0.47
Total REO REO 2.61 1.81 2.15 2.15 100.00 100.00 100.00 100.00
Table 2: Ngualla 2016 total Mineral resource + 1% REO. Individual rare earth oxide grades and percentages of total REO.
For
per
sona
l use
onl
y

Peak Resources Limited
ACN 112 546 700
Ground Floor, 5 Ord Street, West Perth, Western Australia 6005
PO Box 603, West Perth 6872
ASX: PEK
Telephone: +61 8 9200 5360 info peakresources.com.au
Non-Executive Chairman: Peter Harold
Managing Director: Darren Townsend
Technical Director: Dave Hammond
Non-Executive Directors: Jonathan Murray, John Jetter
Company Secretary: Graeme Scott
peakresources.com.au
For
per
sona
l use
onl
y