Embed Size (px)
DESCRIPTION
Brighton Financial Planning, Inc. 2nd Quarter Review
Citation preview

Brighton FinancialPlanning, Inc.Brighton FinancialPlanning, Inc.
Brighton Financial Planning, Inc.
Economic and Financial Market Review2nd Quarter 2009
John P. Middleton, CFA, CAIA
www.brightonfinancial.com
www.brightonperspective.typepad.com

Brighton FinancialPlanning, Inc.
U.S. Economy
2
Data Current Year Over Year Notes
Consumer Price Index (CPI) (as of June 17)
+0.1% -1.3% Largest annual decline in inflation rate since 1950
Unemployment rate (as of July 2 for June)
9.5% +4% Up from 7.2% at the end of 2008 and 5.5% a year ago
Gross Domestic Product (GDP) (June 25 for Q1)
-5.5% Better than Q4 2008's -6.3%, and slightly better than previous estimate of -5.7%
As of June 30, 1 euro equaled:
$1.40 Dollar weaker than March's $1.32
As of June 30, $1 equaled: ¥95.55 Dollar weaker than March's ¥97.29
Data Review
Source: Forefield, Inc.
Brighton FinancialPlanning, Inc.
Brighton Financial Planning, Inc.
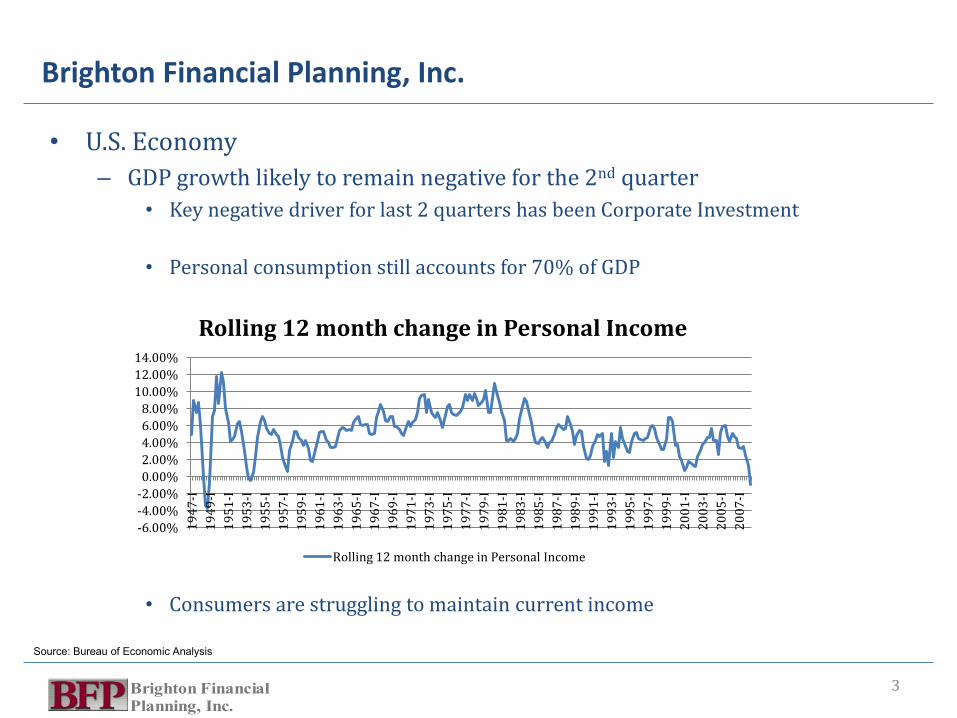
• U.S. Economy
– GDP growth likely to remain negative for the 2nd quarter
• Key negative driver for last 2 quarters has been Corporate Investment
• Personal consumption still accounts for 70% of GDP
• Consumers are struggling to maintain current income
3
-6.00%
-4.00%
-2.00%
0.00%
2.00%
4.00%
6.00%
8.00%
10.00%
12.00%
14.00%
19
47
-I
19
49
-I
19
51
-I
19
53
-I
19
55
-I
19
57
-I
19
59
-I
19
61
-I
19
63
-I
19
65
-I
19
67
-I
19
69
-I
19
71
-I
19
73
-I
19
75
-I
19
77
-I
19
79
-I
19
81
-I
19
83
-I
19
85
-I
19
87
-I
19
89
-I
19
91
-I
19
93
-I
19
95
-I
19
97
-I
19
99
-I
20
01
-I
20
03
-I
20
05
-I
20
07
-I
Rolling 12 month change in Personal Income
Rolling 12 month change in Personal Income
Source: Bureau of Economic Analysis

Brighton FinancialPlanning, Inc.
U.S. Economy
• Consumers and Corporations are not spending
• Consumers and Corporations are de-leveraging their balance sheets
– Result is higher savings and less spending
– Which leads to decline in GDP
– Government spending is up significantly but is not wealth-creating long-term
4
0500
1000150020002500
19
47
-I
19
49
-III
19
52
-I
19
54
-III
19
57
-I
19
59
-III
19
62
-I
19
64
-III
19
67
-I
19
69
-III
19
72
-I
19
74
-III
19
77
-I
19
79
-III
19
82
-I
19
84
-III
19
87
-I
19
89
-III
19
92
-I
19
94
-III
19
97
-I
19
99
-III
20
02
-I
20
04
-III
20
07
-I
Gross Private Domestic Investment (in billions)
Gross Private Domestic Investment
Source: Bureau of Economic Analysis

Brighton FinancialPlanning, Inc.
U.S. Economy
• Conclusions
– GDP growth should continue to be anemic for the near future
• 2/3rds of GDP is consumer driven and consumers are not spending
– Unemployment remains high with most growth in government jobs
– High leverage + unemployment is not good
– Consumers know this and are cutting back spending and paying down debt
• Corporations are not investing in capital
– Recovery should be driven by new capital spending
– As companies invest in new capital, employment will pick up
• Government is attempting to pick up the slack
– Not success yet and questionable as to whether it will be at all
– Can create other issues such as inflation
– Inflation and higher tax risks remains
• Government spending can be inflationary
– Unlikely to be curtailed as economy recovers
– Increase in money supply and velocity + devalued dollar create inflationary pressures
– Higher spending needs means higher income needs
5
Source: Bureau of Economic Analysis

Brighton FinancialPlanning, Inc.
Global Economy
• Global economy very dependent on U.S. economy
– U.S. is leading consumer of global supply
– However, emerging markets have suffered less than developed markets
– And, the IMF forecasts continued improvement in emerging markets
– But, decline in U.S. consumption must be offset somewhere
• Either higher consumption x U.S.
• Or reduction in supply
6
0.00
20,000.00
40,000.00
60,000.00
80,000.00
100,000.00
19
91
19
92
19
93
19
94
19
95
19
96
19
97
19
98
19
99
20
00
20
01
20
02
20
03
20
04
20
05
20
06
20
07
20
08
20
09
est
20
10
est
20
11
est
20
12
est
20
13
est
20
14
est
GDP (PPP adjusted)
World Advanced economies Emerging and developing economies
Source: Bureau of Economic Analysis

Brighton FinancialPlanning, Inc.
Global Economy
• Developed Markets have struggled much like the U.S.
• U.S. and EU (primary components of Advanced Economies)
– Ran government net deficits for much of the last 15 years
– Have increased government expenditures to combat global recession
• Emerging Markets ran surplus during early part of this decade
– Have increased spending but only deficit forecast to remain under 4%
– Suggests economic improvement will be easier and more quickly achieved
7
-10
-5
0
5
19
91
19
92
19
93
19
94
19
95
19
96
19
97
19
98
19
99
20
00
20
01
20
02
20
03
20
04
20
05
20
06
20
07
20
08
20
09
est
20
10
est
General Government Balance % of GDP
Advanced economies
European Union
Newly industrialized Asian economies
Source: Bureau of Economic Analysis

Brighton FinancialPlanning, Inc.
Global Economy
• Developed Markets also track U.S. savings
• Aggregate saving is declining and is expected to continue
– Government and private sector
• Rapid increase in government spending completely offseting private savings
• Emerging markets savings increasing rapidly since 2001
– Slight dip forecast in 09 as gov’t spending increases
8
010203040
19
91
19
92
19
93
19
94
19
95
19
96
19
97
19
98
19
99
20
00
20
01
20
02
20
03
20
04
20
05
20
06
20
07
20
08
20
09
est
20
10
est
Savings as a % of GDP
World
Advanced economies
Emerging and developing economies
Source: Bureau of Economic Analysis

Brighton FinancialPlanning, Inc.
Global Economy
• Developed markets investment flat
• Investment is key contributor to GDP improvement
– Private investment, particularly corporate capital spending will drive growth
• Emerging markets investment has improved steadily over last 6 years
– And is forecast to continue to remain well above developed markets
9
010203040
19
92
19
93
19
94
19
95
19
96
19
97
19
98
19
99
20
00
20
01
20
02
20
03
20
04
20
05
20
06
20
07
20
08
20
09
est
20
10
est
Investment as % of GDP
World
Advanced economies
Emerging and developing economies
Source: Bureau of Economic Analysis

Brighton FinancialPlanning, Inc.
Global Economy
• Conclusions
– Developed markets are struggling just as much as U.S.
• Are highly dependent on U.S. for goods and services
• Must replace U.S. demand and/or services
• Many don’t have the infrastructure to quickly offset that decline
– Emerging markets are also weak, BUT
• Had healthier balance sheets entering the recession
• Haven’t increased government spending above investment and savings
• Are more dependent on commodities consumption
– Driven by China and India currently
• Should recover more quickly than developed markets (including U.S)
10

Brighton FinancialPlanning, Inc.
Financial Markets Performance
11
Market/Index June 30 Quarterly Change
Year Over Year
DJIA 8447.00 +11.0% -25.6%
NASDAQ 1835.04 +20.0% -20.0%
S&P 500 919.32 +15.2% -28.2%
Russell 2000 508.28 +20.2% -26.3%
Global Dow 1629.31 +20.9% -34.0%
Fed. Funds .25% 0 -175 bps
2-year Treasuries 1.11% +30 bps -152 bps
10-year Treasuries
3.53% +82 bps -46 bps
Crude Oil (per barrel)
$69.82 +44% -50.1%
Spot Gold (per oz.)
$928.50 +.8% +.4%
• Equity markets rallied strongly
• Smaller cap, lower quality stocks led
• International equity participated
• All remain significantly down for 12 mos.
• Fed Funds cut sharply to combat
recession
• Short-term Treasuries have been the safe
haven for investors
• Oil rallied but well off last summer’s highs
• Gold and other precious metals have held
value
Source: Forefield, Inc.

Brighton FinancialPlanning, Inc.
Equity Markets
• Earnings continue to deteriorate
– S&P is now forecasting a trailing twelve month loss for period ending 9/30
– Trailing “As Reported” P/E at all-time high
12
0.00
10.00
20.00
30.00
40.00
50.00
60.00
70.00
12
/31
/19
36
9/3
0/1
94
0
6/3
0/1
94
4
3/3
1/1
94
8
12
/31
/19
51
09
/30
/19
55
06
/30
/19
59
03
/31
/19
63
12
/31
/19
66
09
/30
/19
70
06
/30
/19
74
03
/31
/19
78
12
/31
/19
81
09
/30
/19
85
06
/30
/19
89
03
/31
/19
93
12
/31
/19
96
09
/30
/20
00
06
/30
/20
04
03
/31
/20
08
12 MO P/E
Historic Average P/E
Rolling 5YR Ave P/E

Brighton FinancialPlanning, Inc.
Equity Markets
• Conclusions
– P/E ratios tend to trend higher as the economy emerges from recession
– S&P forecasts 2009 earnings at $29.97 per share
– Applying a P/E of 30 (trend forecast) suggests ending S&P 500 Index value of 899.10
– S&P forecasts 2010 earnings at $37.26 per share
– Applying the same P/E suggests ending S&P 500 Index value of 1,117.80
– However, P/E tends to peak 6 to 9 months after recession end
– Thus, more likely to be around 24, so S&P 500 at end of 2010 forecast = 908
13

Brighton FinancialPlanning, Inc.
Looking Ahead
• Weak U.S. economy will gradually improve over the next 18 months
• Global economy will track U.S. but with stronger recovery in EM
• Inflation remains a risk as stimulus spending enters an improving economy
• Equity markets remain flat to slightly positive as lack of leverage suggests any improvement will match earnings growth
• Fixed income markets offer mixed bag – higher inflation is not good but credit dislocation beginning in 2008 hasn’t completely resolved itself
– Inflation hedges – TIPS, Bank Loans may offer opportunities
• Emerging markets and commodities may offer better returns over next 2 years
– EM equity and fixed income
– Commodities producers, oil and gas (MLPs)
14