Embed Size (px)
Citation preview
Restricted circulation. Do not forward.
Pacific Capital Resources
July 9, 2003
Rp375 Indonesia Multifinance
An Untold Recovery Story BUY
Tjandra Kartika, CFA (65) 6749-6715 - [email protected]
BFI Finance Indonesia (BFIN IJ)
Sector FinanceJakarta Composite Index (JCI) 519.8Bloomberg Code BFIN IJ
Shares issued @ Rp500 par 681.2 Market Capitalisation Rp255.5bn / US$30.4mEstimated free Float RM255.5bn / 100.0%Book NAV/Share Rp1,170
FY end Dec 31 2001 2002 2003F 2004F 2005FTurnover (Rp bn) 133.5 192.6 271.3 335.6 395.2 Operating Profit (Rp bn) 84.7 118.0 140.7 165.6 198.9 Pretax Profit (Rp bn) 84.7 118.0 140.7 165.6 198.9 Net Profit (Rp bn) 57.8 82.4 98.5 115.9 139.2 Net Profit After Extraordinary 385.6 100.7 98.5 115.9 139.2
F. dil EPS (Rp) 86.8 110.7 131.6 153.5 183.6 Change (% ) na 27.5 18.9 16.6 19.6 Dividend / Share (Rp) - 62.5 32.5 38.3 46.0 Cash Flow / Share (Rp) 173.0 211.1 148.4 174.9 209.9
F.dil P/E (x) 4.3 3.4 2.8 2.4 2.0 P/CFS (x) 2.2 1.8 2.5 2.1 1.8 Price / Book Value* (x) 0.2 0.3 0.3 0.3 0.3
ROE (% ) nm nm 18.5 18.5 18.8 ROCE (% ) (57.5) 11.6 12.8 14.6 16.9 Net Gearing* (% ) nm 0.1 0.2 0.3 0.3 Adj. Yield (% ) - 16.7 8.7 10.2 12.3
NPL Ratio (% ) 3.3 1.1 1.3 1.5 1.6 Bad Debt Reserve Ratio (% ) 8.0 4.7 4.6 4.4 4.4 NPL Coverage (x) 2.4 4.3 3.4 2.9 2.7 *Assuming a full conversion of MCB in 2002 onward
Stock Information
Forecast
An untold recovery story. Post its successful debt restructuring in 2001, BFI had turned around to book Rp82bn net profit in FY02 and is charging ahead to boast a high-teen net profit growth over the next three years. Yet few have discovered its solid fundamentals probably due to a lack of analyst coverage and an overblown litigation issue. We believe the magnitude of the litigation claims that can be reasonably defended is not large. Strong balance sheet with low portfolio risks. BFI has a strong balance sheet with low 0.2x adjusted net gearing, hardly any inter-company receivables and thick bad debt reserves. The investment portfolio is well diversified across the Indonesian vast archipelago with the largest exposure in low risk, lucrative used car financing. Growth story backed by an experienced management team. BFI is projected to post 19% CAGR of net profit, 9%-10% dividend yield and 19%-20% ROE over the next three years. Cash flows to remain strong, as BFI is not expected to pay income taxes until 2006. The growth is backed by an experienced management team that is no longer under “undue” influences from any controlling shareholder. Huge upside potential. BFI offers a huge (87%) upside potential to its fair value at Rp700. Its 0.3x FY03F P/BV and 2.8x FY03 P/E are not only the lowest among its peers but also less than a quarter of the sector average. Re-rating may be triggered by a favourable decision or settlement over its litigation case and improvement of its share liquidity.

[email protected]; (65) 6749-6715; Pacific Capital Resources (PCR); Singapore
Table of Content
Investment Summary 1
Risks 3
Litigation by Ongko Group 3
Competitive Finance Industry 4
Low Share Liquidity 5
Company Analysis 6
Financial Analysis 6
Operation Analysis 7
Investment Portfolios 7
Management 9
Industry Analysis 10
Automobile Industry 10
Consumer Finance Industry 11
Debt Restructuring 13
The Structure 13
The Impact 14
Background and Outlook 15
Background 15
Post Restructuring 16
Outlook 17
Appendix 1. Financial Statements and Ratios 19
Appendix 1. BFI's Branches & Representative Offices 23

Restricted circulation. Do not forward.
[email protected]; (65) 6749-6715; Pacific Capital Resources (PCR); Singapore
1
INVESTMENT SUMMARY An overlooked jewel BFI has proven its capacity to be one of the first few Indonesian companies that managed to complete debt restructurings early (in 2001) and to swiftly turn around from a net loss in FY00 to Rp82bn net profit in FY02. It is now on its way to boast a high-teen net profit growth over the next three years and improve its share liquidity. Yet it has received little attention from investors, probably due to a lack of analyst coverage following the downsizing of stockbroking industry and its average size of market capitalisation. Overblown litigation issue may have swayed investors from fundamentals Investors may have also been overwhelmed by the press coverage on a litigation by the former controlling shareholder Ongko Group against BFI. However, on a closer look, we believe the claim that can be reasonably defended, if ever, is only the one to return the BFI shares. Based on the current price of BFI at Rp375, the claim would cost only Rp42bn, or 43% of BFI’s FY03F net profit. In any case, it may take as long as three to four more years for the plaintiff to get the final decision from the court and this may make the issue “stale” overtime. Further, shareholders are well protected in the event the plaintiff seeks an out-of-court settlement. The settlement terms will have to be approved in an EGM while about two third of BFI current shareholders are ex-creditors and long-term foreign investors (Ongko Group no longer has a significant stake, if any) and they are unlikely to give a nod to unreasonable settlement terms. Strong balance sheet with low investment risks BFI has a strong balance sheet with low 0.2x net gearing (assuming a full conversion of Mandatory Exchangeable Bond), hardly any inter-company receivables and high (2.7x-3.4x) projected NPL coverage (ratio of bad debt reserves over non-performing loans) over the next three years. The investment portfolio is well diversified across the Indonesian vast archipelago with the largest exposure in low risk, lucrative used car financing. We expect the NPL to remain low at below 1.7% over the next three years. Growth story backed by an experienced management team BFI is projected to post 19% CAGR of net profit and 9%-10% dividend yield– among the highest in the financial sector - and 19%-20% ROE over the next three years. Cash flows to remain strong, as BFI is not expected to pay income taxes until 2006, owing to its large deferred tax assets. The management team is among the most experienced in the industry and under no more “undue” influences from any controlling shareholder. Huge discount to the sector average despite strong of fundamentals BFI boasts a huge (87%) upside potential to its estimated fair value at Rp700. BFI’s 0.3x FY03F P/BV and 2.8x FY03 P/E are not only the lowest among its peers but also less than a quarter of the sector average at 13.2x P/E and 1.6x P/BV, respectively. Even if we adjust the sector average by excluding stocks whose free floats are less than 20% , BFI 's attractive valuation still stands out as it is trading at a quarter of the sector's adjusted FY03 P/E at 11.8x and less than a third of adjusted FY03 P/BV at 1.1x. At our target price of Rp700, the stock would trade at only 0.6x FY03F P/BV and 5.7x FY03F P/E, or about a half of the adjusted sector average. There may be positive surprises Positive surprises that would trigger BFI’s re-rating may come from (i) wining the litigation against Ongko Group at the lower court before year-end or (ii) an out-of-court settlement at a low cost. The settlement would enable BFI to borrow at a lower rate and hence boost its net profit.

Restricted circulation. Do not forward.
[email protected]; (65) 6749-6715; Pacific Capital Resources (PCR); Singapore
2
BFI is Trading At A Huge Discount To The Sector AverageNo Company Price Market Free
Cap Float 2003F 2003F 2003F 2003F(Rp) (Rp bn) (%) (x) (x) (x) (x)
1 Bank Central Asia 2,900 17,554 33 8.2 7.0 1.4 1.2 2 Bank BNI 190 37,853 1 14.5 13.2 3.8 3.2 3 Bank Danamon 1,350 6,624 1 4.5 3.8 1.2 1.0 4 Bank Niaga 40 3,130 4 17.8 13.5 1.9 1.7 5 Bank Int'l Indonesia 85 4,101 19 21.6 16.4 1.3 1.2 6 Bank Panin 305 4,533 21 12.4 10.9 1.2 1.1 7 Bank Lippo 480 1,880 33 19.0 13.3 0.8 0.7 8 Bank NISP 245 993 40 7.8 6.2 1.0 0.9
Sector Average 19 13.2 10.5 1.6 1.4 9 BFI Finance* 375 255 100 2.8 2.4 0.3 0.3
Ratio of BFI to the sector average 0.22 0.23 0.21 0.23
Sector Average excluding <20% Free Float 11.8 9.4 1.1 1.0 9 BFI Finance* 2.8 2.4 0.3 0.3
Ratio of BFI to the adjusted sector average 0.24 0.26 0.30 0.33 *Assumed a full conversion of MCBSource: PCR Estimates
P/E P/BV

Restricted circulation. Do not forward.
[email protected]; (65) 6749-6715; Pacific Capital Resources (PCR); Singapore
3
RISKS Litigation by Ongko Group. What is the case? BFI is facing a legal suit from Ongko Group’s subsidiary PT Aryaputra Teguharta (APT), who used to control 32.3% of BFI. APT claimed that BFI’s decision to take over 112m of BFI shares pledged by APT to settle Ongko Group’s approximately US$100m debts to BFI during BFI’s debt restructuring was illegal. This was because the pledge agreement granted by APT to BFI allegedly expired in December 2000 but the restructuring was completed only in May 2001. What is BFI’s defense? BFI defended by saying that (i) the renewal of pledge approval after its lapse was not necessary as a notification alone was sufficient; (ii) APT had earlier approved BFI’s debt restructuring in two shareholder meeting conducted in 2000 ; (iii) the settlement was considered as a debt-to-equity swap; (iv) Ongko Group had benefited from the release of their debts under the swap agreement. If the shares were to be returned, APT logically must provide other collaterals to secure Ongko’s group US$100m debt. Based current exchange rate of Rp8,300/US$, Ongko’s group debt is around Rp830bn, or 20x the value of the disputed share (Rp42bn). What does APT demand? APT demanded the following compensation:
(i) Return of 112m shares previously owed by APT and this is currently valued at Rp39bn (based on BFI current share price at Rp350).
(ii) 32.3% share of BFI’s net profit in 2001 (Rp386bn) and the first 9 months of 2002 (Rp78bn)
totalling Rp150bn (32.3% of Rp386bn + Rp78bn). The percentage (32.3%) is based on APT’s previous ownership of BFI before the debt restructuring. The claim does not seem to make sense because if APT gets its shares back, the current value of the share would have already reflected the historical profit BFI made in 2001 and 2002 (less the dividends paid for FY2002).
(iii) Substantial amount of non-material damage. This claim probably has the least substance as in
the Indonesian law theoretically a person can claim Rp100bn non-material damage even if the case involves only a dispute over Rp1m. Quantifying the non-material damage is probably one of the most difficult task for any lawyer.
What are shareholders’ comforts? Despite the litigation, lenders have the following comforts:
(i) The substantiated claim is small. Of all the three claims, probably only the first can reasonably be substantiated. This claim to return the shares costs only Rp42bn or 43% of BFI’s Rp98.5bn FY2003 projected net profit.
(ii) Protection from independent shareholders. In the event that the case is settled out of the
court, BFI will have to seek an EGM approval for all of the terms and conditions of the settlement. Nearly all of BFI current shareholders are independent shareholders (i.e., not affiliated to Ongko Group) and 72% of them are foreign institutions such as fund managers

Restricted circulation. Do not forward.
[email protected]; (65) 6749-6715; Pacific Capital Resources (PCR); Singapore
4
and ex-creditors including Caterpillar Financial Services, FMO, and The Royal Bank of Scotland.
(iii) The case may take some time to settle. If the case goes through the lower court, higher
court, supreme court and re-assessment proceeding (Peninjauan Kembali) it may take up to 4 years to decide from the first court hearing in May 2003.
What is the progress of the litigation? The litigation had made little progresses. APT’s attempt to get an Attachment Order to seize the disputed BFI’s shares owned by shareholders was rejected by the high court on May 12, 2003. Subsequently, the lower court had convened on 3 occasions. However, not all parties had been legally represented in all of the occasions and hence it had not commenced hearing the main issues. The fourth hearing is scheduled on July 17, 2003. To strengthen its legal representation, BFI has formed a defence team headed by the Hotman Paris & Partners . Competitive Finance Industry The finance industry is highly competitive as it is fragmented with total 245 numbers of licensees. The largest players by asset, GE Multifinance, only controlled 5.6% market share in 2002 while BFI, which was ranked as the 9th largest had only 2.3% share. Many banks’ recent strategies to bolster their direct lending for automobile financing have added to the competition. With the availability of funds from bond market and banks, finance companies are slashing their lending rates and down payments to get bigger market shares. BFI Was The 9th Largest Multi-Finance Company By Assets In 2002 No Company 2002 Mkt No Company 2002 Mkt
Assets Share Assets Share(Rp bn) (Rp bn)
1 GE Finance Indonesia 2,238 5.6% 10 Bussan Auto Finance 839 2.1%2 Astra Sedaya Finance 1,893 4.7% 11 Bumiputera - BOT Finance 701 1.8%3 Dipo Star Finance 1,795 4.5% 12 Caterpillar Finance Indonesia 683 1.7%4 Oto Multiartha 1,698 4.3% 13 Tunas Financindo Sarana 681 1.7%5 Tigaberlian Auto Finance 1,178 2.9% 14 Gajah Surya Finance 674 1.7%6 Federal International Finance 1,175 2.9% 15 Mitsui Leasing Capital Indonesia 672 1.7%7 Primus Financial Services 1,019 2.6% 16 UFJ-BRI Finance 651 1.6%8 BBL Danatama Finance 1,007 2.5% 17 BNI Multi Finance 497 1.2%9 BFI Finance Indonesia 935 2.3% 18 Swadharma Indotama Finance 485 1.2%
19 Other 214 companies 34,628 86.7%Total 39,941 100.0%
Source: Info Bank, PCR Estimates However, the government had ceased issuing new licensees since 2001. Many licensees have gone bankrupt due to the past financial crisis and we expect many existing players to merge to gain market shares and ease competition. BFI stands in a much better position to grab a bigger slice of market share because:
(i) Many of its peers are still yet to complete their debt restructuring or do not have commitments from their lenders or shareholders to re-build their business.
(ii) Most of the banks and new players concentrate on financing of new cars in major cities in
Java, which are not BFI’s main market.
(iii) Banks will continue finding it hard to compete with finance companies in consumer lending due to their rather bureaucratic organisation structure, inflexible terms and generally longer

Restricted circulation. Do not forward.
[email protected]; (65) 6749-6715; Pacific Capital Resources (PCR); Singapore
5
processing time. BFI, for example, can approve most of applications within one day whereas many of its multi-finance competitors or banks cannot do it.
(iv) Many new players are facing a challenge to penetrate the market already serviced by BFI for
20 years and their funding costs are higher. Some smaller players have resorted to fund riskier customers, i.e. taking higher risks to get their business, and hence do not directly compete with BFI
Low Share Liquidity Rising outstanding shares and more active investor relations to improve liquidity BFI share is not liquid due to its rather small market capitalization and large institutional shareholding with foreign institutions controlling 72% of total shares. However, we expect the liquidity to improve because (i) BFI is beefing up its investor relations by issuing monthly newsletters, meeting analysts more frequently and planning to hold quarterly analyst / investor briefing. (ii) The conversion of 81% of its MCB in 2002 and 1Q03 has nearly doubled its outstanding shares and free float. The number of available share will rise further by another 10% (79m) should the remaining MCB be converted, probably before the next dividend payment in 2004. (iii) A potential exercise of ESOP (employee stock option plans) over the next few years will further add 84m new shares (12% of current share outstanding). No major share overhang expected Despite increasing shares from potential MCB conversion and ESOP we do not expect a share overhang. This is because (i) BFI’s market cap of BFI (Rp238bn / US$28m) is not large for most foreign institutional funds to absorb, (ii) BFI has traditionally been held by long-term, value-oriented foreign fund managers, (iii) it is currently undervalued, (iv) the exercise of ESOP is unlikely to be in the near future as it is awaiting the resolution of the Ongko Group litigation , which theoretically can last until another three-four years. The ESOP is part of shares being disputed as it came from ex-Ongko Group shares pledged to BFI (see “Restructuring” section).

Restricted circulation. Do not forward.
[email protected]; (65) 6749-6715; Pacific Capital Resources (PCR); Singapore
6
COMPANY ANALYSIS Financial Analysis Strong balance sheet to leverage growth and pay dividend BFI’s has a strong balance sheet to leverage its investment growths due to:
(i) 81% conversion of its Mandatory Convertible Bonds (MCB), which turned its equity to positive in 2002 and slashed its debt-to-equity ratio to low 0.7x currently. Assuming the remaining 19% of the MCB is converted, the gearing would drop further to mere 0.2x, far below the 6.5x limit set in the debt covenants and 15x ceiling set in the regulations. As per debt covenants, the MCB should be treated as equity instead of a liability as the MCB bears a negligible 0.5% interest rate pa and must be converted to shares by 2006.
(ii) Projected Rp98bn - Rp139bn pa net income over the next three years.
(iii) Quasi-equity restructuring . The May 2003 quasi-equity restructuring allowed BFI to transfer
huge paid up capital in excess of par to retained earnings and hence turned around its retained earnings to a positive territory in 2003. The positive retained earnings make BFI more bankable and strengthen its capacity to pay dividend.
Strong earnings growth despite conservative bad debt reserves. We expect BFI to post 19% compounding annual growth rate (CAGR) of net profit in the next three years. The projection has factored in conservative bad debt reserves at 5.6%-5.8% despite projected investment write-off at below 0.7% pa in the period. Underpinning the strong growth is a high 34% CAGR of investment from its low base (around Rp600bn in FY02) and strong demand for car financing and heavy equipment. This gives a comfortable projected interest coverage ratio at 3.1x - 3.9x throughout 2003 - 2005. Strong cash flow translating into an attractive dividend yield. BFI’ is expected to generate large funds from operation (net income plus non-cash charges) as (i) it is not expected to pay any tax until 2006, owing to its Rp302bn tax credit (as of Mar 2003). Further (ii) it is projected to spend only Rp10bn capex pa, or around 2%-4% of annual revenues, over the next three years. The strong cash flow is expected to translate into an attractive 8%-9% dividend yield over the next three years. Low risk of funding mismatch BFI nearly matches all of its asset and liability exposures both in term of tenor, interest rate and currency. This is largely due its funding strategy that relies on loan channelling to banks. Currency mismatch amounted to only US$2m or 4% of its equity as of Mar 2003. With the strengthening of rupiah, the mismatch - whereby foreign currency liability is greater than foreign currency asset - is contributing to foreign exchange gains. Mismatch of maturities of its asset and liabilities is negligible as it channels (“sells”) most of its receivables to banks. Hardly any inter-company lending exposure BFI’s lending to affiliated companies is one of the lowest among the industry amounting to just 0.4% of total investments in Mar 2002. This is largely because BFI is not controlled by any business group.

Restricted circulation. Do not forward.
[email protected]; (65) 6749-6715; Pacific Capital Resources (PCR); Singapore
7
Operation Analysis Investment Portfolios Low operating risk. BFI has a relatively lower operating risk than typical multi-finance companies have because:
(i) BFI concentrates at automobile financing, which made up 83% of total investment in FY02. The remaining came from leasing (16%) and motorcycle financing (1%). Auto financing is generally less risky than leasing and motorcycle financing. Cars are generally easier to be repossessed in good conditions than motorcycles (which can be easily hidden and disassembled). The average size of auto financing contract at Rp23m is much smaller than that of leasing at Rp683m, and hence the former allows a greater diversification of risk. We estimated that BFI had never made a negative interest spread on its auto financing even after taking into account the worst bad debt provision in 1998-1997.
Concentrates At Safer Automobile Financing (FY02 Investment Breakdown)
Used Automobile59%
New Automobile24%
Leasing 16%
Motorcycle1%
Source: BFI (ii) Focus at used car segment, which accounts for 59% of its total investments. Arguably, it is
safer to finance used car than new car because used car financing demands 30%-60% down payment whereas new car financing currently requires as low as 10% down payment. This is despite the fact that the value of new cars tends to drop more rapidly once they come out from showrooms.
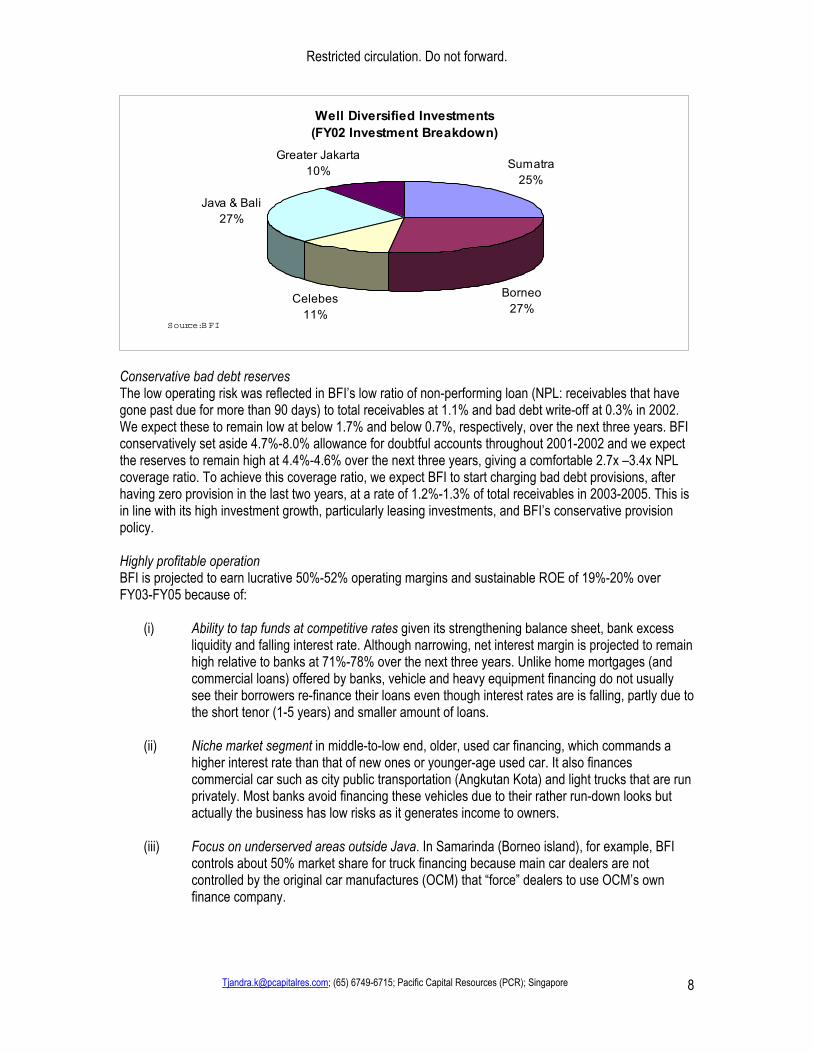
(iii) Well diversified portfolios. BFI’s portfolio is spread out evenly across Indonesia with 63% of its
investments outside highly competitive Java and Bali market. The breakdown of the investment is as follow: nearly one quarter each in Sumatra (25%), Borneo (27%) and Java/Bali (27%), 10% in Greater Jakarta and 10% in Celebes. The diversification allows BFI to spread out the risk should particular areas encounters local economic problems such as flood, earthquake, or harvest failures.
(iv) BFI’s check-and-control system has been firmly established and tested over its 20 year of
operation. This offers a competitive advantage over many newly established finance companies.
Restricted circulation. Do not forward.
[email protected]; (65) 6749-6715; Pacific Capital Resources (PCR); Singapore
8
Well Diversified Investments (FY02 Investment Breakdown)
Sumatra25%
Borneo27%
Celebes11%
Java & Bali27%
Greater Jakarta10%
Source: B FI
Conservative bad debt reserves The low operating risk was reflected in BFI’s low ratio of non-performing loan (NPL: receivables that have gone past due for more than 90 days) to total receivables at 1.1% and bad debt write-off at 0.3% in 2002. We expect these to remain low at below 1.7% and below 0.7%, respectively, over the next three years. BFI conservatively set aside 4.7%-8.0% allowance for doubtful accounts throughout 2001-2002 and we expect the reserves to remain high at 4.4%-4.6% over the next three years, giving a comfortable 2.7x –3.4x NPL coverage ratio. To achieve this coverage ratio, we expect BFI to start charging bad debt provisions, after having zero provision in the last two years, at a rate of 1.2%-1.3% of total receivables in 2003-2005. This is in line with its high investment growth, particularly leasing investments, and BFI’s conservative provision policy. Highly profitable operation BFI is projected to earn lucrative 50%-52% operating margins and sustainable ROE of 19%-20% over FY03-FY05 because of:
(i) Ability to tap funds at competitive rates given its strengthening balance sheet, bank excess liquidity and falling interest rate. Although narrowing, net interest margin is projected to remain high relative to banks at 71%-78% over the next three years. Unlike home mortgages (and commercial loans) offered by banks, vehicle and heavy equipment financing do not usually see their borrowers re-finance their loans even though interest rates are is falling, partly due to the short tenor (1-5 years) and smaller amount of loans.
(ii) Niche market segment in middle-to-low end, older, used car financing, which commands a
higher interest rate than that of new ones or younger-age used car. It also finances commercial car such as city public transportation (Angkutan Kota) and light trucks that are run privately. Most banks avoid financing these vehicles due to their rather run-down looks but actually the business has low risks as it generates income to owners.
(iii) Focus on underserved areas outside Java. In Samarinda (Borneo island), for example, BFI
controls about 50% market share for truck financing because main car dealers are not controlled by the original car manufactures (OCM) that “force” dealers to use OCM’s own finance company.

Restricted circulation. Do not forward.
[email protected]; (65) 6749-6715; Pacific Capital Resources (PCR); Singapore
9
Management Experienced management. BFI has always been run by a professional team of management since its foundation 20 years ago when it was set up under the control of US based Manufacturer Hanover (see “Company Background” section). The management is experienced with all of the three directors having been with BFI for 10-20 years. Nearly all of its senior managers have been with the company throughout the Asian financial crisis. No more “undue” influence on management. Although BFI defaulted on its loans during the past financial crisis, the event was triggered by bad debts from controlling shareholder Ongko Group. BFI recovered only estimated 9%-10% of the total US$100m inter-company loans (see the “Restructuring” section). For a comparison, it managed to collect estimated 87%-90% of its third-party consumer financing receivables at the worst time in 1999-2000. Now that Ongko Group is no longer there, the professional management is relieved from undue influences and has proven their capacity to turn around company to make Rp100m net profit (after extraordinary) and paid Rp42bn dividend in FY2002.
Restricted circulation. Do not forward.
[email protected]; (65) 6749-6715; Pacific Capital Resources (PCR); Singapore
10
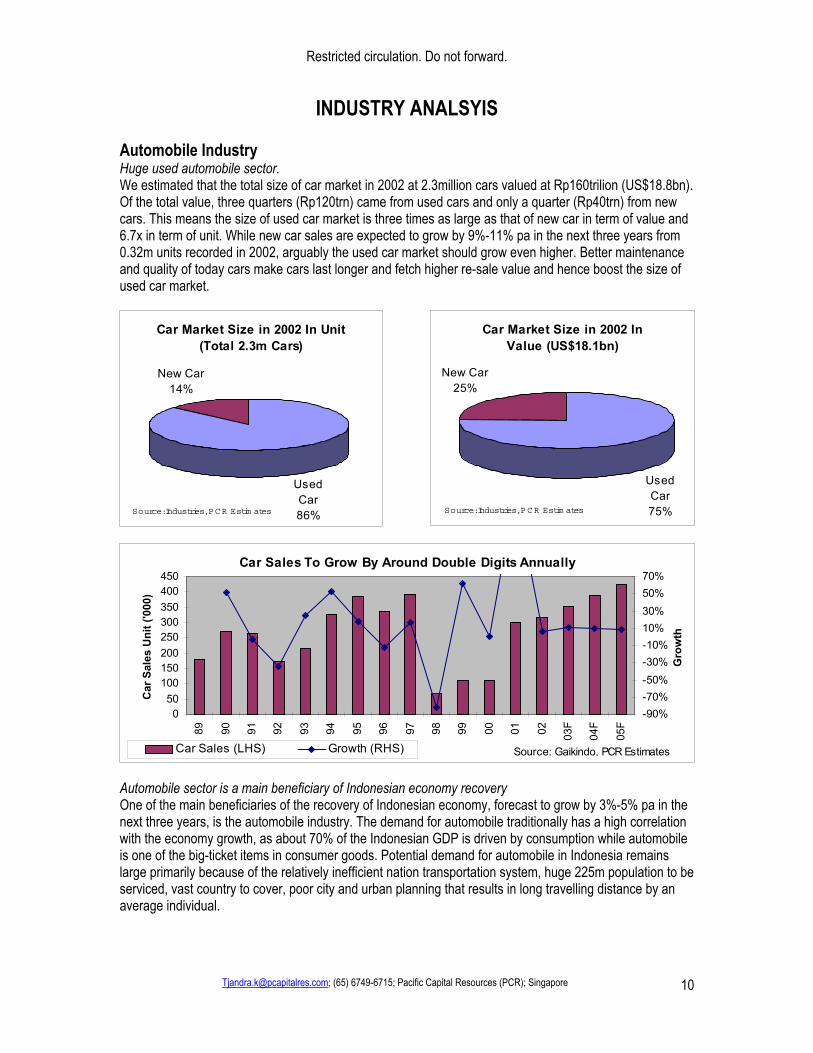
INDUSTRY ANALSYIS Automobile Industry Huge used automobile sector. We estimated that the total size of car market in 2002 at 2.3million cars valued at Rp160trilion (US$18.8bn). Of the total value, three quarters (Rp120trn) came from used cars and only a quarter (Rp40trn) from new cars. This means the size of used car market is three times as large as that of new car in term of value and 6.7x in term of unit. While new car sales are expected to grow by 9%-11% pa in the next three years from 0.32m units recorded in 2002, arguably the used car market should grow even higher. Better maintenance and quality of today cars make cars last longer and fetch higher re-sale value and hence boost the size of used car market.
Car Market Size in 2002 In Unit (Total 2.3m Cars)
Used Car86%
New Car14%
Source: Industries, PCR Estim ates
Car Market Size in 2002 In Value (US$18.1bn)
Used Car75%
New Car25%
Source: Industries, PCR Estim ates
Car Sales To Grow By Around Double Digits Annually
050
100150200250300350400450
89 90 91 92 93 94 95 96 97 98 99 00 01 02 03F
04F
05F
Car
Sal
es U
nit (
'000
)
-90%-70%-50%-30%-10%10%30%50%70%
Gro
wth
Car Sales (LHS) Growth (RHS) Source: Gaikindo, PCR Estimates Automobile sector is a main beneficiary of Indonesian economy recovery One of the main beneficiaries of the recovery of Indonesian economy, forecast to grow by 3%-5% pa in the next three years, is the automobile industry. The demand for automobile traditionally has a high correlation with the economy growth, as about 70% of the Indonesian GDP is driven by consumption while automobile is one of the big-ticket items in consumer goods. Potential demand for automobile in Indonesia remains large primarily because of the relatively inefficient nation transportation system, huge 225m population to be serviced, vast country to cover, poor city and urban planning that results in long travelling distance by an average individual.

Restricted circulation. Do not forward.
[email protected]; (65) 6749-6715; Pacific Capital Resources (PCR); Singapore
11
Consumer Finance Industry Conducive macro-economic development bolster demand for car financing We project a high (25%-30%) compounding annual growth rate (CAGR) of automobile financing market over the next 3 three years driven by (i) falling interest rates which make financing more attractive, (ii) stable rupiah foreign exchange rate that should stabilizes car price given that cars have large imported components, (iii) low base due to the past financial crisis, and (iv) excess fund liquidity in the banking sector that translates into availability of funds. Indonesian overall banking sector is over liquid as evident by currently low (50%-60%) average loan to deposit ratio in most banks and heavy appetite for domestic bonds. Banks and capital market like consumer financing As banks resume their lending activity post the 1998 – 2001 credit crunch, they would rather lend to well-collateralised, consumer durable goods such as car than to riskier corporate loans. According to Bank Indonesia data, consumer financing had the lowest bad debts, ranging just from 4% - 9% during the 1999-2001 economic crises and this type of financing made up 83% of BFI’s portfolios in FY02. The attraction of auto financing can be seen from:
(i) A higher compounding annual growth rate (CAGR) of consumer financing (+57%) than credit cards (+56%; but from a very small base), leasing (+5%), other (+30%), or factoring (-21%) over the last three years (1999-2002).
(ii) Consumer financing made up about a half of total financing market
in 2002.
(iii) Big appetite for bonds issued by multi-finance companies. Multi-finance companies had raised Rp1.6 trillions through domestic bonds since mid 2002. These include Oto Multiartha (Rp300bn in May 2002), and Adira Dinamika Multifinance (Rp500bn in April 2003), Astra Sedaya Finance (Rp800bn in May 2003).
Consumer Financing Is The Fastest Growing Segment
11 14 14 136
7 3 34
9 12 171
1 12
-
10
20
30
40
1999 2000 2001 2002
Fina
ncin
g (R
p Tr
n)
Leasing Factoring Consumer Financing Other Source: Bank Indonesia, Info Bank

Restricted circulation. Do not forward.
[email protected]; (65) 6749-6715; Pacific Capital Resources (PCR); Singapore
12
Multi Finance Industry Investments in 2002 (Total Rp34 trn)
Leasing37%
Factoring9%
Other5%
Consumer Financing
49%Source: Bank Indonesia
Consumer Financing Has The Lowest Bad Debt
0%
20%
40%
60%
80%
1999 2000 2001
Bad
Deb
ts
Source: Bank Indonesia
Leasing
Factoring
Credit Card
Consumer Financing
Well positioned to raise market share Based on total investments of all finance companies that offer leasing and consumer financing, BFI’s market share is estimated to have increased steadily from 0.5% in 1999 to 2.0% in 2002. The biggest victory came from the consumer finance segment where BFI’s market share started from almost nothing in 1999 to 15.5% in 2002. There is a room for BFI to snap more market share given (i) its low base (only 2% of market share), (ii) concentration in the used car market whose size is three times as large as new car and (iv) well established operation with over 20 years of experience.
BFI Is Gaining Market Share
0.0%
2.5%
5.0%
7.5%
10.0%
12.5%
15.0%
17.5%
1999 2000 2001 2002
Mar
ket S
hare
Source: Bank Indonesia, Info Bank, PCR Estimates Consumer Financing
Leasing
Total
Restricted circulation. Do not forward.
[email protected]; (65) 6749-6715; Pacific Capital Resources (PCR); Singapore
13
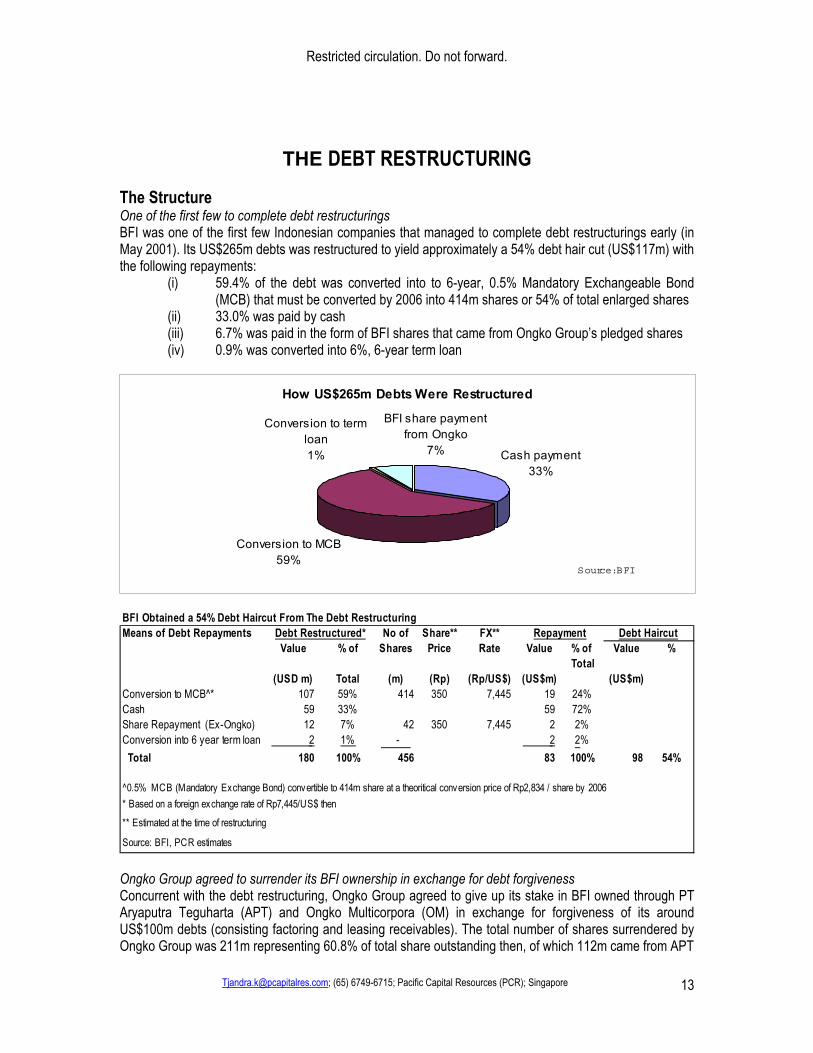
THE DEBT RESTRUCTURING The Structure One of the first few to complete debt restructurings BFI was one of the first few Indonesian companies that managed to complete debt restructurings early (in May 2001). Its US$265m debts was restructured to yield approximately a 54% debt hair cut (US$117m) with the following repayments:
(i) 59.4% of the debt was converted into to 6-year, 0.5% Mandatory Exchangeable Bond (MCB) that must be converted by 2006 into 414m shares or 54% of total enlarged shares
(ii) 33.0% was paid by cash (iii) 6.7% was paid in the form of BFI shares that came from Ongko Group’s pledged shares (iv) 0.9% was converted into 6%, 6-year term loan
How US$265m Debts Were Restructured
Cash payment33%
Conversion to MCB59%
BFI share payment from Ongko
7%
Conversion to term loan1%
Source: BFI
BFI Obtained a 54% Debt Haircut From The Debt RestructuringMeans of Debt Repayments No of Share** FX**
Value % of Shares Price Rate Value % of Value %Total
(USD m) Total (m) (Rp) (Rp/US$) (US$m) (US$m)Conversion to MCB^* 107 59% 414 350 7,445 19 24%Cash 59 33% 59 72%Share Repayment (Ex-Ongko) 12 7% 42 350 7,445 2 2%Conversion into 6 year term loan 2 1% - 2 2% Total 180 100% 456 83 100% 98 54%
^0.5% MCB (Mandatory Exchange Bond) convertible to 414m share at a theoritical conversion price of Rp2,834 / share by 2006* Based on a foreign exchange rate of Rp7,445/US$ then
** Estimated at the time of restructuring
Source: BFI, PCR estimates
RepaymentDebt Restructured* Debt Haircut
Ongko Group agreed to surrender its BFI ownership in exchange for debt forgiveness Concurrent with the debt restructuring, Ongko Group agreed to give up its stake in BFI owned through PT Aryaputra Teguharta (APT) and Ongko Multicorpora (OM) in exchange for forgiveness of its around US$100m debts (consisting factoring and leasing receivables). The total number of shares surrendered by Ongko Group was 211m representing 60.8% of total share outstanding then, of which 112m came from APT

Restricted circulation. Do not forward.
[email protected]; (65) 6749-6715; Pacific Capital Resources (PCR); Singapore
14
(32.3%) and 98m from OM (28%). The shares were distributed to creditors (20%), sold to investors (40%) and assigned to employee stock option or ESOP (40%). Ongko Group should have nothing to complain Based on an foreign exchange rate at Rp7,475 at the time of debt restructuring and BFI share price at Rp350 then, the value of BFI shares surrendered by Ongko Group was only US$10m. Effectively Ongko Group got 90% debt hair cut amounting to staggering US$90m! The Impact BFI turned into one of few companies with a strong and clean balance sheet Two years after the completion of debt restructuring, BFI has now become one of a few multi-finance companies that can boast (i) a clean balance sheet with less than 1% inter-company loans and (ii) 100% ownership by public with foreign institutions holding 72% of total share, (iii) ability to pay dividend from 2001 onward with Rp42bn already paid in 2002, (iv) a stronger capital base with total equity more than double from pre-financial crisis level (Rp238bn in 1997 to Rp493bn in 2002) due to MCB conversions, (v) an even stronger balance sheet should the remaining 19% of MCB worth Rp224bn is converted and 84m ESOP shares are exercised over the next few years. Large Foreign Shareholding & 100% Public Ownership After Debt Restructuring
Shareholder Stake Shareholder Stake %Aryaputra Teguharta 32.3% Bank of Bermuda, Hong Kong 15.7%Ongko Multicorpora 28.4% The Law Debenture Trust, London 12.3%Bank Umum National 8.1% ABN Amro A.O, Russia 8.6%Cooperatives 0.3% Credit Agricole Indosuez, Sweden 7.2%Other 30.9% Caterpillar Financial Services, US 5.5%
Nederlandse Financiering Maatschappij Voor 5.0%- Others* 45.8%
Total 100.0% 100.0%
Public ownership 39% 100%Foreign ownership 20% 73%
Total Share Outstanding (m)^ 346.0 681.2 90%Remaining MCB to be converted (m) - 79.1 10%
Total Fully Diluted Share 346.0 760.4 100%
* Including 12.3% (84m) ESOP shares exercisable after 30-month vested period at 75% of the average last 12 month price^ Increase in the share outstanding is solely due to 81% conversion of MCB into 335.3m shares in 2002 - 2003Source: BFI, PCR's estimates
Before Restructuring Today (May 2003)
Restricted circulation. Do not forward.
[email protected]; (65) 6749-6715; Pacific Capital Resources (PCR); Singapore
15
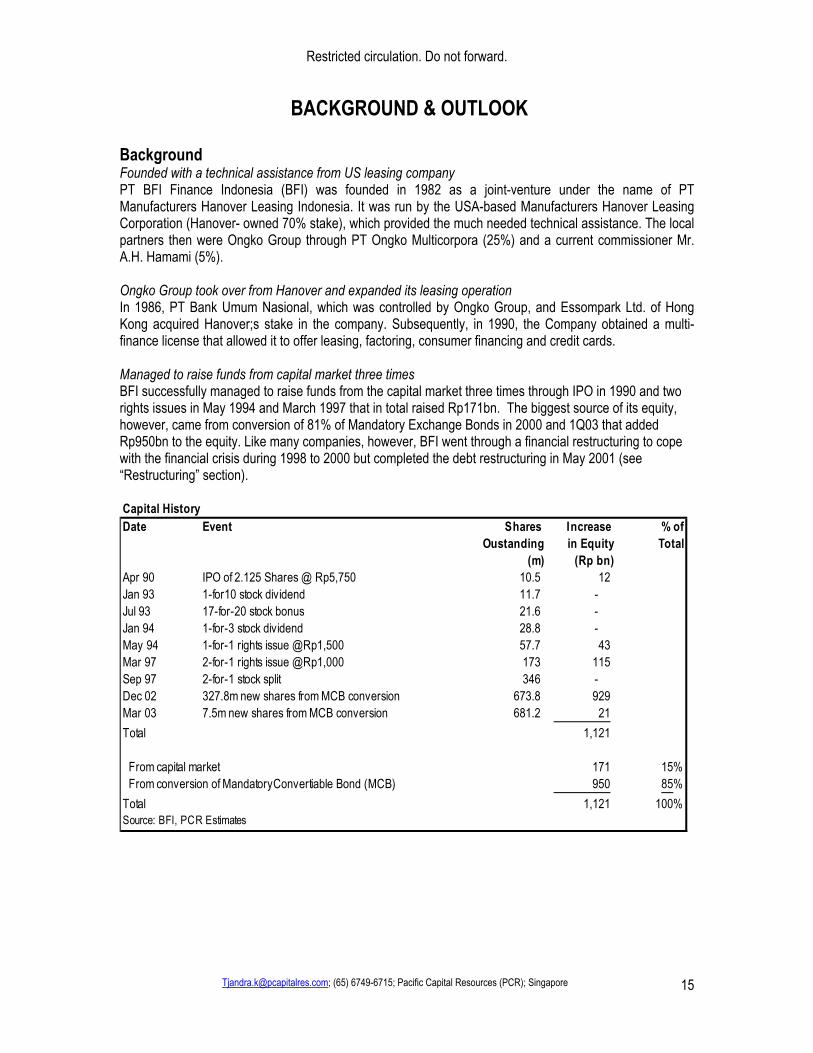
BACKGROUND & OUTLOOK Background Founded with a technical assistance from US leasing company PT BFI Finance Indonesia (BFI) was founded in 1982 as a joint-venture under the name of PT Manufacturers Hanover Leasing Indonesia. It was run by the USA-based Manufacturers Hanover Leasing Corporation (Hanover- owned 70% stake), which provided the much needed technical assistance. The local partners then were Ongko Group through PT Ongko Multicorpora (25%) and a current commissioner Mr. A.H. Hamami (5%). Ongko Group took over from Hanover and expanded its leasing operation In 1986, PT Bank Umum Nasional, which was controlled by Ongko Group, and Essompark Ltd. of Hong Kong acquired Hanover;s stake in the company. Subsequently, in 1990, the Company obtained a multi-finance license that allowed it to offer leasing, factoring, consumer financing and credit cards. Managed to raise funds from capital market three times BFI successfully managed to raise funds from the capital market three times through IPO in 1990 and two rights issues in May 1994 and March 1997 that in total raised Rp171bn. The biggest source of its equity, however, came from conversion of 81% of Mandatory Exchange Bonds in 2000 and 1Q03 that added Rp950bn to the equity. Like many companies, however, BFI went through a financial restructuring to cope with the financial crisis during 1998 to 2000 but completed the debt restructuring in May 2001 (see “Restructuring” section). Capital HistoryDate Event Shares Increase % of
Oustanding in Equity Total(m) (Rp bn)
Apr 90 IPO of 2.125 Shares @ Rp5,750 10.5 12 Jan 93 1-for10 stock dividend 11.7 - Jul 93 17-for-20 stock bonus 21.6 - Jan 94 1-for-3 stock dividend 28.8 - May 94 1-for-1 rights issue @Rp1,500 57.7 43 Mar 97 2-for-1 rights issue @Rp1,000 173 115 Sep 97 2-for-1 stock split 346 - Dec 02 327.8m new shares from MCB conversion 673.8 929 Mar 03 7.5m new shares from MCB conversion 681.2 21 Total 1,121
From capital market 171 15% From conversion of MandatoryConvertiable Bond (MCB) 950 85%Total 1,121 100%Source: BFI, PCR Estimates

Restricted circulation. Do not forward.
[email protected]; (65) 6749-6715; Pacific Capital Resources (PCR); Singapore
16
Post Restructuring Building a new life on consumer financing After its debt restructuring, BFI shifted its focus to car financing, which grew rapidly from 18% of its total investment in 1997 to 83% in 2002. In the same time it totally abandoned its high-risk factoring business, all of which used to came from Ongko Group, and gradually scaled down its motorcycle financing from 11% of total investment in 1997 to nearly none currently. BFI chose not to serve the motorcycle segment because it was labour intensive (i.e. often must collect payments from each individual borrowers in the “field”), riskier than car business and had a small per unit transaction, which, therefore, requires a large economy of scale to be profitable. It could better spend its management resources on a profitable, bigger ticket item like used cars. The shift to a bigger ticket item explains the growth of employees and branch productivities as measured by the average investment (receivables) outstanding per employee and per branch since 2001 despite a rapid increase in the number of employees and branches.
Car
Motorcycle
LeasingFactoring
0%
25%
50%
75%
100%
% o
f Inv
estm
ents
1997 1998 1999 2000 2001 2002 2003F 2004F 2005F
Rebuilding Business Post Debt Restructuring By Concentrating At Car Financing
Source: BFI,
PCR Estim ates
Increasing Employee and Branch Productivities
-
10
20
30
40
50
60
1997 1998 1999 2000 2001 2002 2003F 2004F 2005F
Rp
bn
-0.20.40.60.81.01.21.41.61.8
Rp
bn
Avg Investment / Branch (LHS) Avg Invesment / Employee (RHS)
Source: B FI, P C R Estim ates

Restricted circulation. Do not forward.
[email protected]; (65) 6749-6715; Pacific Capital Resources (PCR); Singapore
17
Rebuilding Network Coverage And Human Resources
0
10
20
30
40
50
60
1997 1998 1999 2000 2001 2002 2003F 2004F 2005F
Num
ber o
f Bra
nch
-
500
1,000
1,500
2,000
2,500
Num
ber o
f Em
ploy
ee
Branch (LHS) Employee (RHS)
Source: BFI, PCR Estim ates
Outlook The future is in a good mix of “clean” car financing and leasing business We expect BFI to post 28% CAGR of investment from 2002 – 2005 with a mix of car financing and leasing in its portfolio. The projected growth represents a real fundamental improvement as the receivables are expected to come almost entirely from a third party (i.e. no inter-company receivables). Leasing is gaining importance and more profitable than new car financing Leasing contribution is expected to double to from 11% of total investments in 2002 to 31% in 2005 mainly due to its low base and increasing availability of fund to finance its growth. Presently, leasing is funded primarily through internal cash flows. Banks are still rather reluctant to fund leasing receivables partly because equipment under leases are largely US$ denominated and the past trauma of rupiah devaluation are still sticking in bankers’ minds. However, as BFI’s internal cash flow is expected to grow steadily , banks need to improve their currently low loan-to-deposit ratio, and the rupiah exchange rate stabilises, there will be more funds available to BFI to finance leasing investment. Between leasing and new car financing, the former is generally more profitable as it earns a higher interest rate (21%-27% in leasing vs. 19%-23% in new car financing) and requires less overhead to maintain, largely to its being a much bigger ticket item. However, we do not expect leasing investment to dominate BFI’s portfolios as BFI’s main strategy is to serve the more lucrative used car financing Continue focusing outside the competitive Java and Bali markets BFI had reduced its reliance on the competitive Java and Bali markets as evident by a fall in the contribution from this area from 62% of total investment in 1997 to 37% in 2002. In the same period, it had bolstered its investments in Sumatra and Borneo islands from 35% of total receivables in 1997 to 52% in 2002. Although the contribution from Java and Bali had started to improve over the last two years, it was largely due to a lower contribution from Celebes and Eastern Indonesia, which had suffered from regional political instabilities. With the projected rise in contribution from leasing, which traditionally came from manufacturing and construction in Java and Bali, the proportion of contribution from Java and Bali is likely to increase but we expect BFI to maintain its main strategy to invest outside these two competitive islands.

Restricted circulation. Do not forward.
[email protected]; (65) 6749-6715; Pacific Capital Resources (PCR); Singapore
18
Sumatra
Borneo
Java & Bali
Celebes & Eastern Indonesia
0%
25%
50%
75%
100%%
Of I
nves
tmen
ts*
1997 1998 1999 2000 2001 2002
Shift Focus Away From Competitive Java & Bali Markets
*Excluding
Factoring
Source: BFI, PCR Estim ates
Improving productivity and efficiency We have seen inflection points of BFI’s productivity and efficiency in 2002 and expect the improvement to continue until 2005. Overhead to investment ratio, an indicator of cost inefficiency, fell from 11% in 2001 to 9% in 2002 and is projected to dip further to 7% in 2005. In the same time, the average investment booked per employee, a barometer of productivity, rose 10% from Rp0.9bn in 2001 to Rp1.0bn in 2002 and is forecast to leap by another 37% to Rp1.6bn in 2005. The improvement could be attributed to a consistent growth in the average size of investment in both leasing and consumer financing since 2000, which thereby reduced the overhead cost per transaction, as well as the economy of scale from a rapid investment growth.
Inflextion Points of Efficiency & Productivity in 2002
0%
2%
4%
6%
8%
10%
12%
97 98 99 00 01 02 03F 04F 05F-0.20.40.60.81.01.21.41.61.8
Rp
bn
Avg Investment/Employee
Overhead Cost / Investment
S BFI PCR E ti t
Source: BFI, PCR
Estim ates
Rising Average Size Of Investment
-5
10152025303540
1997 1998 1999 2000 2001 2002 May 03
Rp
m
-100200300400500600700800
Rp
bn
Consumer Financing (LHS) Total (LHS) Leasing (RHS)
Source: B FI, P C R Estim ates

Restricted circulation. Do not forward.
[email protected]; (65) 6749-6715; Pacific Capital Resources (PCR); Singapore
19
APPENDIX 1. FINANCIAL STATEMENTS & RATIOS Profit & Loss ForecastFY 31 Dec (Rp bn) 2000 2001 2002 2003F 2004F 2005FConsumer Financing 30 82 140 194 234 270 Leasing 18 15 15 29 44 57 Interest Income 15 2 1 1 1 1 Excess Insurance Premium - 11 14 18 21 26 Foreign Exchange Gain - 7 1 1 - - Other 101 17 21 29 35 41 Total Revenues 165 134 193 271 336 395
Depreciation & Amortization 8 2 2 3 3 4 General & Administrative 49 38 48 69 79 85 Financing Cost 1 9 24 49 76 94 Foreign Exchange Loss 283 - - - - - Bad Debt Provisions 97 - - 10 12 13
Total Expenses 438 49 75 131 170 196
Operating Profit (274) 85 118 141 166 199
Pretax Profit (274) 85 118 141 166 199 Tax 83 (27) (36) (42) (50) (60) Net Profit (190) 58 82 99 116 139 Extraordinary Gain - 328 18 - - -
Net Profit After Extraordinary (190) 386 101 99 116 139
Indicators:Revenue Growth (%) (42) (19) 44 41 24 18 Net Profit Growth (%) 606 (130) 43 19 18 20 Net Interest Margin (%) 98 91 85 83 81 80 Operating Margin (%) (166) 63 61 52 49 50 Net Margin (116) 43 43 36 35 35 Source: BFI & PCR Estimates

Restricted circulation. Do not forward.
[email protected]; (65) 6749-6715; Pacific Capital Resources (PCR); Singapore
20
Balance SheetFY Dec 31 (Rp bn) 2000 2001 2002 2003F 2004F 2005FCash & Deposit 31 9 18 20 22 24 Net Investments - Leasing 79 43 87 166 253 329 Net Investments - Consumer 175 316 494 544 625 719 Fixed Assets 11 12 14 22 28 35 Deferred Tax Asset 522 355 311 269 219 160 Other Assets 4 5 9 13 16 19
Total Assets 822 739 935 1,034 1,164 1,286
Short Term Loan 1,672 26 128 162 279 322 Accrued Expense 20 23 24 34 42 50 Dividend Payable - 0 24 12 15 18 Mandatory Convertible Bonds - 1,174 245 224 112 56 Other 11 10 21 28 34 40 Total Liabilities 1,702 1,234 442 461 482 485
Common Shares 173 173 337 341 360 370 Other Reserves 15 15 780 156 156 156 Retained Earnings (1,068) (682) (624) 76 166 274 Total Equity (880) (495) 493 573 682 800
Total Liabilities & Equity 822 739 935 1,034 1,164 1,286 Source: BFI & PCR Estimates

Restricted circulation. Do not forward.
[email protected]; (65) 6749-6715; Pacific Capital Resources (PCR); Singapore
21
Statement of Cash FlowFY Dec 31 (Rp bn) 2000 2001 2002 2003F 2004F 2005FOperating Profits (274) 85 118 141 166 199 Tax 83 (27) (36) (42) (50) (60) Depreciation / Amortization 8 2 2 3 3 4
Funds From Operation (182) 60 85 101 119 143 Working Capital (247) (103) (215) (115) (157) (158)
Cash Flow - Operation (429) (43) (130) (14) (38) (15)
Fixed Asset 1 (3) (5) (10) (10) (10) Deferred Tax (82) 167 43 42 50 60 Others 271 (1) (1) (1) (0) (0)
Cash Flow - Investment 190 164 38 32 39 49
Short Term Debts (218) (1,646) 102 35 117 43 Long Term Debts - 1,174 (929) (21) (112) (56) Equity - - 929 (620) 20 10 Dividend (0) 0 (19) (33) (24) (28) Extraordinary / Others - 328 18 624 - -
Cash Flow - Financing (218) (143) 101 (16) 1 (32)
Chg. in Cash (458) (22) 9 2 2 2 Beginning Cash 489 31 9 18 20 22
Ending Cash 31 9 18 20 22 24 Source: BFI & PCR Estimates

Restricted circulation. Do not forward.
[email protected]; (65) 6749-6715; Pacific Capital Resources (PCR); Singapore
22
Financial RatioFY Dec 31 2000 2001 2002 2003F 2004F 2005FRevenue Growth (%) (42.3) (18.8) 44.2 40.9 23.7 17.8 Net Interest Margin (%) 98.3 90.9 84.6 78.1 72.8 71.3 Operating Margin (%) (166.4) 63.4 61.3 51.9 49.4 50.3 Effective Tax (%) 30.5 31.8 30.1 30.0 30.0 30.0 Net Margin (%) (115.6) 43.3 42.8 36.3 34.5 35.2
ROE (%) 24.2 nm nm 18.5 18.5 18.8 Earnings Yield (%) (146.6) 44.5 32.6 38.6 45.4 54.5 ROACE (%) 24.2 nm 11.6 12.8 14.6 16.9
Net Debt/Equity* (x) nm nm 0.1 0.2 0.3 0.3 Net Debt/Equity (mkt Value)* 0.0 0.0 0.0 0.0 0.0 0.0 Interest Coverage (x) (257.0) 10.4 5.9 3.9 3.2 3.1 Cash Flow Cover (x) (248.3) 26.3 6.3 3.9 3.2 3.2
Non Performing Loan Ratio (%) 5.7 3.3 1.1 1.3 1.5 1.6 Bad Debt Reserve Ratio (%) 14.0 8.0 4.7 4.6 4.4 4.4 Non Performing Loan Coverage (x) 2.4 2.4 4.3 3.4 2.9 2.7 Provision To Total Receivables (%) 25.4 - - 1.0 1.0 0.9 Overhead to Investment Ratio (%) 7.2 11.3 9.9 10.5 9.7 8.7
Investment Growth (%) 224.1 41.1 62.3 22.0 23.7 19.3 Gross Investment to Debt Ratio (x) 0.2 0.3 1.7 2.0 2.4 2.9 *Assuming a full conversion of MCB
Source: BFI & PCR Estimates

Restr
icted
circu
lation
. Do n
ot for
ward
.
Tjand
ra.k@
pcap
italre
s.com
; (65
) 674
9-67
15; P
acific
Cap
ital R
esou
rces (
PCR)
; Sing
apor
e
23
APPE
NDIX
2. B
FI’S
BRA
NCHE
S AN
D RE
PRES
ENTA
TIVE
OFF
ICES

Restricted circulation. Do not forward.
Pacific Capital Resources Head Office 10 Anson Road #24-09 International Plaza Singapore 079903 Ph : (65) 6749-6715 Fax : (65) 6742-2294 Contact: Tjandra Kartika, CFA Principal E-mail: [email protected] Disclaimer. This publication is for restricted distributions. It must not be copied, reproduced, republished, uploaded, posted, transmitted, or distributed in whole or part or anyway to a third party without prior written permissions from Pacific Capital Resources (PCR). The report is prepared based on information obtained from sources believed to be reliable. No representation, express or implied, is made with respect to the accuracy, completeness or reliability of the information or opinions in this publication. The companies mentioned herein do not guarantee the accuracy of this report nor necessarily endorse opinions and forward looking statements mentioned in this report. This publication is general in nature and does not have regards to the specific investment objectives, financial situation and the particular needs of any specific person who may receive this report. Accordingly, neither PCR nor any of its affiliates nor persons related to us accept any liability whatsoever for any direct, indirect or consequential losses (including loss of profit) or damages that may arise from the use or dissemination of information or opinions in this publication. The information and opinions in this publication are not to be considered as an offer to sell or a solicitation of an offer to buy the securities discussed herein. Opinions expressed are subject to change without notice. Recipients should not regard the report as a substitute for the exercise of their own judgments. If the Financial Services and Markets Act of the United Kingdom or the rules of the Financial Services Authority apply to you, our obligations owed to you therein are unaffected. PCR has advisory relationships with BFI. Our related companies, their associates, directors, connected parties and/or employees do not have any interest in BFI at the time the report was published but subsequently may from time to time have an interest in the securities discussed herein and we will be pleased to provide specific information of these interests at any time upon request.