Embed Size (px)
Citation preview

Beyond Gender Differences in U.S. Life Cycle Happiness
Enrico A. Marcellia,b and Richard A. Easterlinc
aDepartment of Economics, University of Massachusetts Boston
bCenter for Society and Health, Harvard University cDepartment of Economics, University of Southern California
Abstract: We employ two decades of General Social Survey data consisting of 83 birth cohorts from 1893 to 1975 to estimate the influence of satisfaction in seven life domains (family, finances, work, health, friends, place of residence, and leisure time activity) on life-cycle happiness among men and women aged 18 to 89 years in the United States. The adult population is estimated to be happiest at age 51, and men are estimate to surpass women in happiness at age 48. Contrary to both genetic or personality (e.g., traditional gender role) and access to resources (“more is always better”) explanations of happiness, but consistent with a life-course domain-interaction adaptation model, we find that satisfaction with family, finances, work, and health explain much of the variation in average life-cycle happiness among both men and women. Individual life domain satisfactions, furthermore, appear to track objective life circumstances fairly well – except for finances, where satisfaction is estimated to rise despite declining income in elder years – thus psychological adaptation is of limited value in explaining either average domain-specific or global subjective well-being. Lastly, we find little evidence that men or women modify the importance they place on various life domains even as circumstances within these change over the life cycle, and we estimate a positive “pure effect of age” on happiness for both genders. Rather than relying exclusively on a conventional bottom-up economic or top-down psychological approach to studying happiness, our results suggest that an integration of methods and theories from economics, psychology, sociology, and gerontology offers a more useful means for understanding gender differences in life-cycle happiness. Key words: subjective well-being, satisfaction, utility, welfare
November 2005
Draft: Please do not cite, quote, or circulate without permission

During what stages of life are men and women relatively happy in the United States – during early
adulthood when family formation and career development are in full swing, toward mid-life when
circumstances are (or are thought to be) more stable, or during older ages when retirement, declining
wealth, an “empty nest,” and spousal loss are more likely? How well does satisfaction with various
life domains – work, family, friendship, place of residence, hobbies, health, and finances – explain
variation in the patterns of men’s and women’s happiness? Do men and women adapt differently to
changing life circumstances as they age by shifting the relative importance they place on specific life
domains? What is the “pure effect of aging” on happiness among men and women, that is, once one
eliminates variation in life circumstances? These are four questions we ask in this paper. We answer
them by analyzing several decades of pooled, nationally representative, cross-sectional data from the
United States on self-reported overall, “global,” or “context-free” happiness and “domain-” or
“context-” specific satisfaction; and by employing a method that combines demographers’ birth
cohort and economists’ regression analytical approaches. The analytical approach of tracing the
influence of prior and changing social circumstances over the life course of individuals was
introduced in the early 20th-century by the Chicago school of sociology (Thomas & Znaniecki, 1918)
but remained dormant for more than four decades until being revitalized in economics (Easterlin,
1961), psychology (Schaie, 1965), and sociology (Ryder, 1965). We shall argue, furthermore, that the
integration of this approach with econometric techniques to analyze the influence of satisfaction
with separate life domains on overall happiness by gender in the tradition of Angus Campbell and
colleagues (Campbell, 1981; Campbell, Converse, & Rodgers, 1976) offers a unique and promising
approach to the study of human well-being.
Although cohort analyses have been widely used to investigate how specific health conditions
and mortality change over the life course (Keyfitz & Litman, 1979; Manton & Myers, 1987; Manton
& Stallard, 1982; Patrick, Palesch, Feinleib, & Brody, 1982; Patrick & Erickson, 1993) and to obviate
1
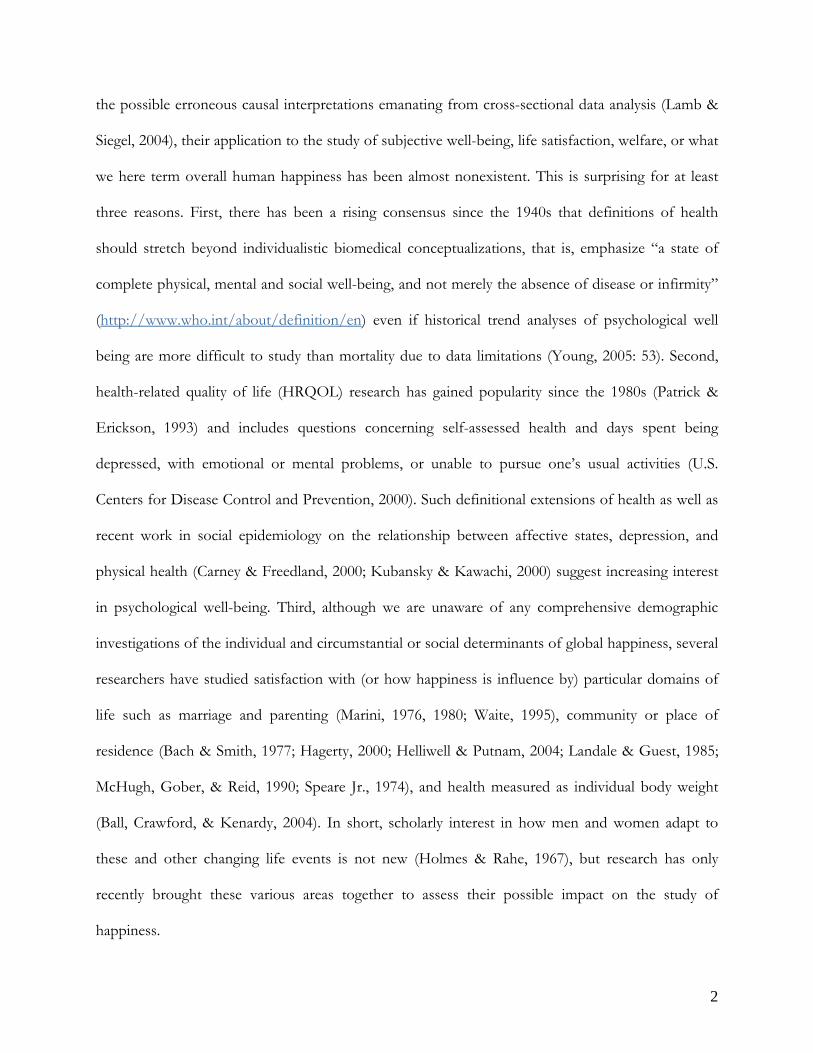
the possible erroneous causal interpretations emanating from cross-sectional data analysis (Lamb &
Siegel, 2004), their application to the study of subjective well-being, life satisfaction, welfare, or what
we here term overall human happiness has been almost nonexistent. This is surprising for at least
three reasons. First, there has been a rising consensus since the 1940s that definitions of health
should stretch beyond individualistic biomedical conceptualizations, that is, emphasize “a state of
complete physical, mental and social well-being, and not merely the absence of disease or infirmity”
(http://www.who.int/about/definition/en) even if historical trend analyses of psychological well
being are more difficult to study than mortality due to data limitations (Young, 2005: 53). Second,
health-related quality of life (HRQOL) research has gained popularity since the 1980s (Patrick &
Erickson, 1993) and includes questions concerning self-assessed health and days spent being
depressed, with emotional or mental problems, or unable to pursue one’s usual activities (U.S.
Centers for Disease Control and Prevention, 2000). Such definitional extensions of health as well as
recent work in social epidemiology on the relationship between affective states, depression, and
physical health (Carney & Freedland, 2000; Kubansky & Kawachi, 2000) suggest increasing interest
in psychological well-being. Third, although we are unaware of any comprehensive demographic
investigations of the individual and circumstantial or social determinants of global happiness, several
researchers have studied satisfaction with (or how happiness is influence by) particular domains of
life such as marriage and parenting (Marini, 1976, 1980; Waite, 1995), community or place of
residence (Bach & Smith, 1977; Hagerty, 2000; Helliwell & Putnam, 2004; Landale & Guest, 1985;
McHugh, Gober, & Reid, 1990; Speare Jr., 1974), and health measured as individual body weight
(Ball, Crawford, & Kenardy, 2004). In short, scholarly interest in how men and women adapt to
these and other changing life events is not new (Holmes & Rahe, 1967), but research has only
recently brought these various areas together to assess their possible impact on the study of
happiness.
2

Conclusions about the relative contributions of psychological adaptive ability determined by
one’s biology or personality (formed during early childhood) and of life circumstances to overall
happiness; therefore, have been drawn primarily from cross-sectional and limited longitudinal
studies of no more than nine years (Costa Jr. et al., 1987). Although analyses of data at a point in
time or over particular life cycle stages are likely to yield results that are of limited value for
generalizing about trends in or the sources of happiness over the life course, the main message from
such studies is that the trend in affect balance is flat and therefore adaptation back to some
psychological set point despite changing life circumstances is often complete. Importantly, the only
published panel study that follows the same persons for a longer period of time (22 years) finds an
inverted-U-shaped life satisfaction curve that peaks at age 65 (Mroczek & Spiro III, 2005). Only
men, however, are included in this study’s sample.
Below we draw upon a “multi-level life course model” of adaptation to aging from sociology,
which emphasizes the need to study the effects of gender within a framework of individuals linked
to their socio-historical life experiences (Hatch, 2000), and employ a recently developed “synthetic
panel” model (Easterlin, 2005) that analyzes annual and bi-annual random samples of adults from
the same birth cohort (rather than following the same individuals as they age) to estimate trends in
and sources of happiness among men and women.
Our results may be summarized succinctly. First, diverging from recent work by several
economists (Blanchflower & Oswald, 2004; Frey & Stutzer, 2002) indicating a U-shaped life-cycle
pattern of happiness and from a genetic, personality, hedonic treadmill, or set-point model of
subjective well-being (SWB) offered by leading psychologists in the field (Brickman & Campbell,
1971; Kahneman, Diener, & Schwartz, 1999) suggesting no change in happiness throughout life, we
find that happiness in the United States rises for men and declines for women over the adult life
cycle – producing an X-shaped graph that crosses at age 48. For all adults viewed collectively the
3

curve is, consistent with Easterlin’s (2005) and Mroczek & Spiro III’s (2005) findings, an inverted-U
that peaks at age 51.
Second, much of the variation in global happiness among both men and women is explained by
satisfaction with the same four domains of life – family, finances, work, and health – and although
the explanatory weight of family, finances, and health are higher for women than for men, and that
of work higher for men than for women, the relative rank of these to overall happiness within
gender is identical.
Third, not only does satisfaction with the same four areas of life predict overall happiness fairy
well for both men and women and is the rank order of these domains in terms of explanatory power
the same by gender, but the relative significance of each domain’s contribution to overall happiness
changes very little during adulthood when satisfaction with particular domains is changing. For
example, although family circumstances change throughout adulthood, the contribution of
satisfaction with this area of life to one’s global happiness remains fairly constant. Changing life
circumstances, although partly mediated psychologically by changing aspirations and social
comparison, alter one’s overall sense of well-being. This, we argue, moves one beyond the two
dominant dichotomous explanations in gerontology and sociology regarding adaptation to aging –
traditional gender role theory (Barer, 1994) and access to economic (Morgan, 1986), health
(Crimmins, Hayward, & Saito, 1996), and social support (Berkman & Syme, 1979) resources – and
toward a more comprehensive perspective that views gender as a multi-dimensional social institution
interacting with various other demographic characteristics (e.g., ethno-racial group, education, birth
cohort) and life circumstances (e.g., family, work, physical health) over time. In short, neither
socially proscribed gender roles (associated with psychologists’ set-point theory) nor access to
material resources (as most economists maintain) – separately or jointly – adequately explain(s)
trends in happiness among men and women in the United States. Rather, examining how specific
4

domains of life influence happiness throughout adulthood “explicitly identifies potential sources of
similarity in women’s and men’s lives as well as sources of difference” (Hatch, 2000: 24).
Finally, once we take life circumstances into account, the “pure” age-happiness relationship is
estimated to be positive for all adults and by gender. That is, the inverted-U shaped age-happiness
curve we estimate for all adults combined and the X-shaped gendered age-happiness relationship we
estimate are contingent upon the levels of satisfaction people have with their financial, family, work,
and health conditions. Taken together, these results support what we term a bottom-up, life-course
domain-interaction adaptation model of happiness and challenge both the top-down traditional gender role
and bottom-up access to resources models of happiness. Contrary to ambiguous gender role explanations
of how men and women adapt to aging differently (e.g., women have better social relationships and
coping skills and live longer, but are more at risk for long-term chronic illnesses and depression), the
domain-interaction life course perspective adopted here offers a processual rather than a
dichotomous approach wherein gender is viewed as “crucial to consider, but must be . . . grounded
in social-historical context” and “in conjunction with” various other demographic characteristics
(Hatch, 2000: 91)
BACKGROUND
Levels of and Trends in Men’s and Women’s Happiness
Conclusions concerning the relationship between gender and self-reported happiness or other
measures of subjective well-being (SWB) such as life satisfaction have been ambiguous both
empirically and theoretically (Hatch, 2000). Although several reviews of the determinants of context-
free or global happiness find few gender differences or ignore gender altogether when considering
demographic correlates (Argyle, 1990, 2001), for example, studies analyzing brain wave, experience
sampling, and population-level data suggest that women in North America are happier than men, or
5

at least report more intense positive emotions (Inglehart, 1990; Nolen-Hoeksema & Rusting, 1999;
Seidlitz & Diener, 1998; White, 1992; Wood, Rhodes, & Whelan, 1989). Although others argue the
opposite (Mroczek & Kolarz, 1998), such static comparisons or short-term longitudinal studies are
of limited value for understanding the determinants of life-cycle gender differences in happiness.
The gender-happiness relationship may change throughout the life cycle and over time, and
recent evidence from several economists employing national-level data suggest that men’s relative
happiness has risen during the past several decades in the United States despite declining labor
market discrimination against women and women’s increasing earnings (Blanchflower & Oswald,
2004; Easterlin, 2001). Easterlin (2003b), furthermore, argues that men surpass women in happiness
on average at about age 60 in the United States due to differential effects of retirement and spousal
loss, but the sample he employs excludes those younger than 34 years of age. Although there is
mixed evidence concerning the relative effect of retirement on men compared to women (Cummin
& Henry, 1961; Easterlin, 2003b), there is a consensus that women are more likely to experience –
and therefore suffer from – the loss of a spouse. Other reasons sometimes given for the possibility
that men become relatively happier as they age include relatively unhealthy or unhappy men dying
earlier (Rahman, Strauss, Gertler, Ashley, & Fox, 1994), men’s lower risk of experiencing chronic
illness and greater access to economic resources (Pearlin & Schooler, 1978; Umberson, Wortman, &
Kessler, 1992), women being more likely to be caretakers (Taylor, 2002), and the cumulative effects
of female psychological impairment (Gove & Tudor, 1973). These may be offset; however, by
women’s better coping skills and healthier interpersonal relationships (Taylor, 2002). Indeed, there is
some evidence in earlier studies that these factors may increasingly balance each other over the life
6

course – levels of self-reported life satisfaction or happiness among older men and women are often
quite similar (Antonucci & Akiyama, 1987; Doyle & Forehand, 1984).1
The only recent study of which we are aware that systematically analyzes overall happiness in the
United States over the life course provides some evidence of countervailing life satisfaction domain
effects, but it does not analyze men and women separately (Easterlin, 2005).
Theories of How Aging Influences Happiness among Men and Women
Although the etiologies of gender (Hatch, 2000; Lorber, 1994; West & Zimmerman, 1987) and SWB
are hotly contested and often separate fields of scholarly debate spanning multiple disciplines
(Diener, Suh, Lucas, & Smith, 1999; Easterlin, 2003a; Fujita & Diener, 2005; Keyes, Shmotkin, &
Ryff, 2002; Lucas, Clark, Georgellis, & Diener, 2003; Ryff, 1989; Ryff & Keyes, 1995; Springer &
Hauser, 2005), it is increasingly acknowledged that both are influenced by individual behaviors,
characteristics, past and present circumstances, and experiences. It is nonetheless analytically useful
to outline two broad theories of psychological adaptation to changing life circumstances over the life
course that have dominated the economics and psychology literatures, and to discuss how three
sociological theories of how men and women may adapt differently as they age fit into these.
As summarized by Easterlin (2005), economists tend to view human well being as strictly
contingent upon objective circumstances and employ multivariate regression analyses to test how
various demographic (e.g., age, race, educational attainment), economic (e.g., employment, income,
homeownership), and socio-political (e.g., citizen trust in government, government intervention,
political participation) factors influence happiness (Blanchflower & Oswald, 2004; Easterlin, 2003b;
Frey & Stutzer, 2002). This we term the bottom-up theory of happiness. It is not dichotomous in the
1 The idea that the body tends “to keep things the way that they are” despite changing circumstances is known more generally as “homeostasis” and is a term introduced by Harvard physiologist Walter Cannon in the early 1900s (Cannon, 1928, 1967 [1932]; Mayer, 1968: 12; McEwen & Lasley, 2002).
7

sense of reifying one factor (e.g., class, gender, race) as the most important determinant of happiness
and investigates the interaction of multiple factors, but it fails to consider how psychological
processes may mediate the impact of life circumstances on SWB. Conversely, psychologists often
dismiss the effect of objective conditions on happiness and argue that “hedonic adaptation” – a
psychological adjustment process resulting from one’s genetic endowment or personality – regulates
the effect of changing family, employment, health, and other life domains such that happiness
returns to some initial homeostatic condition (Cannon, 1967 [1932]: 19-26) or set point (Brickman &
Campbell, 1971; Kahneman et al., 1999; Myers & Diener, 1995; Steel & Ones, 2002). One influential
study of genetically identical and same-sex fraternal twins, for instance, proclaims “it may be that
trying to be happier is as futile as trying to be taller and therefore is counterproductive” (Lykken &
Tellegen, 1996: 189). This we shall term top-down theory, and while there has been some examples of
integrating lessons from bottom-up and top-down theories by some psychologists (Fujita & Diener,
2005; Headey & Wearing, 1989; Lucas et al., 2003; Lucas, Clark, Georgellis, & Diener, 2004; Lykken,
1999; Mroczek & Spiro III, 2005) and economists (Easterlin, 1974, 2005; Graham, 2005; Layard,
2005; van Praag & Frijters, 1999), these two extreme classifications provide a useful analytical
continuum.
Reminiscent of the first study to examine the relationship between satisfaction of particular life
domains and overall life satisfaction using random national data in the United States (Campbell et
al., 1976), some of the latest efforts have relaxed allegiance to either the strong bottom-up or top-
down theoretical position and recognized that not all life domains are hedonically similar (Easterlin,
2005; Kahneman, Krueger, Schkade, Schwarz, & Stone, 2004). This has provided an opportunity to
address the so-called Easterlin paradox (Alesina, Di Tella, & MacCulloch, 2004; Easterlin, 1995) –
that is, the finding that there are diminishing returns to happiness from income – to consider other
areas of life that may augment or reduce happiness, and to discuss how to create a more politically
8

useful metric of national well being than per capita gross national product (Abraham & Mackie,
2005; Di Tella & MacCulloch, 2005; Diener, 2000; Diener & Seligman, 2004; Robinson & Godbey,
1997: Chapter 17). Knowing which domains of life (only one of which is purely pecuniary) most
influence happiness provides an opportunity to investigate possible policy interventions for
increasing human well-being. Not only does happiness or satisfaction appear to be inversely related
to various health risks and negative health outcomes (Ball et al., 2004; Diener, Wolsic, & Fujita,
1995; Frey & Stutzer, 2002; Konow & Earley, 2003; Pinhey, Rubinstein, & Colfax, 1997); for
instance, but it has also been estimated to be positively correlated with residential sedentariness
(Bach & Smith, 1977; De Jong, Chamratrithirong, & Tran, 2002; Landale & Guest, 1985; Lee,
Oropesa, & Kanan, 1994; McHugh et al., 1990; Speare Jr., 1974), and healthy work and family
conditions (Easterlin, 2005). In short, income appears to be an inadequate proxy for human welfare
in an advance political economy such as the United States.
Academic interest in measuring human well being and its determinants systematically was
initially expressed in the United States during the 1930s when various social scientists questioned a
perceived underlying assumption of Simon Kuznet’s newly developed national income accounting that
absolute income fully reflects social welfare (Bennett, 1937; Duncan, 1975; Kuznets, 1941;
Nordhaus & Tobin, 1973; Scitovsky, 1992 [1976]). But it was not until evidence of a secular decline
in community cohesion and trust in the United States (Putnam, 2000) that researchers and
policymakers once again began to take an active interest in investigating the sources of happiness.
We have already noted that the analytical approach of tracing the influence of prior and
changing social circumstances over the life course of individuals had lain dormant for more than half
a century before being revitalized in economics (Easterlin, 1961), psychology (Schaie, 1965), and
sociology (Ryder, 1965). This influenced analyses of family life (Glick, 1977) and other specific life
domains as noted above (e.g., where one lives) with some alacrity, but the recognition that the
9

sources of happiness may be more fully understood when controlling for individuals’ personal
characteristics and prior life experiences that are shared with others of a similar socioeconomic
background or of the same birth cohort in addition to examining various domains of life (Allen &
Pickett, 1987; Easterlin, 1987; Elder Jr., 1974; Elder Jr. & Liker, 1982; Hareven, 1978) – rather than
concentrating on a single individual characteristic such as age, gender, employment, or marital status
at a particular point in time – is a very recent development.
Integrating lessons from economics, demography, psychology, and sociology – we shall argue
below – generates a more analytically powerful view of the determinants of men’s and women’s
happiness. Although a life course approach is not a theory (George, 1996), its main advantages
include estimating the influence of past and current life events and experiences on present outcomes
and providing a conceptual frame within which one may evaluate competing theories that explicitly
acknowledges “the joint significance of age, period, and cohort” (O'Rand, 1996). In the present
study such a methodological approach – set under a theoretical umbrella covering individual
biological and contextual sources of well being – enables us to estimate the relative merit of (1)
traditional gender role theory, (2) access to resources explanations, and what we shall term a (3) life-course
domain-interaction adaptation model (Easterlin, 2005; Hatch, 2000) for explaining trends in and
differences between men’s and women’s happiness as they age (Figure 1). The first and third two
views fall under a bottom-up, and the second may be placed under a top-down, theoretical
perspective.
<<< Figure 1 about Here >>>
Although most studies of adaptation to aging in gerontology have focused on SWB broadly
defined as emotional states, happiness, life satisfaction, mental and personality disorders, and
10

psychological distress/stress (Aneshensel, Rutter, & Lachenhruch, 1991; Mastekaasa, 1992; Pearlin
& Schooler, 1978; Pearlin & Skaff, 1996) and have privileged gender-specific behavior (e.g., coping)
as an explanation of adaptation to age writ large at a point in time or during one stage of the life cycle
(Hatch, 2000), no study of which we are aware has investigated how individual demographic
characteristics and satisfaction with various life domains jointly influence global happiness by gender
over the entire, or at least a large portion of the, adult life-cycle.
We suspect that neither traditional gender role theory nor access to resource explanations – the
two dominant approaches in gerontology – are adequate for understanding changes in men’s and
women’s happiness over the life course. Traditional gender role theory is traceable to Talcott
Parsons’ idea that shared norms and values are the foundation of modern society (e.g., functionalism
rather than group conflict) and views gender as the master identity cutting across and explaining
outcomes in all other areas of life (Parsons, 1955). It posits, within the domain of the family for
example, that women are socialized to assume socioemotional functions/roles and men to assume
instrumental functions/roles, and that this is a desirable and harmonious division of household
labor. The central focus is on one individual personality trait (gender) and therefore is consistent
with a top-down theory of happiness.
Gender differences in access to resources explanations, by contrast, do not assume that men and
women are always and everywhere socialized to take on different orientations toward various
domains of life or that their personalities and interests are inherently different. Rather, people are
viewed as similarly influenced by the constraints and opportunities they have (Kanter, 1977). While
the former theory emphasizes the enduring influence of gender roles on happiness and downplays
socioeconomic inequalities, the latter mistakenly assumes that equal access to resources will
automatically generate similar levels of happiness among all men and women (Hatch, 2000).
11

Below we build on the synthetic cohort methodology developed by Easterlin (2005) to estimate
levels of happiness among men and women in the United States throughout the adult life cycle, and
how satisfaction with family, finances, work, health, friends, hobbies, and place of residence
domains influence overall happiness rather than focusing solely on one’s gender or access to valued
resources. We do not ignore how gender and material resources affect happiness, but estimate in
which domains of life men’s and women’s satisfaction differs and how SWB is influenced by this.
DATA AND METHODOLOGY
Data Source and Sample
We employ 1973-1994 General Social Survey (GSS) data, a nationally representative survey of
households in the United States administered by the National Opinion Research Center (NORC)
almost annually between 1972 and 1993 (not in 1979, 1981, and 1992), and biannually from 1994 to
2004 (Davis, Smith, & Marsden, 2005). Thus, our data come from 18 of the 24 available files
covering a 31-year period from 1972 to 2002. The 2004 data were unavailable at the time we began
our analysis, and we exclude data from 1972 and after 1993 because two variables of interest when
considering the determinants of overall happiness – satisfaction with one’s family and health – are
missing during these years. We also develop and apply appropriate sample weights (e.g., adjusting for
black over-sampling in 1982 and 1987, and the switch from quota to full probability sampling in
1975-76) to increase the likelihood that our results reflect what is true for individuals rather than
households (Stephenson, 1978), and our final sample includes information regarding happiness for
30,239 respondents after dropping observations due to missing values. Specifically, 12,931 of a total
43,698 observations are lost when eliminating 1972 and 1995-2002 data, 241 are dropped due to the
desire to have a sufficient number of observations in each birth cohort (at least 30), and another 241
observations had missing values for at least one variable important for our analysis. Thus, there are
about 1,680 observations on average annually. All respondents are aged 18 to 89 years, and birth
12

cohort values (centered on 1893) range from 0 to 82. Variable definitions, samples sizes, means, and
standard deviations for all variables used in our analysis are presented in Table 1.
<<< Table 1 about Here >>>
Values for global happiness (HAPPY) and satisfaction with one’s financial situation (SATFIN)
span a numeric range of two units (1-3), those for satisfaction with one’s work have a range of three
units (1-4), and all remaining domain satisfaction variables (SATFAM, SATHEALTH,
SATFRIEND, SATPLACE, and SATHOBBY) span a range of six units (1-7). But what questions
were asked to obtain these? The wording of the question for HAPPY reads “Taken all together, how
would you say things are these days – would you say that you are very happy, pretty happy, or not
too happy?” The wording for SATFAM reads “For each area of life I am going to name, tell me the
number that shows how much satisfaction you get from that area.
Your family life:
1) A very great deal 2) A great deal 3) Quite a bit 4) A fair amount 5) Some 6) A little 7) None For SATHEALTH the wording is identical but “Your health and physical condition” replaces
“Your family life.” Like HAPPY, there are three possible responses for SATFIN and the question
asks “We are interested in how people are getting along these days. So far as you and your family are
concerned, would you say that you are pretty well satisfied with your present financial situation,
more or less satisfied, or not satisfied at all?” SATWORK differs from the other three domain
satisfaction variables that turn out to be statistically relevant for understanding men’s and women’s
13

global happiness in two ways. First, whereas all respondents are asked about how satisfied they were
with their families, finances, and health – only those currently working, temporarily not at work, or
keeping house were asked “On the whole, how satisfied are you with the work you do – would you
say you are very satisfied, moderately satisfied, a little dissatisfied, or very dissatisfied?” (Smith,
1990). Second, this is the only domain satisfaction question with four responses (a range of 3 units).
There is also a question in the GSS asking how satistfied respondents are with their marriages.
Although this information would likely be useful for understanding variation in the happiness of
people who are married, we are interested in assessing the determinants of all men and women in
the United States and therefore do not consider this variable. There are also questions in 1996 which
ask respondents about their emotional and spiritual states, but these are not amenable to a life-
course methodological approach given that they are only asked in one year.
What is immediately obvious and on the surface striking from our descriptive statistics is that the
means for HAPPY and some of the domain satisfaction variables are quite similar for men and
women. The only possible exceptions are that men’s satisfaction with their health and hobbies are
slightly higher, and women’s satisfaction with their friends and where they reside are somewhat
higher. Overall, however, these differences are not large – a finding consistent with much research
employing cross-sectional or short-term longitudinal data.
Statistical Analysis of Life Domain Satisfaction and Global Happiness
Our analysis has five steps. First, we estimate 18 ordered logit regression models and select the best
fitting one for men, women, and all adults to adjust self-reported happiness and each of the seven
domain satisfaction variables listed in Table 1 by birth cohort, education, and race to generate
“adjusted” or what we also term “actual” life-cycle trends. We do so because older persons and
those from older cohorts differ somewhat in their demographic composition (having larger
14

proportions of non-blacks and less educated persons), and past research has shown well-being to
vary by these characteristics (Argyle, 1999; Blanchflower & Oswald, 2004; Easterlin, 2001, 2003b;
Frey & Stutzer, 2002). The control for year of birth implies that people in numerous closely
overlapping birth cohorts (of which there are 83) are combined to infer typical life-cycle patterns. In
short, these characteristics are fixed throughout all or most of the adult life-cycle and not controlling
for them would offer a distorted view of happiness trends. Second, we regress adjusted HAPPY
(again using ordered logit) on the seven adjusted domain satisfaction variables to see which domains
best explain variation in global happiness. Next, to assess the value of our model, we use the top
four domain satisfaction variables to predict global happiness among men and women separately.
Fourth, we introduce age group-domain satisfaction interaction terms into our models to estimate
whether men or women adapt to changing life circumstances by switching the weight they place on
family, finances, work, and health as they age as contrasted with adapting within given domains.
Lastly, we derive the “pure effect of aging” on happiness by controlling not only for cohort,
education, and race – but also for satisfaction across various life domains.
RESULTS
Life-Cycle Happiness Trend by Gender
Contrary to conventional stories of mid-life crisis, we estimate (using the parameters reported in
Table 2) that men’s happiness rises and women’s happiness falls sharply from age 18 to 89, and for
all adults taken together happiness rises somewhat from age 18 to 51 and then declines similar to
how it rose during the first half of adult life (Figure 2). Specifically, happiness for all adults rises
from 2.17 to 2.24 (3.5 percent) from age 18 to 51 and then falls to 2.15 (-4.6 percent) by age 89. The
total decrease in happiness over the life course is a mere 0.02 or -1.1 percent on average, but it is
important to keep in mind that these three small movements represent the net balance of many
larger offsetting individual changes revealed in panel studies (Fujita & Diener, 2005). This inverted-
15
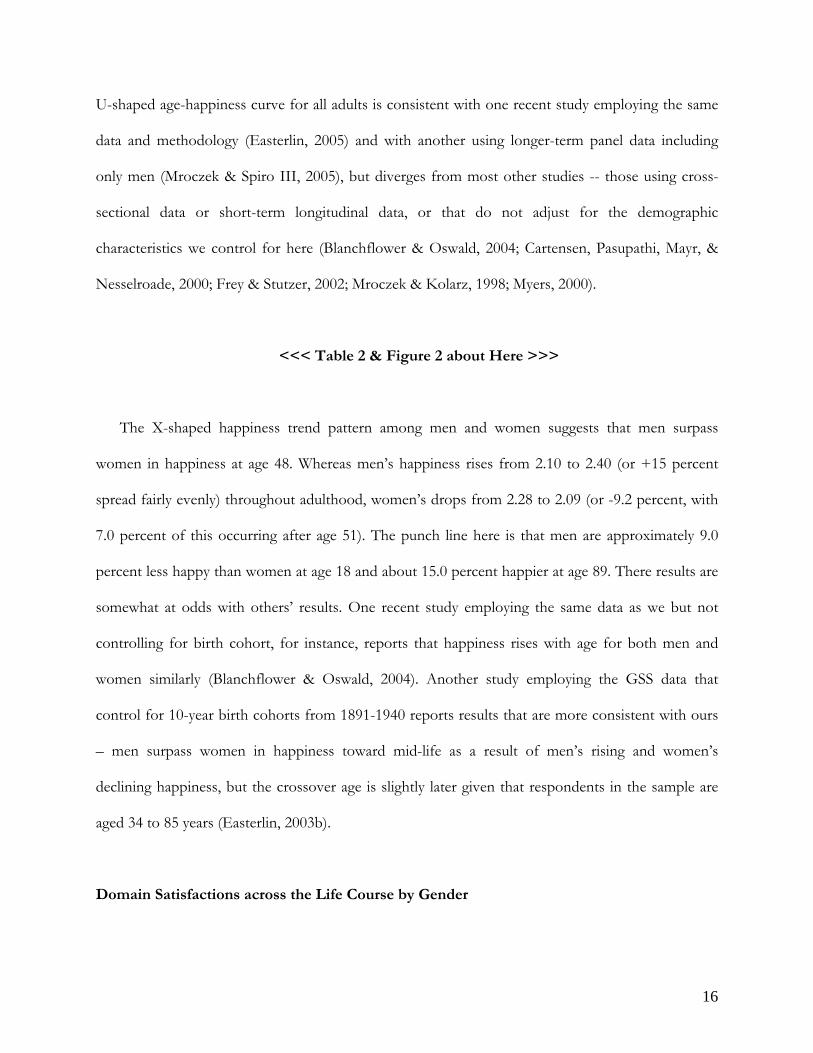
U-shaped age-happiness curve for all adults is consistent with one recent study employing the same
data and methodology (Easterlin, 2005) and with another using longer-term panel data including
only men (Mroczek & Spiro III, 2005), but diverges from most other studies -- those using cross-
sectional data or short-term longitudinal data, or that do not adjust for the demographic
characteristics we control for here (Blanchflower & Oswald, 2004; Cartensen, Pasupathi, Mayr, &
Nesselroade, 2000; Frey & Stutzer, 2002; Mroczek & Kolarz, 1998; Myers, 2000).
<<< Table 2 & Figure 2 about Here >>>
The X-shaped happiness trend pattern among men and women suggests that men surpass
women in happiness at age 48. Whereas men’s happiness rises from 2.10 to 2.40 (or +15 percent
spread fairly evenly) throughout adulthood, women’s drops from 2.28 to 2.09 (or -9.2 percent, with
7.0 percent of this occurring after age 51). The punch line here is that men are approximately 9.0
percent less happy than women at age 18 and about 15.0 percent happier at age 89. There results are
somewhat at odds with others’ results. One recent study employing the same data as we but not
controlling for birth cohort, for instance, reports that happiness rises with age for both men and
women similarly (Blanchflower & Oswald, 2004). Another study employing the GSS data that
control for 10-year birth cohorts from 1891-1940 reports results that are more consistent with ours
– men surpass women in happiness toward mid-life as a result of men’s rising and women’s
declining happiness, but the crossover age is slightly later given that respondents in the sample are
aged 34 to 85 years (Easterlin, 2003b).
Domain Satisfactions across the Life Course by Gender
16

The first piece of evidence challenging a top-down traditional gender role view of happiness and possibly
supporting a bottom-up, life-course domain-interaction adaptation model comes from the life-cycle domain
satisfaction graphs reported in Figures 3 and 4, which are based on the models reported in columns
2-5 and the second and third panels of Table 2. The scales of these graphs, it should be noted, are
adjusted for differences in the number of response categories.
<<< Figures 3 & 4 about Here >>>
If one’s genetic endowment or early childhood development determined one’s future SWB, then
we would expect global happiness to remain relatively stable over the life course for men and
women, and satisfaction with various domains of life simply to mirror this. We have already seen
above in Figure 1 that the age-happiness trajectory is not flat for either men or women, and here we
see that with the possible exceptions of satisfaction with heath among women (Figure 3, bottom
graph) and satisfaction with work among men (Figure 4, top graph), life-cycle variation in
satisfaction with most of the life domains is quite different than it is for happiness by gender. As
discussed above, women’s happiness declines continuously through adulthood, but satisfaction with
their family situation rises until age 48 and then falls to a point only slightly below where it was when
they were 18 (Figure 3, top graph). Women’s satisfaction with their family’s financial situations
moves almost directly against satisfaction with family life by declining first and then rising after age
39. As illustrated in the top graph of Figure 4, these trends for men are similar to that of women’s
but more pronounced, with satisfaction with family rising more steeply until age 55 and then falling,
and satisfaction with finances falling until age 33 and then rising.
Clearly, not only do all four of the domain satisfaction patterns fail to track trends in happiness
by gender as is predicted by set-point and traditional gender role theories, but the formers’ variation
17

is much greater than that of happiness – suggesting that within domain adaptation is quite limited
over the life cycle. It could be, of course, that people alter the importance they place on various
domains of life as they age and that this influences their overall happiness. This we address
momentarily, but first we turn our attention immediately below to the issue of whether domain
satisfaction trends are generally reflective of objective circumstances.
Although investigating the sources of satisfaction in each life domain warrants separate analyses,
the patterns reported here provide some guidance regarding the relative importance of objective
circumstances. The objective-subjective link is most obvious in the family, work, and health
domains. During family formation satisfaction with family rises, and when children begin to leave
home, marital relationships begin to change, and widow- or “widowerhood” (Hatch, 2000: 94)
occurs satisfaction with family begins to wane (Delbes & Gaymu, 2002; Waite, 1995). Similarly, as
careers are being established and people are moving up occupational and prestige ladders,
satisfaction with work rises. Afterwards – at least for women – it begins to fall. The continuous rise
in work satisfaction for men may simply reflect the fact that relatively unhealthy men die sooner
than comparatively unhealthy women and men who survive into the elder years are relatively healthy
and professionally successful – thus they are more likely to remain employed formally. There is some
evidence, furthermore, that being employed is the strongest protector of elder men’s health
(Rushing, Ritter, & Burton, 1992), and men may choose to remain employed for this reason alone.
Lastly, increasing health problems accompany aging during adulthood and satisfaction with health
consequently declines (Reynolds, Crimmins, & Saito, 1998). This all makes sound sense and suggests
that adaptation to changing family, work, and health circumstances is less than complete.
The pattern of satisfaction with family finances over the life cycle by gender, although also
calling into question gender role and set-point theories, provides evidence of an objective-subjective
disconnect rather than link. On average, although incomes rise the longer one works, they eventually
18

level off and begin to decline. For both men and women, and at odds with the economist’s strict
objective bottom-up access to resources model of happiness, satisfaction with family finances moves in
contrast to income trends over the life course. Easterlin (2005) suggests such a pattern may be
explained by lower aspiration levels in this domain as perceptions of material needs decline in later
life, or as family debt declines.
Life-Cycle Domain Satisfactions and Happiness by Gender
The male-female gender gaps in satisfaction with family over the life cycle, and to a smaller degree
with finances – but not in satisfaction with the other two life domains that explain variation in global
happiness fairly well (work and health) – appear to move in the same direction as the male-female
difference in global happiness until mid-life (Figure 5). Thereafter, it appears that trends in the
gender satisfaction gaps in work and health join that in finances to help explain the trajectory of the
gender happiness gap. Is this indeed the case? Previous work investigating how several objective
domain-specific circumstances influence the adult male-female happiness gap in the United States
reports that work and marital status but not health or income help explain the gender happiness gap
(Easterlin, 2003b).
<<< Figure 5 about Here >>>
When regressing happiness on the seven life domain satisfaction variables, we find satisfaction
with family, finances, work, and health (as noted above) to be statistically significant. In other words,
on average, greater satisfaction in each of these domains augments overall happiness. Examining the
effect of each of these domains separately by gender we find that satisfaction with family explains
the most variance in happiness, followed by satisfaction with finances, work, and health (Table 3).
19

Specifically, we see that satisfaction alone accounts for approximately 5.3 to 7.7 percent (pseudo R2
for men and women) of the variance in overall happiness, and that this explanatory power rises to
12.0 to 14.5 percent (again, for men and women) after included all four statistically significant
domain satisfaction variables.
<<< Table 3 about Here >>>
Similar studies analyzing the relationship between satisfaction with various life domains and
overall happiness report similar levels of explanatory power (Easterlin, 2005; Rojas, 2005; Salvatore
& Muñoz Sastre M.T., 2001; van Praag, Frijters, & Ferrer-i-Carbonell, 2003), and it is important to
highlight that these variables were first employed in psychology (Campbell et al., 1976) and are
typically thought to reflect how well objective circumstances match aspirations. Economists usually
focus on the former and ignore the latter, and when we regress global happiness on the typical
demographic and economic variables employed in economics the explanatory power is about one-
half of what we obtain when including our four domain satisfaction variables. These results are not
reported here but are available upon request.
As Easterlin (2005) suggests, although the domain-interaction model employed here explains
more variation (between 12 and 15 percent) in individual happiness than the typical regression
models employed by economists, there is much room for other explanatory factors (e.g., genetics
and personality). This admission; however, should not deflect attention away from the possibility
that satisfaction with various life domains explains average trends in happiness relatively well.
Whereas genes or personality (religious beliefs), for instance, change relatively slowly and may be
important for understanding individual-level differences in happiness (fertility) at a given point in
20

time, life circumstances (economic considerations) change more readily and may be stronger
predictors of life cycle patterns in happiness (fertility) (Easterlin, 1987).
Predicting Life Cycle Happiness from Domain Satisfactions by Gender
So do life cycle patterns in family, financial, work, and health satisfaction among men and women
explain their overall happiness over the life course fairly well even if these domains do not explain
much individual variation? The answer is yes (Figure 6). Predicted happiness at each age from 18 to
89 years is estimated for men and women separately by substituting the age- and gender-specific
mean of each domain satisfaction variable (shown in Figures 3 and 4) into the gender-specific
regression equations reported in column 4 of Table 3. Among women, predicted happiness is lower
than actual (demographically adjusted) happiness until age 32 and the predicted maximum value
occurs at an older age (45 years) than estimated from the “actual” data (18 years). Nonetheless, the
actual and predicted life cycle trends are downward for women. For men, the predicted life-cycle
trend is also consistent with the adjusted estimates, but the former is below the latter until age 44
and the predicted maximum value is 2.28 rather than 2.40 at age 89.
<<< Figure 6 about Here >>>
The close connection between actual and predicted life-cycle happiness by gender joins the X-
shaped gendered happiness relationship (Figure 2) in lending credibility to a bottom-up, domain-
interaction life-cycle model of happiness. Women’s relative happiness through mid-life is sustained
primarily by rising satisfaction with family and work, which collectively offset declines in happiness
due to diminishing satisfaction with finances and health. As mid-life approaches and despite
increasing satisfaction with finances; however, women’s falling happiness due to changes in health
21

satisfaction is accompanied by lower levels of satisfaction with family and work. Men’s lower levels
of happiness compared to women’s before mid-life appear to be driven mostly by men’s lower
satisfaction with family life. Beyond mid-life, men surpass women in happiness because satisfaction
with finances, work and health countervail declining satisfaction with family life.
The above evidence intimates that satisfaction with these four life domains – family, finances,
work, and health – explain a notable amount of variation in life-cycle happiness among men and
women, and consequently much of the gender happiness gap. But could it be that people alter the
importance they place on individual life domains as they age (Parducci, 1995), and could this differ
for men and women in such as way as to explain the gender happiness gap even in the absence of
within-domain adaptation? For instance, could it be that as men become increasingly less content
with their family lives and their health after mid-life and more satisfied with their work and financial
situations that they begin to value the latter two domains more, thus raising their overall well-being?2
We have just seen that men’s and women’s changing life-cycle happiness trajectories are
predicted quite well when employing constant domain weights from only four life domains. This
result by itself suggests cross-domain adaptation is not likely to be an important process by which
overall happiness is determined. But to test this interpretation more carefully we regress happiness
on the same four domain satisfaction variables with age group interaction variables (Table 4).
Coefficients on the age-domain interaction terms indicate whether, on average, adults in the United
States place more weight on different life domains as they age compared to the entire sample. For
example, the -0.046 coefficient in Column 2 in Panel A suggests that adults aged 18-39 years were
less satisfied on average with their family situations compared with the entire adult population.
Comparing the same coefficient in Panel B and Panel C, it appears that this result is driven by men
in this age group being less satisfied on average. The coefficient for women is not statistically 2 For a detailed discussion of how men and women adapt to spousal death and retirement, see Hatch (2000: chapters 5 and 6 especially).
22

significant even at the 90 percent confidence level. The most relevant finding here; however, is that
only four of these 36 age-domain interaction coefficients are statistically significant at the 99 percent
confidence level (e.g., 3 of 12 among all adults viewed collectively, 1 of 12 among women, and none
among men). Put simply, this means that the coefficients are fairly stable across age groups and
neither men nor women are switching the weight they place on various life domains very much as
they age. Among the coefficients that are statistically significant at lower confidence levels,
furthermore, we see some evidence contradicting what would be expected from domain-switching
perspective. Both men and women appear to place decreasing value on finances as they age despite
the fact that satisfaction with this domain is rising over the life cycle.
<<< Table 4 about Here >>>
The “Pure” Effect of Age on Happiness by Gender
Past research has been rather ambiguous concerning the effect of aging itself on global happiness –
as contrasted with the effect of how people adapt to various changing domains over the life cycle.
Some report that no age or stage of life is more privileged and thus the life-cycle pattern of
happiness is flat (Myers, 2000), some find that happiness rises over the life course (Argyle, 1999;
Cartensen et al., 2000; Mroczek & Kolarz, 1998), some estimate the conventional mid-life crisis or
U-shaped pattern (Blanchflower & Oswald, 2004; Frey & Stutzer, 2002), and others suggest the
inverse of the mid-life crisis story – happiness rises until about mid-life and then declines
throughout the rest of life (Easterlin, 2005; Mroczek & Spiro III, 2005). These apparently conflicting
results; however, are likely to be an artifact of different questions being asked and different types of
data or statistical methods being employed (Easterlin, 2005).
23

<<< Table 5 about Here >>>
To identify the “pure effect of aging” on happiness among men and women in the current study
we need to ask how happy younger and older adults having the same levels of satisfaction with
family, financial, work, and health domains were – while still controlling for their birth cohort, race,
and educational attainment. We do this by holding these four life domain satisfaction variables
constant and rerunning our models. Table 5 reports our regression results and Figure 7 shows the
estimated pure effect of age on happiness for all adults collectively and by gender. Consistent with
recent work by some psychologists (Cartensen et al., 2000) but contrary to that of some economists
(Blanchflower & Oswald, 2004; Frey & Stutzer, 2002), we estimate that happiness increases with age
for both men and women. Happiness for men emanating solely from age rises from 2.0 to 2.4, and
happiness for women from 2.2 to 2.3. The pure effect of age on happiness among all adults over this
72-year life span is captured by the thick solid line in Figure 7: happiness rises from 2.0 to 2.3 from
age 18 to 89.
Because our life-cycle domain satisfaction-interaction models predict average actual happiness
fairly well (Figure 6), and these results differ from those produced with our pure age effect models, it
is highly likely that factors other than age are responsible for happiness trajectories among men and
women in the United States. Furthermore, scholars interested in what economists refer to as utility
or welfare would do well to remember that more than improving individual objective circumstances
will be required to augment happiness among men and women: our models perform better than
those employed by economists controlling for individual objective circumstances only.
<<< Figure 7 about Here >>>
24

DISCUSSION
Results reported in this study are somewhat consistent with a parallel development in this field of
research which argues that well-being is better understood by breaking it down into various
component parts such as self-acceptance, ability to control the environments in which one lives,
autonomy, purpose in life, personal growth, and resilience (Keyes et al., 2002). Specifically, we
employ econometric techniques and “synthetic panel” data and find that we can better understand
happiness among men and women in the United States over the life cycle by controlling for at least
one important demographic characteristic ignored in almost all past happiness research (e.g., birth
cohort) and how satisfied adults are with various life domains rather than with individual objective
conditions per se. Men are estimated to be less happy than women from age 18 to 48, but happier
thereafter. Although our models explain a very small fraction of variance in individual-level
happiness (approximately one-seventh to one-eighth), they predict variation in average happiness by
age group and gender quite well. Much of men’s rising and women’s declining happiness from age
18 to 89 is explained by satisfaction in four life domains – family, finances, work, and health. The
three domains of life that are in our data and do not appear to be as important for understanding
trends in overall or global happiness include satisfaction with friends, place of residence, and how
one uses leisure time (Currell, 2005; Robinson & Godbey, 1997).
Building directly on several recent demographic studies of life-cycle well being (Easterlin, 2005;
Hatch, 2000), our research supports a bottom-up, life-course domain-interaction adaptation model of
subjective well-being and challenges more conventional bottom-up access to resources and top-down
traditional gender role models of happiness. Stated simply, our findings are at odds with conventional
approaches and conclusions in economics (e.g., “more is always better) and psychology (e.g., set-
point theory), but consistent with a demographic approach that integrates methods and theories
from these two disciplines as well as from sociology and gerontology. Future work should
25

investigate the influence of individual objective circumstances on satisfaction in particular life
domains over the life cycle, as well as whether the same four domain satisfaction variables found to
be important for understanding gender differences in happiness are helpful for explaining
differences by race, education, nativity, and other demographic characteristics. Another promising
direction subsequent analyses of happiness might take is to consider the effects of heteronomous or
extra-individual factors such as residential segregation, income inequality, social capital, and poverty
(Ellen, Mijanovich, & Dillman, 2001; Helliwell & Putnam, 2004; Kawachi & Berkman, 2003;
Kawachi, Wilkinson, & Kennedy, 1999).
REFERENCES Abraham, K. G., & Mackie, C. (2005). Beyond the Market: Designing Nonmarket Accounts for the United
States. Washington, D.C.: The National Academies Press. Alesina, A., Di Tella, R., & MacCulloch, R. (2004). Inequality and Happiness: Are Europeans and
Americans Different? Journal of Public Economics, 88, 2009-2042. Allen, K. R., & Pickett, R. S. (1987). Forgotten Streams in the Family Life Course: Utilization of
Qualitative Retrospective Interviews in the Analysis of Lifelong Single Women's Family Careers. Journal of Marriage and the Family, 49(3), 517-526.
Aneshensel, C. S., Rutter, C. M., & Lachenhruch, P. A. (1991). Social Structure, Stress, and Mental Health: Competing Conceptual and Analytical Models. American Sociological Review, 56(2), 166-178.
Antonucci, T. C., & Akiyama, H. (1987). An Examination of Sex Differences in Social Support among Older Men and Women. Sex Roles, 17(11/12), 737-749.
Argyle, M. (1990). The Psychology of Happiness. London: Routledge. Argyle, M. (1999). Causes and Correlates of Happiness. In D. Kahneman & E. Diener & N.
Schwartz (Eds.), Well-Being: The Foundations of Hedonic Psychology (pp. 353-373). New York, NY: Russell Sage Foundation.
Argyle, M. (2001). Causes and Correlates of Happiness. In D. Kahneman & E. Diener & N. Schwartz (Eds.), Well-Being: The Foundations of Hedonic Psychology (pp. 353-373). New York, NY: Russell Sage Foundation.
Bach, R. L., & Smith, J. (1977). Community Satisfaction, Expectations of Moving, and Migration. Demography, 14(2), 147-167.
Ball, K., Crawford, D., & Kenardy, J. (2004). Longitudinal Relationships Among Overweight, Life Satisfaction, and Aspirations in Young Women. Obesity Research, 12(6), 1019-1030.
Barer, B. M. (1994). Men and Women Aging Differently. International Journal of Aging and Human Development, 38(1), 29-40.
Bennett, M. K. (1937). On Measurement of Relative National Standards of Licing. Quarterly Journal of Economics, 52(2), 317-336.
Berkman, L. F., & Syme, S. L. (1979). Social Networks, Host Resistance and Mortality: A Nine Year Follow-up Study of Alameda County Residents. American Journal of Epidemiology, 109, 186-204.
26

Blanchflower, D. G., & Oswald, A. J. (2004). Well-being over time in Britain and the USA. Journal of Public Economics, 88, 1359-1386.
Brickman, P., & Campbell, D. T. (1971). Hedonic Relativism and Planning the Good Society. In M. H. Appley (Ed.), Adaptation Level Theory: A Symposium (pp. 287-302). New York, NY: Academic Press.
Campbell, A. (1981). The Sense of Well-Being: Recent Patterns and Trends. New York, NY: McGraw-Hill Book Company.
Campbell, A., Converse, P. E., & Rodgers, W. L. (1976). The Quality of American Life: Perceptions, Evaluations, and Satisfactions. New York, NY: Russell Sage Foundation.
Cannon, W. B. (1928). The Mechanism of Emotional Disturbance of Bodily Functions. New England Journal of Medicine, 198, 877-884.
Cannon, W. B. (1967 [1932]). The Wisdom of the Body: How the Human Body Reacts to Disturbance and Danger and Maintains the Stability Essential to Life. New York, NY: W.W. Norton & Company, Inc.
Carney, R. M., & Freedland, K. E. (2000). Depression and Medical Illness. In L. F. Berkman & I. Kawachi (Eds.), Social Epidemiology (pp. 191-212). New York, NY: Oxford University Press.
Cartensen, L. L., Pasupathi, M., Mayr, U., & Nesselroade, J. R. (2000). Emotional Experience in Everyday Life Across the Adult Life Span. Journal of Personality and Social Psychology, 79(4), 644-655.
Costa Jr., P. T., Zonderman, A. B., McCrae, R. R., Cornoni-Huntley, J., Locke, B. Z., & Barbano, H. E. (1987). Longitudinal Analyses of Psychological Well-Being in a National Sample: Stability of Mean Levels. Journal of Gerontology, 42, 50-55.
Crimmins, E. M., Hayward, M. D., & Saito, Y. (1996). Differentials in Active Life Expectancy in the Older Population of the United States. Journal of Gerontology, 51B(3), S111-S120.
Cummin, E., & Henry, W. E. (1961). Growing Old: The Process of Disengagement. New York, NY: Basic Books.
Currell, S. (2005). The March of Spare Time: The Problem and Promise of Leisure in the Great Depression. Philadelphia, PA: Uinversity of Pennsylvania Press.
Davis, J. A., Smith, T. W., & Marsden, P. V. (2005). General Social Surveys, 1972-2004 [Cumulative File]. Ann Arbor, MI: Inter-university Consortium for Political and Social Research (ICPSR).
De Jong, G. F., Chamratrithirong, A., & Tran, Q.-G. (2002). For Better, For Worse: Life Satisfaction Consequences of Migration. International Migration Review, 36(3), 838-863.
Delbes, C., & Gaymu, J. (2002). The Shock of Widowhood on the Eve of Old Age: Male and Female Experiences. Population-E, 57, 885-914.
Di Tella, R., & MacCulloch, R. (2005). Gross National Happiness as an Answer to the Easterlin Paradox?Unpublished manuscript, Cambridge, MA: Harvard Univiersity.
Diener, E. (2000). Subjective Well-Being: The Science of Happiness and a Proposal for a National Index. American Psychologist, 55(January), 34-43.
Diener, E., & Seligman, M. E. P. (2004). Beyond Money: Toward an Economy of Well-Being. Pschological Science in the Public Interest, 5(1), 1-31.
Diener, E., Suh, E. M., Lucas, R. E., & Smith, H. L. (1999). Subjective Well-Being: Three Decades of Progress. Psychological Bulletin, 125(2), 276-302.
Diener, E., Wolsic, B., & Fujita, F. (1995). Physical Attractiveness and Subjective Well-Being. Journal of Personality and Social Psychology, 69(1), 120-129.
Doyle, T. A., & Forehand, M. J. (1984). Life Satisfaction and Old Age: A Reeamination. Research on Aging, 6(3), 432-448.
Duncan, O. D. (1975). Does Money Buy Satisfaction? Social Indicators Research, 2, 267-274.
27

Easterlin, R. A. (1961). The Ameircan Baby Boom in Historical Perspective. American Economic Review, 51(5), 869-911.
Easterlin, R. A. (1974). Does Economic Growth Improve the Human Lot? Some Empirical Evidence. In David Paul A & Reder Melvin W (Eds.), Nations and Households in Economic Growth: Essays in Honor of Moses Abramovitz (pp. 89-125). New York: Academic Press.
Easterlin, R. A. (1987). Birth and Fortune: The Impact of Numbers on Personal Welfare. Chicago, IL: University of Chicago Press.
Easterlin, R. A. (1995). Will Raising the Incomes of All Increase the Happiness of All? Journal of Economic Behavior and Organization, 27, 35-47.
Easterlin, R. A. (2001). Life Cycle Welfare: Trends and Differences. Journal of Happiness Studies, 2, 1-12.
Easterlin, R. A. (2003a). Explaining Happiness. Proceedings of the National Academy of Sciences, 100(19), 11176-11183.
Easterlin, R. A. (2003b). Happiness of Women and Men in Later Life: Nature, Determinants, and Prospects. In J. M. Sirgy & D. Rahtz & C. A. Samli (Eds.), Advances in Quality-of-Life Theory and Research (pp. 13-26). Dordrecht, The Netherlands: Kluwer Academic Publishers.
Easterlin, R. A. (2005). Life Cycle Happiness and Its Sources.Unpublished manuscript, Los Angeles, CA. Elder Jr., G. H. (1974). Children of the Great Depression: Social Change in Life Experience. Chicago, IL:
University of Chicago. Elder Jr., G. H., & Liker, J. K. (1982). Hard Times in Women's Lives: HIstorical Influences across
Forty Years. American Journal of Sociology, 88(2), 241-269. Ellen, G. I., Mijanovich, T., & Dillman, K.-N. (2001). Neihgborhood Effects on Health: Exploring
the Links and Assessing the Evidence. Journal of Urban Affairs, 23(3-4), 391-408. Frey, B. S., & Stutzer, A. (2002). Happiness & Economics. Princeton, NJ: Princeton University Press. Fujita, F., & Diener, E. (2005). Life Satisfaction Set Point: Stability and Change. Journal of Personality
and Social Psychology, 88(1), 158-164. George, L. K. (1996). Missing Links: The Case for a Social Psychology of the Life Course. The
Gerontologist, 36(2), 248-255. Glick, P. C. (1977). Updating the Life Cycle of the Family. Journal of Marriage and the Family, 39(1), 5-
13. Gove, W. R., & Tudor, J. F. (1973). Adult Sex Roles and Mental Illness. American Journal of Sociology,
78(4), 812-835. Graham, C. (2005). Insights on Development from the Economics of Happiness. World Bank
Research Observer, 20(2), 1-30. Hagerty, M. (2000). Social Comparisons of Income in One's Community: Evidence from National
Surveys of Income and Happiness. Journal of Personality and Social Psychology, 78(4), 764-771. Hareven, T. K. (1978). Introduction: The Historical Study of the Life Course. In T. K. Hareven
(Ed.), Tranistions: The Family and the Life Course in Historical Perspective (pp. 1-16). New York, NY: Academic Press.
Hatch, L. R. (2000). Beyond Gender Differences: Adaptation to Aging in Life Course Perspective. Amityville, NY: Baywood Publishing Company, Inc.
Headey, B., & Wearing, A. (1989). Personality, Life Events, and Subjective Well-Being: Toward a Dynamic Equilibrium Model. Journal of Personality and Social Psychology, 57(4), 731-739.
Helliwell, J. F., & Putnam, R. D. (2004). The Social Context of Well-Being. Philosophical Transactions: Biological Sciences, 359(1449), 1435-1446.
Holmes, T. H., & Rahe, R. H. (1967). The Social Readjustment Scale. Journal of Psuchosomatic Research, 11(1), 213-218.
28
Inglehart, R. F. (1990). Culture Shift in Advanced Industrial Society. Princeton, NJ: Princeton Univeristy Press.
Kahneman, D., Diener, E., & Schwartz, N. (Eds.). (1999). Well-Being: The Foundations of Hedonic Psychology. New York, NY: Russell Sage Foundation.
Kahneman, D., Krueger, A. B., Schkade, D. A., Schwarz, N., & Stone, A. A. (2004). A Survey Method for Characterizing Daily Life Experience: The Day Reconstruction Method (DRM). Science, 306, 1776-1780.
Kanter, R. M. (1977). Men and Women of the Corporation. New York, NY: Basic Books. Kawachi, I., & Berkman, L. F. (Eds.). (2003). Neighborhoods and Health. New York, NY: Oxford
University Press. Kawachi, I., Wilkinson, R. G., & Kennedy, B. P. (1999). Introduction. In Kawachi Ichiro &
Kennedy Bruce P. & Wilkinson R. G. (Eds.), The Society and Population Health Reader: Volume I: Income Inequality and Health (pp. xi-xxxiv). New York, NY: The New Press.
Keyes, C. L. M., Shmotkin, D., & Ryff, C. D. (2002). Optimizing Well-Being: The Empirical Encounter of Two Traditions. Journal of Personality and Social Psychology, 82(6), 1007-1022.
Keyfitz, N., & Litman, G. (1979). Mortality in a Heterogeneous Population. Population Studies, 33, 333-343.
Konow, J., & Earley, J. (2003). The Hedonic Paradox: Is Homo Economicus Happier?Unpublished manuscript, Los Angeles, CA: Department of Economics, Loyola Marymount University.
Kubansky, L. D., & Kawachi, I. (2000). Affective States and Health. In L. F. Berkman & I. Kawachi (Eds.), Social Epidemiology (pp. 213-241). New York, NY: Oxford University Press.
Kuznets, S. (1941). National Income and Its Components, 1919-1938. New York: NBER. Lamb, V. L., & Siegel, J. S. (2004). Health Demography. In J. S. Siegel & D. A. Swanson (Eds.), The
Methods and Material of Demography, 2nd Edition (pp. 341-370). New York, NY: Elsevier Academic Press.
Landale, N. S., & Guest, A. M. (1985). Constraints, Satisfaction and Residential Mobility: Speare's Model Reconsidered. Demography, 22(2), 199-222.
Layard, R. (2005). Happiness and Public Policy. London, England: London School of Economics. Lee, B. A., Oropesa, R. S., & Kanan, J. W. (1994). Neighborhood Context and Residentia Mobility.
Demography, 31(2), 249-270. Lorber, J. (1994). Paradoxes of Gender. New Haven, CT: Yale Univeristy Press. Lucas, R. E., Clark, A. E., Georgellis, Y., & Diener, E. (2003). Reexamining Adaptation and the Set
Point Model of Happiness: Reactions to Changes in Marital Status. Journal of Personality and Social Psychology, 84(3), 527-539.
Lucas, R. E., Clark, A. E., Georgellis, Y., & Diener, E. (2004). Unemployment Alters the Set Point for Life Satisfaction. Pscyhological Science, 15(1), 8-13.
Lykken, D. (1999). Happiness: The Nature and Nurture of Joy and Contentment. New York, NY: St. Martin's Griffen.
Lykken, D., & Tellegen, A. (1996). Hapiness is a Stochastic Phenomenon. Psychological Science, 7(3), 186-189.
Manton, K. G., & Myers, G. C. (1987). Recent Trends in Multiple-Caused Mortality, 1968-1982. Population Research and Policy Review, 6, 161-176.
Manton, K. G., & Stallard, E. (1982). A Cohort Analysis of U.S. Stomach Cancer Mortality: 1950 to 1977. International Journal of Epidemiology, 11, 49-61.
Marini, M. M. (1976). Dimensions of Marriage Happiness: A Research Note. Journal of Marriage and the Family, 38(3), 443-448.
Marini, M. M. (1980). Effects of the Number and Spacing of Children on Martial and Parental Satisfaction. Demography, 17(3), 225-242.
29

Mastekaasa, A. (1992). Marriage and Psychological Well-Being: Some Evidence on Selection into Marriage. Journal of Marriage and the Family, 54(4), 901-911.
Mayer, J. (1968). Overweight: Causes, Cost, and Control. Englewood Cliffs, NJ: Prentice-Hall, Inc. McEwen, B. S., & Lasley, E. N. (2002). The End of Stress as We Know It. Washington, D.C.: Joseph
Henry Press. McHugh, K. E., Gober, P., & Reid, N. (1990). Determinants fo Short- and Long-Term Mobility
Expectations for Home Owners and Renters. Demography, 27(1), 81-95. Morgan, L. A. (1986). The Financial Experience of Widowed Women: Evidence from the LRHS.
The Gerontologist, 26(6), 663-668. Mroczek, D. K., & Kolarz, C. M. (1998). The Effect of Age on Positive and Negative Affect: A
Developmental Perspective on Happiness. Journal of Personality and Social Psychology, 75(5), 1333-1349.
Mroczek, D. K., & Spiro III, A. (2005). Change in Life Satisfaction During Adulthood: Findings from the Veterans Affairs Nornative Aging Study. Journal of Personality and Social Psychology, 88(1), 189-202.
Myers, D. G. (2000). The Funds, Friends, and Faith of Happy People. American Psychologist, 55(1), 56-67.
Myers, D. G., & Diener, E. (1995). Who is Happy? Psychological Science, 6, 10-19. Nolen-Hoeksema, S., & Rusting, C. L. (1999). Gender Differences in Well-Being. In D. Kahneman
& E. Diener & N. Schwarz (Eds.), Well-Being: The Foundations of Hedonic Psychology (pp. 330-350). New York, NY: Russell Sage Foundation.
Nordhaus, W. D., & Tobin, J. (1973). Is Growth Obsolete? In M. Moss (Ed.), The Measurement of Economic and Social Performance. New York: NBER.
O'Rand, A. M. (1996). The Precious and the Precocious: Understanding Cumulative Disadvantage and Cumulative Advantage over the Life Course. The Gerontologist, 36(2), 230-238.
Parducci, A. (1995). Happiness, Pleasure, and Jusgement: The Contextual Theory and Its Applications. Mahwah, NJ: Erlbaum.
Parsons, T. (1955). Sex Roles in the American Kinship System. In T. Parsons & R. F. Bales (Eds.), Family, Socialization, and Interaction Processes (pp. 324-328). New York, NY: The Free Press.
Patrick, C. H., Palesch, Y. Y., Feinleib, M., & Brody, J. A. (1982). Sex-Differences in Declining Cohort Death Rates from Heart Disease. American Journal of Public Health, 72, 161-166.
Patrick, D. L., & Erickson, P. (1993). Health Status and Health Policy: Quality of Life in Health Care Evaluation and Resource Allocation. New York, NY: Oxford University Press.
Pearlin, L. I., & Schooler, C. (1978). The structure of Coping. Journal of Health and Social Behavior, 19(1), 2-21.
Pearlin, L. I., & Skaff, M. M. (1996). Stress and the Life CourseL A Paradigmatic Alliance. The Gerontologist, 36(2), 239-247.
Pinhey, T. K., Rubinstein, D. H., & Colfax, R. S. (1997). Overweight and Happiness: The Reflected Self-Appraisal Hypothesis Reconsidered. Social Science Quarterly, 78(3), 747-755.
Putnam, R. (2000). Bowling Alone: The Collapse and Revival of American Community. New York, NY: Simon and Schuster.
Rahman, O., Strauss, J., Gertler, P., Ashley, D., & Fox, K. (1994). Gender Differences in Adult Health: An International Comparison. The Gerontologist, 34(4), 463-469.
Reynolds, S. L., Crimmins, E. M., & Saito, Y. (1998). Cohort Differences in Diability and Disease. The Gerontologist, 38, 576-590.
Robinson, J. P., & Godbey, G. (1997). Time for Life: The Surprising Ways Americans Use Their Time. University Park, PA: Pennsylvania State University Pree.
30
Rojas, M. (2005). The Complexity of Well-BeingL A Life Satisfaction Conception and Domains-of-Life Approach. In I. Gough & A. NcGregor (Eds.), Researching Well-Being in Developing Countries (pp. forthcoming). New York, NY: Cambridge University Press.
Rushing, B., Ritter, C., & Burton, R. P. D. (1992). Race Differences in the Effects of Multiple Roles on Health: Longitudinal Evidence from a National Sample of Older Men. Journal of Health and Social Behavior, 33(2), 126-139.
Ryder, N. B. (1965). The Cohort as a Concept in the Study of Social Change. American Sociological Review, 30(6), 843-861.
Ryff, C. D. (1989). Happiness is Everything, or Is It? Explorations on the Mean of Subjective Well-Being. Journal of Personality and Social Psychology, 57(6), 1069-1081.
Ryff, C. D., & Keyes, C. L. M. (1995). The Structure of Psychological Well-Being Revisted. Journal of Personality and Social Psychology, 69(4), 719-727.
Salvatore, N., & Muñoz Sastre M.T. (2001). Apraisal of Life:"Area" Versus "Dimension" Conceptualizations. Social Indicators Research, 53, 229-255.
Schaie, K. W. (1965). A General Model for the Study of Developmental Problems. Psychological Bulletin, 64(2), 92-107.
Scitovsky, T. (1992 [1976]). The Joyless Economy: The Psychology of Human Satisfaction. New York, NY: Oxford University Press.
Seidlitz, L., & Diener, E. (1998). Sex Differences in the Recall of Affective Experiences. Journal of Personality and Social Psychology, 74(1), 262-271.
Smith, T. W. (1990). Timely Artifacts: A Review of Measurement Variation in th 1972-1989 GSS. Chicago, IL: NORC.
Speare Jr., A. (1974). Residential Satisfaction as an Intervening Variable in Residential Mobility. Demography, 11(2), 173-188.
Springer, K. W., & Hauser, R. M. (2005). Survey Measurement of Psychological Well-Being. Social Science Research, forthcoming.
Steel, P., & Ones, D. S. (2002). Personality and Happiness: A National-Level Analysis. Journal of Personality and Social Psychology, 83(3), 767-781.
Stephenson, C. B. (1978). Weighting the General Social Surveys for Bias Related to Household Size. Chicago, IL: Inter-university Consortium for Political and Social Research (ICPSR).
Taylor, S. E. (2002). The Tending Instinct: How Nurturing is Essential for Who We Are and How We Live. New York, NY: Times Books.
Thomas, W. I., & Znaniecki, F. (1918). The Polish Peasant in Europe and America. Chicago, IL: University of Chicago Press.
U.S. Centers for Disease Control and Prevention. (2000). Measuring Healthy Days. Atlanta, GA: Centers for Disease Control and Prevention.
Umberson, D., Wortman, C. B., & Kessler, R. C. (1992). Widowhood and Depression: Explaining Long-term Gender Differences in Vulnerability. Journal of Health and Social Behavior, 33(1), 10-24.
van Praag, B. M. S., & Frijters, P. (1999). The Measurement of Welfare and Well Being: The Leyden Approach. In D. Kahneman & E. Diener & N. Schwarz (Eds.), Well-Being: The Foundations of Hedonic Psychology (pp. 413-433). New York, NY: Russell Sage Foundation.
van Praag, B. M. S., Frijters, P., & Ferrer-i-Carbonell, A. (2003). The Anatomy of Subjective Well-Being. Journal of Economic Behavior and Organization, 51, 29-49.
Waite, L. J. (1995). Does Marriage Matter? Demography, 32(4), 483-507. West, C., & Zimmerman, D. H. (1987). Doing Gender. Gender and Society, 1(2), 125-151. White, J. M. (1992). Marital Status and Well-Being in Canada. Journal Family Issues, 13, 390-409.
31

Wood, W., Rhodes, N., & Whelan, M. (1989). Sex Differences in Positive Well-Being: A Consideration of Emotional Style and Marital Status. Psychological Bulletin, 106, 249-264.
Young, T. K. (2005). Population Health: Concepts and Methods, 2nd Edition. New York, NY: Oxford University Press.
32

Figure 1. Psychological, Economic, and Sociological Theories of Happiness
Psychology’s Top-Down or Economics’ Bottom-Up or “Set-Point” Theory “Domain Adaptation” Theory
Objective Circumstances or
Life-Cycle, Domain-
InteractionsGender Role
Resources
Global Happiness

Table 1: Variable Definitions and Weighted Sample Characteristics, Adults Aged 18-89 by Gender, United States, 1973-1994 Variable Name Definition Observations Mean SDHAPPY "Not too happy" (= 1), "Pretty happy" (= 2), "Very happy" (= 3) 30,239 2.232 0.678 2.224 2.239AGE Respondent's age in years (= 18 to 89) 30,239 43.790 18.213 43.584 43.995BIRTH COHORT Year of birth minus 1890 (= -7 to 92) 30,239 47.221 19.470 47.001 47.440MALE Dummy variable = 1 if respondent reported being male, = 0 if female 30,239 0.452 0.541 0.446 0.458BLACK Dummy variable = 1 if respondent reported being black, = 0 if non-black 30,239 0.110 0.332 0.106 0.114EDUC<12YEARS Dummy variable = 1 if respondent did not complete high school, = 0 s/he did 30,239 0.612 0.528 0.606 0.618SATFIN How Satisfied with family financial situation? ("Not at all"=1 to "Pretty well satisfied"=3) 30,126 2.050 0.801 2.041 2.059SATFAM Satisfaction obtained from family life ("none"=1 to "a very great deal"=7) 23,655 5.996 1.317 5.979 6.013SATWORK How satisfied with one's work? ("Very dissatisfied"=1 to "Very satisfied"=4) 24,178 3.289 0.874 3.278 3.300SATHEALTH Satisfaction obtained from health/physical condition ("none"=1 to "a very great deal"=7) 23,701 5.462 1.587 5.442 5.482SATFRIEND Satisfaction obtained from friendships ("none"=1 to "a very great deal"=7) 23,707 5.785 1.312 5.768 5.802SATPLACE Satisfaction obtained from place of residence ("none"=1 to "a very great deal"=7) 23,712 5.083 1.638 5.062 5.104SATHOBBY Satisfaction obtained from non-working activities ("none"=1 to "a very great deal"=7) 23,623 5.321 1.693 5.300 5.343
Variable Name Definition Observations Mean SDHAPPY "Not too happy" (= 1), "Pretty happy" (= 2), "Very happy" (= 3) 13,177 2.219 0.669 2.207 2.230AGE Respondent's age in years (= 18 to 89) 13,177 43.421 18.202 43.110 43.731BIRTH COHORT Year of birth minus 1890 (= -7 to 92) 13,177 47.525 19.541 47.191 47.858BLACK Dummy variable = 1 if respondent reported being black, = 0 if non-black 13,177 0.100 0.320 0.095 0.106EDUC<12YEARS Dummy variable = 1 if respondent did not complete high school, = 0 s/he did 13,177 0.580 0.529 0.571 0.589SATFIN How Satisfied with family financial situation? ("Not at all"=1 to "Pretty well satisfied"=3) 13,129 2.059 0.798 2.045 2.072SATFAM Satisfaction obtained from family life ("none"=1 to "a very great deal"=7) 10,299 5.929 1.348 5.903 5.955SATWORK How satisfied with one's work? ("Very dissatisfied"=1 to "Very satisfied"=4) 10,175 3.289 0.869 3.272 3.306SATHEALTH Satisfaction obtained from health/physical condition ("none"=1 to "a very great deal"=7) 10,324 5.525 1.537 5.496 5.555SATFRIEND Satisfaction obtained from friendships ("none"=1 to "a very great deal"=7) 10,335 5.705 1.309 5.680 5.730SATPLACE Satisfaction obtained from place of residence ("none"=1 to "a very great deal"=7) 10,338 5.048 1.596 5.018 5.079SATHOBBY Satisfaction obtained from non-working activities ("none"=1 to "a very great deal"=7) 10,311 5.393 1.631 5.362 5.425
Variable Name Definition Observations Mean SDHAPPY "Not too happy" (= 1), "Pretty happy" (= 2), "Very happy" (= 3) 17,062 2.243 0.685 2.232 2.253AGE Respondent's age in years (= 18 to 89) 17,062 44.094 18.204 43.821 44.367BIRTH COHORT Year of birth minus 1890 (= -7 to 92) 17,062 46.970 19.385 46.679 47.261BLACK Dummy variable = 1 if respondent reported being black, = 0 if non-black 17,062 0.118 0.342 0.113 0.123EDUC<12YEARS Dummy variable = 1 if respondent did not complete high school, = 0 s/he did 17,062 0.638 0.524 0.630 0.646SATFIN How Satisfied with family financial situation? ("Not at all"=1 to "Pretty well satisfied"=3) 16,997 2.043 0.803 2.031 2.055SATFAM Satisfaction obtained from family life ("none"=1 to "a very great deal"=7) 13,356 6.051 1.286 6.029 6.072SATWORK How satisfied with one's work? ("Very dissatisfied"=1 to "Very satisfied"=4) 14,003 3.288 0.877 3.274 3.303SATHEALTH Satisfaction obtained from health/physical condition ("none"=1 to "a very great deal"=7) 13,377 5.410 1.627 5.382 5.438SATFRIEND Satisfaction obtained from friendships ("none"=1 to "a very great deal"=7) 13,372 5.851 1.309 5.828 5.873SATPLACE Satisfaction obtained from place of residence ("none"=1 to "a very great deal"=7) 13,374 5.111 1.671 5.083 5.139SATHOBBY Satisfaction obtained from non-working activities ("none"=1 to "a very great deal"=7) 13,312 5.262 1.740 5.232 5.291
Note: 1973-1994 Geneneral Social Survey (GSS) Data employed to produce unweighted N and weighted sample descriptive statistics (with STATA's SVY commands)
Men
All Adults
Women
95% Confidence Interval
95% Confidence Interval
95% Confidence Interval

Table 2: Demographically “Adjusted” Well-Being: Ordered Logit Regression of Happiness
and Life Domain Satisfactions on Age, Birth Cohort, Education, and Race A. All Adults
Variable β S.E. β S.E. β S.E. β S.E. β S.E.AGE 0.021 0.006 a 0.047 0.005 a -0.032 0.004 a 0.048 0.008 a -0.031 0.007 a
AGE SQUARED -0.0002 0.0001 a -0.0005 0.0000 a 0.0004 0.0000 a -0.0004 0.0001 a 0.0001 0.0001 c
BIRTH COHORT -0.017 0.005 a -- -- -0.011 0.002 a -0.024 0.007 a 0.029 0.006 a
BIRTH COHORT SQUARED 0.0001 0.0001 b -- -- -- -- 0.00013 0.00007 c -0.00036 0.00006 a
MALE -0.106 0.025 a -0.183 0.026 a 0.018 0.024 0.028 0.027 0.105 0.026 a
BLACK -0.748 0.041 a -0.475 0.042 a -0.671 0.039 a -0.450 0.042 a -0.238 0.039 a
< HIGH SCHOOL -0.265 0.025 a -0.109 0.027 a -0.395 0.025 a -0.217 0.028 a -0.231 0.027 a
Dependent Variable Category 1 Cut-point -2.462 0.197 -3.660 0.113 -2.371 0.189 -2.970 0.223 -4.756 0.216Dependent Variable Category 2 Cut-point 0.365 0.195 -2.754 0.107 -0.333 0.188 -1.616 0.221 -3.647 0.212Dependent Variable Category 3 Cut-point -- -- -2.099 0.105 -- -- 0.341 0.221 -3.006 0.211Dependent Variable Category 4 Cut-point -- -- -1.222 0.103 -- -- -- -- -1.895 0.211Dependent Variable Category 5 Cut-point -- -- -0.459 0.103 -- -- -- -- -1.175 0.211Dependent Variable Category 6 Cut-point -- -- 1.060 0.103 -- -- -- -- 0.259 0.210
NChi2
LRPseudo-R2
B. Men
Variable β S.E. β S.E. β S.E. β S.E. β S.E.AGE 0.018 0.007 a 0.061 0.007 a -0.036 0.007 a 0.014 0.013 -0.045 0.010 a
AGE SQUARED -0.00004 0.00007 -0.00055 0.00007 a 0.00053 0.00006 a 0.00004 0.00016 0.00028 0.00011 a
BIRTH COHORT 0.001 0.003 0.000 0.003 -0.007 0.003 a -0.026 0.012 c 0.027 0.009 a
BIRTH COHORT SQUARED -- -- -- -- -- -- 0.0002 0.0001 -0.0004 0.0001 a
BLACK -0.538 0.065 a -0.371 0.067 a -0.640 0.063 a -0.392 0.06978 a -0.109 0.064 c
< HIGH SCHOOL -0.203 0.038 a -0.029 0.040 -0.422 0.037 a -0.224 0.04149 a -0.118 0.039 a
Dependent Variable Category 1 Cut-point -1.554 0.286 -2.835 0.317 -2.202 0.281 -3.657 0.364 -5.075 0.325Dependent Variable Category 2 Cut-point 1.314 0.286 -1.997 0.315 -0.180 0.281 -2.310 0.362 -4.049 0.320Dependent Variable Category 3 Cut-point -- -- -1.343 0.313 -- -- -0.343 0.361 -3.389 0.319Dependent Variable Category 4 Cut-point -- -- -0.551 0.312 -- -- -- -- -2.307 0.318Dependent Variable Category 5 Cut-point -- -- 0.190 0.312 -- -- -- -- -1.577 0.318Dependent Variable Category 6 Cut-point -- -- 1.731 0.312 -- -- -- -- -0.094 0.317
NChi2
LRPseudo-R2
C. Women
Variable β S.E. β S.E. β S.E. β S.E. β S.E.AGE 0.003 0.006 0.023 0.009 b -0.029 0.006 a 0.060 0.010 a -0.022 0.009 a
AGE SQUARED -0.0001 0.0001 b -0.0002 0.0001 a 0.0004 0.0001 a -0.0006 0.0001 a 0.0000 0.0001BIRTH COHORT -0.011 0.002 a 0.019 0.008 b -0.013 0.002 a -0.023 0.009 a 0.032 0.008 a
BIRTH COHORT SQUARED -- -- -0.0002 0.0001 b -- -- 0.0001 0.0001 -0.0004 0.0001 a
BLACK -0.903 0.053 a -0.561 0.054 a -0.691 0.049 a -0.494 0.052 a -0.334 0.050 a
< HIGH SCHOOL -0.327 0.034 a -0.174 0.038 a -0.376 0.034 a -0.217 0.038 a -0.339 0.036 a
Dependent Variable Category 1 Cut-point -3.066 0.264 -3.984 0.314 -2.532 0.253 -2.728 0.287 -4.587 0.288Dependent Variable Category 2 Cut-point -0.262 0.261 -2.989 0.303 -0.481 0.252 -1.369 0.284 -3.418 0.281Dependent Variable Category 3 Cut-point -- -- -2.331 0.301 -- -- 0.582 0.284 -2.790 0.280Dependent Variable Category 4 Cut-point -- -- -1.362 0.299 -- -- -- -- -1.655 0.280Dependent Variable Category 5 Cut-point -- -- -0.577 0.298 -- -- -- -- -0.941 0.279Dependent Variable Category 6 Cut-point -- -- 0.934 0.298 -- -- -- -- 0.457 0.279
NChi2
LRPseudo-R2
830.21-17,5720.026
14,003471.02-14,9420.018
13,356202.73-17,5720.007
1. Happy 2. SatFam 3. SatFin 4. SatWork 5. SatHealth
1. Happy 2. SatFam 3. SatFin 4. SatWork 5. SatHealth
1. Happy 2. SatFam 3. SatFin 4. SatWork 5. SatHealth
30,239553.18-27,9350.012
23,655295.69-31,9560.006
30,1261472.78-31,2850.027
24,178830.32-25,7650.019
-37,8960.012
23,701790.92
10,324222.07
13,377592.43-21,6090.015
Note: 1973-1994 GSS data employed. First column of each happiness or domain satisfaction variable is the estimated coefficient and the second column is the standard error obtained with STATA's SVY commands and sampling weights. A superscript "a" indicates a 99% confidence level, a "b" indicates a 95% level, and a "c" indicates a 90% level.
-15,770
0.0280.007-16,267
10,175389.42-10,805
0.0080.022
13,129647.69-13,630
10,299148.07-14,294
13,177218.96-12,1200.011
16,99717,062400.32
0.016

Figure 2: The X-Shaped Gender Life-Cycle Happiness Relationship
2.0
2.1
2.2
2.3
2.4
18 21 24 27 30 33 36 39 42 45 48 51 54 57 60 63 66 69 72 75 78 81 84 87
All Women Men
Age (Years)
Adj
uste
d G
loba
l Hap
pine
ss
Crossover Point between Age 48 and 49
Happiness Maximum Point at Age 51

Figure 3: Women’s Satisfaction with Family, Financial, Work, and Health Life Domains
1.9
2
2.1
2.2
2.3
2.4
2.5
2.618 21 24 27 30 33 36 39 42 45 48 51 54 57 60 63 66 69 72 75 78 81 84 87
5.0
5.2
5.4
5.6
5.8
6.0
6.2
FINANCIAL
FAMILY
3
3.1
3.2
3.3
3.4
3.5
3.6
18 21 24 27 30 33 36 39 42 45 48 51 54 57 60 63 66 69 72 75 78 81 84 87
4.8
5.0
5.2
5.4
5.6
5.8
6.0
WORK
HEALTH

Figure 4: Men’s Satisfaction with Family, Financial, Work, and Health Life Domains
1.9
2
2.1
2.2
2.3
2.4
2.5
2.6
18 21 24 27 30 33 36 39 42 45 48 51 54 57 60 63 66 69 72 75 78 81 84 87
4.9
5.1
5.3
5.5
5.7
5.9
6.1
FINANCIAL
FAMILY
3.1
3.2
3.3
3.4
3.5
3.6
3.7
18 21 24 27 30 33 36 39 42 45 48 51 54 57 60 63 66 69 72 75 78 81 84 87
4.9
5.1
5.3
5.5
5.7
5.9
6.1
WORK
HEALTH

Figure 5: Excess Men-to-Women Happiness and Satisfaction with Four Life Domains (Percentage Point Difference)
-0.6
-0.4
-0.2
0
0.2
0.4
0.6
18 21 24 27 30 33 36 39 42 45 48 51 54 57 60 63 66 69 72 75 78 81 84 87
HAPPINESS
-0.6
-0.4
-0.2
0
0.2
0.4
0.6
18 21 24 27 30 33 36 39 42 45 48 51 54 57 60 63 66 69 72 75 78 81 84 87
FAMILY
-0.6
-0.4
-0.2
0
0.2
0.4
0.6
18 21 24 27 30 33 36 39 42 45 48 51 54 57 60 63 66 69 72 75 78 81 84 87
FINANCIAL
-0.6
-0.4
-0.2
0
0.2
0.4
0.6
18 21 24 27 30 33 36 39 42 45 48 51 54 57 60 63 66 69 72 75 78 81 84 87
WORK
-0.6
-0.4
-0.2
0
0.2
0.4
0.6
18 21 24 27 30 33 36 39 42 45 48 51 54 57 60 63 66 69 72 75 78 81 84 87
HEALTH

Table 3: Ordered Logit Regression of Global Happiness on Life Domain Satisfactions
Satisfaction by Life Domain (1) (2) (3) (4)SATFAM 0.600 0.565 0.527 0.461SATFIN -- 0.713 0.605 0.575SATWORK -- -- 0.523 0.501SATHEALTH -- -- -- 0.241
Happiness Category 1 Cut-point 1.209 2.343 3.540 4.308Happiness Category 2 Cut-point 4.337 5.624 6.929 7.757
n 18,814 18,814 18,814 18,814Chi2 1,694.28 2,561.69 2,938.54 3,189.21Log Likelihood -16,325 -15,719 -15,355 -15,145Pseudo R2 0.066 0.100 0.121 0.133
Satisfaction by Life Domain (1) (2) (3) (4)SATFAM 0.509 0.475 0.447 0.387SATFIN -- 0.712 0.582 0.560SATWORK -- -- 0.538 0.525SATHEALTH -- -- -- 0.235
Happiness Category 1 Cut-point 0.672 1.826 3.079 3.936Happiness Category 2 Cut-point 3.832 5.142 6.512 7.417
n 7,870 7,870 7,870 7,870Chi2 596.43 994.28 1,137.69 1,209.55Log Likelihood -6,846 -6,595 -6,439 -6,363Pseudo R2 0.053 0.088 0.110 0.120
Satisfaction by Life Domain (1) (2) (3) (4)SATFAM 0.684 0.646 0.600 0.523SATFIN -- 0.716 0.625 0.588SATWORK -- -- 0.508 0.481SATHEALTH -- -- -- 0.249
Happiness Category 1 Cut-point 1.708 2.818 3.954 4.644Happiness Category 2 Cut-point 4.821 6.082 7.320 8.078
n 10,944 10,944 10,944 10,944Chi2 1,108.23 1,582.01 1,828.31 2,009.78Log Likelihood -9,447 -9,092 -8,891 -8,751Pseudo R2 0.077 0.112 0.131 0.145
Men
Note: 1973-1994 GSS data employed; all coefficients are statistically significant at the 99% confidence level (p>|z|=0.000)
All Adults
Women

Figure 6: Predicted Happiness by Gender
1.0
1.2
1.4
1.6
1.8
2.0
2.2
2.4
2.6
2.8
3.0
18 21 24 27 30 33 36 39 42 45 48 51 54 57 60 63 66 69 72 75 78 81 84 87
R2 = 0.2373
Adjusted
Predicted
Age (Years)
WOMEN
1.0
1.2
1.4
1.6
1.8
2.0
2.2
2.4
2.6
2.8
3.0
18 21 24 27 30 33 36 39 42 45 48 51 54 57 60 63 66 69 72 75 78 81 84 87
R2 = 0.1956
Age (Years)
Adjusted
Predicted
MEN

Table 4: Life Domain Adaptation over the Life Cycle?: Ordered Logit Regression Analysis of Happiness with Age Group Interactions
A. ALL ADULTS
Variable β S.E. β S.E. β S.E. β S.E.SATFAM 0.461 0.015 a 0.485 0.021 a 0.443 0.018 a 0.461 0.016 a
SATFIN 0.575 0.024 a 0.501 0.035 a 0.608 0.029 a 0.589 0.025 a
SATWORK 0.501 0.022 a 0.501 0.033 a 0.522 0.026 a 0.481 0.023 a
SATHEALTH 0.241 0.014 a 0.247 0.019 a 0.235 0.016 a 0.247 0.015 a
SATFAM x AGE GROUP -- -- -0.046 0.026 c 0.052 0.028 c -0.005 0.040SATFIN x AGE GROUP -- -- 0.136 0.047 a -0.092 0.049 c -0.186 0.075 a
SATWORK x AGE GROUP -- -- -0.010 0.041 -0.069 0.043 0.176 0.065 a
SATHEALTH x AGE GROUP -- -- -0.005 0.025 0.021 0.027 -0.007 0.035
Dependent Variable Category 1 Cut-point 4.308 0.115 4.295 0.116 4.300 0.115 4.316 0.116Dependent Variable Category 2 Cut-point 7.757 0.132 7.747 0.133 7.752 0.132 7.768 0.132
NChi2
LRPseudo-R2
B. MEN
Variable β S.E. β S.E. β S.E. β S.E.SATFAM 0.387 0.022 a 0.437 0.032 a 0.366 0.026 a 0.377 0.023 a
SATFIN 0.560 0.037 a 0.456 0.057 a 0.597 0.045 a 0.581 0.038 a
SATWORK 0.525 0.034 a 0.496 0.053 a 0.532 0.040 a 0.524 0.035 a
SATHEALTH 0.235 0.023 a 0.247 0.032 a 0.233 0.027 a 0.234 0.024 a
SATFAM x AGE GROUP -- -- -0.090 0.040 b 0.055 0.041 0.170 0.075 b
SATFIN x AGE GROUP -- -- 0.178 0.073 b -0.103 0.076 -0.343 0.149 b
SATWORK x AGE GROUP -- -- 0.034 0.062 -0.032 0.064 -0.062 0.132SATHEALTH x AGE GROUP -- -- -0.011 0.041 0.014 0.042 0.017 0.071
Dependent Variable Category 1 Cut-point 3.936 0.180 3.912 0.181 3.924 0.180 3.917 0.181Dependent Variable Category 2 Cut-point 7.417 0.204 7.401 0.205 7.409 0.205 7.403 0.205
NChi2
LRPseudo-R2
C. WOMEN
Variable β S.E. β S.E. β S.E. β S.E.SATFAM 0.523 0.021 a 0.525 0.028 a 0.502 0.024 a 0.544 0.023 a
SATFIN 0.588 0.031 a 0.535 0.044 a 0.619 0.038 a 0.596 0.034 a
SATWORK 0.481 0.030 a 0.513 0.043 a 0.513 0.035 a 0.440 0.031 a
SATHEALTH 0.249 0.017 a 0.251 0.023 a 0.245 0.020 a 0.255 0.019 a
SATFAM x AGE GROUP -- -- -0.004 0.035 0.067 0.038 c -0.106 0.047 b
SATFIN x AGE GROUP -- -- 0.106 0.061 c -0.089 0.064 -0.111 0.088SATWORK x AGE GROUP -- -- -0.061 0.054 -0.103 0.058 c 0.311 0.076 a
SATHEALTH x AGE GROUP -- -- -0.003 0.033 0.015 0.035 -0.014 0.041
Dependent Variable Category 1 Cut-point 4.644 0.151 4.648 0.153 4.643 0.152 4.694 0.153Dependent Variable Category 2 Cut-point 8.078 0.174 8.083 0.176 8.081 0.175 8.136 0.176
NChi2
LRPseudo-R2
Note: 1973-1994 GSS data employed. First column of each happiness or domain satisfaction variable is the estimated coefficient and the second column is the standard error obtained with STATA's SVY commands and sampling weights. A superscript "a" indicates a 99% confidence level, a "b" indicates a 95% level, and a "c" indicates a 90% level.
1232.81 1223.257,870 7,870 7,870 7,870
1,209.55 1247.01
0.134 0.1340.134
18,814
-15,137 -15,139 -15,1363,189.21-15,145
3219.09 3214.73 3200.99
0.133
18,814 18,814
1. Ages 18-89 (No Interactions)
2. Ages 18-89 (Interactions with Age Group 18-39)
3. Ages 18-89 (Interactions with Age
Group 40-59)
4. Ages 18-89 (Interactions with Age Group 60-89)
18,814
-6,363 -6,354 -6,359 -6,3560.120 0.121 0.120 0.121
10,944 10,944 10,944 10,9442009.78 2012.78 2020.22 2018.6
0.145 0.146 0.146-8,751 -8,748 -9,746 -8,739
1. Ages 18-89 (No Interactions)
2. Ages 18-89 (Interactions with Age Group 18-39)
3. Ages 18-89 (Interactions with Age
Group 40-59)
4. Ages 18-89 (Interactions with Age Group 60-89)
1. Ages 18-89 (No Interactions)
2. Ages 18-89 (Interactions with Age Group 18-39)
3. Ages 18-89 (Interactions with Age
Group 40-59)
4. Ages 18-89 (Interactions with Age Group 60-89)
0.145

Table 5: The “Pure Effect of Age”: Ordered Logit Regression Analysis of Happiness by
Gender Variable
AGE 0.010 0.003 a 0.030 0.012 a -0.008 0.009 AGE SQUARED -- -- -0.0001 0.0001 0.0001 0.0001BIRTH COHORT 0.006 0.003 b 0.015 0.004 a 0.000 0.004 MALE -0.157 0.033 a -- -- -- -- BLACK -0.499 0.056 a -0.302 0.088 a -0.625 0.072 a
< HIGH SCHOOL -0.106 0.033 a -0.027 0.050 -0.176 0.045 a
SATFAM 0.450 0.015 a 0.377 0.022 a 0.519 0.022 a
SATFIN 0.551 0.024 a 0.546 0.037 a 0.554 0.032 a
SATWORK 0.486 0.023 a 0.504 0.035 a 0.468 0.030 a
SATHEALTH 0.252 0.014 a 0.250 0.023 a 0.250 0.017 a
Happiness Category 1 Cut-point 4.712 0.273 5.555 0.460 4.166 0.392 Happiness Category 2 Cut-point 8.183 0.281 9.050 0.472 7.631 0.400
nChi2
Log LikelihoodPseudo R2
Note: 1973-1994 GSS data employed. First column of each population group is the estimated coefficient and the second column is the standard error obtained with STATA's SVY commands and sampling weights. A superscript "a" indicates a 99% confidence level, a "b" indicates a 95% level, and a "c" indicates a 90% level.
10,9442,091.41-8,6930.151
7,8701,239.83-6,2410.123
18,8143,283.10-15,0700.138
All Adults Men Women

Figure 7: The “Pure Effect of Age” on Global Happiness by Gender
2
2.1
2.2
2.3
2.4
2.518 21 24 27 30 33 36 39 42 45 48 51 54 57 60 63 66 69 72 75 78 81 84 87
Women
Men
All Adults
AGE (YEARS)